Abstract
Variability in the Laptev Sea–East Siberian Sea circulation system modulates freshwater circulation in the Arctic Ocean, yet details of these wind-driven mechanisms remain poorly understood. Based on in situ observations from the 2018 Sino-Russian joint Arctic expedition, this study investigates the modulatory influence of wind on circulation structures and freshwater transport in the study area and examines the long-term variation characteristics of this circulation and its inherent connection with the Arctic wind. In situ measurements confirm two freshwater transport pathways: a coastal-current route and a geostrophic slope-current route. As the Beaufort High moves toward the Canadian Basin, it shifts wind patterns from anticyclonic to cyclonic, which regulates the transport of shelf water by influencing the prevailing wind direction. Furthermore, our analysis identifies two main modes of long-term changes in summer surface circulation: the first mode characterizes the coastal-current architecture, while the second mode delineates slope-current configurations. Crucially, large-scale modes of the Arctic wind play an important role in regulating circulation. Its first mode corresponds to the summer anticyclonic circulation pattern of the Arctic Ocean Oscillation, which drives the eastward strengthening of the coastal current, while the third mode presents a mechanism similar to the Arctic Dipole, which promotes the development of the slope current by enhancing the convergence of the polar current and wind. This has led to the long-term strengthening of the slope current.
1. Introduction
The Laptev Sea and East Siberian Sea are the highest-latitude shelf seas globally. The East Siberian Sea is generally 20–50 m deep [,], and its broad continental shelf is the most important submarine permafrost distribution area in the Arctic Ocean []. The Laptev Sea is not only the entrance of the Lena River, which is the main freshwater river in the Arctic Ocean, but it is also an important region for ice formation and brine–water production [,]. The Laptev Sea–East Siberian Sea shelves constitute a major Arctic freshwater reservoir, exhibiting pronounced hydrographic variability driven by seasonal changes in the sea ice. Furthermore, this region forms the upstream core of the Arctic Transpolar Drift, where shelf circulation modifications have significant impacts on the distribution of freshwater, halocline maintenance, and nutrient flux regulation within the Arctic Ocean [,,,].
Studies have shown that pan-Arctic atmospheric modes, such as the Arctic Oscillation (AO) and Arctic Dipole (AD), exert regulatory control over freshwater transport in the Laptev Sea–East Siberian Sea. During the AO-positive phase, cyclonic circulation over the Arctic Ocean prompts eastward freshwater export from the Russian Arctic shelves to the Amerasian Basin, resulting in reduced Eurasian Basin shelf freshwater inputs and degradation of the cold halocline layer []. Conversely, during the AO-negative phase, the prevailing anticyclonic circulation redirects freshwater from the Laptev Sea–East Siberian Sea directly northward into the Eurasian Basin [,,,,,], intensifying upper-ocean stratification in the Eurasian Basin []. Historical records reveal that the cold halocline recession in the 1990s correlated with eastward freshwater displacement, while the northwestward transport pathway shifts in the late 1990s facilitated partial stratification recovery [,]. Research revealed that anomalously high freshwater volumes in the central and northern Laptev Sea during 2008 and 2011 were associated with an increased AD index []. The mechanism involves the AD’s modulation of the Transpolar Drift: positive AD anomalies during summer enhance Sea-Level Pressure (SLP) gradients between the Kara and Beaufort Seas, strengthening wind-driven surface currents from the East Siberian Shelf toward the Fram Strait, thereby amplifying freshwater export. Conversely, negative AD anomalies generate opposing atmospheric circulation patterns that suppress Transpolar Drift development and constrain freshwater transport to the Fram Strait [,].
Recent studies further reveal that localized freshwater transport over the Laptev Sea shelf is mainly governed by regional wind forcing. The Lena River plume typically forms eastward-expanding surface water masses, with its transport dominated by zonal winds: west winds confine the plume to the southern Laptev Sea with eastward transport, while east winds drive its northward expansion [,]. Due to the thin vertical thickness of the freshwater layer, wind sensitivity induces pronounced interannual variability—enhanced west or north winds reduce freshwater coverage through southward Ekman transport, while intensified east winds promote northward freshwater extension []. There is a coupling relationship between salinity and sea-level height in this sea area: summer runoff variations induce sea-surface height anomalies, with the strengthening of west winds correlate with coastal salinity depletion and a rise in sea-levels, while east winds drive southern sea-level depression and offshore low-salinity water export [].
Studies have revealed dispersion patterns of river plumes and the variability in surface freshwater transport under different atmospheric wind patterns in the Laptev Sea [,]. Another study characterized the shelf circulation structure of the East Siberian Sea and its downstream hydrographic impacts []. However, constrained by the scarcity of observational data over the Russian shelf, previous studies have been based on different observation times and currently lack research on freshwater dynamics and circulation regulation mechanisms across the entire shelf of the Laptev Sea–East Siberian Sea. During the summer of 2018, a Sino-Russian joint Arctic expedition conducted hydrological observations in the Laptev Sea–East Siberian Sea. Our study utilizes data collected during this expedition to investigate freshwater transport pathways and the mechanistic role of wind forcing in modulating shelf circulation. Furthermore, our study analyzes the long-term variability characteristics of circulation structure on the Arctic shelf and explores the internal relationship between these changes and the dynamics of the Arctic wind.
2. Data and Methods
2.1. Observational Data from the 2018 Sino-Russian Joint Arctic Expedition
The hydrographic data utilized in this study was mainly acquired during the 2018 Sino-Russian joint Arctic expedition. Conducted aboard the Russian scientific research vessel “Akademik M.A. Lavrentyev”, the expedition initiated from Vladivostok and transited through the Bering Strait to implement systematic hydrographic surveys across the Laptev Sea and the East Siberian Sea. The Sea-Bird 19plus V2 Conductivity–Temperature–Depth profilers (CTD), manufactured by Sea-Bird Scientific (Bellevue, WA, USA), were deployed to collect high-precision vertical profiles at 34 strategically distributed stations (spatial configuration illustrated in Figure 1). The instrument demonstrated a temperature accuracy of ±0.005 °C, a salinity measurement error of <0.005, and vertical resolution of 1 m.
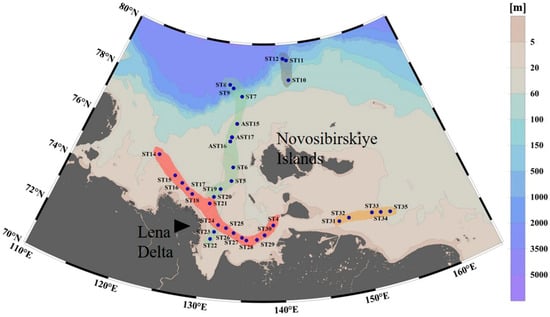
Figure 1.
The distribution of CTD measurement stations in the Laptev Sea during the summer of 2018. Data collection was conducted at each station using an SBE-19plus V2 CTD. The light green, gray, red, and orange areas represent Section 1, Section 2, Section 3 and Section 4, respectively. The background colors indicate bathymetry.
The observational network is mainly distributed across the shallow shelf region of the Laptev Sea (south of 77° N), characterized by average water depths of <50 m, while northern stations (north of 78° N) occupy the shelf-break zone along the 100–500 m isobath gradient. These stations are organized into four hydrographic sections: Section 1 is aligned meridionally along 130° E, traversing from the Lena River delta southward to the shelf-break zone; Section 2 is positioned along the continental slope, deployed in the deep-water area north of the Novosibirskiye Islands; Section 3 exhibits a latitudinal orientation, traversing the central Laptev Sea to the western entrance of the Dmitry Strait; and Section 4 is positioned east of the Dmitry–Laptev Strait, monitoring the hydrodynamic connectivity between the East Siberian Sea and the Laptev Sea.
2.2. Reanalysis Data
The atmospheric reanalysis data used in this study are sourced from the ERA5 reanalysis product released by the European Centre for Medium-Range Weather Forecasts (ECMWF). The analysis specifically focuses on SLP and the 10 m wind field. The spatial resolution of the data is set to a 0.5° × 0.5° grid system. Owing to its fine spatial and temporal resolution and extensive temporal coverage, the ERA5 data is widely used in diverse research. Consequently, this study utilizes ERA5 wind data as the model wind field for analysis.
The Absolute Dynamic Topography (ADT) and geostrophic current data used in this study are sourced from the “Global Ocean Gridded L 4 Sea Surface Heights And Derived Variables Reprocessed 1993 Ongoing” dataset within the Copernicus Climate Change Service (C3S) database. This dataset is calculated based on the twenty-year (1993–2012) average of satellite altimeter observations, with a spatial resolution of 1/8°.
The ocean current–velocity data used in this study are sourced from the GLORYS12V1 product reanalysis dataset of the Copernicus Marine Environment Monitoring Service (CMEMS). This dataset is based on the Nucleus for European Modeling of the Ocean (NEMO) platform and assimilates altimetry data as well as in situ temperature and salinity observations. It has a horizontal resolution of 1/12° and covers the water-depth range of 0–5500 m (divided into 50 unequally spaced vertical layers). A previous study [] has validated the temperature and velocity of this dataset using mooring-observed current–velocity data from the Bering Strait and the continental-slope break of the western Beaufort Sea during the period 2003–2019. The results show that these reanalysis data exhibit good agreement with the observational data.
2.3. Runoff Fraction Calculation Method
This study uses a relative-ratio method to quantify the proportional contribution of freshwater runoff within shelf waters []. The sampled water is composed of three components: seawater, meltwater, and river runoff water. However, the contribution of meltwater remains uncertain due to insufficient knowledge of winter sea-ice formation and regional circulation. Consequently, we postulate that meltwater undergoes previous mixing with shelf-derived saline water, which is characterized by relatively low salinity. The relative contribution of Lena River runoff water within the mixed layer can be determined using the following salinity-based mass balance equation:
where Ss represents the salinity of seawater diluted by meltwater, Sr represents the characteristic salinity of river runoff water, Sobs represents the measured salinity, and fs and fr represent the relative fractions of seawater and diluted river runoff water, respectively. The parameters Ss and Sr are assigned values of 32 and 6.7, respectively, corresponding to the maximum and minimum salinities within the mixed water.
2.4. Finite-Depth Ekman Transport Calculation Method
To investigate the influence of wind on the runoff transport pathways in the Laptev Sea–East Siberian Sea during the summer of 2018, this study calculates wind-driven Ekman transport in the region. Given that the nearshore areas of the study area are mainly shallow (water depths less than the Ekman depth derived from conventional infinite-depth drift formulas), the classical infinite-depth Ekman drift theory is inapplicable. Consequently, the finite-depth Ekman drift formulation is adopted to compute Ekman transport in these nearshore zones []. The governing equations for finite-depth drift include the following momentum and continuity equations:
A left-handed coordinate system is adopted, with the vertical z-axis oriented downward as the positive direction. Assuming that wind stress acts exclusively along the y-direction and remains constant (), the boundary conditions are defined as follows:
By introducing the variable substitution , the governing equations and boundary conditions are transformed into the following form:
By introducing the complex velocity and complex stress , the horizontal velocity solution for finite-depth Ekman drift satisfying the boundary conditions is derived as follows:
where
The horizontal volume transport of finite-depth Ekman drift is derived by vertically integrating the horizontal velocity solution from the seabed () to the surface ():
The real and imaginary parts of the complex transport correspond to the horizontal volume transport components of finite-depth Ekman drift; specifically,
From the above formula, we can determine that Sx is always positive, while Sy is sometimes positive and sometimes negative. The Ekman depth derived from infinite-depth drifting is defined as . When , , and therefore ; when , , therefore ; when , the above equation is simplified as
In this context, the volume transport aligns with that of the infinite-depth drift. Consequently, for nearshore regions of the Laptev Sea–East Siberian Sea with water depths shallower than twice the Ekman depth of the infinite-depth drift, this study employs the finite-depth drift formula to calculate Ekman transport. In contrast, for areas where the water depth exceeds twice the Ekman depth of the infinite-depth drift, the conventional infinite-depth drift formula is utilized. Along coastal boundary zones, the horizontal Ekman transport is designated as 0.
2.5. Vector Empirical Orthogonal Function (EOF) Analysis Method
The traditional EOF method is commonly used to analyze scalar fields like temperature, precipitation, and salinity in meteorology and oceanography. It extracts their primary spatial–temporal patterns through mathematical decomposition. However, wind and ocean current fields are two-dimensional vector fields containing U (east–west direction) and V (north–south direction) components. If EOF decomposition is applied separately to the two components, a key problem arises: the decomposed time-varying weights differ between U and V. This prevents us from combining their spatial modes into a unified vector structure, and thus, further EOF analysis becomes impossible. Therefore, specialized EOF methods for vector fields are essential.
To investigate the long-term spatial–temporal variation patterns of two vector fields—the summer current field in the Laptev Sea–East Siberian Sea and the wind field over the Arctic region—this study adopts the vector EOF method []. This approach integrates the U component matrix and V component matrix into a composite matrix:
In the composite matrix X, the first p rows contain the eastward (U) components at p spatial grid points over q temporal intervals, while the subsequent p rows correspond to the northward (V) components. Then, following the traditional scalar-field EOF method, we perform orthogonal decomposition on the integrated matrix X. The typical spatial-mode fields of U and V derived by this decomposition have the same time coefficient and can therefore be combined into an eigenvector field.
3. Results
3.1. Freshwater Runoff Transport Pathways in the Laptev Sea–East Siberian Sea During the Summer of 2018
Figure 2a,e present the temperature and salinity distributions along Section 1 on the continental shelf. The mixed layer (depth ~12 m) exhibits a temperature exceeding 3 °C from the Lena River estuary to the outer shelf at 77° N, followed by a sharp decrease to ~1.4 °C toward the continental slope (Figure 2b). Concurrently, salinity within the mixed layer increases northward from <7 near the estuary to >31 at the slope, indicating that freshwater is mainly distributed on the shallow inner shelf.
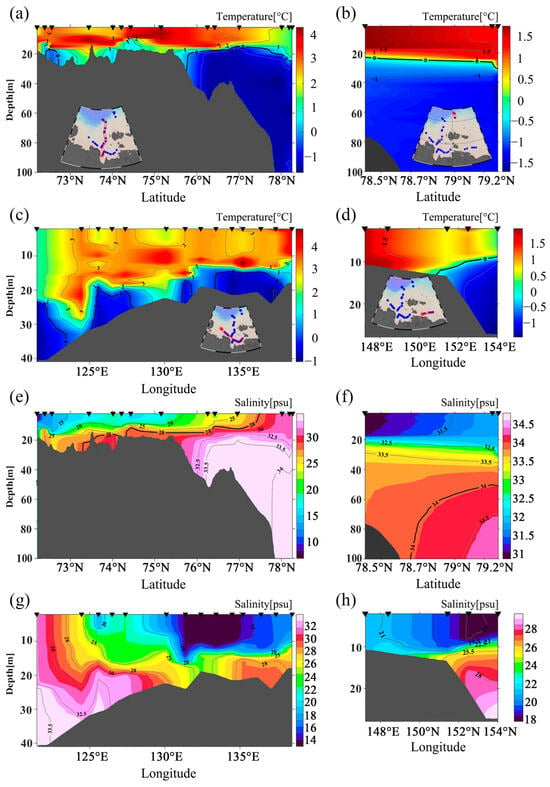
Figure 2.
The temperature and salinity profiles for Section 1, Section 2, Section 3 and Section 4, where (a–d) represent the temperature of Section 1, Section 2, Section 3 and Section 4, and (e–h) represent the salinity of Section 1, Section 2, Section 3 and Section 4. The small maps in (a–d) display the specific geographical locations of Section 1, Section 2, Section 3 and Section 4; the black triangles at the top of each picture indicate the station positions of each section.
Section 3 (Figure 2c,g) shows the temperature and salinity distribution along the inner shelf. The mixed-layer temperature reaches ~3.0 °C and the bottom temperature is close to freezing point. The salinity front is located near 130° E, and the low-salinity water extends eastward from the Laptev Sea to Section 4, located in the East Siberian Sea (Figure 2d,h), providing direct evidence of eastward freshwater transport across the shelf.
To quantitatively analyze the distribution of freshwater runoff on the continental shelf, this study calculated the proportional contribution of freshwater runoff, deriving the runoff fraction results illustrated in Figure 3. West of 124° E in Section 3, the runoff fraction remained below 10%, indicating no westward transport of freshwater runoff. In the eastern nearshore region of the Laptev Sea, the runoff fraction exceeded 70%, while in the East Siberian Sea it persisted above 40%. These findings demonstrate that during the summer of 2018, the Lena River’s freshwater discharge was primarily transported eastward into the East Siberian Sea.
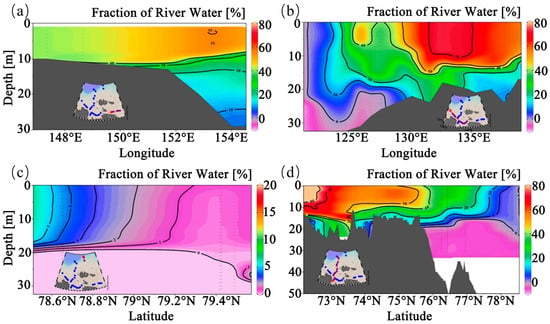
Figure 3.
The proportion of freshwater runoff inside the mixed layer, including (a) Section 4, (b) Section 3, (c) Section 2, and (d) Section 1. The small maps display the specific geographical locations of Section 1, Section 2, Section 3 and Section 4; the black triangles at the top of each picture indicate the station positions of each section.
Additionally, some northward transport of freshwater runoff was observed. While runoff fractions mainly remained around 40% across most shelf regions, our measurements detected a localized runoff fraction approaching 30% at the shelf edge near 77° N. The zonal diffusion of freshwater runoff induced by mixing processes would rapidly reduce the proportion of runoff, leading to the inference that a portion of the high-proportion freshwater runoff must have been transported to the outer shelf through northward currents over the shelf. Temperature and salinity data alone can only provide the general spatial distribution of freshwater runoff; further characterization of transport pathways for Laptev Sea runoff requires the use of reanalysis datasets that include information on wind, current velocity, and sea-surface ADT.
The distribution of ADT and surface currents in the summer of 2018 (Figure 4) substantially contributes to elucidating the transport pathways of runoff water. During the summer of 2018, the sea-surface dynamic height at the Russian inner shelf south of the Novosibirskiye Islands was abnormally high. This elevated sea-surface height generated a clockwise gyre encircling the ADT-maximum area, a feature most pronounced in September and October. In August, the sea-surface dynamic height anomaly along the coastline had not completely formed, and its anomalous center was only located near the coast of the Laptev Sea. This dynamic structure drove a transient reversal of the alongshore current from the East Siberian Sea into the Laptev Sea and formed a distinct northward current along the center of the Laptev Sea shelf, bringing some freshwater runoff into the outer shelf area. Upon entering September and October, with the complete formation of the dynamic height anomaly structure along the coastline of the Laptev Sea–East Siberian Sea, the coastal currents from west to east resumed, facilitating freshwater export from the Laptev Sea to the East Siberian Sea. Moreover, there are two obvious pathways of freshwater transportation: a southern route that enters the East Siberian Sea through the southern strait of the Novosibirskiye Islands along the coast, and a northern route that reaches the northern slope of the Novosibirskiye Islands and then enters the East Siberian Sea southeast. These pathways align closely with the observational results presented in this study, verifying both the eastward and northward transport routes for Laptev Sea freshwater runoff.
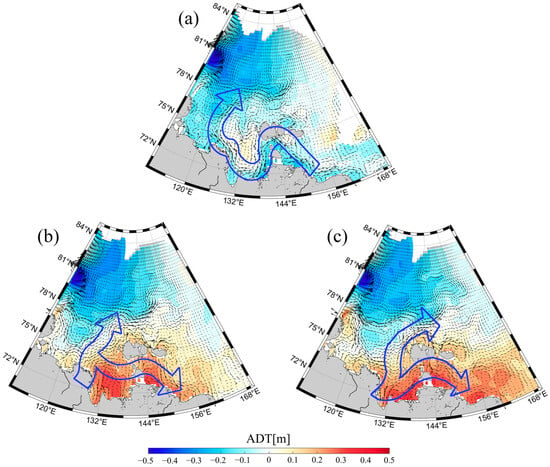
Figure 4.
Monthly average surface-current distribution in the summer of 2018, with ADT distribution denoted by the background color, for (a) August, (b) September, and (c) October. The blue box-shaped arrows in the three pictures are all used to indicate the general direction of ocean currents.
3.2. Modulation of Runoff Transport Pathways by Wind in the Summer of 2018
Our study argues that the phenomenon of the ADT maximum observed near the Laptev Sea–East Siberian Sea coast in the summer of 2018 is due to the influence of wind. During August 2018, the Beaufort High was centered east of the Novosibirskiye Islands, straddling the Laptev Sea–East Siberian Sea. This configuration generated an anticyclonic wind pattern across the region, with prevailing southeast winds over the study area. Wind stress drove the Ekman transport of shelf waters toward the continental slope (Figure 5a,d), preventing shelf-water accumulation. However, from September to October, as the Beaufort High rapidly retreated eastward into the Canada Basin, a low-pressure system from the Eurasian Basin occupied the Kara Sea. Consequently, the wind over the Laptev Sea–East Siberian Sea transitioned to a cyclonic pattern characterized by strong westerly winds along the Laptev Sea–East Siberian Sea coast. These winds drove the accumulation of shelf water toward the coast, resulting in the formation of an ADT maximum in the coastal area (Figure 5b,c,e,f). The maximum ADT distributed along the coastline increased the radial sea-surface height gradient from the inner shelf to the outer shelf, which enhanced the eastward coastal current. This dynamic mechanism played a critical role in facilitating the eastward transport of coastal freshwater runoff into the Canada Basin.
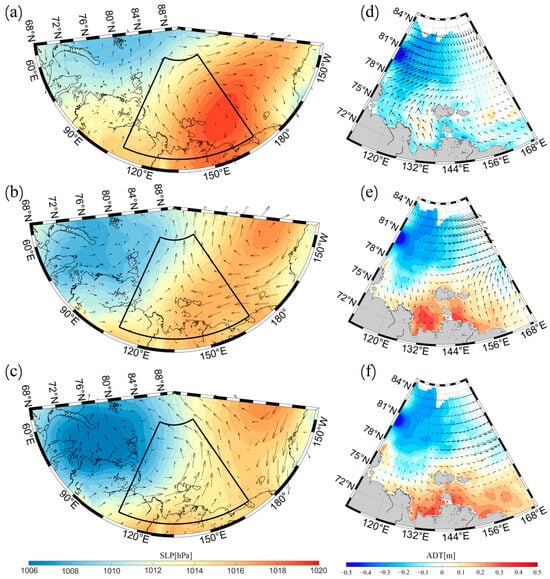
Figure 5.
Monthly average wind in the summer of 2018, with SLP distribution denoted by the background color, for (a) August, (b) September, and (c) October. Ekman transportation, with ADT distribution denoted by background color, for (d) August, (e) September, and (f) October.
Consequently, we infer that the local wind over the Laptev Sea–East Siberian Sea acts as a critical “switchyard” in modulating the distribution of Russian freshwater runoff. When the northern basin is dominated by high-pressure systems, establishing an anticyclonic wind pattern, the prevailing east wind or north wind along the coast drives freshwater transport (primarily from the Lena River) northward into the sea basin. This freshwater is subsequently entrained by the Transpolar Drift and exported from the Eurasian Basin through the Fram Strait (Figure 6a). Conversely, when the low-pressure system from the side of the Eurasian Basin invades the Laptev Sea–East Siberian Sea, a cyclonic wind field induces a prevailing westerly wind near the coast (Figure 6b), which enhances eastward coastal currents through Ekman transport, leading to more freshwater entering the Canadian Basin, where the East Siberian Sea is located.
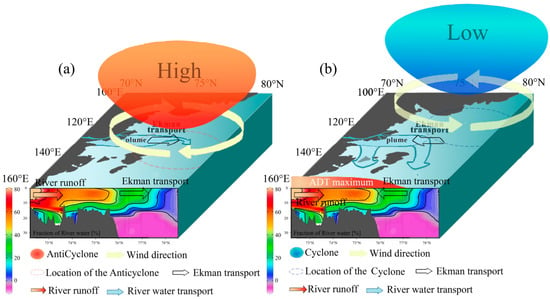
Figure 6.
The variations in Ekman transport near the river estuary and the formation mechanism of the ADT maximum during August–October 2018 in summer. (a) In August, when the Beaufort High center was located over the Novosibirskiye Islands, the prevailing wind over the Laptev Sea blew westward, generating mainly northward Ekman transport. (b) From September to October, as the Beaufort High center moved toward the Canadian Basin, the wind over the Laptev Sea changed from high-pressure to low-pressure dominance, with the prevailing wind turning northeastward. This move induced mainly southward Ekman transport, while increased river runoff introduced additional water to the area. These combined effects led to water accumulation in the region, manifesting as an ADT maximum in the figure.
In addition to the eastward coastal current, a weaker northeastward shelf circulation transports shelf-derived freshwater toward the continental slope north of the Novosibirskiye Islands (Figure 4b,c). Observations reveal, however, that this freshwater pathway is constrained by the steep salinity gradients at the shelf-break zone upon reaching the shelf edge. Consequently, the freshwater largely follows the eastward-flowing circumpolar boundary current along the slope rather than entering the deep basin (Figure 3a and Figure 4). Dynamic height–gradient calculations across transects ST8–ST9 (Section 1) and ST11–ST12 (Section 2) confirm the presence of slope-confined geostrophic currents that restrict freshwater intrusion into the deep basin. In Section 1, geostrophic currents are limited to the upper 80 m, while in Section 2, they extend below 300 m, with maximum relative velocities of ~0.015 m/s (Figure 7a). These findings align with the eastward geostrophic slope current proposed by the previous study []. A reanalysis of the data further corroborates that a northeastward surface geostrophic current persisted in the 77° N–79° N slope region during the summer of 2018 (Figure 7b). Its spatial structure matches observational results: stronger near-surface currents near Section 1 and weaker velocities in Section 2, consistent with the depth-dependent velocity differences (<40 m) inferred from dynamic height gradients.
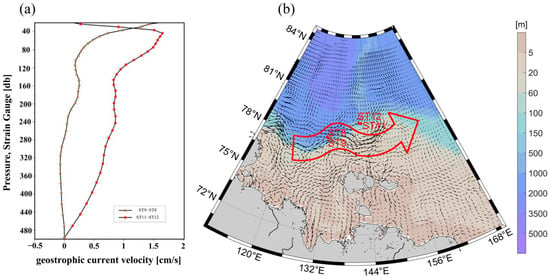
Figure 7.
(a) Geostrophic velocity relative to a depth of 500 dB between stations ST8 and ST9 (brown dots) in Section 1 and stations ST12 and ST11 (red dots) in Section 2; (b) the average surface geostrophic current–velocity distribution from July to October 2018, with water depth denoted by background color and red dots representing the ST8 and ST9 stations in Section 1 and the ST12 and ST11 stations in Section 2. The red box-shaped arrow in (b) indicates the general direction of the geostrophic current.
3.3. The Long-Term Spatial–Temporal Distribution Characteristics of Surface Circulation in the Laptev Sea–East Siberian Sea
As illustrated in Section 3.2, there are two principal transport pathways for freshwater runoff from the Laptev Sea to the East Siberian Sea: a coastal eastward route traversing through straits into the East Siberian Sea, and a northern route that, upon reaching the continental-slope region, subsequently follows the shelf edge eastward under geostrophic current forcing. The scarcity of in situ observational data in the Laptev Sea–East Siberian Sea, particularly the absence of direct velocity measurements, poses significant challenges to elucidating the structural characteristics of regional circulation patterns. To address these observational limitations, this study employs satellite-derived Arctic circulation datasets (GLORYS12V1) retrieved through remote sensing inversion techniques, enabling a comprehensive investigation into the spatial–temporal distribution characteristics of surface-current variability within this marine domain over a 23-year period (1998–2020).
Figure 8a,c illustrate the spatial characteristics of the two dominant EOF modes for summer (July–September) surface circulation in the Laptev Sea–East Siberian Sea. The first mode exhibits a coastal-current structure extending from the Laptev Sea through straits to the East Siberian Sea, delineating the principal water-exchange pathway between these two sea areas. The second mode manifests as a westward-to-eastward slope current along the Laptev Sea continental margin and as southward currents over the Lomonosov Ridge, demonstrating topographic vorticity constraints on the circulation orientation. This pattern shows a stable eastward transport channel at the shelf break. The variance contribution rates of these dominant modes reach 27.2% and 14.4%, respectively, collectively governing the summer surface-circulation dynamics and driving the west-to-east water transport from the Laptev Sea to the East Siberian Sea. These two circulation models are very consistent with the circulation structure of Laptev Sea–East Siberian Sea area in the summer of 2018, as discussed in Section 3.2 of this paper. The third mode, with a marginal contribution rate of 8.3%, is excluded from further discussion due to its limited physical significance.
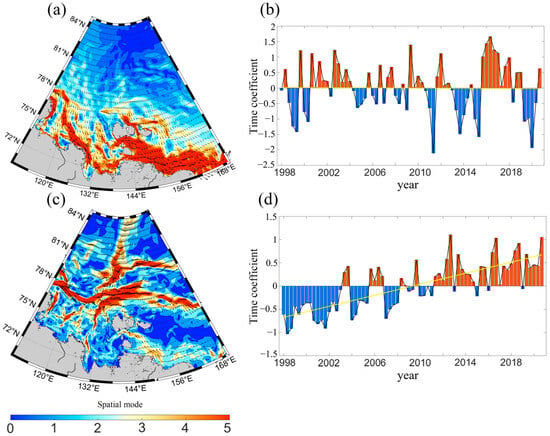
Figure 8.
Spatial modes and temporal coefficients of summer (1998–2020) surface-circulation dynamics in the Laptev Sea–East Siberian Sea derived from vector EOF analysis. Panels (a,b) illustrate the spatial pattern and corresponding temporal coefficient series of the first EOF mode, respectively, while panels (c,d) depict those of the second EOF mode.
Figure 8b,d demonstrate that the temporal coefficient curves of the dominant EOF modes for summer circulation in the Laptev Sea–East Siberian Sea exhibit significant oscillatory variations. The first principal mode displays frequent positive–negative phase transitions with non-stationary fluctuation characteristics, accompanied by slightly increased amplitudes over time. However, no statistically significant long-term trend is observed, as the temporal coefficients mainly oscillate around the zero baseline. Combined spatial analysis (Figure 9a,b) reveals that positive phases correspond to west-to-east coastal-current transport (from the Laptev Sea to the East Siberian Sea), while negative phases manifest a current reversal, with east-to-west directional anomalies.
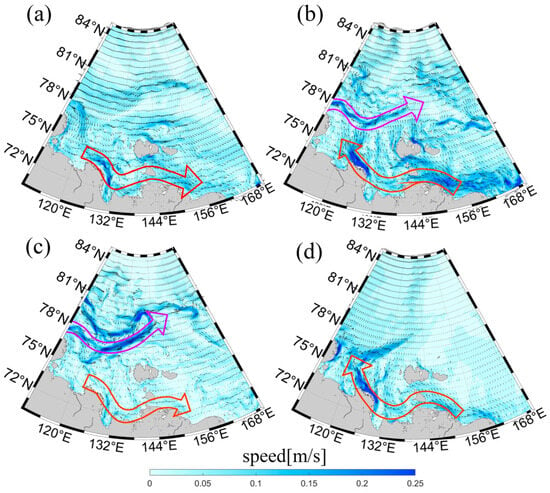
Figure 9.
The spatial distribution of surface circulation, where (a) is the current field in July 2016, corresponding to the positive phase of the first mode and the negative phase of the second mode; (b) is the flow field in July 2020, corresponding to the negative phase of the first mode and the positive phase of the second mode; (c) is the flow field in September 2011, corresponding to the positive phase of the first mode and the positive phase of the second mode; and (d) is the flow field in July 1999, corresponding to the negative phase of the first mode and the negative phase of the second mode. The red arrow in the figure indicates the direction of nearshore currents, while the purple arrow indicates the direction of the slope current.
The temporal coefficients of the second EOF mode exhibit pronounced positive–negative phase-transition trends: the second mode was dominated by the negative phase before 2003, alternates between positive and negative from 2003 to 2008, and was then dominated by the positive phase after 2008. During the negative phase, the slope-current intensity weakened, with no significant current formation observed near 77° N on the Laptev Sea continental slope (Figure 9d). As the phase shifted to positive, the slope current notably strengthened along the shelf edge and slope regions (Figure 9c). Decadal averaged velocity variations from 1998 to 2020 (Figure 10) reveal a distinct enhancement trend in current velocities near the Laptev Sea slope, particularly during the 2011–2020 positive-phase dominant period, when the slope current accelerated by 15–20%. This continuous enhancement of the slope current will also form a barrier for the direct transport of freshwater from the continental shelf to the ocean basin, redirecting more freshwater into the Canadian Basin rather than the Eurasian Basin. Over the long term, this trend may lead to a decrease in the halocline intensity in the Eurasian Basin, facilitating increased upward heat flux from Atlantic-origin intermediate waters and exacerbating the melting of sea ice at the bottom.
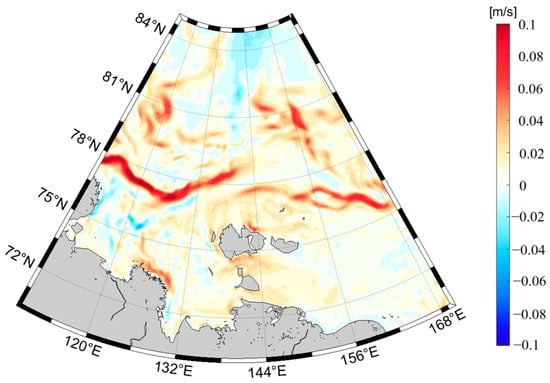
Figure 10.
Average surface velocity change per decade in the Laptev Sea–East Siberian Sea during the summer of 1998–2020.
3.4. Spatial–Temporal Variability of Arctic Sea-Surface Winds and Their Impacts on the Surface-Circulation Structure
Arctic atmospheric forcing exerts significant regulation on pan-Arctic circulation patterns. To further reveal the intrinsic relationship between Laptev Sea–East Siberian Sea circulation structures and Arctic winds, this study conducted a vector EOF decomposition of Arctic sea-surface winds. The spatial distribution of the primary mode (Figure 11a) exhibits strong congruence with the Arctic Ocean Oscillation (AOO), characterized mainly by the summer anticyclonic circulation pattern []. The AOO index is constructed using a shallow-water positive-pressure-coupled ice-ocean model. By quantifying the wind-driven sea-level height variations in the central Arctic, it provides a superior characterization of local wind-stress forcing mechanisms on circulation compared with the North Atlantic Oscillation and AO. Observations from the Beaufort Gyre Exploration Project reveal persistent positive-phase AOO dominance since 1998, corresponding to the anticyclonic wind dominated by the high pressure in the Arctic. This situation has led to the eastward shift in the North Atlantic cyclone path and a decrease in the frequency of cyclone events entering the central Arctic core region.
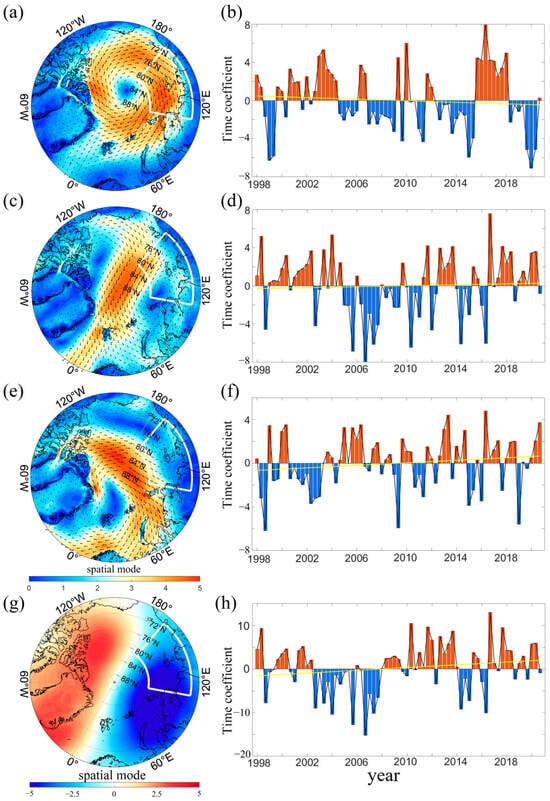
Figure 11.
Illustration of the spatial-mode distributions and temporal coefficients of summer Arctic sea-surface winds derived from vector EOF analysis during 1998–2020, with panels (a,b) representing the spatial pattern and temporal coefficient of the first EOF mode, (c,d) representing the second mode, and (e,f) representing the third mode. And (g,h) representing the spatial pattern and temporal coefficient of AD. White dashed rectangles demarcate the geographical extent of the Laptev Sea–East Siberian Sea region.
The three dominant EOF modes of Arctic sea-surface wind exhibit variance contributions of 23.3%, 22.7%, and 13.2%, respectively. As previously mentioned, the first mode (Figure 11a) corresponds to the anticyclonic AOO pattern, characterized by anomalously low anticyclonic circulation intensity near 85° N and 180° and high-intensity anomalies over the Eurasian Basin (particularly north of the Laptev Sea). This configuration induces a prevailing east wind that dominates across the Laptev Sea–East Siberian Sea. The second mode shows a meridional transpolar structure, featuring an anomalous high-pressure center in the central Arctic that drives cold air southward across the center of the Arctic into the Fram Strait. The third mode (Figure 11e) demonstrates wind-driven cold air traveling from the Arctic regions of Canada into the Barents Sea and Fram Strait. The driving effect of this wind-related spatial mode corresponds to the mechanism determining influence in the AD [,]. The AD modulates the intensity of the Beaufort Gyre and Transpolar Drift, and Transpolar Drift is the critical pathway governing freshwater and sea-ice export from the Laptev Sea to the East Siberian Sea. Consequently, this study derived AD spatial patterns and temporal coefficients from the summers of 1998–2020 using SLP data (Figure 11g,h). The AD configuration exhibits an anomalous high-pressure system over the Arctic regions of Canada coupled with low pressure over northern Eurasia, generating meridional winds that enhance the water transport from the Pacific Ocean to the Atlantic Ocean.
The positive-phase manifestation of the first EOF mode in Arctic sea-surface wind (Figure 11a,b) corresponds to enhanced anticyclonic circulation under the AOO pattern. At this point in time, the abnormally high spatial distribution area corresponds to the trend of significant enhancement in wind intensity. As established in preceding analyses, persistent positive-phase AOO dominance characterizes the study period (1998–2020). Figure 12 quantifies the decadal mean 10m wind-speed trends across the Eurasian Basin. It can be seen that the wind speed in the Laptev Sea–East Siberian Sea region has significantly increased, and the wind speed in the north has weakened, which is consistent with the spatial characteristics of the first EOF mode. Table 1 presents the correlation between temporal coefficients of dominant EOF modes regarding wind and surface circulation. The first surface-circulation mode demonstrates significant correlation with the primary wind mode (r = 0.76, p < 0.01) while exhibiting no meaningful associations with the latter two modes. This indicates that the coastal currents in the study area are highly correlated with the AOO-type distribution of Arctic sea-surface wind field modes, and the correlation is much greater than the latter two modes. During the positive AOO phase, a prevailing east wind over the Laptev Sea–East Siberian Sea enhances the eastward coastal-current intensity through Ekman transport. Conversely, the negative phase triggers west-wind dominance that induces hydrodynamic pattern reversal.
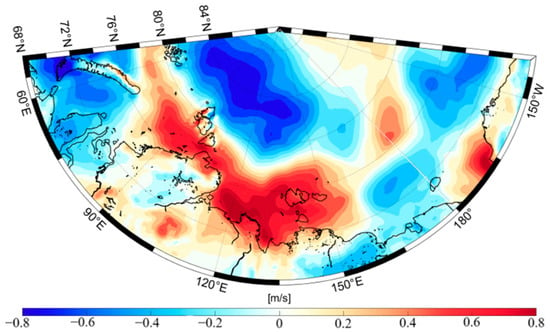
Figure 12.
Average sea-surface changes in wind speed per decade in the Eurasian Basin region during the summers of 1998–2020.

Table 1.
The correlations of dominant-mode time coefficients between surface-circulation motion and sea-surface wind.
The spatial–temporal characteristics of the AD during the study period (Figure 11g,h) reveal sustained positive-phase dominance since 2008, featuring a Beaufort High located in the Arctic regions of Canada and the center of the low pressure located in the Arctic regions of Siberia. This temporal change is basically consistent with the 2008 shift in the surface circulation’s second EOF mode from a negative to a positive phase, corresponding to a significant increase in the slope-current system. Statistically, correlations emerge between AD and the second circulation mode (r = 0.33, p < 0.05), while the third Arctic-wind EOF mode also exhibits correlation with this circulation mode (r = 0.39, p < 0.05). These findings collectively demonstrate mechanistic coupling between long-term slope-current enhancement and AD-type atmospheric forcing. During the positive AD phase, the atmospheric circulation drives wind patterns from the Arctic regions of Canada toward the Barents Sea and Fram Strait, establishing northeast wind dominance along the Laptev Sea–East Siberian Sea slope (Figure 11e,f). These northeast winds enhance water convergence toward the continental slope, increasing the sea-surface height gradient and thereby enhancing the slope current. Additionally, the steep submarine topography of the Laptev Sea slope has a guiding effect on Transpolar Drift branches: during the AD-positive phase, Transpolar Drift strengthens, and its branch deflects southward along the Lomonosov Ridge, forming a relay transport with the slope current, thereby enhancing the slope current.
4. Discussion and Conclusions
Based on 2018 Sino-Russian joint Arctic expedition data, this study characterizes the detailed transport pathways of freshwater runoff across the Laptev Sea–East Siberian Sea shelf and reveals wind-driven modulation of shelf circulation dynamics. Furthermore, oceanic–atmospheric reanalysis datasets reveal the interannual variability of shelf-slope circulation systems, clarifying the physical mechanisms by which Arctic winds regulate shelf-water transport through Ekman transport.
While previous studies have resolved wind-responsive dynamics of plume dispersion over Russian Arctic shelves [,,], there is still limited research on the specific transport pathways of runoff water from the continental shelf to the deep-sea basin, especially around the transport patterns in the Laptev Sea–East Siberian Sea. Our study identifies two dominant export pathways: a shallow coastal current (a primary pathway contributing >70% of freshwater flux into the Laptev Sea and maintaining >40% flux into the East Siberian Sea) and a deep geostrophic slope current (transporting ~30% of the freshwater to the northern shelf break at 77° N). In August 2018, ADT and surface-current analyses demonstrate a clockwise gyre around the ADT maxima driving northward shelf-to-slope freshwater transport. In September and October, the shelf circulation turned northeast, and the runoff water mainly flowed eastward along the coast into the East Siberian Sea.
This study indicates that changes in the continental shelf circulation structure, represented by runoff water transport, are mainly influenced by the wind. The wind affects the sea-surface height in the study area through Ekman transport, thereby governing circulation patterns and freshwater pathways. The runoff transport pathways in the study area are regulated by the evolution of the wind controlled by the migration of the Beaufort High. In the summer of 2018, the center of the Beaufort High moved northeast into the Canadian Basin, causing a structural change in the wind in the Laptev Sea–East Siberian Sea: an east wind prevailed in August, but this turned into a west wind after September and October. Due to the changes in wind, the Ekman transport direction on the continental shelf has also been adjusted accordingly: in August, when the east wind dominates, Ekman transport moves northward, which promotes runoff diffusion; in September and October, the strengthened westerly wind drives the Ekman transport in a southern direction, which prevents the offshore expansion of runoff water, resulting in a dynamic height maximum near the Lena Delta and further inducing local clockwise circulation.
Using data from a reanalysis of the ocean and atmosphere, this article also analyzed the long-term variation characteristics of surface circulation in the Laptev Sea–East Siberian Sea. It was found that the first mode of the surface circulation reflects the water-exchange pathway dominated by coastal currents between the two sea areas, and the second mode reflects the slope current and the currents along the Lomonosov Ridge, revealing the guiding role of the continental-slope topography on the circulation. Temporal coefficient analysis shows that the second mode has a significant negative-to-positive phase-transition trend, indicating that the intensity of the slope current in the study area demonstrates a gradually increasing trend. Slope current constitutes an important component of the Arctic circumpolar boundary current and the main pathway for Atlantic water to enter the Arctic Ocean. The trend it exhibits of intensifying over the long term may be related to the ongoing process of Atlanticization in the Arctic Ocean; further related research is needed to elucidate this.
The spatial–temporal distribution of large-scale sea-surface wind in the Arctic has important implications for the long-term variability of surface circulation within the study area. The first EOF mode of Arctic wind corresponds closely with the AOO, which is mainly represented by the anticyclonic circulation pattern in summer. During the AOO-positive phase, high-pressure dominance sustains anticyclonic wind forcing. The coastal-current mode (the first mode of surface circulation) in summer is highly correlated with the first mode of the Arctic wind (r = 0.76). The AOO mode drives the eastward strengthening of coastal currents through Ekman transport.
In addition, the third EOF mode of the Arctic wind shows wind-driven cold air from the Arctic regions of Canada into the Barents Sea and Fram Strait, similar to the mechanism determining the influence of the AD. The slope-current mode (the third mode of surface circulation) correlates with the AD (r = 0.33) and the third mode of the Arctic wind (r = 0.39). During the positive phase of the AD, a northeast wind forms in the Laptev Sea–East Siberian Sea continental-slope region. This wind drives the water to converge toward the continental slope, increasing the sea-surface height gradient and thereby enhancing the slope current. At the same time, Transpolar Drift branches are diverted southward by the terrain, enhancing the transport of slope currents. The spatial–temporal distribution of the AD shows that it has been in a generally positive phase since 2008, which is consistent with previous research results []; this is basically consistent with both the phase shift (negative to positive) in the second surface-circulation EOF mode and the slope current significantly increasing. The above results indicate that the long-term trend of enhancement in the slope current is closely related to the AD-type driving mechanism represented by the third mode of the wind field.
Author Contributions
Conceptualization, X.L., Y.W. and X.W.; methodology, X.L., Y.W. and X.W.; validation, X.L. and X.W.; investigation, Y.W. and X.W.; writing—original draft preparation, X.L. All authors have read and agreed to the published version of the manuscript.
Funding
This research was funded by the National Natural Science Foundation of China (grant numbers 42276248 and 42176235).
Institutional Review Board Statement
Not applicable.
Informed Consent Statement
Not applicable.
Data Availability Statement
The CTD data analyzed in this study can be obtained at the following website: https://doi.org/10.5281/zenodo.15771792 (accessed on 30 June 2025). Atmospheric reanalysis data from the ERA5 product are available at the Copernicus Climate Change Service (C3S) Climate Data Store: https://cds.climate.copernicus.eu/datasets/reanalysis-era5-single-levels-monthly-means (accessed on 22 April 2024). Absolute dynamic topography and geostrophic current data are available at the following website: https://data.marine.copernicus.eu/product/SEALEVEL_GLO_PHY_L4_MY_008_047 (accessed on 24 January 2024). Ocean current–velocity data are available at the following website: https://data.marine.copernicus.eu/product/GLOBAL_MULTIYEAR_PHY_001_030 (accessed on 11 March 2024).
Acknowledgments
The authors would like to thank the crew of the Russian R/V Akademik M. A. Lavrentyev and the Chinese R/V Xuelong for their excellent work. The authors also thank the European Centre for Medium-Range Weather Forecasts for access to the ERA5 reanalysis data and the Copernicus Marine Environment Monitoring Service (CMEMS) for access to the Global Ocean Physics Reanalysis product and the surface geostrophic current data.
Conflicts of Interest
The authors declare that they have no relevant financial or non-financial conflicts of interest to disclose.
Abbreviations
The following abbreviations are used in this manuscript:
| AO | Arctic Oscillation |
| AD | Arctic Dipole |
| CTD | Conductivity–Temperature–Depth profiler |
| EOF | Empirical Orthogonal Function |
| ADT | Absolute Dynamic Topography |
| SLP | Sea-Level Pressure |
| AOO | Arctic Ocean Oscillation |
References
- Bauch, D.; Hölemann, J.; Willmes, S.; Gröger, A.; Novikhin, A.; Nikulina, H.; Kassens, L.T. Changes in distribution of brine waters on the Laptev Sea shelf in 2007. J. Geophys. Res. Ocean. 2010, 115, C11008. [Google Scholar] [CrossRef]
- Dmitrenko, I.A.; Kirillov, S.A.; Tremblay, L.B.; Bauch, D.; Hölemann, J.A.; Krumpen, T.; Kassens, H.; Wegner, C.; Heinemann, G.; Schröder, D. Impact of the Arctic Ocean Atlantic water layer on Siberian shelf hydrography. J. Geophys. Res. Ocean. 2010, 115, 1–17. [Google Scholar] [CrossRef]
- Létolle, R.; Martin, J.M.; Thomas, A.J.; Gordeev, V.V.; Gusarova, S.; Sidorov, I.S. 18O abundance and dissolved silicate in the Lena delta and Laptev Sea (Russia). Mar. Chem. 1993, 43, 47–64. [Google Scholar] [CrossRef]
- Bareiss, J.; Goergen, K. Spatial and temporal variability of sea ice in the Laptev Sea: Analyses and review of satellite passive-microwave data and model results, 1979 to 2002. Glob. Planet Change 2005, 48, 28–54. [Google Scholar] [CrossRef]
- Dmitrenko, I.A.; Kirillov, S.A.; Tremblay, L.B.; Bauch, D.; Willmes, S. Sea-ice production over the Laptev Sea shelf inferred from historical summer-to-winter hydrographic observations of 1960s–1990s. Geophys. Res. Lett. 2009, 36, L13605. [Google Scholar] [CrossRef]
- Aagaard, K.; Coachman, L.K.; Carmack, E. On the halocline of the Arctic Ocean. Deep Sea Res. Part A Oceanogr. Res. Pap. 1981, 28, 529–545. [Google Scholar] [CrossRef]
- Bauch, D.; Dmitrenko, I.A.; Wegner, C.; Hölemann, J.; Kirillov, S.A.; Timokhov, L.A.; Kassens, H. Exchange of Laptev Sea and Arctic Ocean halocline waters in response to atmospheric forcing. J. Geophys. Res. Ocean. 2009, 114, C05008. [Google Scholar] [CrossRef]
- Johnson, M.A.; Polyakov, I.V. The Laptev Sea as a source for recent Arctic Ocean salinity changes. Geophys. Res. Lett. 2001, 28, 2017–2020. [Google Scholar] [CrossRef]
- Morison, J.; Kwok, R.; Peralta-Ferriz, C.; Alkire, M.; Rigor, I.; Andersen, R.; Steele, M. Changing Arctic Ocean freshwater pathways. Nature 2012, 481, 66–70. [Google Scholar] [CrossRef]
- Steele, M.; Boyd, T. Retreat of the cold halocline layer in the Arctic Ocean. J. Geophys. Res. Ocean. 1998, 103, 10419–10435. [Google Scholar] [CrossRef]
- Aagaard, K.; Swift, J.H.; Carmack, E.C. Thermohaline circulation in the Arctic Mediterranean Seas. J. Geophys. Res. Ocean. 1985, 90, 4833–4846. [Google Scholar] [CrossRef]
- Dmitrenko, I.; Kirillov, S.; Eicken, H.; Markova, N. Wind-driven summer surface hydrography of the eastern Siberian shelf. Geophys. Res. Lett. 2005, 32, L14613. [Google Scholar] [CrossRef]
- Dmitrenko, I.A.; Kirillov, S.A.; Tremblay, L.B. The long-term and interannual variability of summer fresh water storage over the eastern Siberian shelf: Implication for climatic change. J. Geophys. Res. Ocean. 2008, 113, C03007. [Google Scholar] [CrossRef]
- Guay, C.K.H.; Falkner, K.K.; Muench, R.D.; Mensch, M.; Frank, M.; Bayer, R. Wind-driven transport pathways for Eurasian Arctic river discharge. J. Geophys. Res. Ocean. 2001, 106, 11469–11480. [Google Scholar] [CrossRef]
- Maslowski, W.; Newton, B.; Schlosser, P.; Semtner, A.; Martinson, D. Modeling recent climate variability in the Arctic Ocean. Geophys. Res. Lett. 2000, 27, 3743–3746. [Google Scholar] [CrossRef]
- Maslowski, W.; Marble, D.C.; Walczowski, W.; Semtner, A.J. On large-scale shifts in the Arctic Ocean and sea-ice conditions during 1979–98. Ann. Glaciol. 2001, 33, 545–550. [Google Scholar] [CrossRef]
- Bauch, D.; Dmitrenko, I.A.; Kirillov, S.; Wegner, C.; Hölemann, J.; Pivovarov, S.; Timokhov, L.; Kassens, H. Eurasian Arctic shelf hydrography: Exchange and residence time of southern Laptev Sea waters. Cont. Shelf Res. 2009, 29, 1815–1820. [Google Scholar] [CrossRef]
- Björk, G.; Söderkvist, J. Dependence of the Arctic Ocean ice thickness distribution on the poleward energy flux in the atmosphere. J. Geophys. Res. Ocean. 2002, 107, 37-1–37-17. [Google Scholar] [CrossRef]
- Overland, J.E.; Francis, J.A.; Hanna, E.; Wang, M. The recent shift in early summer Arctic atmospheric circulation. Geophys. Res. Lett. 2012, 39, L19804. [Google Scholar] [CrossRef]
- Wang, J.; Zhang, J.; Watanabe, E.; Ikeda, M.; Mizobata, K.; Walsh, J.E.; Bai, X.; Wu, B. Is the Dipole Anomaly a major driver to record lows in Arctic summer sea ice extent? Geophys. Res. Lett. 2009, 36, L05706. [Google Scholar] [CrossRef]
- Wu, B.; Wang, J.; Walsh, J.E. Dipole anomaly in the winter Arctic atmosphere and itsassociation with sea ice motion. J. Clim. 2006, 19, 210–225. [Google Scholar] [CrossRef]
- Hudson, P.A.; Martin, A.C.H.; Josey, S.A.; Marzocchi, A.; Angeloudis, A. Drivers of Laptev Sea interannual variability in salinity and temperature. Ocean Sci. 2024, 20, 341–367. [Google Scholar] [CrossRef]
- Osadchiev, A.A.; Pisareva, M.N.; Spivak, E.A.; Semiletov, I.P. Freshwater transport between the Kara, Laptev, and East-Siberian seas. Sci. Rep. 2020, 10, 13041. [Google Scholar] [CrossRef]
- Osadchiev, A.; Frey, D.; Spivak, E.; Shchuka, S.; Tilinina, N.; Semiletov, I. Structure and inter-annual variability of the freshened surface layer in the Laptev and East-Siberian seas during ice-free periods. Front. Mar. Sci. 2021, 8, 735011. [Google Scholar] [CrossRef]
- Andreev, A.G.; Pipko, I.I. Variations in sea level and geostrophic currents in the East Siberian Sea and Laptev Sea under the influence of wind and runoff of the Lena River. Izv. Atmos. Ocean. Phys. 2022, 58, 1028–1036. [Google Scholar] [CrossRef]
- Wang, X.; Zhao, J.; Lobanov, V.B.; Kaplunenko, D.; Rudykh, Y.N.; He, Y.; Chen, X. Distribution and Transport of Water Masses in the East Siberian Sea and Their Impacts on the Arctic Halocline. J. Geophys. Res. Ocean. 2021, 126, e2020JC016523. [Google Scholar] [CrossRef]
- Lin, P.; Pickart, R.S.; Heorton, H.; Tsamados, M.; Itoh, M.; Kikuchi, T. Recent state transition of the Arctic Ocean’s Beaufort Gyre. Nat. Geosci. 2023, 16, 485–491. [Google Scholar] [CrossRef]
- Ekwurzel, B.; Schlosser, P.; Mortlock, R.A.; Fairbanks, R.G.; Swift, J.H. River runoff, sea ice meltwater, and Pacific water distribution and mean residence times in the Arctic Ocean. J. Geophys. Res. Ocean. 2001, 106, 9075–9092. [Google Scholar] [CrossRef]
- Lewis, D.M.; Belcher, S.E. Time-dependent, coupled, Ekman boundary layer solutions incorporating Stokes drift. Dynam. Atmos. Oceans 2004, 37, 313–351. [Google Scholar] [CrossRef]
- Hardy, D.M.; Walton, J.J. Principal Components Analysis of Vector Wind Measurements. J. Appl. Meteorol. Clim. 1978, 17, 1153–1162. [Google Scholar] [CrossRef]
- Zhao, J.; Wang, W.; Kang, S.H.; Yang, E.; Kim, T. Optical properties in waters around the Mendeleev Ridge related to the physical features of water masses. Deep. Sea Res. Part II Top. Stud. Oceanogr. 2015, 120, 43–51. [Google Scholar] [CrossRef]
- Proshutinsky, A.Y.; Johnson, M.A. Two circulation regimes of the wind-driven Arctic Ocean. J. Geophys. Res. Ocean. 1997, 102, 12493–12514. [Google Scholar] [CrossRef]
- Polyakov, I.V.; Ingvaldsen, R.B.; Pnyushkov, A.V.; Bhatt, U.S.; Francis, J.A.; Janout, M.; Kwok, R.; Skagseth, Ø. Fluctuating Atlantic inflows modulate Arctic atlantification. Science 2023, 381, 972–979. [Google Scholar] [CrossRef] [PubMed]
Disclaimer/Publisher’s Note: The statements, opinions and data contained in all publications are solely those of the individual author(s) and contributor(s) and not of MDPI and/or the editor(s). MDPI and/or the editor(s) disclaim responsibility for any injury to people or property resulting from any ideas, methods, instructions or products referred to in the content. |
© 2025 by the authors. Licensee MDPI, Basel, Switzerland. This article is an open access article distributed under the terms and conditions of the Creative Commons Attribution (CC BY) license (https://creativecommons.org/licenses/by/4.0/).