Article

Dendroclimatic Reconstruction of Seasonal Precipitation from Two Endangered Spruce Species in Northeastern Mexico

by
Christian Wehenkel
1,
Oscar A. Díaz-Carrillo
1 and
Jose Villanueva-Díaz
2,*
1
Instituto de Silvicultura e Industria de la Madera, Universidad Juárez del Estado de Durango, Constitución 404 sur. Zona Centro, Durango 34000, Durango, Mexico
2
Instituto Nacional de Investigaciones Forestales Agrícolas y Pecuarias, Centro Nacional de Investigación Disciplinaria Relación Agua-Suelo-Planta Atmósfera (INIFAP-CENID-RASPA), Margen Derecha del Canal Sacramento km 6.5, Gómez Palacio 35140, Durango, Mexico
*
Author to whom correspondence should be addressed.
Atmosphere 2025, 16(7), 863; https://doi.org/10.3390/atmos16070863
Submission received: 18 June 2025 / Revised: 9 July 2025 / Accepted: 13 July 2025 / Published: 15 July 2025
(This article belongs to the Special Issue Forest Ecosystems in a Changing Climate)

Abstract

Water availability is a major constraint on socioeconomic development in northeastern Mexico, highlighting the need for effective water resource planning that accounts for the variability and extremes of precipitation. In this study, seasonal precipitation reconstructions were developed using tree-ring chronologies from spruce species (Picea spp.). A representative chronology for Picea mexicana Martínez was developed from two populations and spans the period 1786–2020, while a chronology for Picea martinezii T.F. Patterson was established from three populations covering 1746–2020. Both species exhibited significant positive correlations with January–May precipitation (r = 0.65 and 0.71, respectively; p < 0.01) and negative correlations with maximum temperature over the same period (r = −0.52 and −0.59, respectively). Two January–May precipitation reconstructions were produced for periods with adequate sample depth (EPS > 0.85): 1851–2020 for P. mexicana and 1821–2020 for P. martinezii. Both reconstructions revealed pronounced interannual variability, with recurrent droughts and persistently dry conditions, particularly evident in the P. mexicana series. Spatial correlation analyses indicated a historical link between reconstructed precipitation and the El Niño–Southern Oscillation (ENSO). These results highlight the value of spruce species for dendroclimatic reconstruction and their sensitivity to precipitation variability, especially as rising maximum temperatures may compromise their persistence in the Sierra Madre Oriental.

1. Introduction

Understanding climate variability has become increasingly important, as the frequency, extent, and severity of drought events continue to rise [1]. The environmental and social impacts associated with drought are also becoming more complex; for instance, conflicts among water users and disputes between political entities and even countries are expected to become more frequent [2].
Mexico is particularly vulnerable to drought, as arid and semi-arid regions cover approximately half of its territory [3]. During the 20th and 21st centuries, total precipitation levels have fluctuated significantly, leading to severe socioeconomic crises [4,5]. Northeastern Mexico is among the regions most affected by drought, especially in large urban settlements such as Monterrey, Saltillo, and Ciudad Victoria, which collectively host a population of over six million people.
In this context, water availability represents a major constraint to socioeconomic development [6]. Given these circumstances, there is an evident need for proper water resource planning that accounts for the range and variability of precipitation. Hydroclimatic reconstructions are therefore important for understanding long-term precipitation trends and improving future projections, which currently suggest that northeastern Mexico will become increasingly drier [7]. In this regard, tree rings serve as environmental indicators that record temporal variations and have proven valuable for reconstructing past climate variability far beyond the reach of instrumental records [8].
In Mexico, three rare and endemic spruce species have been included in the red list as protected: P. chihuahuana, P. martinezii, and P. mexicana. These species occur in small and isolated populations of temperate and montane-mixed conifer forests in the Sierra Madre Oriental and Sierra Madre Occidental [9,10]. These populations are currently in decline due to the combined effects of drought, fire, insect outbreaks, and land-use changes. If this trend continues, their extinction in the near future is a real potential [11,12]. Their demonstrated sensitivity to winter precipitation (January–May), combined with their longevity and distinctive annual ring structure, makes them particularly suitable for developing robust climatic indicators that extend beyond the instrumental record [13,14]. In addition, these species inhabit high-elevation montane environments, serving as model systems for studying the resilience of rare and endemic flora under ecosystem disturbances. Their conservation is essential for maintaining the ecological integrity of the forested mountains of northern Mexico, ensuring the preservation of associated biodiversity, including fauna, fungi, and insects, as well as the forest carbon storage capacity [15].
The objectives of this study were (i) to develop tree-ring chronologies for P. mexicana and P. martinezii populations located in the Sierra Madre Oriental (northeastern Mexico), (ii) to determine the response of radial growth of the two species to changes in climate parameters, (iii) to develop precipitation reconstructions, and (iv) to analyze interannual precipitation variability driven by the ENSO phenomenon.
The hypothesis of this study relies on the assumption that the annual radial growth of P. mexicana and P. martinezii in the Sierra Madre Oriental is primarily determined by prevailing precipitation conditions during the cool season (winter and spring). Therefore, their tree rings are suitable indicators for reconstructing seasonal climate variability, particularly precipitation.

2. Materials and Methods
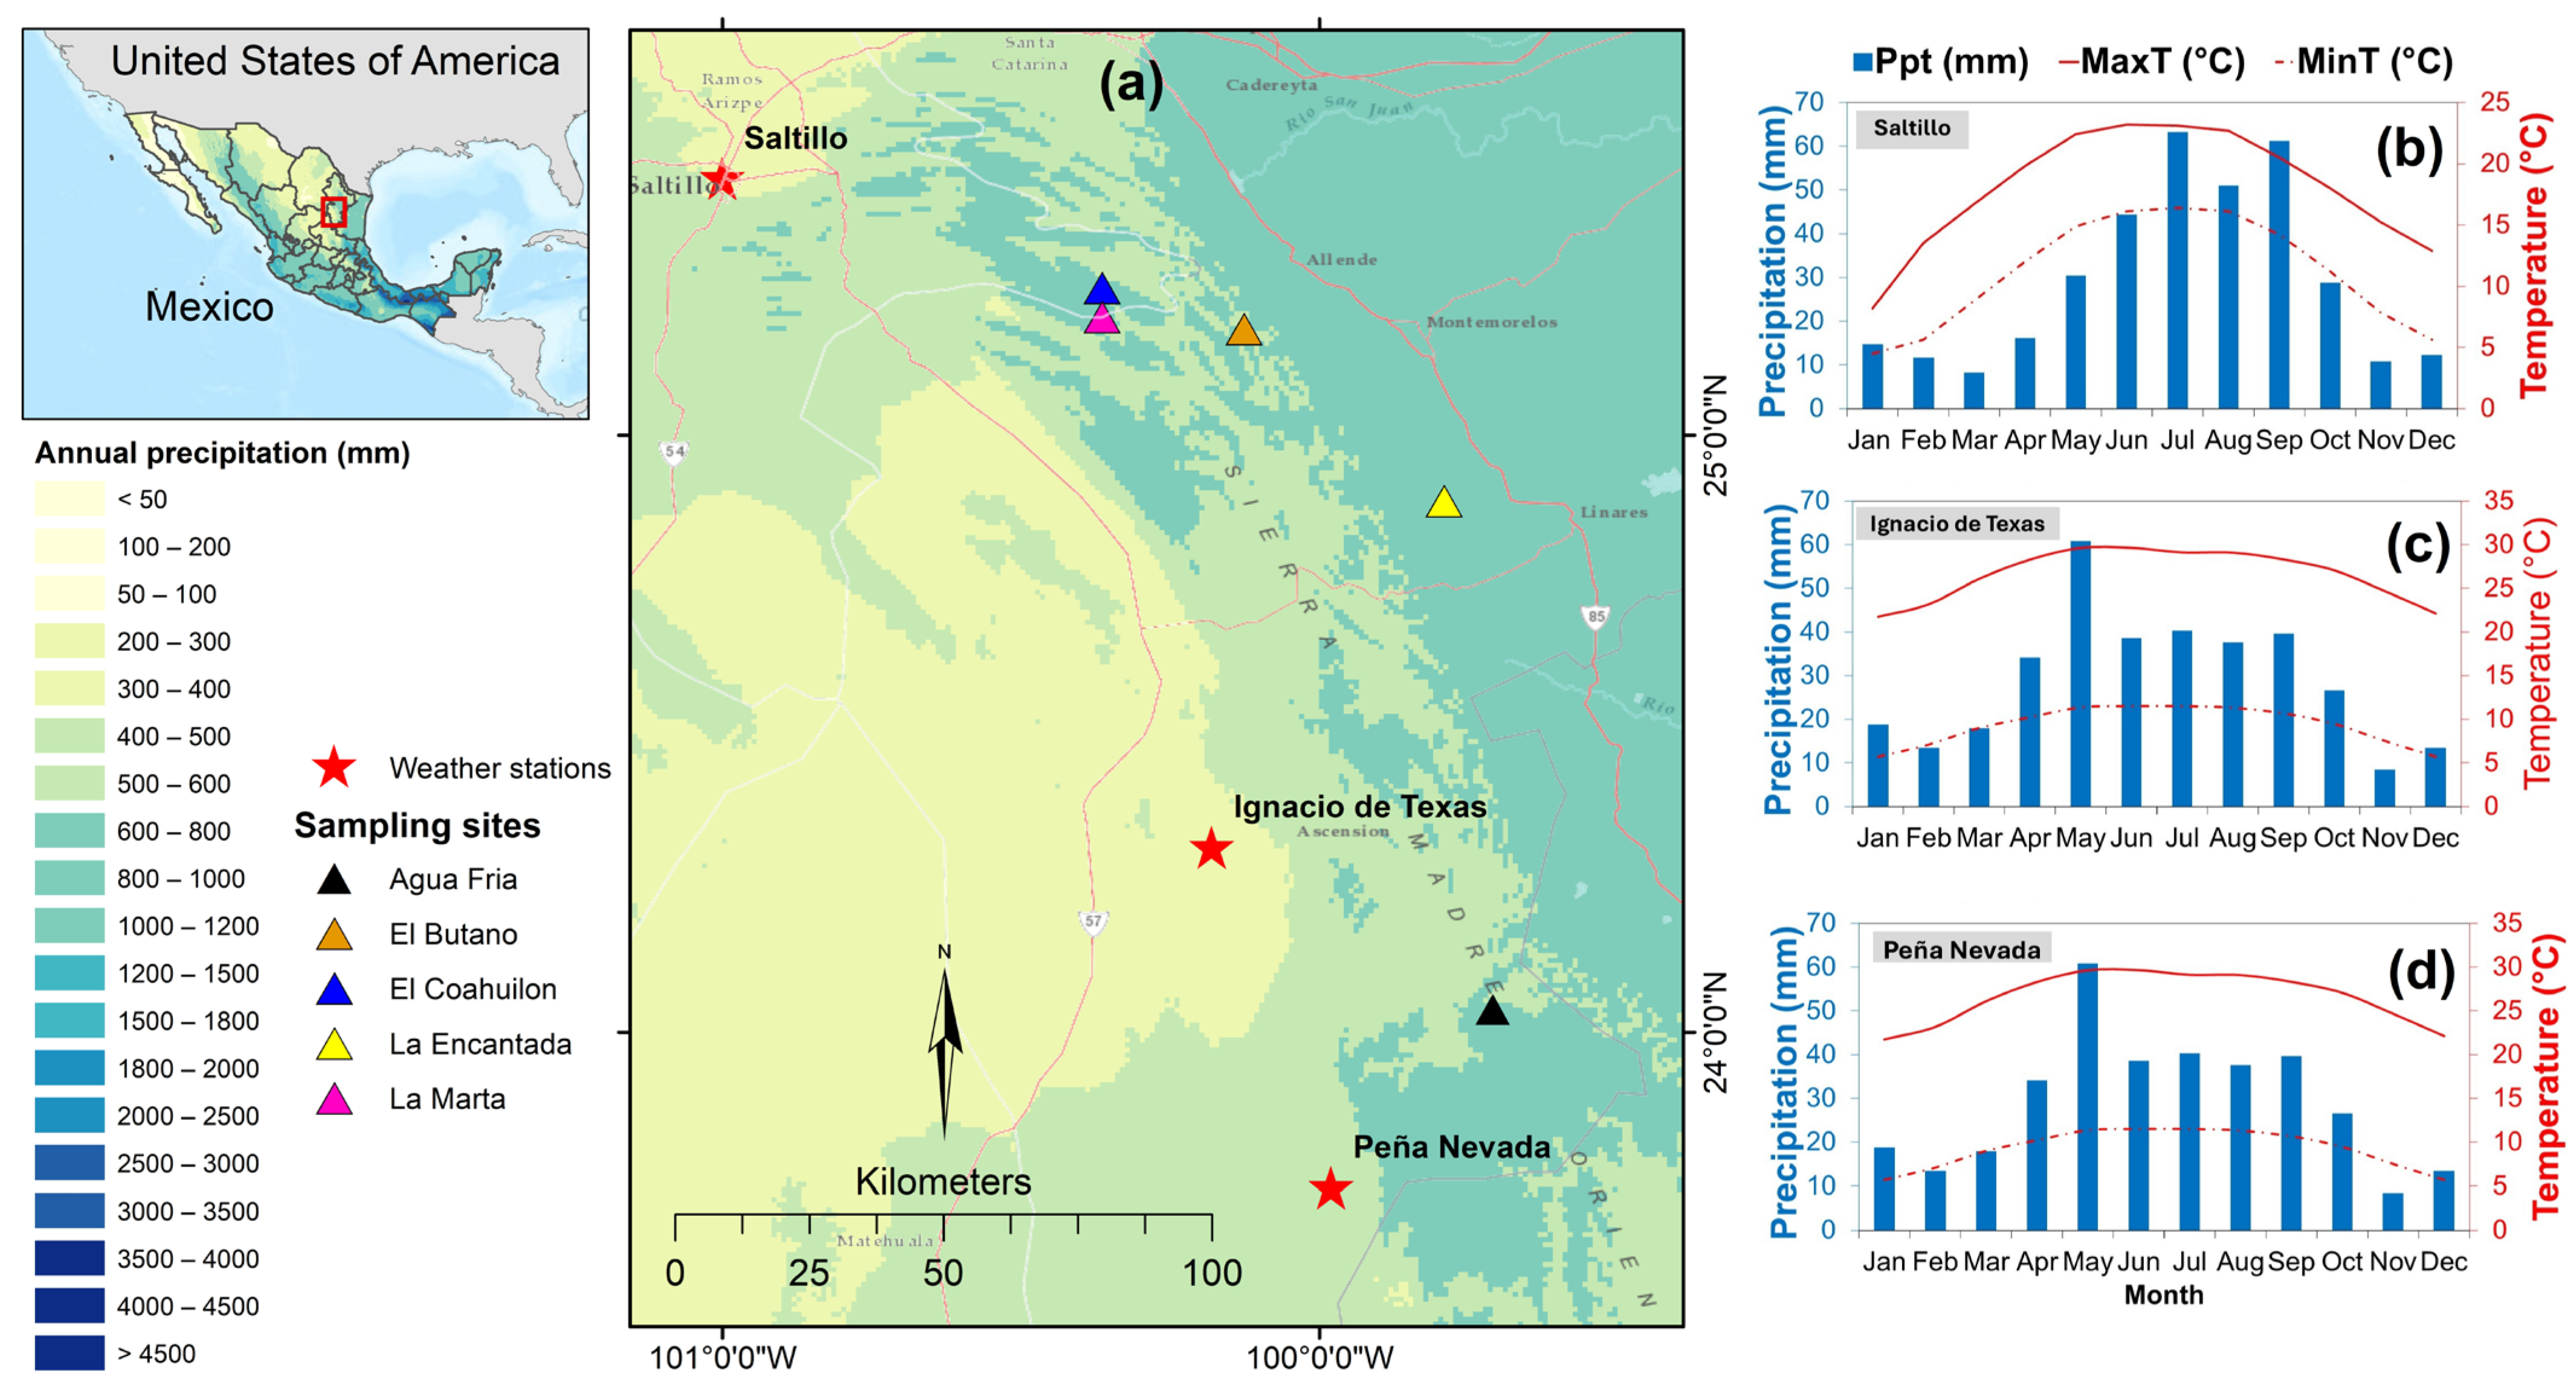
2.1. Study Area

The study area comprised five spruce populations in the Sierra Madre Oriental, Mexico (Figure 1a). Specifically, the P. mexicana populations were El Coahuilon (ECO) and La Marta (LMA), which are characterized by a subhumid montane climate with summer precipitation. In contrast, the populations of Agua Fría (AFI), La Encantada (LEN), and El Butano (BUT) are habitats for P. martinezii populations. Notably, AFI and LEN are located in a subhumid temperate climate, whereas BUT is characterized by a subhumid semi-warm climate with summer rainfall [10,12,16].
P. mexicana is found in mixed-conifer forests, growing on sedimentary substrates (limestone) as well as on igneous rocks (rhyolites). The main soil types include lithosols, with lesser occurrences of calcareous regosols, rendzinas, and haplic phaeozems. In all cases, the soils have a medium texture [17]. P. martinezii occurs in humid ravines and along stream banks within mixed forests of broad-leaved species, and it grows on sedimentary substrates, primarily limestone and, to a lesser extent, shale. The soils are moderately to strongly acidic, with very low salinity and high organic matter content [16].

2.2. Collection and Processing of Dendrochronological Samples

Individual trees were selected based on their apparent health, accessibility, and the absence of physical damage or external growth anomalies such as scars, reaction wood, or stem deformities. To maximize the climate signal in the tree-ring series, we prioritized individuals growing in sites with minimal or no anthropogenic disturbance, typically located on steep slopes with shallow soils where the influence of non-climatic factors such as competition or edaphic variability is reduced [18]. Two to three increment cores were obtained at breast height (1.30 to 1.40 m) from each tree, using a 5.1 mm Pressler borer. The number of sampled trees was based on the population size; thus, the sample size for El Coahuilon (COA) consisted of 25 trees with 53 increment cores, 49 cores from 24 trees for La Marta (LMA), 40 cores from 25 trees for Agua Fría (AFI), 109 cores from 46 trees for El Butano (BUT), and 55 cores from 35 trees for La Encantada (LEN).
Samples were processed following standard dendrochronological techniques [19]. Increment cores were dated using the skeleton plot procedure [20] and measured using a Velmex measuring system with an accuracy of 0.001 mm. The quality of dating was verified with the COFECHA program [21]. Different parameters were examined to determine the quality of the chronologies, including Mean Sensitivity (MS), First-Order Autocorrelation (AC1), Rbar, and Signal-to-Noise Ratio [18]. The expressed population signal (EPS) was used to select the parts of the chronology with a statistically significant sample depth suitable for climate reconstruction [22].
Age-related trends not associated with climate were removed using the dplR package version 1.6.7. during the standardization process in R software [23]. Ring-width indices were produced by division, resulting in a final chronology with homogeneous variance and a mean value centered around unity [24].
To determine a common climate signal, the developed ring-width series were analyzed using a Pearson correlation coefficient matrix (r) and Principal Component Analysis (PCA) [25]. Series exhibiting a common climatic response were integrated into single representative chronologies for each species for climate reconstruction purposes.

2.3. Climate Data Source

Monthly climate data were obtained from the meteorological stations “Saltillo”, “Ignacio de Texas”, and “Peña Nevada”. These stations recorded annual precipitation levels of 578, 346, and 292 mm, respectively, with 65.0%, 42.5%, and 55.0% of the annual precipitation occurring in the summer months (June–September), while winter–spring rains represent less than 20% of the annual total [5] (Table 1). To ensure consistency with the tree-ring data, the monthly precipitation and temperature records were examined for continuity, outliers, and homogeneity. When necessary, missing values were estimated using data from nearby stations with high correlation coefficients.

2.4. Correlation Analysis

Monthly records of precipitation, mean maximum temperature, and mean minimum temperature were correlated with the species’ ring-width chronology in order to identify the most suitable months or seasonal periods for precipitation reconstruction. The analysis was conducted over an 18-month period—six months preceding the growth year and twelve months covering the current year of growth.

2.5. Reconstruction of Climatic Variables

For reconstruction purposes, the total period of precipitation records was split into two subperiods and compared with the ring-width indices for the same period. For this process, half of the data was used for calibration and half for verification [26]. If both subperiods showed statistically significant results across various tests, including Pearson correlation, reduction of error, t-test, sign test, and first-order difference test, the reconstruction was computed using the Verify (VFY) subroutine of the Dendrochronological Program Library (DPL) [17].

2.6. Comparison with Other Reconstructions

To assess the reliability of our reconstructed precipitation series, they were compared with independent reconstructions of seasonal precipitation and the Standardized Precipitation Index (SPI). These reference datasets were derived from the North American Seasonal Precipitation Atlas (NASPA; http://drought.memphis.edu/NASPA/, accessed on 12 December 2024), which offers spatially and temporally explicit gridded reconstructions based on tree-ring chronologies [27,28].

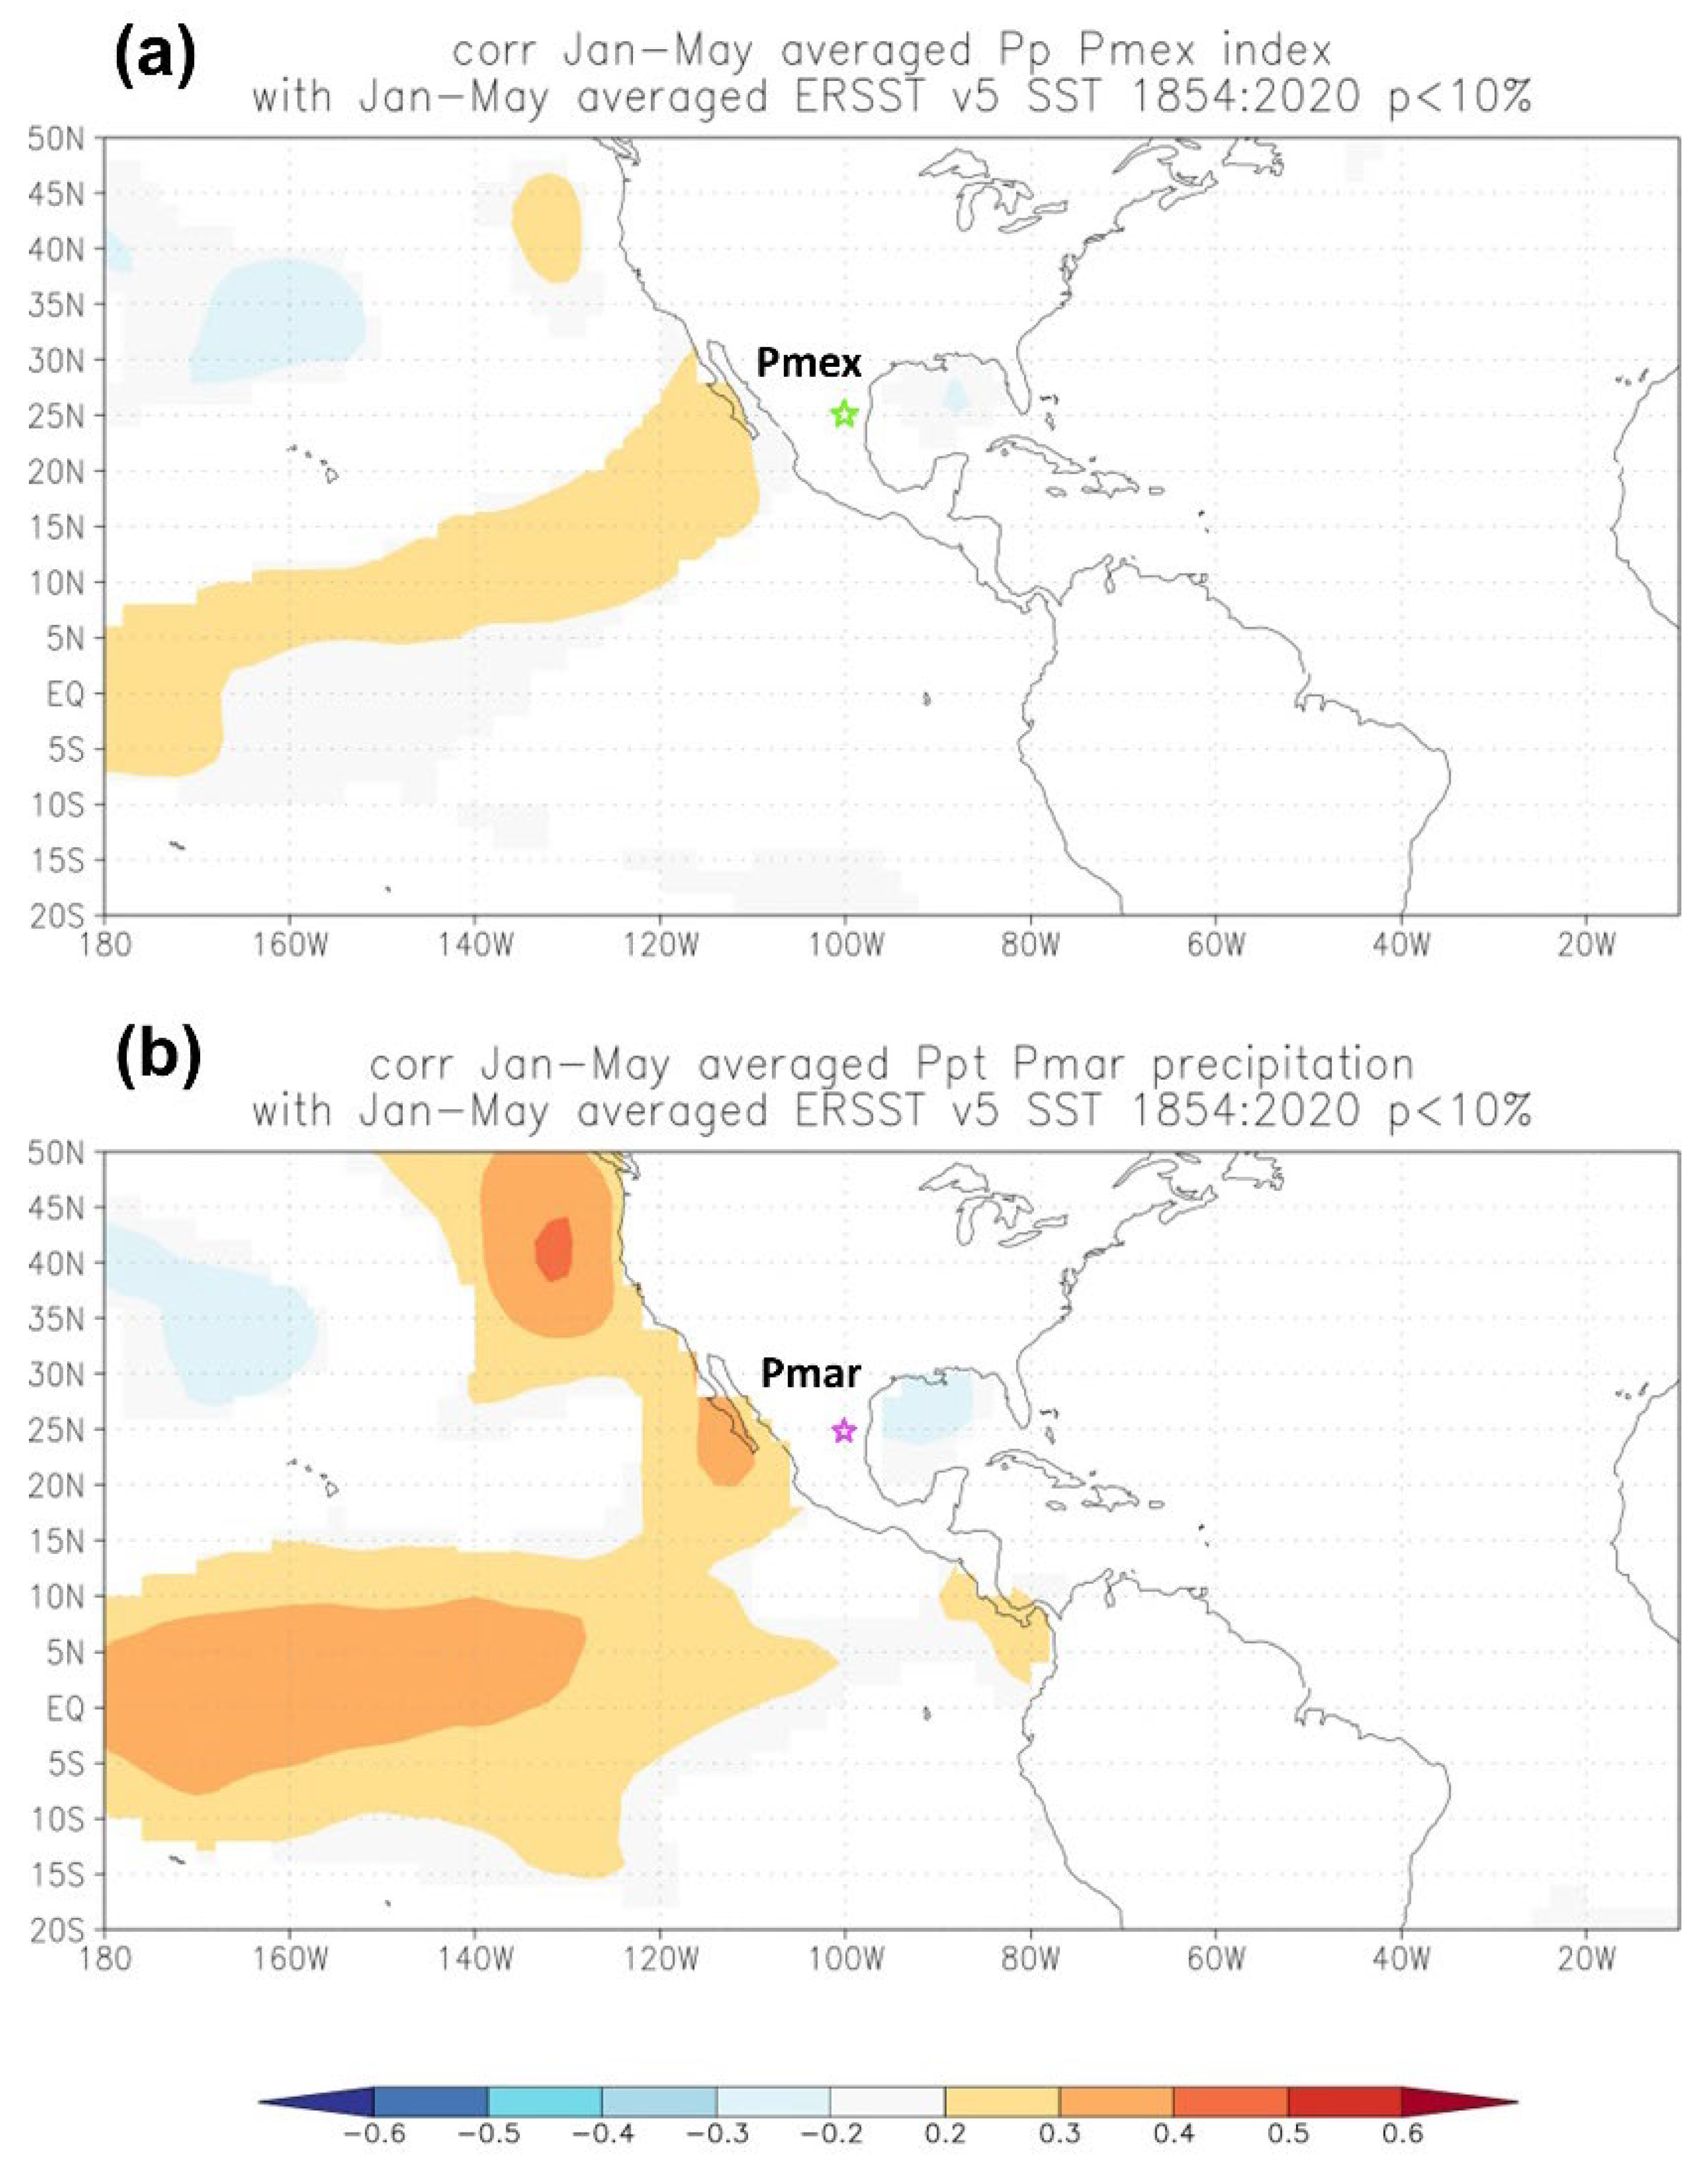
2.7. Analysis of the Influence of ENSO on Precipitation

To assess the influence of large-scale circulation phenomena on precipitation, such as ENSO, a spatial correlation analysis was performed between the El Niño 3.4 index and the reconstructed precipitation data using the KNMI Climate Explorer (http://www.knmi.nl, accessed on 17 December 2024) [29]. Additionally, a multitaper power spectral analysis was applied to the reconstructed precipitation series to identify significant frequency components potentially driven by ENSO variability [30,31]. This analysis was conducted using the dplR package within the R software environment [23].

3. Results

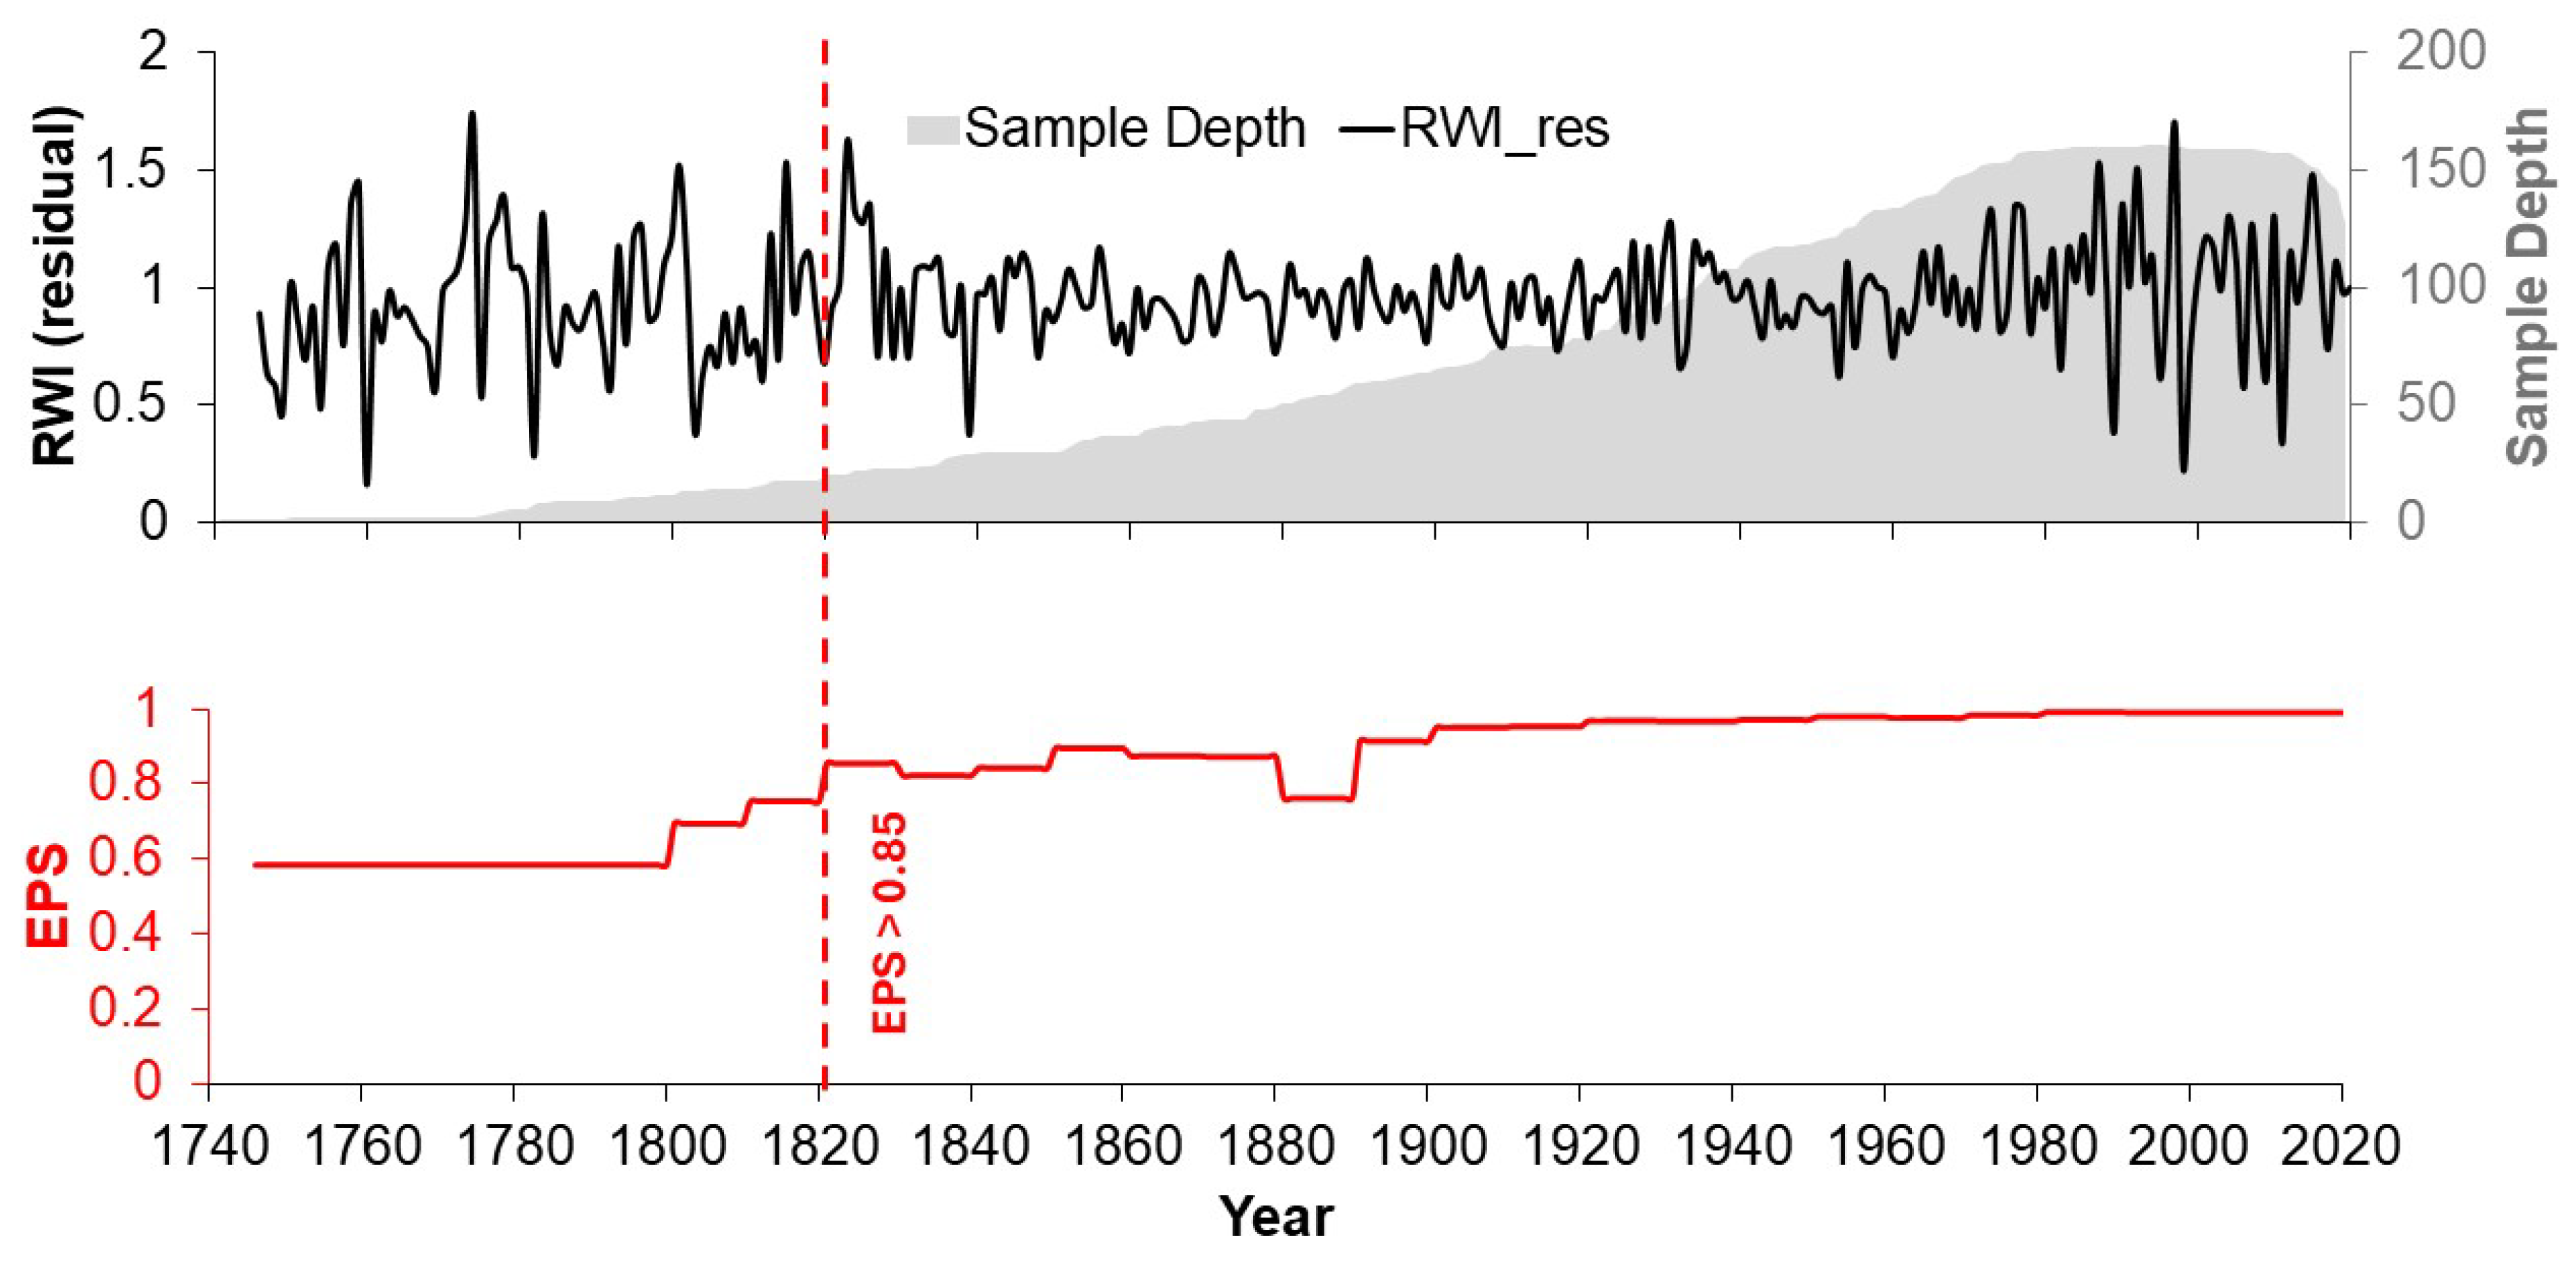
3.1. Age of Sampled Trees and Dendrochronological Parameters of the Ring Width Series

The age of sampled trees differed between spruce populations; the maximum age for P. mexicana was 224 years, whereas for P. martinezii it was 204 years. Five dendrochronological series were constructed: two for P. mexicana and three for P. martinezii populations. The dendrochronological parameter values were considered acceptable for all chronologies, with an average Mean Sensitivity ranging from 0.25 to 0.40, First-Order Autocorrelation from 0.01 to 0.04, Rbar from 0.30 to 0.46, and Signal-to-Noise Ratio from 6.6 to 25.6 (Table 2).

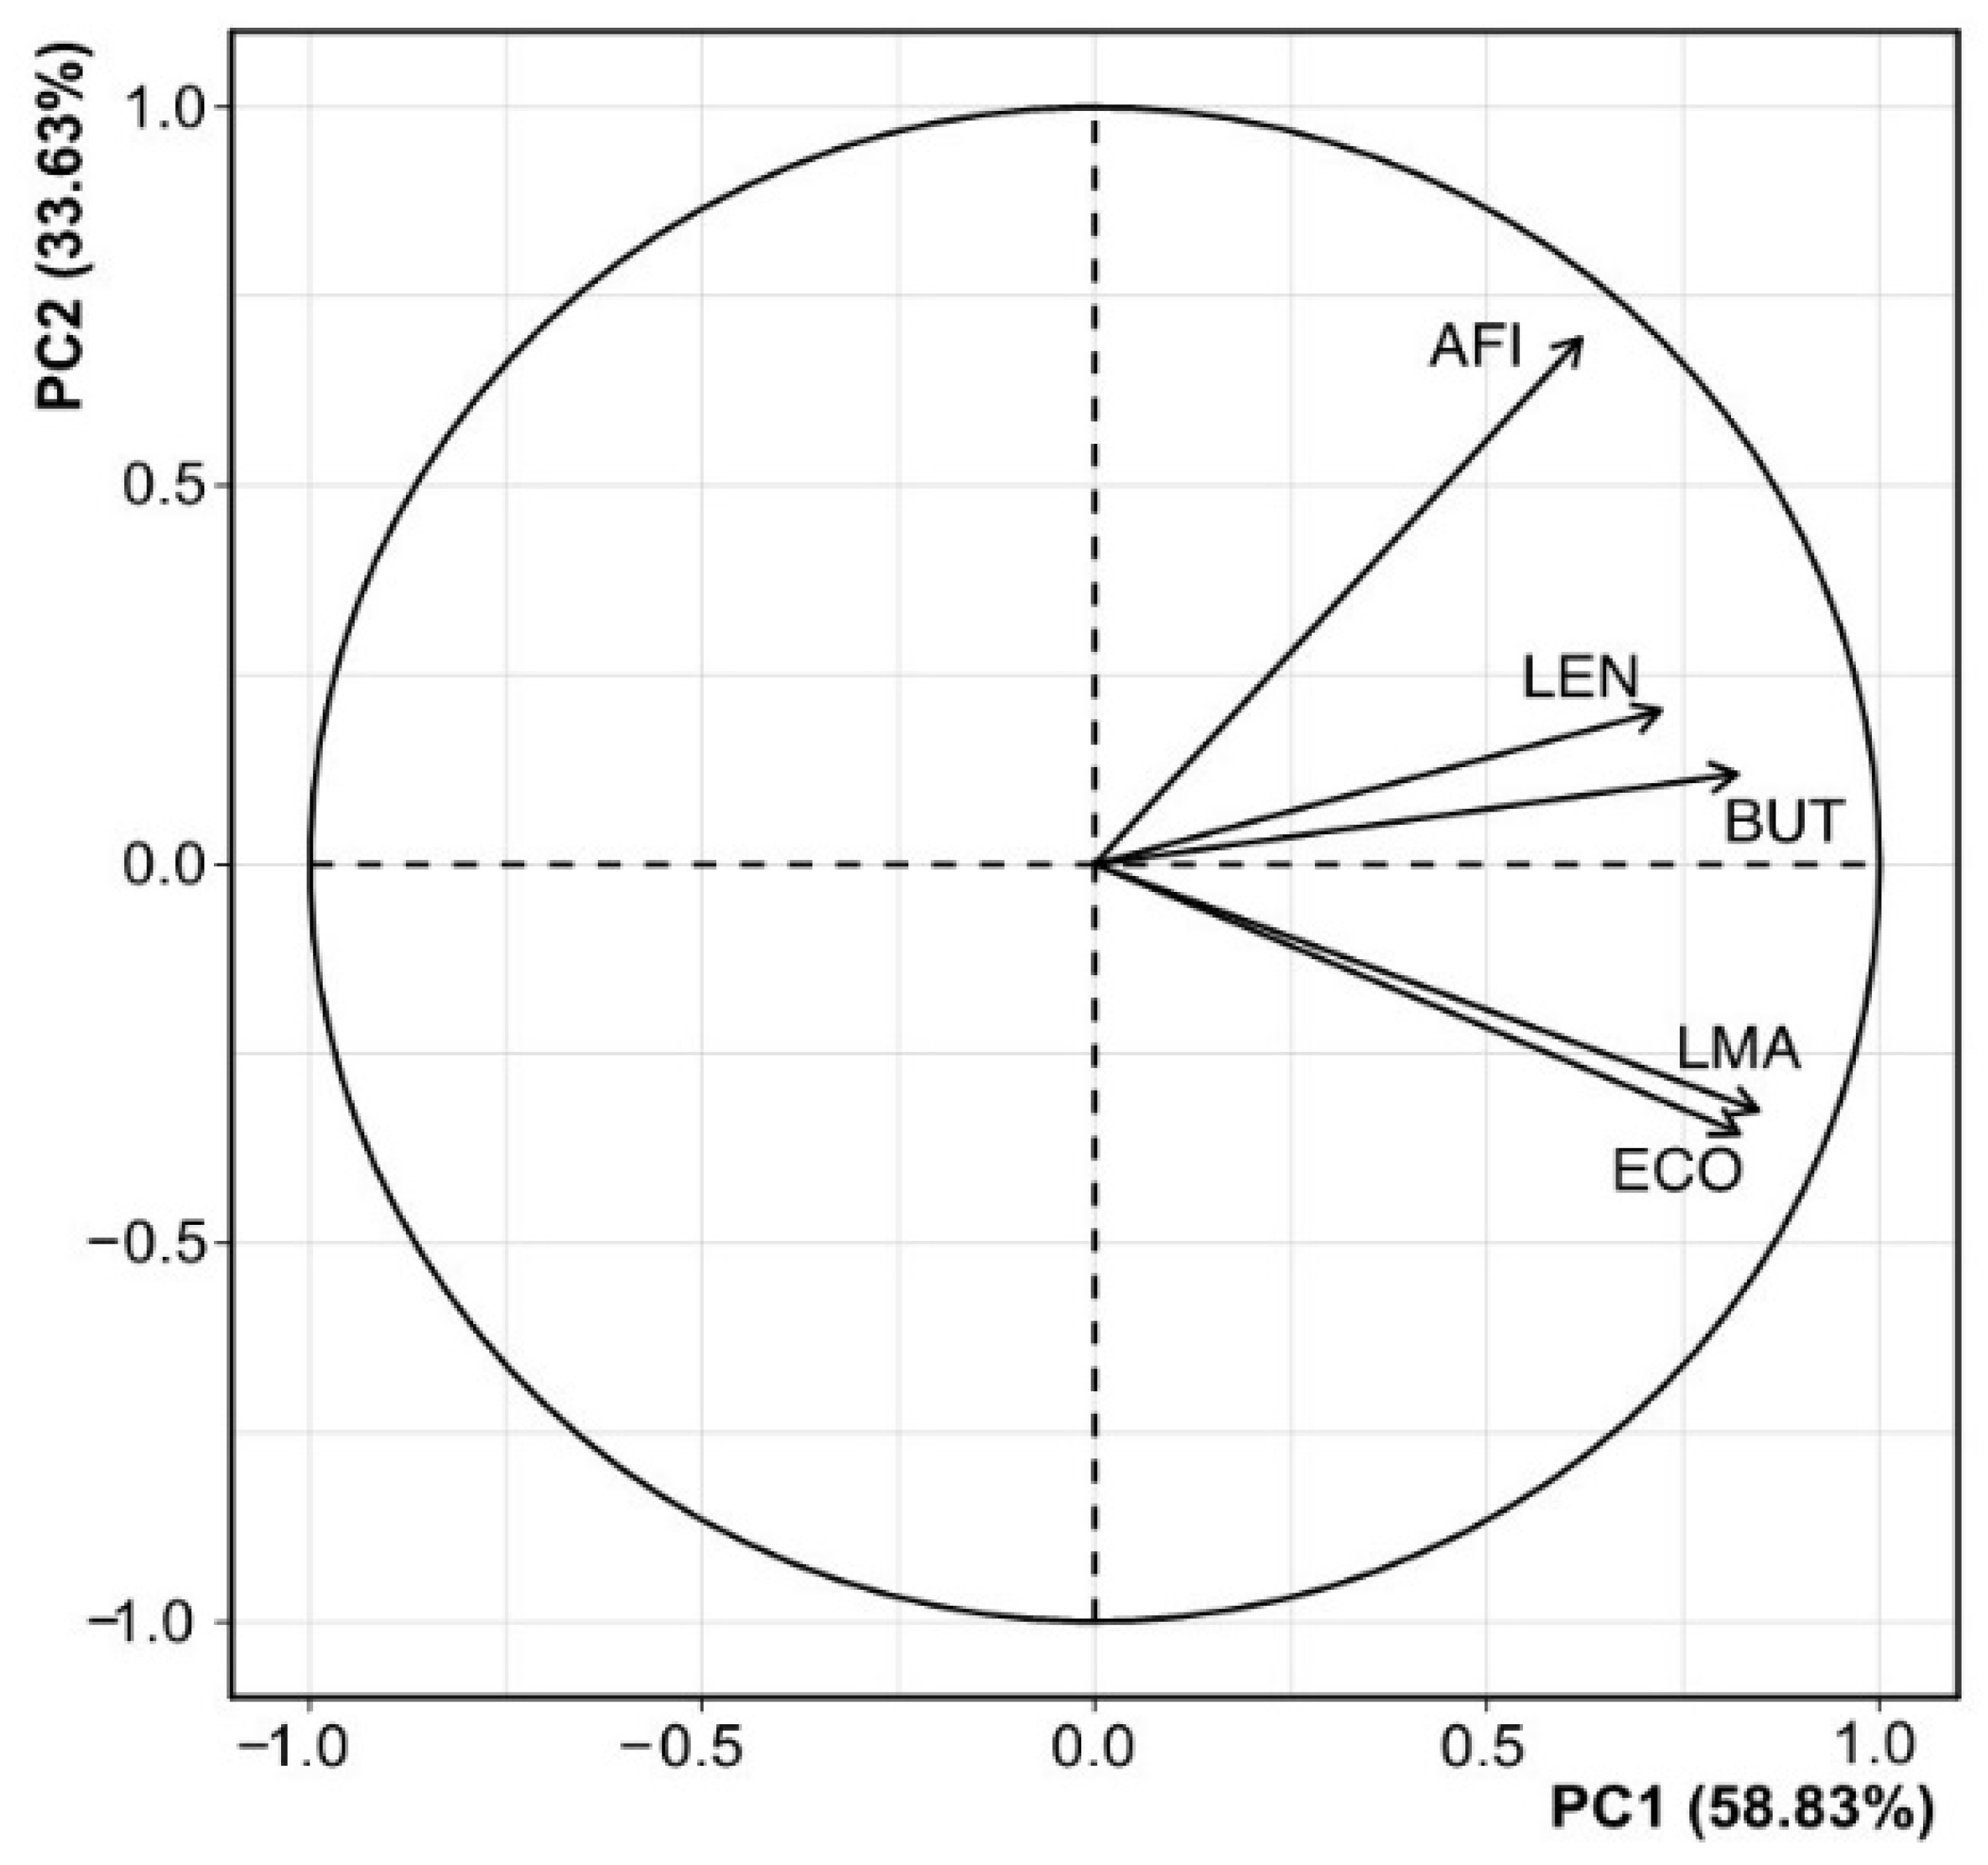
3.2. Correlation Analysis Between Spruce Series

Comparison of the series using Pearson correlation values indicated similar interannual variability among ring width series (Table 3).
The results of the principal component analysis (PCA) corroborated those of the correlation matrix analysis. The first and second components (PC1, PC2) of the PCA explained 58.8 and 33.6% of the common variance, respectively (Figure 2).
Based on the PCA outcome, the chronologies loaded on the components with the highest variance (PC1, PC2) were combined into single representative ring-width chronologies. Thus, the PC1, which includes the P. mexicana sites ECO and LMA and represents the first group (Pmex), extending from 1782 to 2020 (238 years), with an EPS > 0.85 obtained from 24 cores beginning in 1851 (Figure 3).
On the other hand, the P. martinezii sites (BUT, LEN, AFI), which loaded on the second component (PC2), formed the second group (Pmar), with the combined chronology covering the period 1736–2020 (285 years), and an EPS > 0.85 obtained from 35 cores beginning in 1821 (Figure 4).

3.3. Climatic Response of the Chronologies

High correlations between the ring-width chronology groups (Pmex, Pmar) and climatic records were obtained for data from the Saltillo weather station. By contrast, no significant climatic response (p > 0.05) was found for either precipitation or temperature data from the Ignacio de Texas and Peña Nevada weather stations (Table 1); these stations were therefore excluded from further analysis.
The correlation between the combined Pmex chronology and the seasonal accumulated precipitation from January to May was 0.65 (p < 0.01), while the correlation with the mean monthly maximum temperature was −0.52 (p < 0.01) (Figure 5a). The combined Pmar chronology yielded a correlation of 0.71 (p < 0.01) for the accumulated January–May precipitation and −0.59 (p < 0.01) for the mean monthly maximum temperature from January to May (Figure 5b). The correlation with minimum temperature was not significant (p > 0.05) for either chronology.

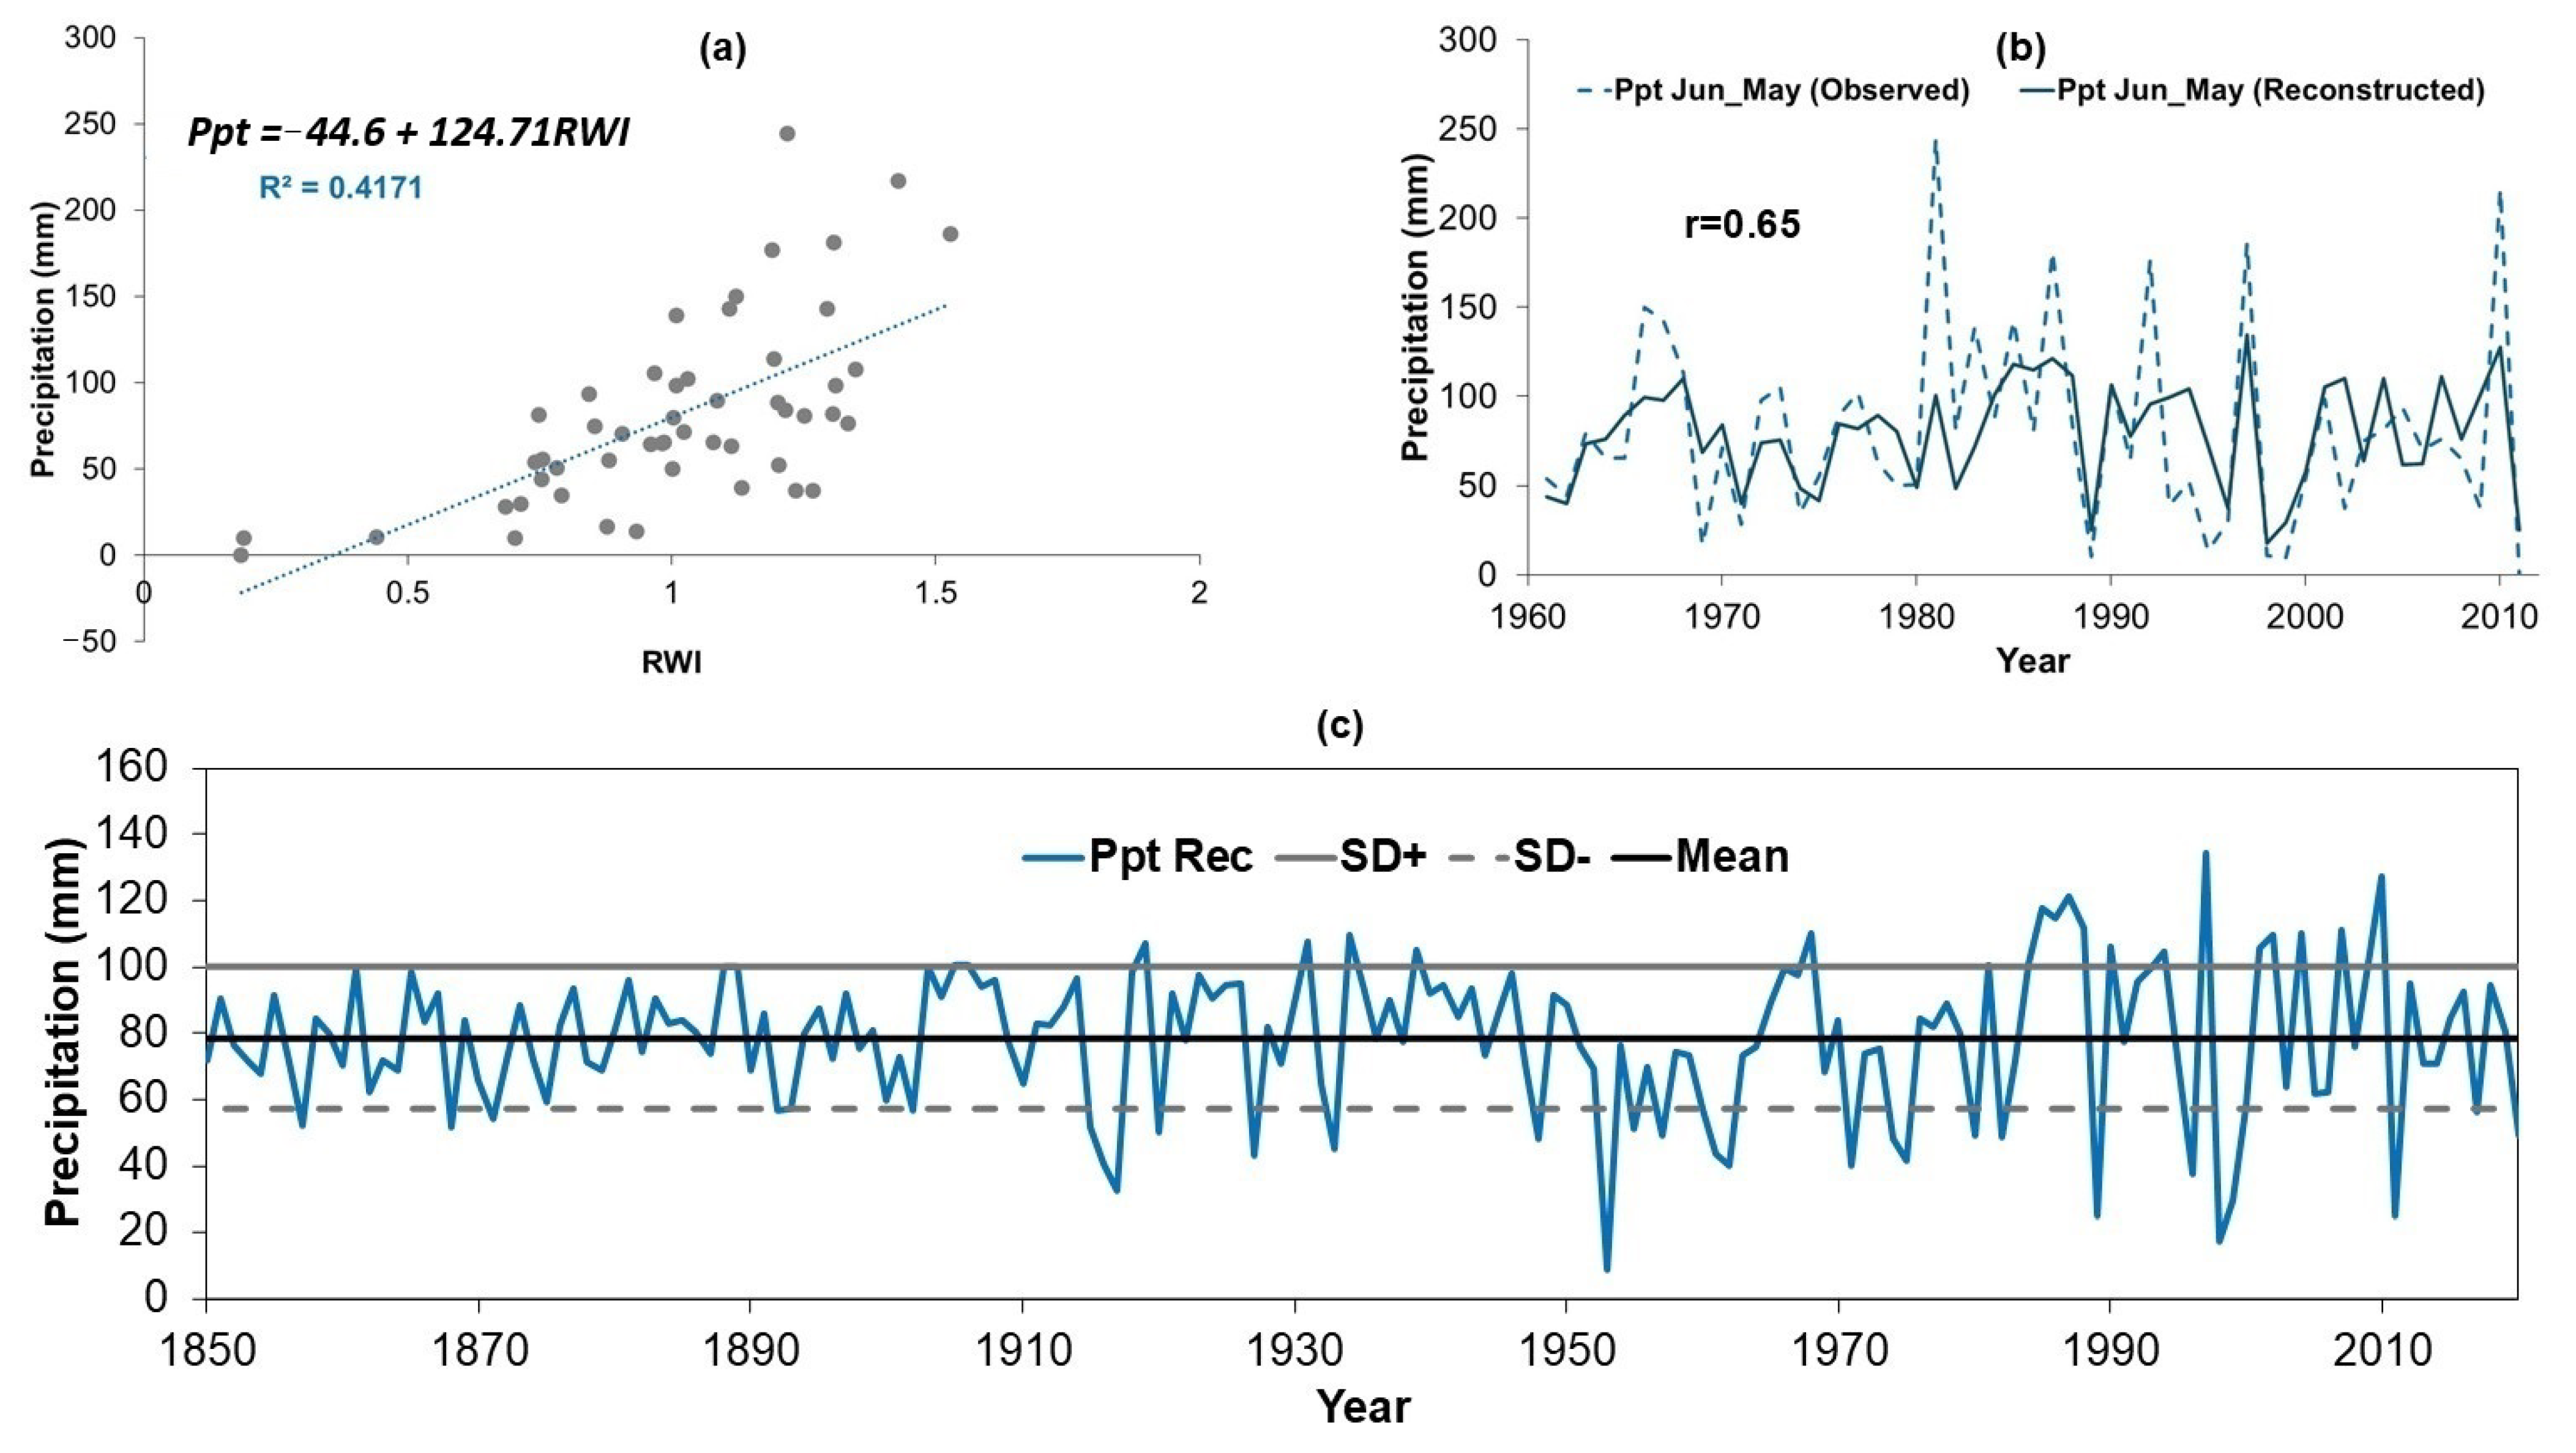
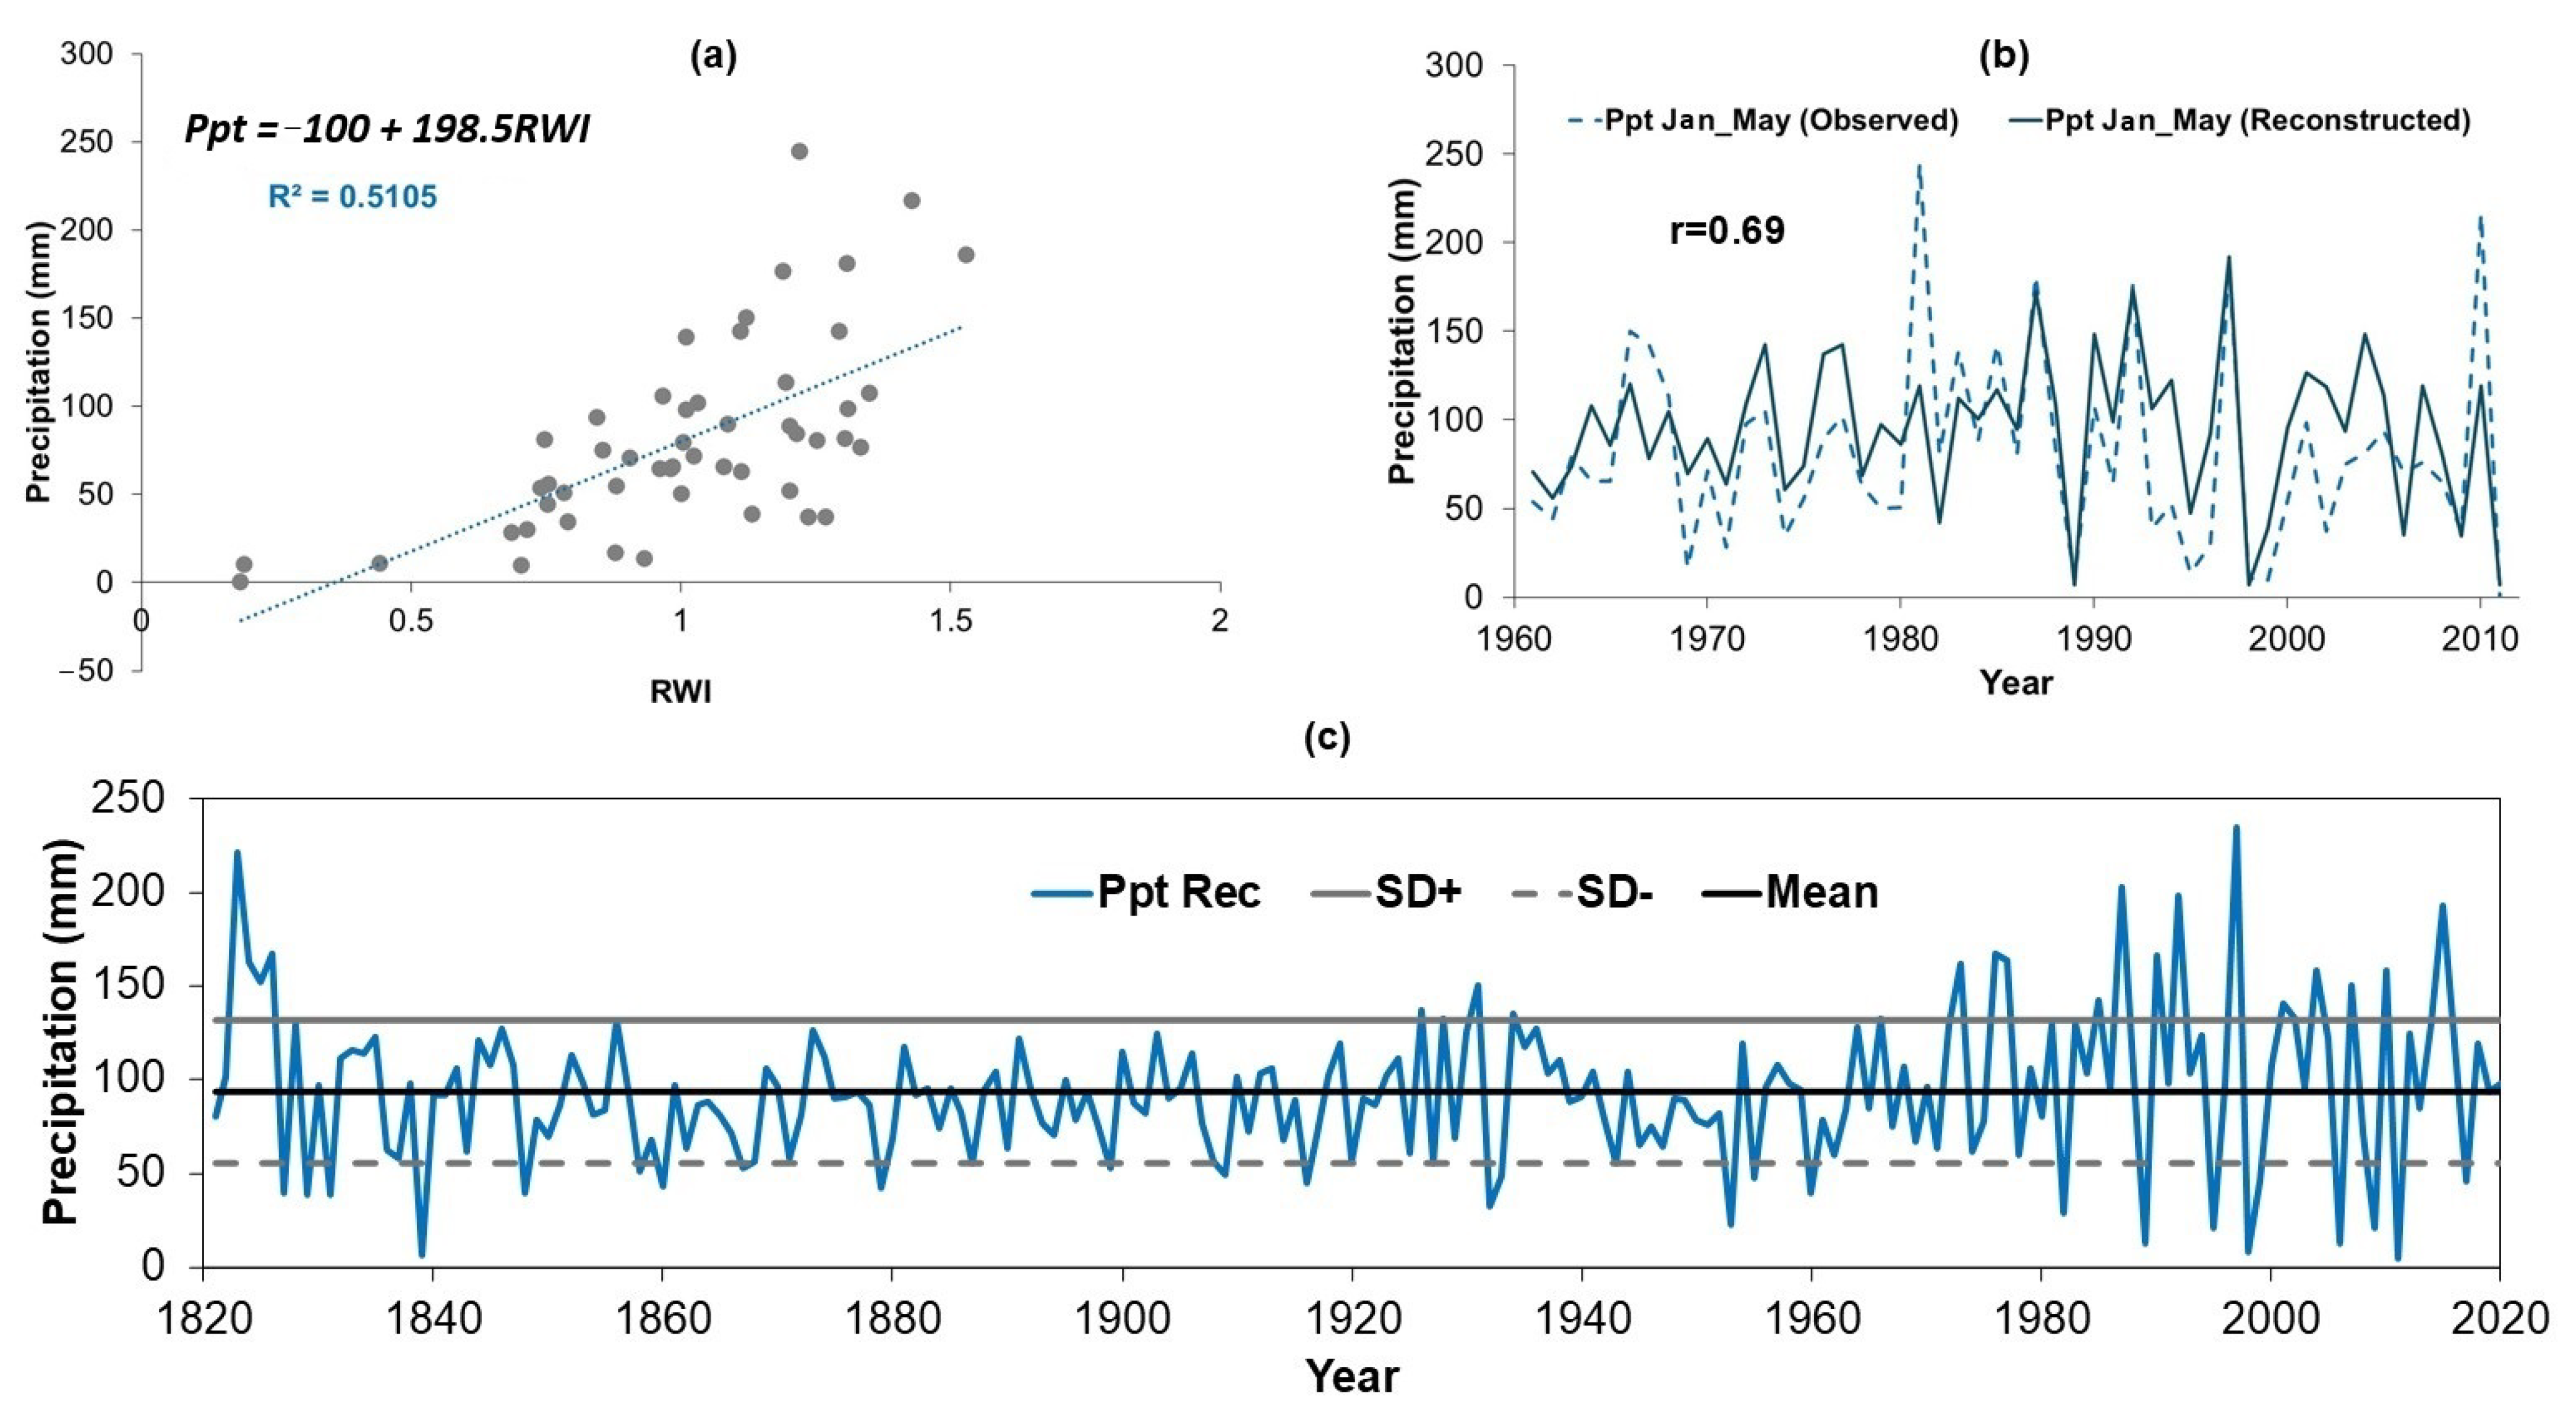
3.4. Development of the Model Used to Reconstruct Precipitation

Based on the correlation between the ring-width index (RWI) of Pmex and meteorological data from the Saltillo station, the reconstruction period for precipitation was defined as January to May. The calibrated regression model indicated that the RWI of Pmex accounted for 41% of the variance in observed precipitation (Figure 6a). For the period 1961–2011, the correlation coefficient between observed and reconstructed precipitation was r = 0.65; p < 0.05 (Figure 6b). Based on EPS from the RWI of Pmex, seasonal precipitation for the January–May period was reconstructed back to 1841, covering the period 1851–2020 (Figure 6c).
For the RWI of Pmar, the optimal period for reconstructing precipitation was also identified as January to May. The calibrated regression model showed that the RWI of Pmar explained 51% of the variance in observed precipitation at the Saltillo weather station (Figure 7a). During the period 1961–2011, the correlation coefficient between observed and reconstructed precipitation was r = 0.69; p < 0.05 (Figure 7b). Based on EPS from the RWI of Pmar, seasonal precipitation for the January–May period was reconstructed for the years 1821–2020 (Figure 7c).
The reconstructed Pmex and Pmar January–May precipitation levels were significantly correlated (r = 0.58, p < 0.01) during the common period (1851–2020), with notably higher precipitation values for Pmar. The reconstructed precipitation levels for Pmex exceeded those in the Pmar reconstruction in 19% of the years. Only three years in the Pmex reconstruction had more than 50% of the mean annual precipitation relative to the Pmar reconstruction: 1831, 1839, and 2009. Table 4 presents the statistics for both the calibration and verification processes of the regression models used for reconstructing seasonal precipitation with Pmex and Pmar.
The comparison between the reconstructed seasonal precipitation series (Pmex and Pmar) and the observed seasonal precipitation and SPI from NASPA revealed positive and statistically significant correlations (p < 0.001). The Pmex reconstructed precipitation series showed a significant correlation with the NASPA precipitation reconstruction (r = 0.59, p < 0.001), as well as with the reconstructed SPI-NASPA values (r = 0.55, p < 0.001). Similarly, the Pmar reconstruction was significantly correlated with the NASPA precipitation series (r = 0.55, p < 0.001) and the SPI-NASPA values (r = 0.54, p < 0.001). The synchronicity of wet and dry events across the four analyzed datasets is shown in Figure 8.

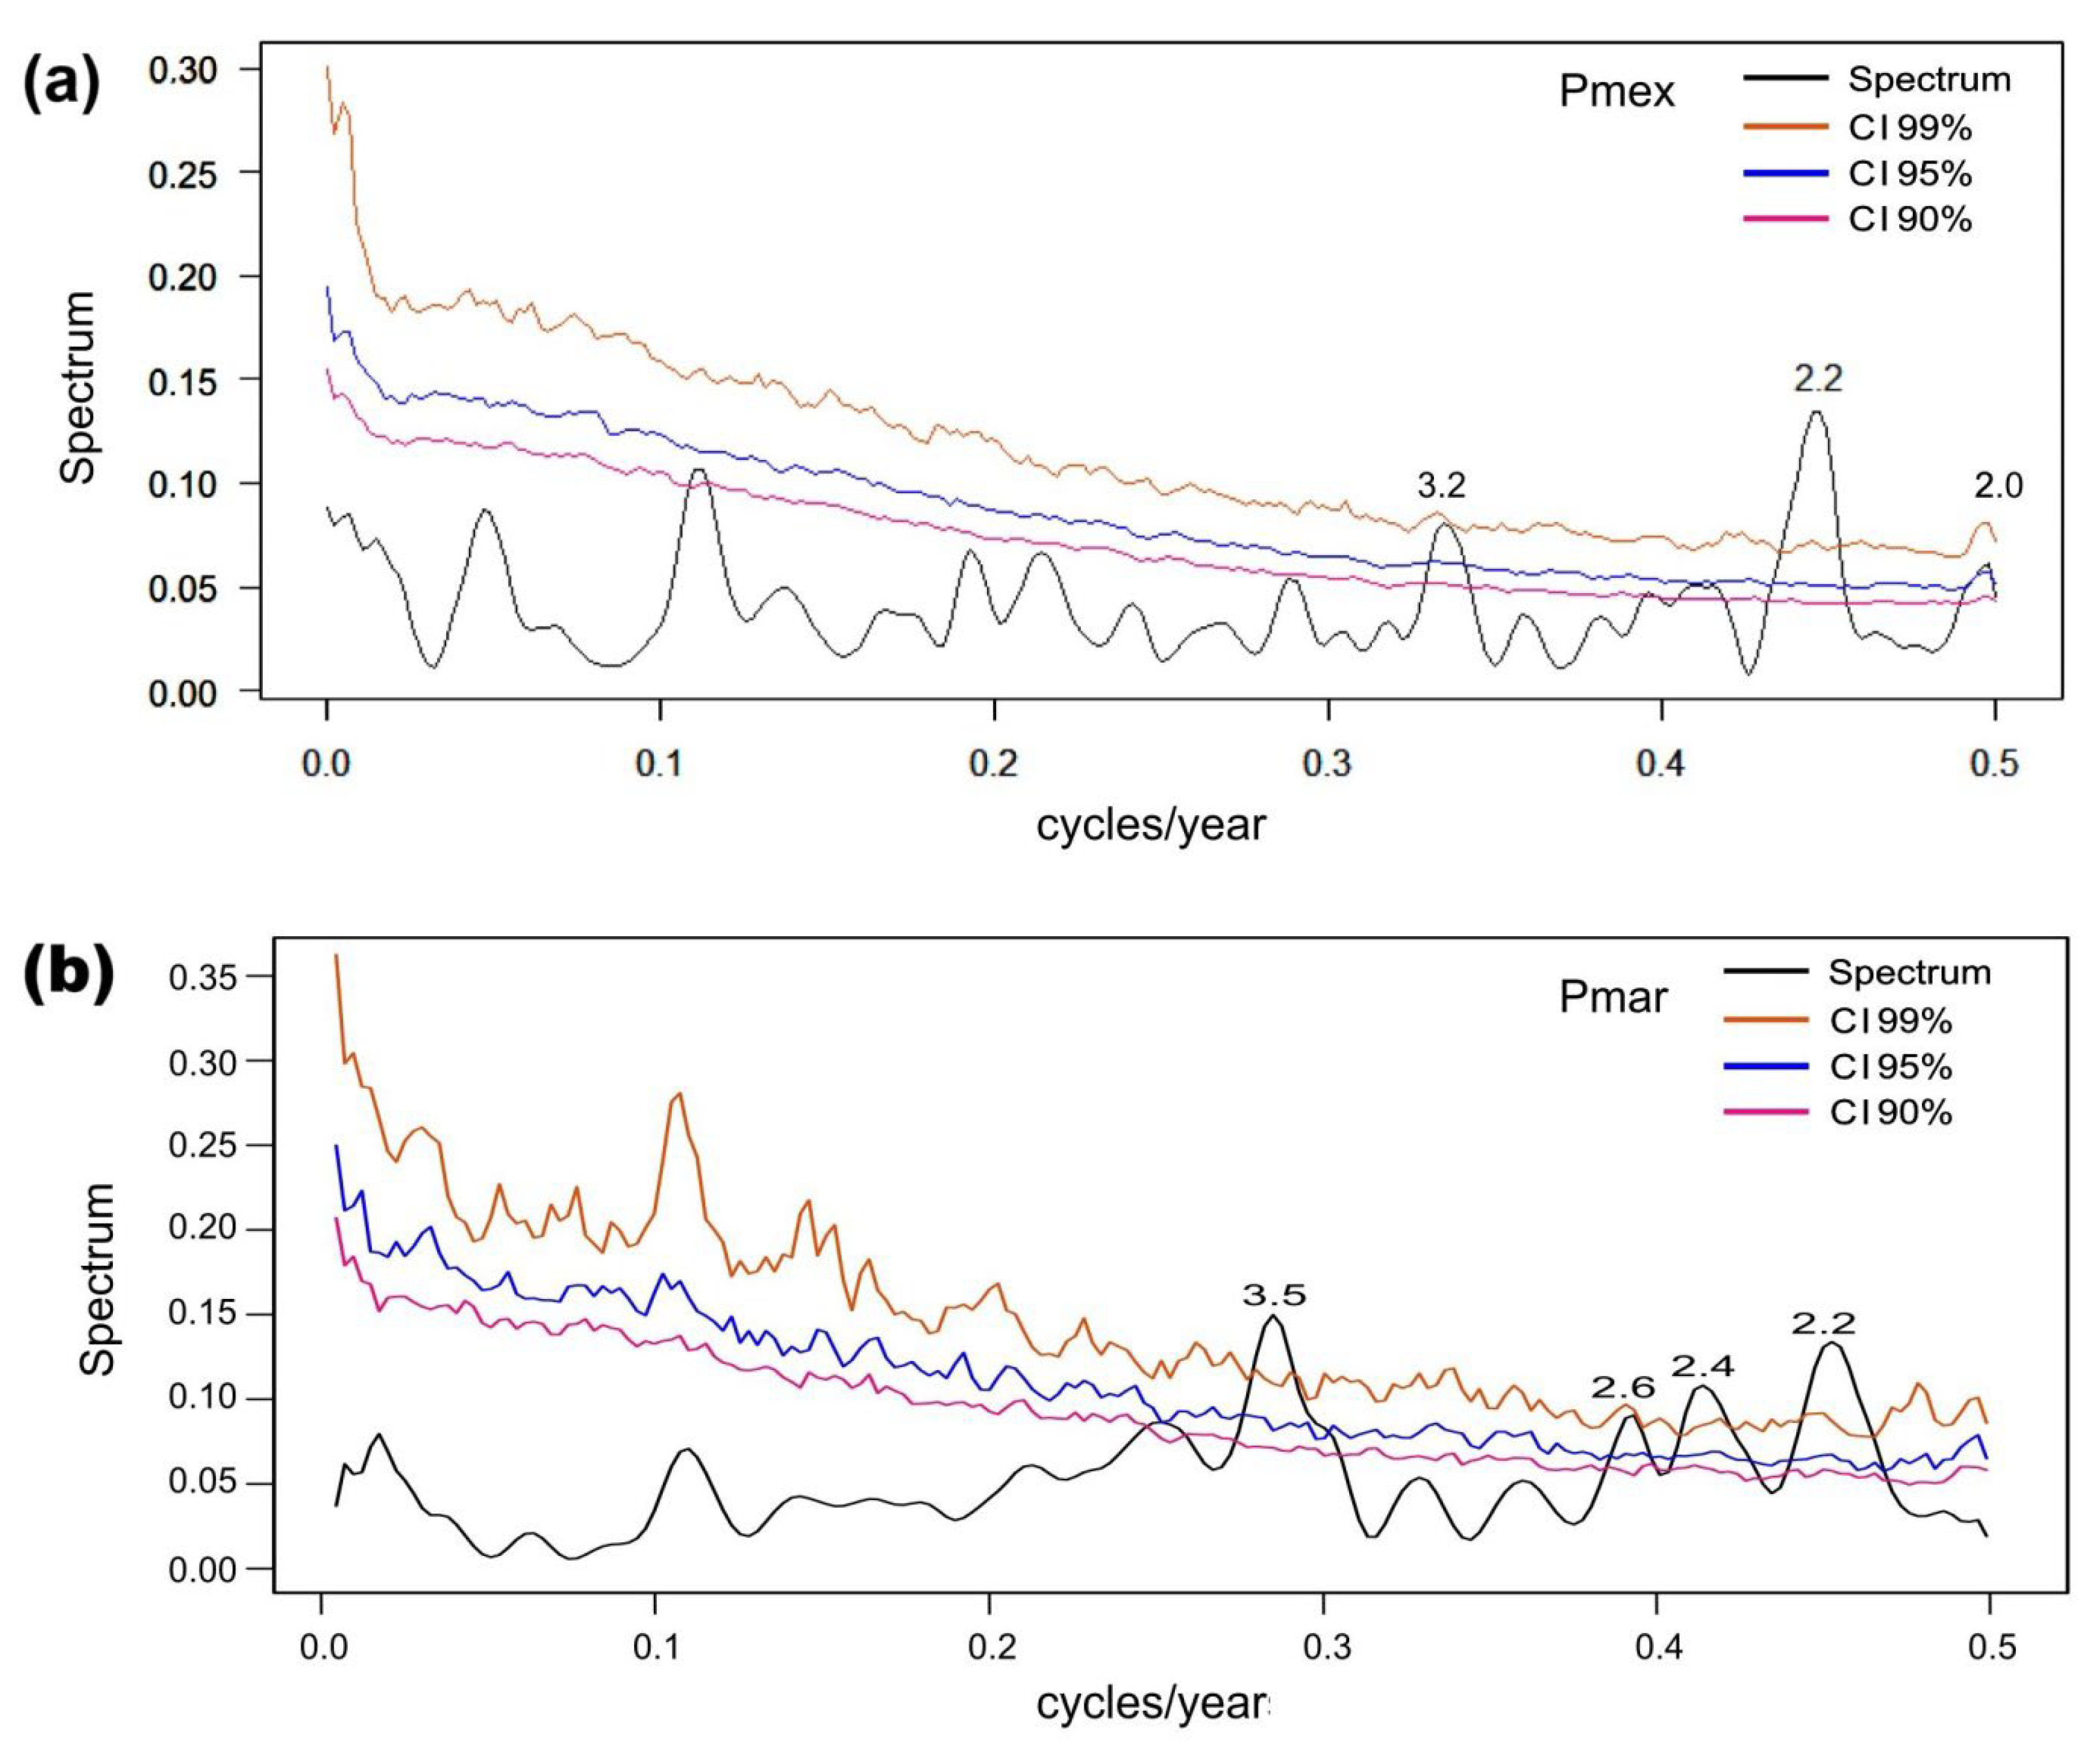
3.5. ENSO Modulations on Reconstructed Precipitation

The spatial correlation between sea-surface temperature (SST) fields and the spruce chronologies highlights the influence of large-scale circulation phenomena originating in the Pacific Ocean. The spatial correlations between the reconstructed January–May precipitation data and the SSTs were positive from the Eastern Equatorial Pacific to higher latitudes for Pmex, and this correlation increased for Pmar, with correlations reaching up to 0.5 in areas of the Eastern Equatorial Pacific Ocean and further north in latitude (Figure 9).
Finally, the power spectrum analysis detected significant cyclic frequencies (p < 0.05) at 3.2, 2.2, and 2.0 years for the precipitation reconstructed with Pmex (Figure 10a) and at 3.5, 2.6, 2.4, and 2.2 years for the precipitation reconstructed with Pmar (Figure 10b). All frequencies were lower than seven cycles per year. The observed spectral peaks are consistent with the characteristic timescales of ENSO.

4. Discussion

4.1. Climatic Response Function for the Dendrochronological Series

The interannual variability among the dendrochronological series, supported by Pearson correlations and PCA, showed similarities indicating a common climate signal (Table 3; Figure 2). Moreover, the climatic response functions of the two spruce chronologies were comparable to those reported for other conifers growing in temperate forests in northeastern Mexico, e.g., Pinus cembroides, Pinus nelsonii, and Pseudotsuga menziesii, where seasonal winter–spring precipitation and mean monthly maximum temperature during the growing season were the most limiting factors for radial growth [32,33,34].
The observed negative correlation of the RWI of P. mexicana and P. martinezii with mean monthly maximum temperature (Figure 5) suggests that an increase in this climatic variable may lead to a reduction in radial growth, especially if total precipitation does not increase under conditions of heightened water demand [35]. This response has been observed in other climatic response function analyses conducted for conifers thriving in mountainous systems in northern Mexico [36,37].
The P. mexicana and P. martinezii populations distributed across the Sierra Madre Oriental show a climate response function similar to other spruce species located in different regions but at comparable latitudes, such as Picea smithiana in the Central Himalaya [38] and Picea jezoensis in northeastern China [39]. Studies on spruce populations occurring at higher elevations have shown that temperature increases have favored higher recruitment rates and enhanced annual radial growth [40,41]. This response is attributed to the presence of snow during winter, which serves as the main water source and buffers soil temperature, reducing frost damage and creating more favorable environmental conditions for tree growth during the growing season [18,39,42]. This phenomenon may also occur at higher elevations of the Sierra Madre Oriental, where the P. mexicana populations experience occasional snow accumulation whose water content is slowly released and retained in the soil profile, as reported for alpine species growing in the high-elevation peaks of central Mexico [43].
The lower radial growth observed in the late 20th and early 21st centuries in the RWI of P. mexicana (Figure 3) may be a consequence of drought stress caused by rising temperatures and decreased soil water availability due to altered precipitation patterns [44]. This effect is occurring globally, as reported for other spruce populations such as Picea glauca in Alaska and Picea abies in Romania [45,46].

4.2. Reconstructed Precipitations

The reconstructed January–May precipitation patterns were similar in the P. mexicana and P. martinezii chronologies in terms of interannual and multiannual variability, although the P. martinezii chronology exhibited higher reconstructed precipitation values (Figure 7). This suggests that drier environmental conditions prevail in the P. mexicana populations than in those of P. martinezii. P. martinezii grows at lower elevations in moister sites flanked by canyons dominated by riparian vegetation [17]. Moist winds from the Gulf of Mexico release rain on the leeward side of the Sierra Madre Oriental, where the P. martinezii sites are located. After crossing the mountain range, the winds become drier and deposit less rainfall due to the orographic shadow effect [47], which allows scattered stands of the more drought-tolerant P. mexicana to thrive. P. martinezii and P. mexicana differ in their ecological niches in ways that likely influence their growth–climate relationships. P. martinezii occupies lower elevations with high year-round humidity, deeper organic soils, and warmer mean annual temperatures. Accordingly, it is expected to exhibit less sensitivity to variations in precipitation, particularly summer rainfall. In contrast, P. mexicana is found at higher elevations in colder and drier environments, often on shallow lithosols over calcareous or igneous substrates. These conditions suggest that growth is primarily limited by low temperatures, with potential sensitivity to extreme heat or shortened dormancy periods. Soil depth and thermal regime may also restrict its response to interannual precipitation variability. Consequently, the two species likely capture distinct but complementary climatic signals in their ring-width chronologies [48].
Specific years where reconstructed precipitation volumes were higher for the P. mexicana chronology may reflect the impact of high-intensity hurricanes and tropical storms affecting the states of Nuevo León and Tamaulipas, such as Hurricanes Beulah in 1967, Gilbert in 1988, and Alex in 2010, which impacted large areas of northeastern Mexico [49]. However, the effect on annual radial growth depends on the timing of these atmospheric disturbances, influencing ring size in the same growth year or the following growing season [50].
Drought episodes were more frequent than wet episodes in the precipitation reconstructions, consistent with other rainfall reconstructions in the region [32]. We focused on highlighting years with low rainfall or extreme droughts, given the importance of these events in northeastern Mexico. The P. mexicana chronology highlights two extreme drought episodes: the first between 1952 and 1962, and the second between 1971 and 1975. Additionally, a high frequency of dry years occurred in the last two decades of the reconstruction. The P. martinezii precipitation reconstruction indicates a period of extreme drought between 1827 and 1831 but also reveals a concerning trend of increased dry years during the last four decades of the reconstruction, suggesting a shift toward more arid conditions in the recent past.
The 1950s drought in northern Mexico was a severe and prolonged event that significantly affected food availability and led to widespread migration from rural areas to urban centers and across the border into the United States. The years 1948, 1953, 1955, 1957, and 1961 were particularly dry [32,51,52].
In northeastern Mexico, droughts tend to recur roughly every 50 to 60 years, clustering around the middle and end of each century. This pattern has been observed in past drought reconstructions and aligns with reports of prolonged dry periods in the region [32,33,53].

4.3. Influence of the SST’s and ENSO Phenomenon on the Precipitation Reconstructions

In northern Mexico and the southwestern United States, tree-ring-width variability is influenced by winter–spring precipitation, which is positively correlated with the warm phase of the El Niño–Southern Oscillation (ENSO), also known as El Niño. This means that during El Niño events, these regions tend to experience increased precipitation in the winter and spring months, leading to wider tree rings [27,54]. Based on this relationship, we analyzed how the reconstructed seasonal precipitation for P. mexicana and P. martinezii correlates with the SSTs averaged from January to May. The results reveal a significant association between precipitation patterns in the Tropical Pacific and the Pacific Northwest Coast, with a stronger connection observed for the P. martinezii precipitation reconstruction (Figure 9). This relationship is likely influenced by various circulatory phenomena, with ENSO playing a dominant role. While other factors such as the Pacific Decadal Oscillation (PDO) also affect climate variability in northwestern and northeastern Mexico, the findings suggest a stronger influence of ENSO on the observed connection [55].
The influence of ENSO on precipitation in northern Mexico is not uniform and is affected by local environmental conditions. Specifically, the northeastern region tends to experience a weaker ENSO effect, with factors such as topography, elevation, and prevailing wind patterns playing significant roles in modulating the impact [56]. The observed precipitation patterns in P. mexicana and P. martinezii, showing significant frequencies below 7.0 cycles per year (Figure 10), can be attributed to the ENSO teleconnection pattern. ENSO events, characterized by fluctuations in sea surface temperatures in the tropical Pacific, typically occur at intervals of 2–7 years and have a documented influence on weather patterns in northern Mexico [57,58].
The influence of ENSO on tree growth observed in northeastern Mexico is consistent with findings from other ENSO-sensitive regions. For instance, dendroclimatic studies in the southwestern United States have demonstrated strong positive correlations between ring-width indices and winter–spring precipitation during the El Niño years [59,60,61]. Similarly, in northern South America, tree growth has been shown to respond positively to the wet conditions associated with ENSO [62,63], whereas in Southeast Asia, growth has been linked to the negative ENSO phase (La Niña) [64,65]. These global examples highlight the broad climatic reach of ENSO, while regional differences such as the magnitude and seasonality of precipitation help explain the distinct growth responses observed in P. mexicana and P. martinezii.

5. Conclusions

The observed climatic response of the species in this study indicates the potential effect that these rising temperatures and decreasing precipitation may have on the ecological stability of these relict spruce populations of the Sierra Madre Oriental in eastern Mexico. Appropriate measures should be considered to promote the conservation of these threatened spruce population relicts. Tree-ring series were developed from relict populations of P. mexicana and P. martinezii distributed in the Sierra Madre Oriental. The longest Pmex chronology extended from 1786 to 2020 (235 years), whereas the Pmar chronology ranged from 1746 to 2020 (275 years). Both chronologies responded similarly to climatic variables, showing a positive response to accumulated January–May precipitation and a negative response to maximum temperature during the same period. The significant response of the P. mexicana and P. martinezii chronologies to precipitation enabled the development of linear regression models for reconstructing January–May seasonal precipitation. Dry and wet years were common in both reconstructions, although Pmex was more affected by extreme drought events. This information confirms the potential value of spruce species for climate reconstruction and their high sensitivity to changes in precipitation.
Large-scale climate forcing phenomena, such as ENSO, appear to play a significant role in shaping the climate patterns of this region; however, further research is needed to confirm and refine this observation. While ENSO’s impact is known to be more pronounced in other parts of northern Mexico, understanding its influence on the dominant climate patterns of this specific region requires additional investigation.
The observed climatic response of the species in this study indicates the potential effects that rising temperatures and decreasing precipitation may have on the ecological stability of these relict spruce populations in the Sierra Madre Oriental of eastern Mexico. Appropriate measures should be considered to promote the conservation of these threatened spruce population relicts.

Author Contributions

Conceptualization C.W.; methodology: J.V.-D. and O.A.D.-C.; formal analysis: O.A.D.-C. and J.V.-D.; writing—original draft preparation: O.A.D.-C. and J.V.-D.; writing review and editing: J.V.-D. and C.W.; funding acquisition: C.W. All authors have read and agreed to the published version of the manuscript.

Funding

This research was funded by the Mixed Fund of the National Forest Commission (CONAFOR) and the National Agency of Science, Humanities and Technology of Mexico (SECIHTI), grant number CONAFOR-CONACYT-2017-4-292615), awarded to Christian Wehenkel.

Institutional Review Board Statement

Not applicable.

Informed Consent Statement

Not applicable.

Data Availability Statement

Instrumental precipitation data and reconstructed drought indices (SPI) is available in the public domain (http://drought.memphis.edu/NASPA/, accessed on 12 December 2024). Niño 3.4 indices were available in the public domain (climatedataguide.ucar.edu/climate-data/nino-sst-indices-nino-12-3-34-4-oni-and-tni, accessed on 21 November 2024).

Acknowledgments

We appreciate the technical support provided by José Manuel Zúñiga-Vásquez and Citlalli Cabral-Alemán, currently in a postdoctoral stay in the Laboratorio de Dendrocronología of INIFAP, who designed the figures and developed a critical technical review of the paper.

Conflicts of Interest

The authors declare no conflicts of interest.

References

  1. Cook, B.I.; Mankin, J.S.; Anchukaitis, K.J. Climate change and drought: From past to future. Curr. Clim. Chang. Rep. 2018, 4, 164–170. [Google Scholar] [CrossRef]
  2. Wilhite, D.A.; Svoboda, M.D.; Hayes, M.J. Understanding the complex impacts of drought: A key to enhancing drought mitigation and preparedness. Water Resour. Manag. 2007, 21, 763–774. [Google Scholar] [CrossRef]
  3. Robb, K. The Rio Grande/Rio Bravo Water Delivery Under the 1944 Treaty: A Compendium of Ideas. Executive Summary Prepared at the Request of the United States International Boundary and Water Commission. 2022. Available online: https://www.ibwc.gov/wp-content/uploads/2023/04/Exec_Rio_Grande_White_Paper_-Summary-FINAL.pdf (accessed on 15 May 2025).
  4. Instituto Mexicano para la Competitividad (IMCO). México Enfrenta Sequías Sin Recursos Suficientes: Presupuesto 2024 para la Comisión Nacional del Agua. 2023. Available online: https://imco.org.mx/mexico-enfrenta-las-sequias-sin-recursos/ (accessed on 9 May 2025).
  5. Comision Nacional del Agua [CONAGUA]. Información Estadística Climatológica. 2023. Available online: https://smn.conagua.gob.mx/es/climatologia/informacion-climatologica/informacion-estadistica-climatologica (accessed on 8 May 2025).
  6. Pacheco-Treviño, S.; Manzano-Camarillo, M. The Socioeconomic dimensions of water scarcity in urban and rural Mexico: A comprehensive assessment of sustainable development. Sustainability 2024, 16, 1011. [Google Scholar] [CrossRef]
  7. Wright, K.T.; Johnson, K.R.; Bhattacharya, T.; Marks, G.S.; McGee, D.; Elsbury, D.; Peings, Y.; Lacaille-Muzquiz, J.-L.; Lum, G.; Beramendi-Orozco, L.; et al. Precipitation in Northeast Mexico primarily controlled by the relative warming of Atlantic SSTs. Geophys. Res. Lett. 2022, 49, e2022GL098186. [Google Scholar] [CrossRef]
  8. Meko, D.M.; Touchan, R.; Villanueva-Diaz, J.; Griffin, D.; Woodhouse, C.A.; Castro, C.L.; Carrillo, C.; Leavitt, S.O. Sierra San Pedro Martir, Baja California cool-season precipitation reconstructed from earlywood width of Abies concolor tree rings. JGR Biogeosci. 2013, 118, 1660–1673. [Google Scholar] [CrossRef]
  9. Mendoza-Maya, E.; Espino-Espino, J.; Quiñonez-Pérez, C.Z.; Flores-López, C.; Wehenkel, C.; Vargas-Hernández, J.; Sáenz-Romero, C. Proposal for conservation of three endangered species of Mexican spruce. Rev. Fitotec. Mex. 2015, 38, 235–247. [Google Scholar]
  10. Mendoza-Maya, E.; Gómez-Pineda, E.; Sáenz-Romero, C.; Hernández-Díaz, J.C.; López-Sánchez, C.A.; Vargas-Hernández, J.J.; Prieto-Ruiz, J.A.; Wehenkel, C. Assisted migration and the rare endemic plant species: The case of two endangered Mexican spruces. PeerJ 2022, 10, e13812. [Google Scholar] [CrossRef] [PubMed]
  11. Sáenz-Romero, C.; Larter, M.; González-Muñoz, N.; Wehenkel, C.; García-Blanco, A.; Castellanos-Acuña, D.; Burlett, R.; Delzon, S. Mexican conifers differ in their capacity to face climate. J. Plant Hydraul. 2024, 4, e203. [Google Scholar] [CrossRef]
  12. Ledig, T.; Hodgskiss, P.D.; Jacob-Cervantes, V. Genetic diversity, mating system, and conservation of a Mexican subalpine relicty, Picea mexicana Martínez. Conserv. Genet. 2002, 3, 113–122. [Google Scholar] [CrossRef]
  13. Cabral-Alemán, C.; Pompa-García, M.; Acosta-Hernández, A.C.; Zúñiga-Vásquez, J.M.; Camarero, J.J. Earlywood and latewood widths of Picea chihuahuana show contrasting sensitivity to seasonal climate. Forests 2017, 8, 173. [Google Scholar] [CrossRef]
  14. Díaz-Carrillo, Ó.A.; Wehenkel, C.A.; Villanueva-Díaz, J.; Hernández-Díaz, J.C. Serie dendrocronológica de Picea mexicana Martínez en La Sierra Madre Oriental. Rev. Mex. Agroecosistemas 2022, 9, 1–7. [Google Scholar]
  15. Segura-Sanchez, C.A.; Hernández-Velasco, J.; Villanueva-Díaz, J.; Chano, V.; Hernández-Díaz, J.C.; Mendoza-Maya, E.; Carrillo-Parra, A.; Wehenkel, C. Dendrogenomic resilience mechanisms of two endangered Mexican spruces. Plant Diverity 2025, in press. [Google Scholar] [CrossRef]
  16. Arreola-Ortíz, M.R.; González-Elizondo, M.; Návar-Cháidez, J. Dendrocronología de Pseudotsuga menziesii (Mirb.) Franco de la Sierra Madre Oriental en Nuevo León, México. Madera Y Bosques 2009, 16, 71–85. [Google Scholar] [CrossRef]
  17. Ledig, F.T.; Mapúla-Larreta, M.; Bermejo-Velázquez, B.V.; Reyes-Hernández, V.; Flores-López, C.; Capó-Ortega, M.A. Locations of endangered spruce populations in Mexico and the demography of Picea chihuahuana. Madroño 2000, 47, 71–88. [Google Scholar]
  18. Fritts, H. Tree and Climate; Academic Press: New York, NY, USA, 1976; p. 567. [Google Scholar]
  19. Stokes, M.A.; Smiley, T.L. An Introduction to Tree-Ring Dating; The University of Chicago Press: Chicago, IL, USA, 1968. [Google Scholar]
  20. Douglas, A.E. Crossdating in dendrochronology. J. For. 1941, 39, 825–832. [Google Scholar]
  21. Holmes, R.L. Computer-Assisted Quality Control in Tree-Ring Dating and Measurement. Tree-Ring Bull. 1983, 43, 69. [Google Scholar]
  22. Wigley, T.M.; Briffa, K.R.; Jones, P.D. On the Average Value of Correlated Time Series, with Aplications in Dendroclimatology and Hidrometeorology. J. Clim. Appl. Meteorol. 1984, 23, 201–213. [Google Scholar] [CrossRef]
  23. Bunn, A.; Korpela, M.; Biondi, F.; Campelo, F.; Merian, P.; Qeadan, F.; Zang, C.; Pucha, C.; Wernick, J. dplR: Dendrochronology Program Library in R. R Package Version 1.6.7. 2018. Available online: https://r-forge.r-project.org/projects/dplr/ (accessed on 10 April 2025).
  24. Cook, E.R. The decomposition of tree-ring series for environmental studies. Tree-Ring Bull. 1987, 47, 37–59. [Google Scholar]
  25. Cook, E.R.; Kairiukstis, L.A. (Eds.) Methods of Dendrochronology: Applications in the Environmental Sciences; Kluwer Academic Publishers: Dordrecht, The Netherlands, 2013. [Google Scholar]
  26. Fritts, H. Reconstructing Large-Scale Climatic Patterns from Tree-Ring Data: A Diagnostic Analysis; The University of Arizona Press: Tucson, AZ, USA, 1991; p. 286. [Google Scholar]
  27. Stahle, D.W.; Cook, E.R.; Burnette, D.J.; Torbenson, M.C.A.; Howard, I.M.; Griffin, D.; Villanueva-Diaz, J.; Cook, B.I.; Williams, A.P.; Watson, E.; et al. Dynamics, variability, and change in seasonal precipitation reconstructions for North America. J. Clim. 2020, 33, 3173–3194. [Google Scholar] [CrossRef]
  28. Burnette, D.J. The Tree-Ring Drought Atlas Portal: Gridded drought reconstructions for the past 500–2000 years. BAMS 2021, 102, 953–956. [Google Scholar] [CrossRef]
  29. Trouet, V.; Van Oldenborgh, G.J. KNMI Climate Explorer: A web-based research tool for high-resolution paleoclimatology. Tree-Ring Res. 2013, 69, 3–13. [Google Scholar] [CrossRef]
  30. Mann, M.E.; Lees, J.M. Robust estimation of background noise and signal detection in climatic time series. Clim. Chang. 1996, 33, 409–445. [Google Scholar] [CrossRef]
  31. McPhaden, M.J.; Zebiak, S.E.; Glantz, M.H. ENSO as an integrating concept in earth science. Science 2006, 314, 1740–1745. [Google Scholar] [CrossRef] [PubMed]
  32. Contreras-Mata, L.; Astudillo-Sánchez, C.C.; Alanís-Rodríguez, E.; Treviño-Carreón, J.; Mora-Olivo, A.; Soria-Díaz, L. Dendrochronological potential of weeping pinyon (Pinus pinceana Gordon) in Tamaulipas, Mexico. Rev. Chapingo Ser. Cienc. For. Y Del Ambiente 2024, 30, 107. [Google Scholar] [CrossRef]
  33. Villanueva-Díaz, J.; Vázquez-Selem, L.; Estrada-Ávalos, J.; Martínez-Sifuentes, A.R.; Cerano-Paredes, J.; Canizales-Velázquez, P.A.; Franco-Ramos, O.; Reyes-Camarillo, F.R. Hydroclimatic Behavior of Conifers at Cerro El Potosí, Nuevo León, México. Rev. Mex. Cien. For. 2018, 9, 166–187. [Google Scholar]
  34. Arroyo-Morales, S.; Astudillo-Sanchez, C.C.; Aguirrre-Calderon, O.A.; Villanueva-Diaz, J.; Soria-Diaz, L.; Martinez-Sifuentes, A.R. A precipitation reconstruction based on pinyon pine tree rings from the northeastern Mexican subtropic. Theor. Appl. Climatol. 2023, 151, 635–649. [Google Scholar] [CrossRef]
  35. Brienen, R.J.W.; Lebrija-Trejo, E.; Zuidema, P.A.; Martinez-Ramos, M. Climate-growth analysis for a Mexican dry forest tree shows strong impact of sea surface temperatures and predicts future growth declines. Glob. Change Biol. 2010, 16, 2001–2012. [Google Scholar] [CrossRef]
  36. Stahle, D.W.; Villanueva-Diaz, J.; Burnette, D.J.; Cerano-Paredes, J.; Heim, R.R., Jr.; Fye, F.K.; Acuna-Soto, R.; Therrell, M.D.; Cleaveland, M.K.; Stahle, D.K. Major Mesoamerican droughts of the past millennium. Geophys. Res. Lett. 2011, 38, 2–5. [Google Scholar] [CrossRef]
  37. Gutiérrez-García, G.; Ricker, M. Climate influence on radial growth in four conifer species in the Sierra de San Antonio Peña Nevada (Nuevo León, Mexico). Rev. Mex. Biodivers. 2019, 90, e902676. [Google Scholar]
  38. Panthi, S.; Bräuning, A.; Zhou, Z.K.; Fan, Z.X. Tree rings reveal recent intensified spring drought in the central Himalaya, Nepal. Glob. Planet. Chang. 2017, 157, 26–34. [Google Scholar] [CrossRef]
  39. Zhu, L.; Cooper, D.J.; Yang, J.; Zhang, X.; Wang, X. Rapid warming induces the contrasting growth of Yezo spruce (Picea jezoensis var. microsperma) at two elevation gradient sites of northeast China. Dendrochronologia 2018, 50, 52–63. [Google Scholar] [CrossRef]
  40. Lefèvre, F.; Boivin, T.; Bontemps, A.; Courbet, F.; Davi, H.; Durand-Gillmann, M.; Fady, B.; Gauzere, J.; Gidoin, C.; Karam, M.-J.; et al. Considering evolutionary processes in adaptive forestry. Ann. For. Sci. 2013, 71, 723–739. [Google Scholar] [CrossRef]
  41. Rathgeber, C.B.K.; Fonti, P.; Shishov, V.; Rozenberg, P. Wood formation and tree adaptation to climate. Ann. For. Sci. 2019, 76, 109. [Google Scholar] [CrossRef]
  42. Meko, D.M.; Stockton, C.W.; Boggess, W.R. The tree-ring record of severe sustained drought. J. Am. Water Resour. Assoc. 1995, 31, 789–801. [Google Scholar] [CrossRef]
  43. Lauer, W.; Klaus, D. Geoecological investigations on the timberline of Pico de Orizaba, México. Artic Alp. Res. 1975, 7, 315–330. [Google Scholar] [CrossRef]
  44. IPCC. Climate Change: Synthesis Report. Contribution of Working Groups I, II and III to the Fifth Assessment Report of the Intergovernmental Panel on Climate Change; IPCC: Geneva, Switzerland, 2014; p. 151. [Google Scholar]
  45. Barber, V.A.; Juday, G.P.; Finney, B.P. Reduced growth of Alaskan white spruce in the twentieth century from temperature-induced drought stress. Nature 2000, 405, 668–673. [Google Scholar] [CrossRef] [PubMed]
  46. Sidor, C.G.; Popa, I.; Vlad, R.; Cherubini, P. Different tree-ring responses of Norway spruce to air temperature across an altitudinal gradient in the Eastern Carphians (Romania). Trees 2015, 29, 985–997. [Google Scholar] [CrossRef]
  47. Sánchez-Santillán, N.; Garduño-López, R.; Vidal-Zepeda, R.; Sánchez-Trejo, R. Climate change in NE Mexico: Influence of the North Atlantic Oscillation. Investig. Geográficas 2012, 78, 7–18. [Google Scholar] [CrossRef]
  48. Wehenkel, C.; González-Elizondo, M.S.; Mendoza-Maya, E.; Hernández-Diaz, J.C.; Quiñones-Pérez, C.Z. Distribución, ecología y estado de conservación de Las Piceas Mexicanas. Las Piceas (Picea, Pinaceae) de México, 1st ed.; González Elizondo, M.S., Wehenkel, C., Eds.; Comisión Nacional Forestal: Zapopan, México, 2022; pp. 28–55. [Google Scholar]
  49. Rosengaus, M.M.; Jimenez-Espinoza, M.; Vázquez-Conde, M.T. Atlas Climatológico de Ciclones Tropicales en Mexico. Centro Nacional de Prevención de Desatres. Cd. de México, México. 2022. Available online: https://www.cenapred.unam.mx/es/Publicaciones/archivos/37.pdf (accessed on 22 April 2025).
  50. Schweingruber, F.H. Tree Rings and Environment: Dendroecology; Birmennsdorf, Swish Federal Institute for Forest, Snow, and Landscape Research; Berne, Stuttgart, Vienna, Haupt; WSL/FNP: Birmendsdorf, Switzerland, 1996; p. 609. [Google Scholar]
  51. Stahle, D.W.; Cook, E.R.; Villanueva-Diaz, J.; Fye, F.K.; Burnnette, D.J.; Griffin, D.; Acuna-Soto, R.; Seager, R.; Heim, R.R., Jr. Early 21st-century drought in Mexico. Eos Trans. Am. Geophys. Union 2009, 90, 69–90. [Google Scholar] [CrossRef]
  52. Florescano, M.E.; Swan, S. Breve Historia de la Sequía en México; Biblioteca Universidad Veracruzana: Veracruz, México, 1995; p. 246. [Google Scholar]
  53. Seager, R.; Ting, M.; Davis, M.; Cane, M.; Naik, N.; Nakamura, J.; Li, C.; Cook, E.; Stahle, D.W. Mexican drought: An observational modeling and tree ring study of variability and climate change. Atmósfera 2009, 22, 1–31. [Google Scholar]
  54. Cleaveland, M.K.; Stahle, D.W.; Therrell, M.D.; Villanueva-Diaz, J.; Burns, B.T. Tree-ring reconstructed winter precipitation and tropical teleconnections in Durango, Mexico. Clim. Chang. 2003, 59, 369–388. [Google Scholar] [CrossRef]
  55. Mijarez-Fajardo, R.; Lobato-Sánchez, R.; Patiño-Gómez, C.; Guevara-Polo, D.E. Atlantic and Pacific Sea surface temperature correlations with precipitation over northern Mexico. Atmósfera 2023, 38, 217–234. [Google Scholar] [CrossRef]
  56. Comrie, A.C.; Glenn, E.C. Principal components-based regionalization of precipitation regimes across the southwest United States and northern Mexico, with an application to monsoon precipitation variability. Clim. Res. 1999, 10, 201–215. [Google Scholar] [CrossRef]
  57. Stahle, D.W.; D’Arrigo, R.D.; Krusic, P.J.; Ceaveland, M.K.; Cook, E.R.; Allan, R.J.; Cole, J.E.; Dunbar, R.B.; Therrell, M.D.; Gay, D.A.; et al. Experimental dendroclimatic reconstruction of the Southern Oscillation. Bull. Am. Meteorol. Soc. 1998, 79, 2137–2152. [Google Scholar] [CrossRef]
  58. Magaña, V.; Pérez, J.L.; Conde, C. El Niño y la Oscilación de Sur, sus impactos en Mexico. Ciencias 2009, 51, 14–18. [Google Scholar]
  59. D’Arrigo, R.D.; Jacoby, G.C. A 1000-year record of winter precipitation from northwestern New Mexico, USA: A reconstruction from tree-rings and its relation to El Niño and the Southern Oscillation. Holocene 1991, 1, 95–101. [Google Scholar] [CrossRef]
  60. Cook, E.R.; Woodhouse, C.A.; Eakin, C.M.; Meko, D.M.; Stahle, D.W. Long-term aridity changes in the western United States. Science 2004, 306, 1015–1018. [Google Scholar] [CrossRef] [PubMed]
  61. George, S.S. An overview of tree-ring width records across the Northern Hemisphere. Quat. Sci. Rev. 2014, 95, 132–150. [Google Scholar] [CrossRef]
  62. Perone, A.; Lombardi, F.; Marchetti, M.; Tognetti, R.; Lasserre, B. Evidence of solar activity and El Niño signals in tree rings of Araucaria araucana and A. angustifolia in South America. Glob. Planet. Chang. 2016, 145, 1–10. [Google Scholar] [CrossRef]
  63. Rodriguez-Caton, M.; Andreu-Hayles, L.; Daux, V.; Vuille, M.; Varuolo-Clarke, A.M.; Oelkers, R.; Christie, D.A.; D’Arrigo, R.; Morales, M.S.; Rao, M.P.; et al. Hydroclimate and ENSO variability recorded by oxygen isotopes from tree rings in the South American Altiplano. Geophys. Res. Lett. 2022, 49, e2021GL095883. [Google Scholar] [CrossRef]
  64. Su, H.; Axmacher, J.C.; Yang, B.; Sang, W. Differential radial growth response of three coexisting dominant tree species to local and large-scale climate variability in a subtropical evergreen broad-leaved forest of China. Ecol. Res. 2015, 30, 745–754. [Google Scholar] [CrossRef]
  65. Rahman, M.; Islam, M.; Wernicke, J.; Bräuning, A. Changes in sensitivity of tree-ring widths to climate in a tropical moist forest tree in Bangladesh. Forests 2018, 9, 761. [Google Scholar] [CrossRef]
Figure 1. (a) Geographical locations of P. mexicana (El Coahuilon, La Marta) and P. martinezii (Agua Fria, El Butano, La Encantada) and of nearby weather stations, (b) Saltillo, (c) Peña Nevada, and (d) Ignacio de Texas in the Sierra Madre Oriental, Mexico. Ppt stands for precipitation, MaxT for maximum temperature, and MinT for minimum temperature.
Atmosphere 16 00863 g001
Figure 2. Principal component analysis loading plot for the P. mexicana (LMA and ECO populations) and P. martinezii (AFI, BUT and LEN populations) ring width chronologies. The PC1 composed of the series LMA and ECO explained 58.8% of the common variance, while the PC2 composed of AFI, LEN, and BUT explained 33.6% of the variance.
Atmosphere 16 00863 g002
Figure 3. Representative chronology of P. mexicana (Pmex), combined from the ECO and LMA sites. The solid red line below shows the EPS value; the dotted red line indicates the year from which EPS was greater than 0.85. The grey shaded area indicates the sample depth.
Atmosphere 16 00863 g003
Figure 4. Representative chronology of P. matinezii (Pmar), combined from the AFI, LEN and BUT sites. The solid red line below shows the EPS value; the dotted red line indicates the year from which the EPS was greater than 0.85. The grey shaded area indicates the sample depth.
Atmosphere 16 00863 g004
Figure 5. Correlation coefficients between the ring width indices (RWI) of the P. mexicana (Pmex) (a) and the P. matinezii (Pmar) (b) with monthly precipitation and mean monthly maximum temperature data from the Saltillo weather station. Months shown in lowercase letters with the suffix “p” correspond to the previous year. The dashed horizontal lines indicate a 95% confidence interval. Values above (below) the dashed lines are statistically significant (p < 0.05). The pink shaded box indicates the correlation with the accumulated precipitation and mean maximum temperature from January to May.
Atmosphere 16 00863 g005
Figure 6. Plots showing (a) the relationship between the RWI of Pmex and recorded precipitation from the Saltillo weather station, (b) the correlation and synchronicity between observed and reconstructed precipitation, and (c) the full extent of the January–May seasonal precipitation reconstruction based on the Pmex chronology. SD is the standard deviation.
Atmosphere 16 00863 g006
Figure 7. Plots showing (a) the relationship between the RWI of Pmar and recorded precipitation from the Saltillo weather station, (b) the correlation and synchronicity between observed and reconstructed precipitation, and (c) the full extent of the January–May seasonal precipitation reconstruction based on the Pmar chronology. SD is the standard deviation.
Atmosphere 16 00863 g007
Figure 8. Comparison between the (a) Pmex and (b) Pmar reconstructed precipitation series and both (c) the reconstructed seasonal precipitation and (d) Standardized Precipitation Index (SPI) values from the North American Seasonal Precipitation Atlas (NASPA).
Atmosphere 16 00863 g008
Figure 9. Spatial correlation maps between (a) the reconstructed January–May seasonal precipitation for Pmex and the average ERSST v5 SST and (b) the reconstructed January–May seasonal precipitation for Pmar and the average ESST v5 SST, generated using the KNMI Climate Explorer. The legend indicates correlation coefficients, while green and pink dots represent the locations of Pmex and Pmar, respectively.
Atmosphere 16 00863 g009
Figure 10. Power spectrum analysis of (a) the precipitation reconstructed with Pmex and (b) the precipitation reconstructed with Pmar. Significant frequencies < 7.0 cycles/year were detected for both reconstructions. CI = confidence interval.
Atmosphere 16 00863 g010
Table 1. Geographical location and mean climatic variables of weather stations close to the spruce sampling sites.
Weather
Station
Latitude
N (°)
Longitude
W (°)
Elevation (m)Data Recording PeriodPpt (mm)MaxT (°C)MinT
(°C)
Saltillo25.43−101.0017001948–201357825.711.1
Ignacio de Texas24.31−100.1816801981–201834626.28.8
Peña Nevada23.74−99.9814911981–201839224.87.6
Ppt = Mean monthly precipitation (mm), MaxT = Mean monthly maximum temperature (°C), MinT = Mean monthly minimum temperature (°C).
Table 2. Values of the dendrochronological parameters of the P. mexicana and P. martinezii chronologies (residual version) distributed along the Sierra Madre Oriental, Mexico.
SiteIDAge of Trees Cores/TreesPeriod1 MS2 AC13 EPS4 Rbar5 SNR
El CoahuilonECO11–22453/251782–20200.250.030.910.3211.3
La MartaLMA24–17049/241844–20200.310.040.960.4625.6
Agua FriaAFI34–17340/251848–20200.380.010.860.306.6
El ButanoBUT23–204109/461736–20200.400.020.940.3219.7
La EncantadaLEN22–18655/351833–20200.330.030.950.4316.3
1 MS = Average Mean Sensitivity, 2 AC1 = First-Order Autocorrelation, 3 EPS = Strength Population Signal, 4 Rbar = Mean Series Intercorrelation, 5 SNR = Signal-to Noise Ratio, P. mexicana (ECO, LMA) and P. martinezii (AFI, BUT, LEN).
Table 3. Matrix of Pearson correlation coefficients of ring width series of the two P. mexicana populations (ECO and LMA) and three P. martinezii populations (AFI, BUT and LEN) for the common period 1853–2020.
ChronologiesECOLMAAFIBUTLEN
ECO1.00----
LMA0.72 **1.00---
AFI0.43 *0.51 **1.00--
BUT0.53 **0.58 **0.51 **1.00-
LEN0.28 *0.35 *0.39 *0.48 *1.00
* p < 0.05; ** p < 0.01.
Table 4. Statistical tests of the calibration-verification process for the RWI of Pmex, Pmar, and seasonal precipitation data for the period 1961–2011. Ppt: Reconstructed precipitation (mm) for the seasonal period January–May for Pmex and Pmar, RWI: Ring width indices of the residual versions of the Pmex and Pmar chronologies.
Pmex model: P p t = 44.6 + 124.71 × R W I
Periodrr2Reduction of ErrorT-valueSign-ProductsNegative First Difference
Calibration1961–19860.670 *0.449 *0.433 *3.16 *7 *9 NS
Verification1987–20110.560 *0.314 *0.147 *4.05 *13 NS8 NS
Pmar model: P p t = 100.4 + 198.5 × R W I
Periodrr2Reduction of ErrorT-valueSign-Products Negative First Difference
Calibration1961–19860.780 *0.610 *0.588 *3.69 *8 NS4 *
Verification1987–20110.630 *0.400 *0.415 *3.15 *5 *4 *
* Significant (p < 0.05).
Disclaimer/Publisher’s Note: The statements, opinions and data contained in all publications are solely those of the individual author(s) and contributor(s) and not of MDPI and/or the editor(s). MDPI and/or the editor(s) disclaim responsibility for any injury to people or property resulting from any ideas, methods, instructions or products referred to in the content.

