Essay

Research on Ship Carbon-Emission Monitoring Technology and Suggestions on Low-Carbon Shipping Supervision System

1
Transport Planning and Research Institute, Ministry of Transport, Beijing 100028, China
2
Laboratory of Transport Pollution Control and Monitoring Technology, Transport Planning and Research Institute, Ministry of Transport, Beijing 100028, China
3
Hangzhou Chunlai Technology Co., Ltd., Hangzhou 310053, China
*
Authors to whom correspondence should be addressed.
Atmosphere 2025, 16(7), 773; https://doi.org/10.3390/atmos16070773
Submission received: 28 March 2025 / Revised: 4 June 2025 / Accepted: 18 June 2025 / Published: 24 June 2025
(This article belongs to the Special Issue Recent Advances in Mobile Source Emissions (2nd Edition))

Abstract

Ship carbon-emission monitoring is critical for implementing the IMO’s GHG reduction strategy. This study comprehensively introduces four methods for ship carbon monitoring and carbon calculation and systematically compares four vessel CO2-monitoring methodologies, assessing their accuracy, influencing factors, real-time performance, and regulatory applicability. The analysis of China’s current carbon supervision framework informs proposed enhancements for low-carbon shipping governance.

1. Introduction

The rapid expansion of the international maritime sector has substantially driven global trade and economic development yet simultaneously triggered a marked escalation in greenhouse gas (GHG) emissions (CO2, CH4, N2O) and atmospheric pollutants (SO2, NOₓ, PM2.5, etc.). In the third IMO GHG study, it was found that the global shipping industry emitted over 1.056 billion tons of carbon dioxide in 2018 [1]. Under a business-as-usual (BAU) scenario, projected CO2 emissions from maritime operations could quintuple by 2050, potentially contributing 18% of total anthropogenic GHG emissions [2]. This alarming trajectory has intensified global demands for robust carbon regulation frameworks within the shipping industry. Therefore, it is of significant importance to develop a green and low-carbon shipping regulatory system to enhance the monitoring and control of carbon emissions for the industry.
To systematically regulate maritime carbon emissions, the Marine Environment Protection Committee (MEPC) of the International Maritime Organization (IMO) has enacted revised MARPOL Annex VI regulations, establishing mandatory Energy Efficiency Existing Ship Index (EEXI) and Carbon Intensity Indicator (CII) standards for in-service vessels [3]. In May 2023, the European Union expanded its Monitoring, Reporting, and Verification (MRV) framework to include CO2, CH4, and N2O emissions from maritime operations, with compliance mechanisms for CH4 and N2O taking effect in 2026 [4]. That same year, the EU Emissions Trading System (EU ETS) Maritime Provisions (Regulation (EU) 2023/1804) stipulate that from 2024, coverage includes intra-EU voyages and 50% of emissions from extra-EU voyages, requiring ship-owners to surrender allowances per ton of CO2 emitted. Concurrently, FuelEU Maritime (Regulation (EU) 2023/957) mandates implementation from 2025, enforcing annual reductions in Well-to-Wake (WtW) GHG intensity of ship energy, with penalties of EUR 2,400 per ton of non-compliant fuel equivalent. These measures align with the 2023 IMO Strategy on Reduction of GHG Emissions from Ships, which projects international shipping emissions to peak by 2030 and achieve net-zero status by 2050 [5]. As a leading maritime nation, China has implemented rigorous policies to align with global standards. The 2023 IMO strategy has mandated China’s compliance with international carbon intensity rules since 2023, supported by the adoption of the Ship Energy Efficiency Management Plan (SEEMP) and mandatory energy consumption reporting [6]. Furthermore, the China Classification Society (CCS) has developed technical guidelines, including the Implementation Guidelines for Monitoring, Reporting, and Verification of Ship CO2 Emissions and the Certification of Full Lifecycle Greenhouse Gas Emission Intensity of Marine Fuels (2023), to address methodological gaps in emission quantification [7,8,9]. These initiatives operationalize a unified global framework for maritime decarbonization. As a critical enabler for achieving low-carbon goals in the shipping industry, maritime carbon-emission monitoring technologies have received limited focus in the literature regarding systematic analysis and synthesis. This study addresses this gap through a comprehensive examination of vessel carbon monitoring and accounting methodologies, providing actionable insights for the development of China’s low-carbon shipping monitoring system based on direct measurement methodologies.

2. Ship Carbon Monitoring and Carbon Calculation Methods

Ship carbon-emission monitoring technologies refer to a series of methods and equipment used to measure and calculate CO2 emissions during vessel operations. The EU MRV (Monitoring, Reporting, and Verification) framework and IMO DCS (Data Collection System) specify four carbon monitoring methodologies: bunker delivery note (BDN) tracking and periodic fuel tank inventory checks, onboard bunker fuel oil-tank monitoring, flow-meter monitoring for fuel combustion processes, and direct CO2-emission monitoring. The first three methods are classified as indirect monitoring approaches, which monitor fuel types and consumption quantities and calculate total carbon emissions using fuel-specific carbon emission factors. In contrast, the direct CO2-emission monitoring method employs the real-time monitoring of CO2 concentration and exhaust gas flow rates to determine total emissions.

2.1. Indirect Monitoring

Fuel combustion is the source of carbon emissions of ships; it produces a large amount of CO2. Specifically, the source of emission includes the main engine, auxiliary engine, gas turbine, inert gas generator, and boiler of the ship, all of which use different types of fuel. Therefore, the CO2 emission factors used for indirect monitoring are also different [10], which is shown in Table 1 [7].
The IPCC Good Practice Guidelines and Uncertainty Management for National Greenhouse Gas Inventories have proposed two GHG calculation methods: Tier 1 and Tier 2. For shipping, it is recommended by the IPCC committee that Tier 1 shall be used to calculate CO2 emissions of ships, while Tier 2 should be used for CH4 and N2O, shown as follows:
Tier 1 method to calculate CO2 emissions [14]:
M C O 2 = i F C i C F i , C O 2
Tier 2 method to calculate CH4 and N2O emissions:
M C H 4 & N 2 O = i ( C F i , C H 4 + C F i , N 2 O )
F C i is the actual consumption of fuel i, ton, and C F i is the emission factor (ton of CO2/ton of fuel).

2.1.1. BDN Tracking and Periodic Fuel Tank Inventory Checks

This method can calculate the fuel consumption during the reporting period based on opening inventory, bunker deliveries, and closing inventory. The equation is as follows:
Fuel Consumption = Opening Inventory + Bunker Deliveries − Closing Inventory − Transfers-out
The amount of fuel bunkered is calculated by BDN, which is an important document used to record detailed information (shown in Table 2) about fuel received by ships in accordance with Annex VI of the MARPOL Convention of IMO. BDN is provided by fuel suppliers and normally includes the following information:
This method can only estimate the overall fuel consumption of the ship and is unable to distinguish the carbon emission sources with high accuracy. It can only be used for those ships whose fuel and emission areas remain unchanged.

2.1.2. Bunker Fuel Oil-Tank Monitoring Onboard

This method can measure the liquid level of the ship’s oil tank with monitoring equipment, such as liquid level sensors or image recognition devices. The volume of the fuel in the tank can be obtained with lateral depth measurement, and then the mass of the fuel can be converted based on the fuel density, which can be obtained through onboard measurement systems, BDN, or recognized laboratory measurements. The equation is as follows:
The fuel consumption for each voyage at sea = the fuel inventory of the fuel oil-tank before departure + the amount of fuel added between voyages-the fuel inventory at arrival-the amount of fuel discharged between voyages
The fuel consumption in each port = the fuel inventory of the fuel oil-tank at arrival + the amount of fuel added between stops − the fuel inventory at departure − the amount of fuel unloaded between stops
This method is simple, but the accuracy varies widely. It can only estimate the overall fuel consumption of the ship and cannot monitor different emission sources of the ship separately.

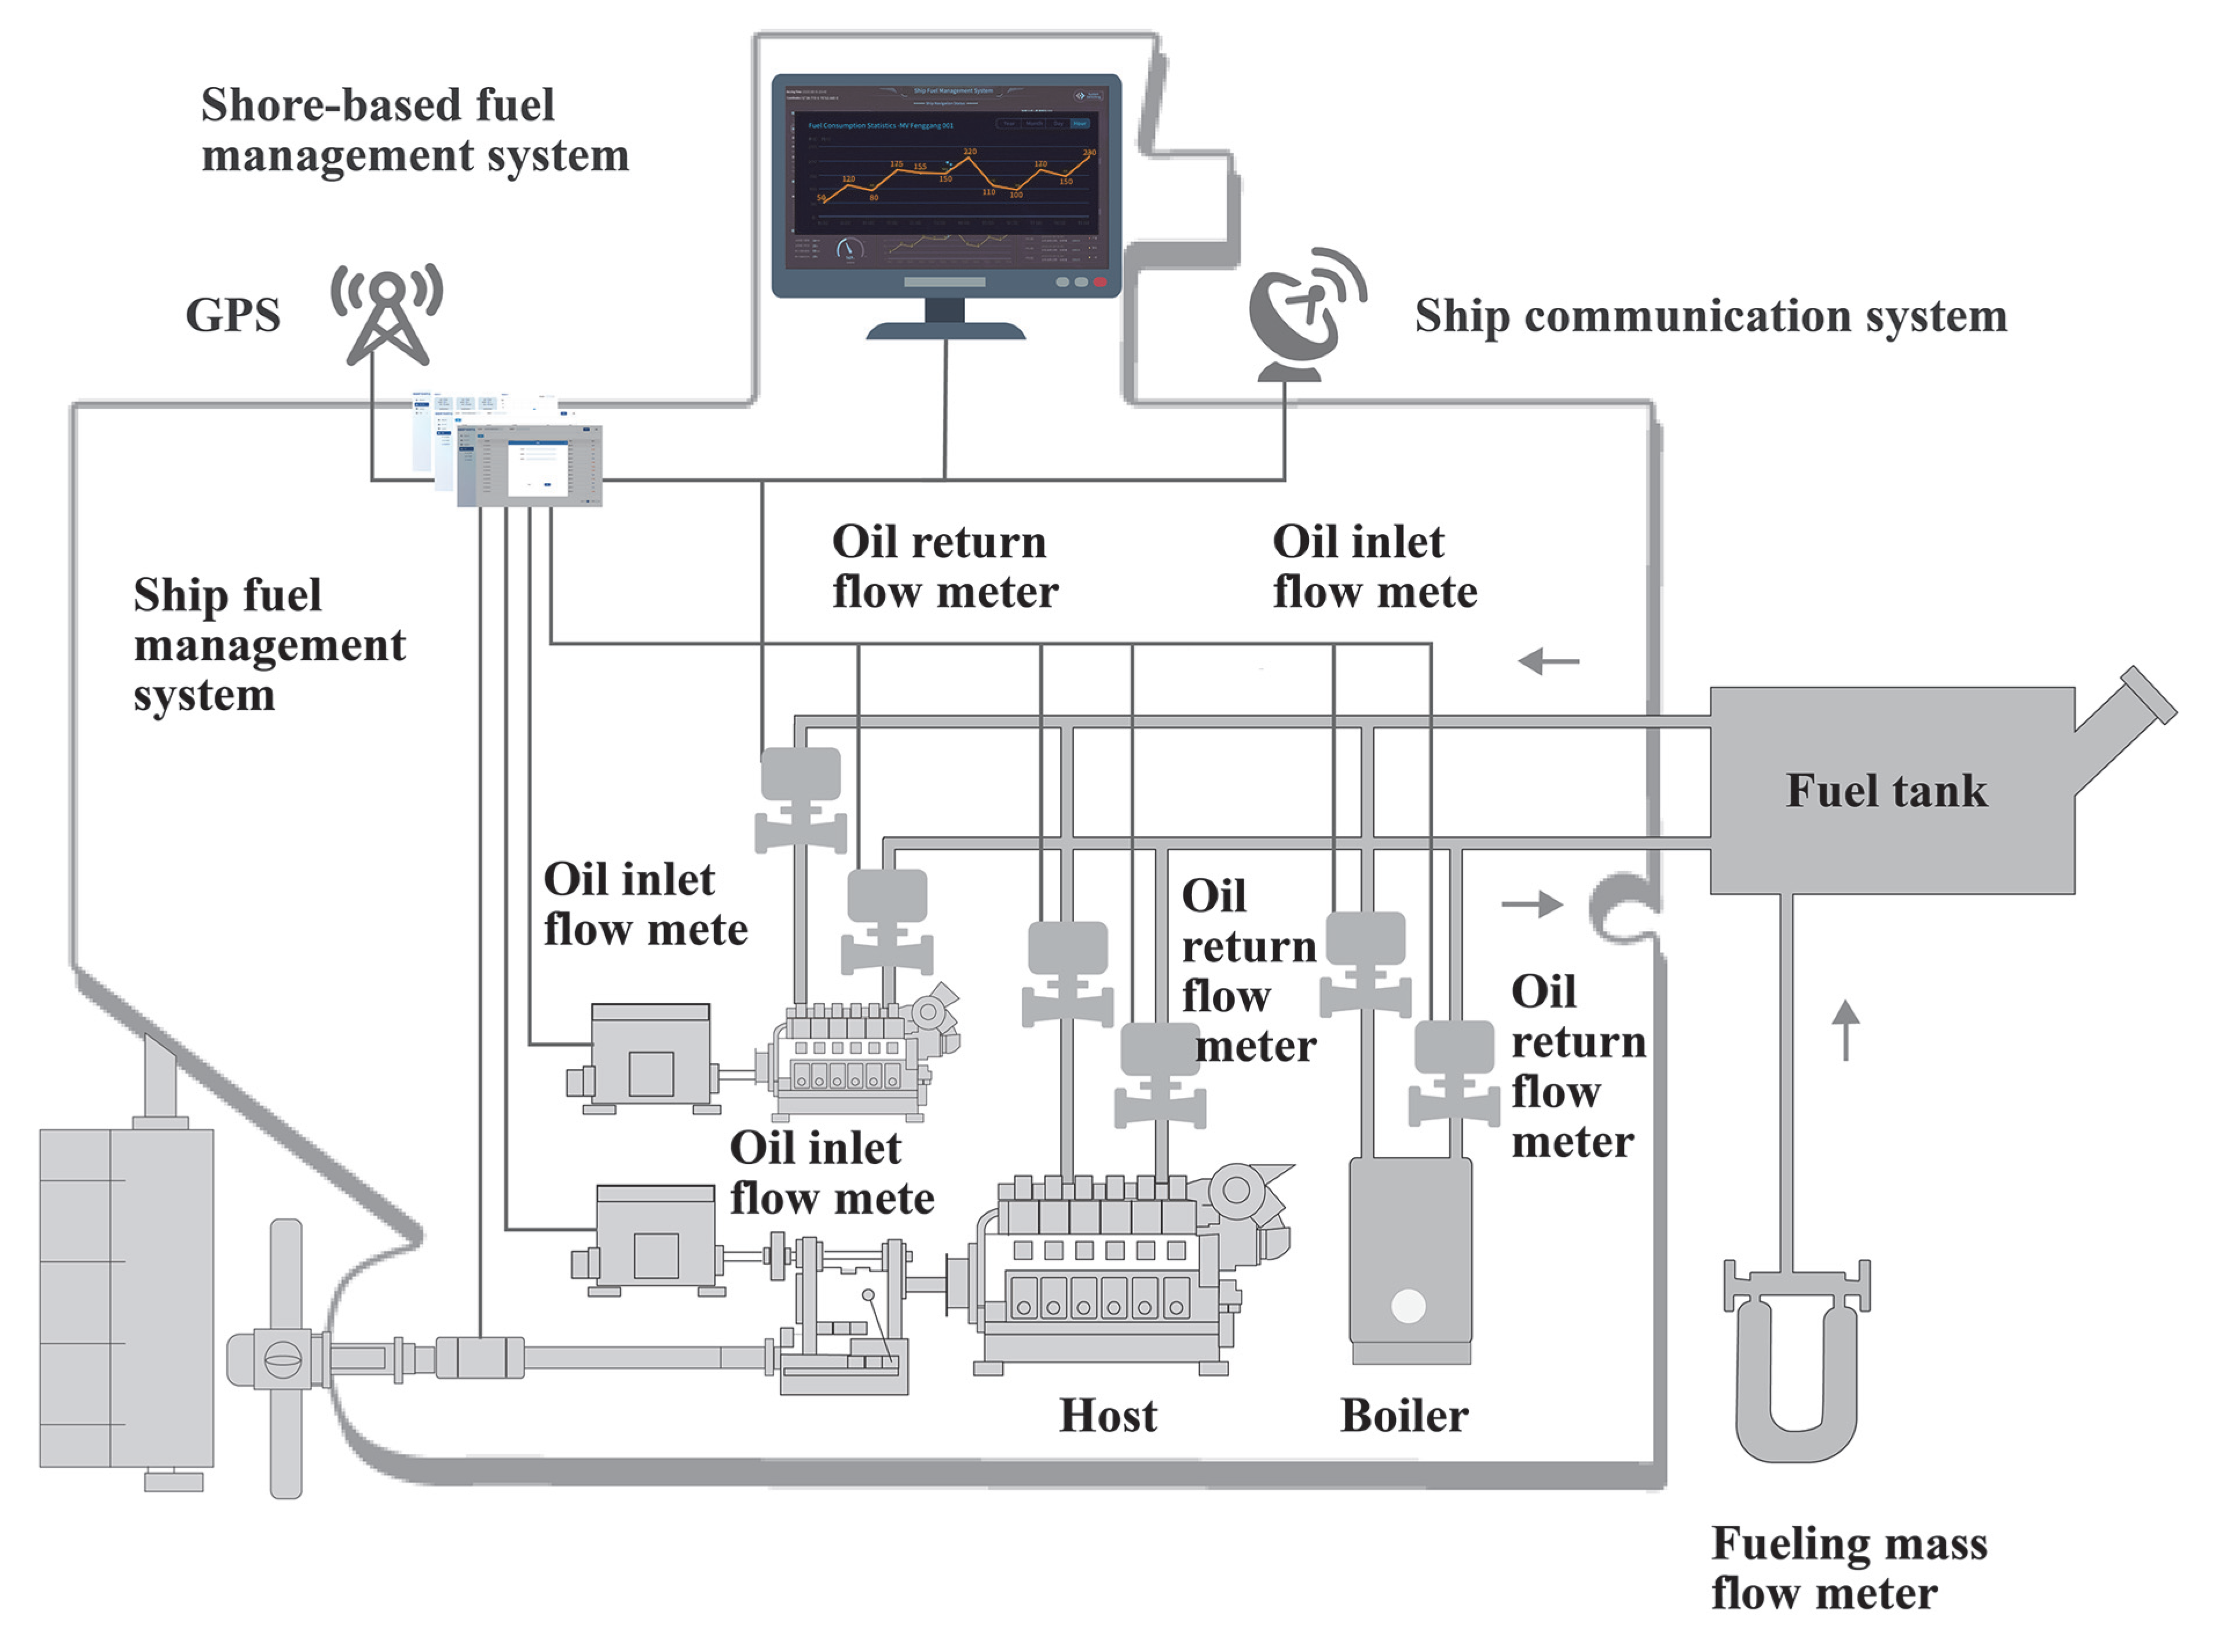
2.1.3. Flow-Meter Monitoring for Fuel Combustion Processes

This method can record the real-time fuel consumption of the ship accurately during different time periods for different emission sources by installing flow meters at the inlet and outlet of the pipeline (shown in Figure 1) and calculate the carbon emissions in this way. The flow meters for applicable combustion processes play an important role in international shipping carbon-emission verification rules; they help shipping companies to conduct the refined management of energy consumption, evaluate the energy efficiency of the equipment, and meet the requirements of IMO and EU for the carbon-emission monitoring, reporting, and verification of ships. The formula is as follows:
The fuel consumption for each voyage at sea = total flow of all carbon emission sources
The fuel consumption within each port = total flow of all carbon emission sources during port time
The flow meters for applicable combustion processes have high accuracy, which means the monitored carbon emissions are close to the actual amount. This allows for not only monitoring different emission sources but distinguishing the carbon emissions in different navigation areas. With the development of artificial intelligence and supported by the Internet of Things, digitization, and cloud computing, while monitoring fuel consumption, sensor parameters installed on machines are collected, and fuel consumption information, machine speed, power, fuel pressure, fuel temperature, lubricating oil pressure and temperature are compared, analyzed, and disposed. Therefore, the remote monitoring of abnormal fuel consumption and machine faults can be achieved. Fuel consumption and machine performance data are visualized and displayed. While completing instantaneous or cumulative fuel consumption monitoring of all emission sources on ships, key emission data is automatically calculated in accordance with MRV specifications to achieve the comprehensive supervision of ship carbon emissions.

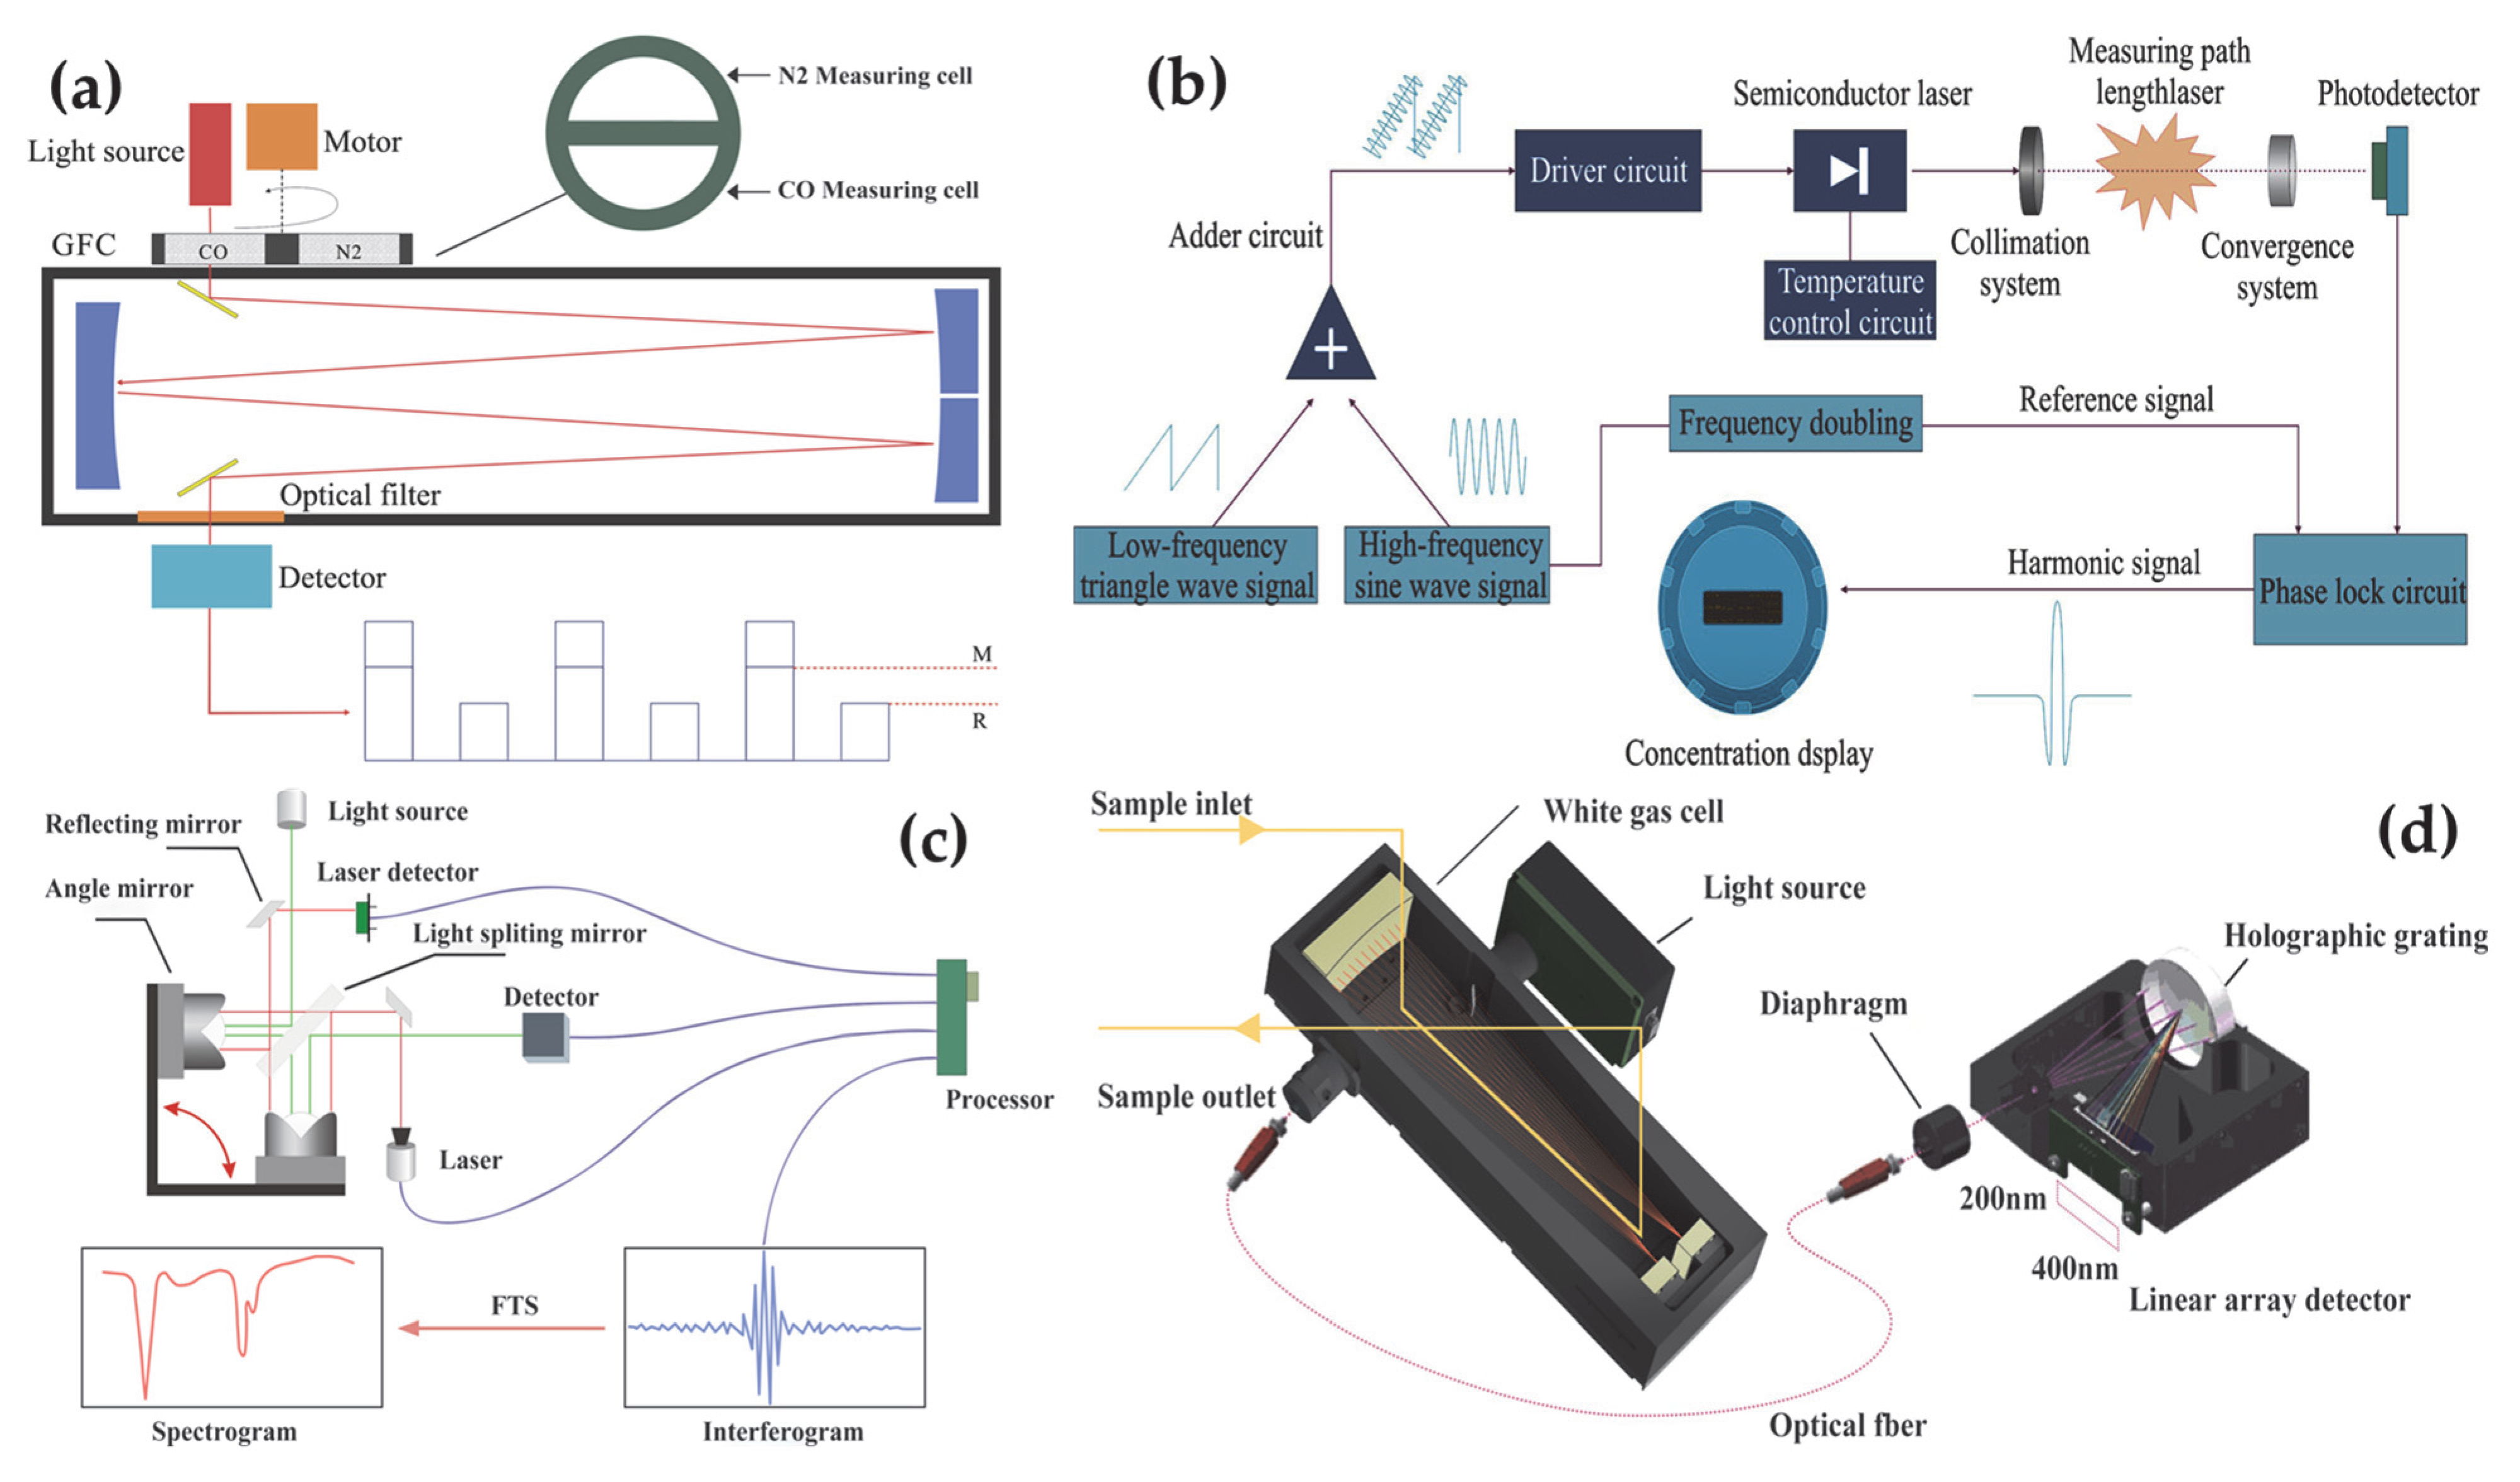
2.2. Direct Monitoring

Since the implementation of the global sulfur limit by IMO on 1 January 2020, online monitoring systems for ship emissions have been widely used downstream of scrubbers based on spectral measurement technologies such as Non-Dispersive Infrared Spectroscopy (NDIR), Non-Dispersive UV (NDUV), Tunable Diode Laser Absorption Spectroscopy (TDLAS), UV-Differential Optical Absorption Spectroscopy (UV-DOAS), and Fourier Transform Infrared Spectroscopy (FTIR) [15,16,17,18,19]. Figure 2 shows schematic diagrams of four types of technical principles, all of which are developed based on molecular absorption spectroscopy. Direct carbon-emission monitoring for ships, based on mature spectral technology, is explored to develop an online monitoring method suitable for the shipping industry to monitor carbon emission equipment. Currently, some shipping groups have started to explore online monitoring methods for ships to track carbon emissions.
The MRV Regulation 2015/757 adopts the direct monitoring method of CO2 emissions (online monitoring system for ship carbon emissions). This system consists of a sampling device placed on the chimney, a flow meter, a heat-tracing pipeline connection, a system cabinet, and a compressed air source (as shown in Figure 3). Under the action of the sampling pump or jet pump, the measured gas has a high temperature after moving through the sampling probe, heat-tracing tube, and secondary filter and enters the gas chamber to measure CO2 concentration and sample gas humidity. The online system can monitor and record the CO2 concentration and wet smoke volume generated during the operation of ships in real time, and the CO2-emission mass concentration per unit time can be calculated by Formula (6). This system can also measure the concentration of CO2 emissions in real time under different working conditions. This not only provides accurate emission data for the shipping industry but also helps ship owners, operators, and regulators achieve environmental compliance, optimize energy management, and reduce operating costs, contributing to global climate response.
Figure 3. Schematic diagram of ship carbon-emission monitoring system.
Atmosphere 16 00773 g003
G N = i = 1 N ( C i × F × V ¯ × 273 273 + t s × B a + P s 101,325 × 1 X s w )
G v o y = M = 1 M G N × 10 3
G N : Instantaneous emissions of GHG pollutant, kg/s
C i : The measured mass concentration of CO2, CH4, N2O, kg/m3
t s : Smoke temperature, °C
B a : Atmospheric pressure, Pa
P s : Smoke static pressure, Pa
X s w : Moisture content in flue gas, %
F : Measured area of the cross-section, m2
V ¯ : Measured average flow velocity of wet exhaust gas at the cross-section, m/s
G v o y : GHG emissions of this voyage, t/s
In accordance with the revised EU MRV regulation that incorporates the emissions of CO2, CH4, and N2O generated by the shipping industry into trading, the online monitoring system can meet the requirements of EU regulation upgrading by adding sensor modules for CH4 and N2O.

2.3. Comparative Analysis of Monitoring Techniques

There are two main approaches to establishing a ship carbon-emission accounting list: top down and bottom up. The top-down approach, also known as the fuel statistics method, calculates carbon emissions based on the total volume of fuel sold in a region [18,19,20]. The BDN and periodic stock takes of fuel tanks comprise the top-down approach, which does not require specific ship parameters, meteorological data, or the cost of equipment, making it suitable for predicting ship emissions on a large scale or global level. However, the “top-down” method overlooks emission variations under the actual operating conditions of the ship, as well as differences in fuel specifications across sailing countries or regions, often resulting in a large calculation error of CO2 emissions [21,22]. Also, it is difficult to determine a ship’s carbon emissions generated by a certain voyage, especially under the EU’s current emissions trading system used to regulate the shipping industry [4], which will be very troublesome.
In the method of onboard bunker fuel oil-tank monitoring, flow meters for applicable combustion processes and directly monitoring carbon emissions comprise the bottom-up approach, which calculates ship emissions based on the vessel’s activity trajectory and operational status. This method relies on high-resolution dynamic ship data, such as vessel speed and geographical position, to determine the vessel’s actual operating time, energy consumption, or pollutant emissions [23,24]. Onboard bunker fuel oil-tank monitoring relies on human measurement or a liquid meter. This method excels due to its relative low cost but tends to ignore the fuel stored in the ship, and the accuracy may be affected by the shape and internal structure of the ship. The method using flow meters involves monitoring applicable combustion process, and the calculated results are close to the actual fuel consumption. The equipment cost varies greatly with different flow meters and accuracy. For example, the accuracy of differential pressure flow meters is about 3%, compared to 0.05% for mass sensing flow meters, which is four times more expensive than the first one. The onboard bunker fuel oil-tank monitoring method and flow-meters method can meet the requirements of ships with small displacement, small tonnage, and low cost; avoid complex conditions such as space, power consumption, and large gas consumption restrictions; and indirectly estimate the CO2 emissions of ships in a relatively simple way. At the same time, the operation scope of ships is small, and the types of fuels used by ships are unified. It is easier to improve the applicability and accuracy of the fuel tank periodic-inventory method and the fuel tank level-monitoring method. However, the indirect methods face two common issues: the CO2 emission factors of fuels and the calculation of other GHG emissions. The CO2 emission factors are related to the type of fuel, as well as the engine types and ship navigation conditions, making it difficult to calculate carbon emissions in a precise way. The N2O and CH4 emitted by ships have a warming potential of 72 times and 275 times [25,26,27,28] higher than that of CO2, which cannot be ignored in carbon emission accounting.
The method of directly monitoring carbon emissions uses online monitoring equipment to measure the CO2 concentration and emission flow at the exhaust outlet of the ship. This can not only show the total carbon emissions but can also monitor the exhaust emissions in various navigation areas in real time. It can be further applied to the GHG accounting of ships. However, equipped with complex pre-processing units and measurement units, the monitoring system has a higher cost. Coupled with the inadequate operation and maintenance experience of domestic shipowners, this method has not been widely applied. However, Devices such as the MARSIC300 from Germany’s SICK (Waldkirch) and shipCEMS from Norway′s NORSK (Tønsberg) analyse AS have been used for ship exhaust emissions for more than a decade [29], and their reliability and stability have been recognized by the industry. Due to the different countries or regions of international shipping ships, the fuel specifications vary greatly. At the same time, the structural difference of transport vessels is small, and the space is large, which reduces the difficulty for relevant agencies in formulating relevant laws and regulations for the installation of direct measurement equipment. With the implementation of the IMO MARPOL standard [3] and the EU MRV regulations [4], the application potential of directly monitoring carbon emissions and equipment is huge.
Table 3 presents a comparison of these four methods across six dimensions: types of monitored gases, accuracy of carbon verification, measurement precision, real-time performance, regulatory practicality, and monitoring cost. It illustrates deviations in calculated carbon emissions for a voyage from Shanghai to Europe using the bunker tank level-monitoring method, flow-meter monitoring method, and direct CO2 monitoring method. The example is as follows:
Taking a mainstream 26,000 TEU container vessel sailing from Shanghai to the Port of Rotterdam as an example, the voyage distance is 10,667 km, with an approximate sailing time of 33 days (via the Cape of Good Hope). With a daily fuel consumption of 220 tons/day [28], the CO2 emissions calculated using Formula (1) amount to 22,876.26 tons. Accuracy comparisons across monitoring systems show emission error margins as follows: (1) For bunker fuel oil-tank monitoring (level sensor accuracy: ±5%; CF variation per IMO 2022 VLSFO data: ±2.3%), total error ( 5 % ) 2 + ( 2.3 % ) 2 = ± 5.5 % , giving emission error 22,876.26 × (±5.5%) = ±1258.1943 tons; (2) For flow-meter monitoring (flow-meter accuracy: ±2%; CF error: ±2.3%), total error ( 2 % ) 2 + ( 2.3 % ) 2 = ± 3.1 % , yielding emission error 22,876.26 × (±3.1%) = ±709.164 tons; (3) For direct CO2 monitoring (NDIR sensor accuracy: ±1.0%,compliant with EN 15267-3 [30]), emission error is 22,876.26 × (±1%) = ±228.76 tons.

3. Suggestions for Developing a Low-Carbon Shipping Supervision System

At present, the supervision of carbon emissions of ships in China still faces problems such as an incomplete regulatory framework, weak supervision related to emissions, unclear work division, inadequate standards, and a lack of technical means [9]. Different from fixed emission sources such as industrial and domestic sources, ship emissions are mobile sources moving across rivers, lakes, oceans, and other basins; they cannot be fully covered by the monitoring network. Therefore, it is important to innovate the concept, system, and means of supervision; make breakthrough technologies; and utilize internet information technology to monitor the entire life cycle of ships. Efforts should be made to develop a new system that covers all navigation areas, to enhance the capability of carbon-emission monitoring and management of ships. To this end, this paper puts forward the following advice.
The control of total energy consumption and energy intensity has been shifting to the control of total carbon emissions and carbon intensity (carbon peaking and carbon neutrality goals) in China. It is a fundamental institutional reform to implement our carbon peak and carbon neutrality strategy. To monitor and obtain carbon emission information in a timely and accurate manner, the first step is to implement carbon peaking and carbon neutrality goals. In recent years, although significant progress has been made in the construction and improvement of carbon emission accounting systems, problems still exist; these include unreliable data quality and inconsistent methodologies and standards. It is imperative to promote the construction and application of direct carbon-emission monitoring systems. It is suggested that the shipping industry follow the trend of the shift to carbon peaking and carbon neutrality goals and promote the development of direct monitoring systems for ship-exhaust carbon emissions, so as to provide first-hand data and support carbon peaks for the shipping industry.
Ships have complex working conditions, great changes in smoke flow, and high vibration, coupled with inefficient operation and maintenance due to unstable navigation routes and schedules. It is advised to carry out targeted research and R&D on equipment based on the characteristics of ship exhaust emissions, to solve the technical difficulties in the direct measurement of exhaust emissions and improve the accuracy of monitoring. At the same time, it is also important to reduce the cost of direct monitoring systems, to lay a solid foundation for large-scale application. Marine vessels present significant challenges for direct carbon-emission monitoring due to their complex operational conditions, substantial fluctuations in exhaust gas flow rates (typically ranging from 50 to 500 m3/min), and high mechanical vibration levels (5–200 Hz spectrum), compounded by irregular navigation routes and schedules that hinder maintenance accessibility, resulting in elevated measurement costs and fragmented regulatory oversight. To address these issues, targeted R&D efforts must prioritize the development of robust measurement technologies, such as vibration-resistant laser spectrometers with adaptive flow compensation algorithms, alongside modular sensor designs featuring ISO/IEC 17025 [31]-certified quick-disconnect interfaces to reduce maintenance downtime. Concurrently, establishing an international metrological framework is critical to ensure data interoperability and mutual recognition across EU MRV and IMO DCS platforms, while it is also important to reduce the cost of direct monitoring systems to lay a solid foundation for large-scale application. A phased implementation strategy is recommended, initially mandating EN 15267-3:2023 [30]-certified continuous emission monitoring systems (CEMS) for EU MRV-compliant vessels (≥5000 GT) operating in Emission Control Areas (ECAs), followed by global expansion post-2030, thereby aligning with IMO’s revised GHG Strategy (MEPC.384(79)) [32] while optimizing cost-effectiveness and regulatory compliance through incremental adoption.
It is advised to establish a comprehensive decision-making platform for the carbon reduction of the shipping industry by data collection and verification. This platform is expected to integrate the monitoring of carbon emissions and energy efficiency and evaluate the total carbon emissions and intensity, and note whether the ship is green. Efforts should be made to support the construction of green and low-carbon fleets and routes, so as to provide high-quality data support for the EU MRV monitoring report and carbon trading market. It is also advised to explore carbon data sharing and the application of carbon footprint in the supply chain, to make the best use of carbon data.
It is suggested that innovative research on the direct monitoring of carbon emissions of ships should be conducted, research findings should be consolidated, and industrial and national standards on the direct monitoring of ship-exhaust carbon emissions should be formulated to lead technical progress in this field and contribute China’s experiences. International platforms like IMO and ISO should also be utilized to promote the development of international standards for the exhaust emission monitoring of ships, providing reference for other countries’ carbon reduction efforts in shipping.

4. Conclusions

This study compares four carbon monitoring methodologies: bunker delivery note (BDN) tracking, fuel tank-level monitoring, flow metering, and direct CO2 measurement. Quantitative error analysis reveals significantly lower emission deviations for direct monitoring (±228 tons) versus indirect methods (±709–1258 tons). The real-time precision of direct measurement better supports granular carbon accounting and compliance under IMO/MRV frameworks, enabling cross-jurisdictional emission data trust. Since there are no specific requirements for technologies and equipment, operation and maintenance, or data quality in the IMO and MRV rules, the direct application method needs the support of policies, regulations, and standards. Moreover, carbon emission supervision in the shipping industry is facing severe international situation. In the context of carbon peak and carbon neutrality, thanks to access to emission data, the collection and verification of data on carbon emission platforms, and the effective monitoring of ship exhaust, the innovative exploration of direct monitoring can pave the way for the development of a low-carbon supervision system in the shipping industry.

Author Contributions

Conceptualization, M.L., M.Q. and Y.L.; methodology, M.L., J.C., H.T. and Z.Y.; software, R.W. and L.Z.; validation, M.Q., D.L.,Y.Q. and C.Z. (Cheng Zhou); formal analysis, M.L., M.Q., Z.Y. and R.C.; investigation, R.W., Y.Z. and T.X.; resources, Y.L., Y.Z. and C.Z. (Cheng Zhou); data curation, M.Q. and D.L.; writing—original draft preparation, M.L., M.Q., C.Z. (Chaohui Zheng) and D.L.; writing—review and editing, M.L., M.Q. and S.Y.; visualization, S.Y. and Y.Q.; supervision, M.Q. and J.C.; funding acquisition, Y.L. and J.C. All authors have read and agreed to the published version of the manuscript.

Funding

This research was funded by China Meteorological Administration Climate Change Special Program (Grant NO. QBZ202408), Project of the Ministry of Industry and Information Technology (Grant NO. CBG5N21-4-3), Technology Development Project of TPRI. Full-volatility organic emissions and the environmental impacts from ships (Grant NO. 092317-108).

Data Availability Statement

No new data were created or analyzed in this study.

Conflicts of Interest

Authors Mengchun Qiu, Huaiwu Tang, Zhiwei Yu, Shanshan Ye, Ying Qu, Tao Xu, Cheng Zhou and Darong Liang were employed by the company Hangzhou Chunlai Technology Co., Ltd. The remaining authors declare that the research was conducted in the absence of any commercial or financial relationships that could be construed as a potential conflict of interest.

References

  1. IMO. Fourth IMO GCG Study 2020; IMO: Chiba, Japan, 2021; p. 29. [Google Scholar]
  2. Li, W.; Liang, J.; Zhang, L. Study on ship carbon emission regulation and low carbon shipping measures. Mar. Equip. Mater. Mark. 2024, 32, 85–87. [Google Scholar]
  3. Zeng, Q.; Zhang, C.; Liu, L. International Regulations on Shipping Carbon Intensity and Port State Control. China Marit. Saf. 2022, 12, 61–62. [Google Scholar]
  4. Official Journal of the European Union. Regulation (EU) 2023/957 of the European Parliament and of the Council of 10 May 2023; Official Journal of the European Union: Luxembourg, 2023. [Google Scholar]
  5. Chinese Classification Society (CCS). Shipping Low-Carbon Development Outlook 2023; Chinese Classification Society (CCS): Beijing, China, 2023. [Google Scholar]
  6. Cao, Z. Thoughts on collection and management of ship energy consumption data. Transp. Enterp. Manag. 2023, 38, 60–62. [Google Scholar]
  7. Chinese Classification Society (CCS). Implementation Guidelines for the Monitoring, Reporting and Verification of CO2 Emissions from Ships; Chinese Classification Society (CCS): Beijing, China, 2018. [Google Scholar]
  8. Chinese Classification Society (CCS). Guidelines for the Calculation and Certification of the Full Life Cycle Greenhouse Gas Emission Intensity of Marine Fuels; Chinese Classification Society (CCS): Beijing, China, 2023. [Google Scholar]
  9. Li, W.; Sun, X.; Li, H. Research on the status quo and construction of supervision system of carbon emission from ships in China. China Water Transp. 2021, 3, 122–125. [Google Scholar]
  10. Zhang, S.; Zuo, C.; Huang, Z. Comparative analysis of EU MRV regulations and IMO fuel consumption collection mechanism for ships. China Water Transp. 2017, 17, 79–81. [Google Scholar]
  11. IMO. Resolution MEPC.281: 2016 Guidelines for the Development of a Ship Energy Efficiency Management Plan (SEEMP); IMO: Chiba, Japan, 2020; p. 5. [Google Scholar]
  12. IMO. Circular MEPC.1/Circ.795: Guidelines for Verification of Ship Fuel Consumption Data; IMO: Chiba, Japan, 2021; p. 2. [Google Scholar]
  13. ISO 8217:2017; Petroleum Products—Fuels (class F)—Specifications of Marine Fuels. International Organization for Standardization: Geneva, Switzerland, 2017.
  14. Deng, S.; Mi, Z. A review on carbon emissions of global shipping. Mar. Dev. 2023, 1, 4. [Google Scholar] [CrossRef]
  15. Karjalainen, P.; Teinilä, K.; Kuittinen, N.; Aakko-Saksa, P.; Bloss, M.; Vesala, H.; Pettinen, R.; Saarikoski, S.; Jalkanen, J.-P.; Timonen, H. Real-world particle emissions and secondary aerosol formation from a diesel oxidation catalyst and scrubber equipped ship operating with two fuels in a SECA area. Environ. Pollut. 2022, 292 Pt A, 118278. [Google Scholar] [CrossRef] [PubMed]
  16. Wijaya, T.; Tjahjowidodo, T.; Thepsithar, P. Real time ship exhaust gas monitoring for compliance to SOx and NOx regulation and CO2 footprint. Sun Above Horiz. Meteoric Rise Sol. Ind. 2014, 5, 201. [Google Scholar]
  17. Hu, Y. Study on Compliance Assessment of Ship Exhaust Emissions in China’s ECA (Emission Control Area). Master’s Thesis, World Maritime University, Dalian, China, 2019. [Google Scholar]
  18. Hörandner, L.; Duldner-Borca, B.; Beil, D.; Putz-Egger, L.-M. Measurement Techniques, Calculation Methods, and Reduction Measures for Greenhouse Gas Emissions in Inland Navigation-A Preliminary Study. Sustainability 2024, 16, 3007. [Google Scholar] [CrossRef]
  19. Corbett, J.J.; Fischbeck, P.S.; Pandis, S.N. Global nitrogen and sulfur inventories for oceangoing ships. J. Geophys. Res. Atmos. 1999, 104, 3457–3470. [Google Scholar] [CrossRef]
  20. Endresen, Ø.; Sørgård, E.; Sundet, J.K.; Dalsøren, S.B.; Isaksen, I.S.A.; Berglen, T.F.; Gravir, G. Emission from international sea transportation and environmental impact. J. Geophys. Res. Atoms. 2003, 108, 4560. [Google Scholar] [CrossRef]
  21. Fuentes, G. Generating bunkering statistics from AIS data: A machine learning approach. Transp. Res. Part E Logist. Transp. Rev. 2021, 155, 102495. [Google Scholar] [CrossRef]
  22. Shi, X.; Xi, Q.; Zhang, Z.; Yang, Z. Methods for monitoring carbon emissions from ships: A practical perspective. Environ. Dev. 2025, 55, 101192. [Google Scholar] [CrossRef]
  23. Li, C.; Yuan, Z.; Ou, J.; Fan, X.; Ye, S.; Xiao, T.; Shi, Y.; Huang, Z.; Ng, S.K.; Zhong, Z.; et al. An AIS-based high-resolution ship emission inventory and its uncertainty in Pearl River Delta region, China. Sci. Total Environ. 2016, 573, 1–10. [Google Scholar] [CrossRef] [PubMed]
  24. Song, S. Ship emissions inventory, social cost and eco-efficiency in Shanghai Yangshan port. Atmos. Environ. 2014, 82, 288–297. [Google Scholar] [CrossRef]
  25. IPCC. Climate Change 2021: The Physical Science Basis. In Contribution of Working Group I to the Sixth Assessment Report of the Intergovernmental Panel on Climate Change; Cambridge University Press: Cambridge, UK, 2021; p. 352. [Google Scholar]
  26. Zhang, H.; Wu, J.X.; Shen, Z.P. Radiative forcing and global warming potential of perfluorocarbons and sulfur hexafluoride. Sci. China Earth Sci. 2011, 54, 764–772. [Google Scholar] [CrossRef]
  27. Committee for the preparation of the Second National Assessment Report on Climate Change. The Second National Assessment Report on Climate Change; Science Press: Beijing, China, 2011; p. 26. [Google Scholar]
  28. El-Safoury, M.; Dufner, M.; Weber, C.; Schmitt, K.; Pernau, H.-F.; Willing, B.; Wöllenstein, J. On-Board Monitoring of SO2 Ship Emissions Using Resonant Photoacoustic Gas Detection in the UV Range. Sensors 2021, 21, 4468. [Google Scholar] [CrossRef] [PubMed]
  29. Notteboom, T.; Carriou, P. Fuel surcharge practices of container shipping lines: Is it about cost recovery or revenue making? In Proceedings of the 2009 International Association of Maritime Economists (IAME) Conference, Copenhagen, Denmark, 24–26 June 2009. [Google Scholar]
  30. EN 15267-3:2023; Air Quality—Assessment of Air Quality Monitoring Equipment—Part 3: Performance Criteria and Test Procedures for Automated Measuring Systems for Monitoring Emissions from Stationary Sources. European Committee for Standardization: Brussels, Belgium, 2023.
  31. ISO/IEC 17025:2017; General Requirements for the Competence of Testing and Calibration Laboratories. International Organization for Standardization: Geneva, Switzerland, 2017.
  32. MEPC.384(79); 2022 Guidelines for the Development of a Ship Energy Efficiency Management Plan (SEEMP). International Maritime Organization: London, UK, 2022.
Figure 1. Flow monitoring method.
Atmosphere 16 00773 g001
Figure 2. Principle of direct carbon-emission monitoring technology, (a) Non-Dispersive Infrared; (b) Tunable Diode Laser Absorption Spectroscopy; (c) Fourier Transform Infrared Spectroscopy; (d) Ultraviolet Differential Optical Absorption Spectroscopy.
Atmosphere 16 00773 g002
Table 1. CO2 emission factors of different fuels [11,12].
Fuel TypesCarbon Factors (Ton of CO2/Ton of Fuel)
Heavy oil (ISO 8217 [13] Grades RME~RMK)3.114
Light oil (ISO 8217 Grades RMA~RMD)3.151
diesel (ISO 8217 Grades DMX~DMB)3.206
LPG (propane)3
LPG (butane)3.03
LNG2.75
Methanol1.375
Ethanol1.913
Ultra-low sulfur fuel oil (ISO 8217 DMA~DMZ)3.206
Ultra-low sulfur fuel oil (ISO 8217 RMA~RMD)3.151
Biofuel blend 12.284
Green fuels (ammonia and hydrogen)0
Note 1: the CF for biofuel blend is 2.478 t-CO2/t-fuel, when considering full lifecycle emissions (MEPC.1-Circ.905).
Table 2. BDN information.
No.ItemDetails
1Recipient of fuelClarify the name of the ship that accepts fuel and IMO number
2Name of the productList the types of fuel provided
3QuantityRecord the total amount of fuel supplied (metric tons)
4IntensityProvide the density value of fuel at 15 degrees Celsius (in kg/m3)
5Sulfur contentIndicate the sulfur content of the fuel, which is a key indicator for environment (unit: % m/m)
6Supplier declarationMeasure the liquid level and oil temperature of fuel tanks, the longitudinal and transverse tilt of the ship’s hull each time when the ship is at berth, bunkering oil, arrives or departs from the port.
Table 3. Comparison of CO2 monitoring methods for ships.
Monitoring MethodMonitoring GHGAccuracy of Carbon AccountingAccuracy of MeasureReal time PerformanceFeasibilityCost
Indirect methodBDNCO2low——obtained annually, laggingCannot monitor carbon emission sources and new GHG separatelyNo
Bunker Fuel Oil-Tank Monitoring OnboardCO2low5%laggingCannot monitor carbon emission sources and new GHG separately1000~4200 USD
Flow MetersCO2relatively high2%in real timecannot monitor new GHG4200–15,000 USD
Direct methodOnline MonitoringCO2, CH4, N2Ohigh1~2%in real timeCan monitor carbon emission sources and new GHG separately80,000–104,200 USD
Disclaimer/Publisher’s Note: The statements, opinions and data contained in all publications are solely those of the individual author(s) and contributor(s) and not of MDPI and/or the editor(s). MDPI and/or the editor(s) disclaim responsibility for any injury to people or property resulting from any ideas, methods, instructions or products referred to in the content.

