Article

Bioclimatic Condition Variability in the Central Region of Poland in the Period 2001–2024

by
Katarzyna Rozbicka
*,
Tomasz Rozbicki
and
Grzegorz Majewski
*
Institute of Environmental Engineering, Department of Hydrology, Meteorology and Water Management, Warsaw University of Life Sciences, Nowoursynowska Str. 159, 02-776 Warsaw, Poland
*
Authors to whom correspondence should be addressed.
Atmosphere 2025, 16(7), 774; https://doi.org/10.3390/atmos16070774
Submission received: 31 March 2025 / Revised: 13 June 2025 / Accepted: 14 June 2025 / Published: 24 June 2025
(This article belongs to the Section Biometeorology and Bioclimatology)

Abstract

This study investigates the variations in the Universal Thermal Climate Index (UTCI) calculated based on meteorological data from six synoptic stations across the Central Region of Poland from 2001 to 2024, focusing on spatial and temporal trends in thermal stress. The average annual UTCI was found to be 7.7 °C, indicating “slight cold stress,” with regional differences. Higher values were recorded in the west and northwest compared to lower values in the southeast. Maximum UTCI values associated with “very strong heat stress” exceeded 40.0 °C, while minimum values denoting “extreme cold stress” occurred in eastern cities more often. A linear trend analysis revealed a general increase in UTCI values across all stations, varying from 0.6 °C to 1.8 °C per decade, and showed distinct positive trends for heat stress categories, particularly “strong heat stress.” In contrast, a decrease in “strong cold stress” was observed. Favorable bioclimatic conditions, defined as “comfort”, predominated during most months, especially from April to October, while extreme thermal conditions were infrequently recorded. This research shows significant changes in thermal comfort and stress patterns, highlighting regional disparities and the implications for public health and urban planning in response to evolving bioclimatic conditions.

1. Introduction

According to the IPCC report [1], in the years 2011–2020, the average temperature of the Earth was 1.09 °C higher than in the years 1850–1900 (considered as the temperature of the pre-industrial era), with the temperature of lands increasing by 1.59 °C and the ocean by 0.88 °C. Each of the last four decades has been warmer than the previous one, and the researchers highlight that each of the recent 3 decades has become warmer than any other period prior to 1980, and the 10 warmest years on record at global scale have occurred after 1998 [2,3].
Climate change is therefore a fact, and the effects of these changes affect various areas of life. Biometeorology, including the problems of changing climate, human comfort, and well-being is applied in various fields. Krüger [4] classifies biometeorological research according to 8 different categories, which roughly define the areas of application of the index: (1) Outdoor Thermal Comfort (OTC) and thermal stress; (2) urban climate and planning studies; (3) climate-related impacts on human health; (4) bioclimate; (5) comparisons with other thermal comfort indices; (6) meteorological analyses; (7) climate change research; and (8) tourism. The bulk of research carried out on the Universal Thermal Climate Index (UTCI) is primarily concentrated on the first two topics, reaching about 60% of papers output [4].
The increase in temperature resulting from climate changes is not the same for different latitudes. Bioclimate studies are conducted for each climate zone. In recent years, among others, a review article has been published [5] on the applications of biometeorological indicators in the assessment of well-being and quality of life. Nascar et al. [6] analyzed spatiotemporal variations of UTCI-based discomfort in India. For the Mediterranean Basin in Europe, bioclimatic conditions in Greece [7] and spatial variability of the UTCI index in Serbia [8,9] were analyzed.
The mid-latitudes are very sensitive to global warming and were affected by several severe and long-lasting heat waves during the last decades [10]. The study area of this paper is Poland, located in the central part of Europe. In Poland, biometeorological studies have been carried for several years and are concerned with many aspects of bioclimatology.
The analysis of the city climate based on biometeorological indicators was the subject of works by, among others, [11] for Warsaw, [12] for Toruń, and [13] for selected Polish cities. The impact of the city climate on human health, comfort, and discomfort was studied by Błażejczyk et al. and [14,15,16]. The spatial and temporal variability of the bioclimate in Poland was the subject of studies by, among others, [17,18,19,20], as well as in terms of utility of tourism by [21,22] for Warsaw and [23] for the Kłodzko Valley.
Some of the group most sensitive to extreme heat are, among others, older people, children, chronic patients, the poor, and outdoor and manual workers [24,25]. Such professions include, for example, construction workers and farmers. Outdoor workers are particularly vulnerable to heat stress due to the nature of their work, which takes place mostly outdoors under the influence of sometimes extreme weather conditions. The analysis of the weather impact of conditions on such workers was the subject of research [26,27]. One of the most interesting issues of this literature preview is the research on meteorological conditions during major sports events and the impact of weather factors on athletes, i.e., people subjected to extremely high physical exertion. This includes, among others, the works of Chodor et al. [28] on the World Cup in Qatar or the work on the Olympic Games in Paris by Matzarakis [29]. This shows a very wide range of applications of biometeorological conditions and their indices.
The scientific objectives of this work may be specified in three aspects. (1) The research area is located in central Europe, one of the most sensitive areas vulnerable to climate change caused by global warming. The results of such an analysis can provide information on the response of bioclimatic conditions to the changing climatic conditions in recent decades. (2) This region covers the largest part of Poland, and there are many cities attractive in terms of culture, business, and urban tourism. The obtained results may also be used, among others, in the long-term adaptation of urban areas to climate change, as well as a tool supporting decisions in urban planning. (3) Due to the complexity of the research, the results may also be a contribution to the discussion on a new classification of bioclimatic regions of Poland.

2. Materials and Methods
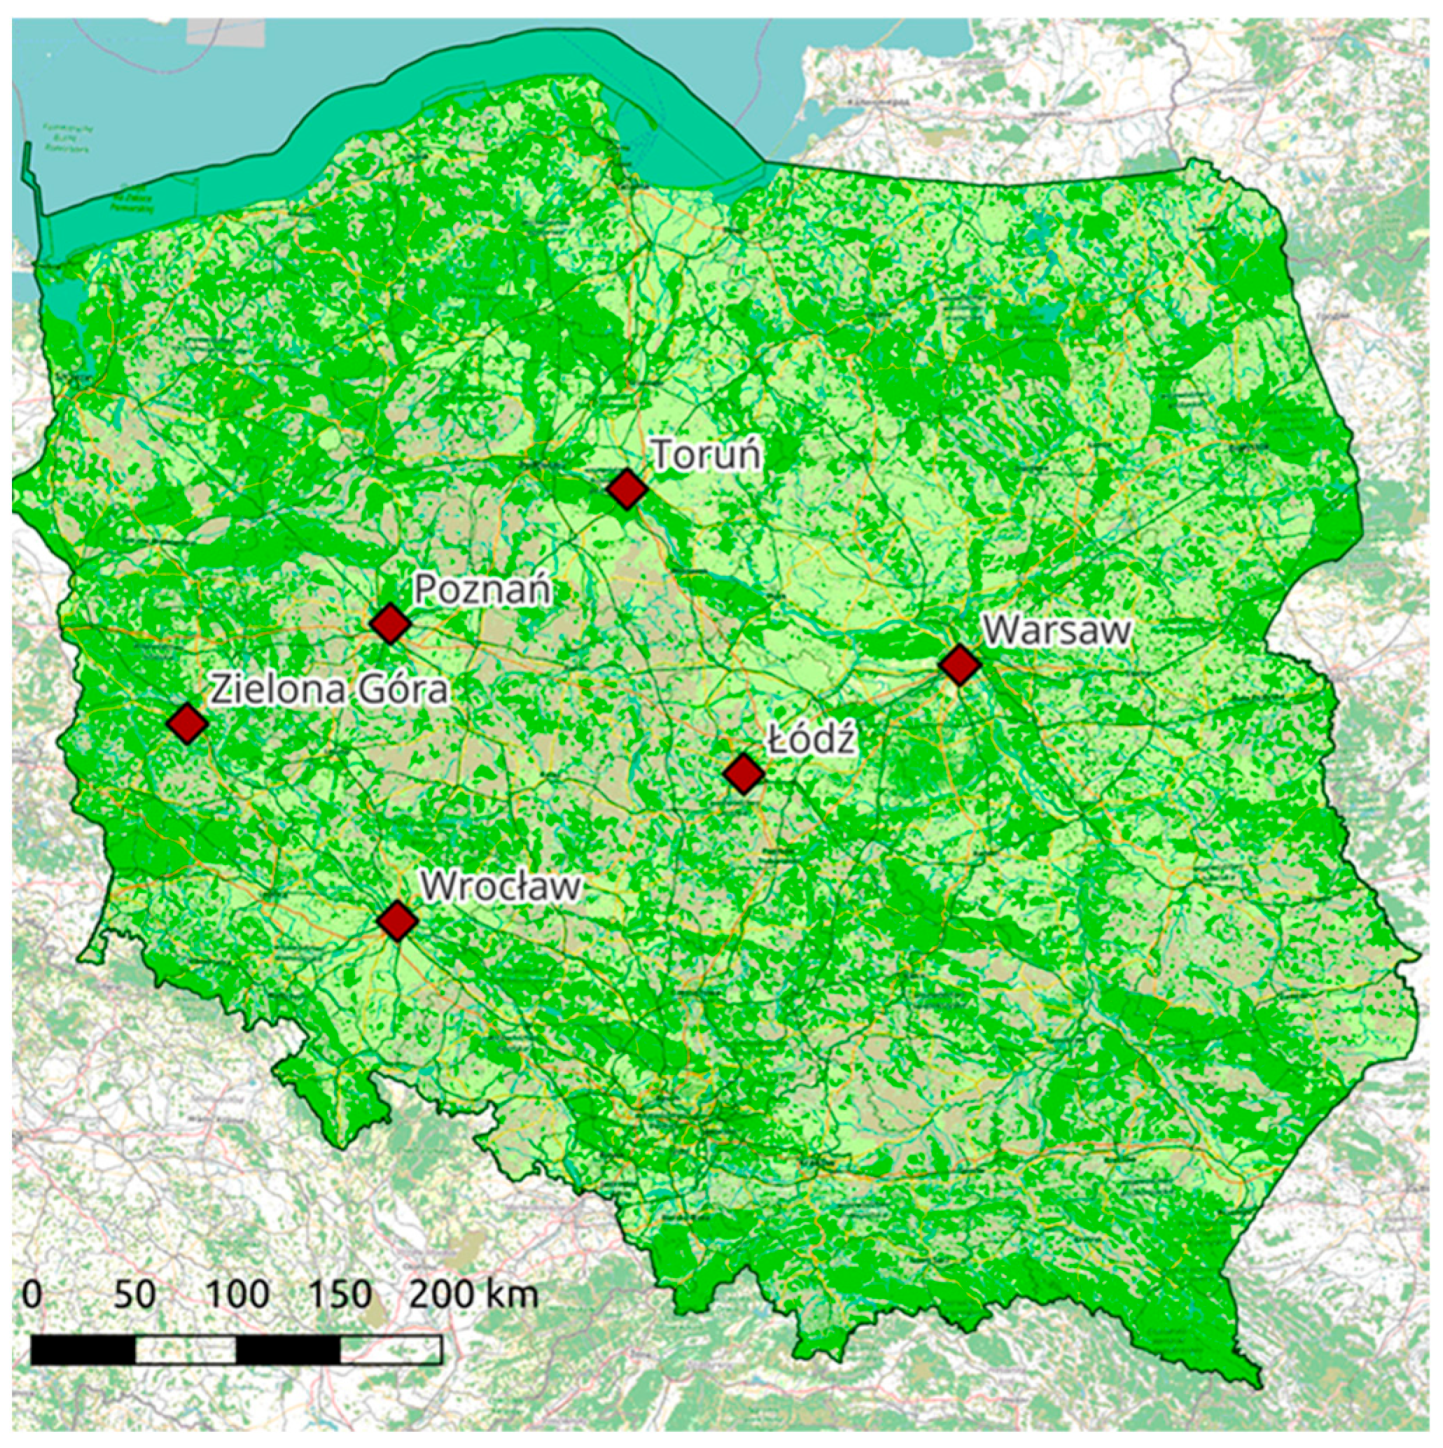
2.1. Study Area

The last version of the bioclimatic regionalization of Poland was published by Kozłowska-Szczęsna [30] in 2002. This article focuses on the study of conditions in the Central Bioclimatic Region (IV). It is situated in lowland area and is characterized by the largest spatial range and a low stimulating type of bioclimate. It includes the Central Polish Lowlands with a poorly diversified relief. Unlike other regions of bioclimate, a change of place of residence may only to a small extent cause the need for adaptation of the human body after arrival and readaptation after return, or it may not require it at all. The prevailing climatic conditions are typical for Poland, and the majority of the population lives there. In the Central Region (IV), there are the fewest days that are burdensome for humans in comparison to the rest of Poland. In the west, there are less than 20% of them and in the center of the country from 20 to 30% of days a year. The mild bioclimatic conditions occur in the western part of Poland that is associated with short, not very severe winters, early and warm spring, and long thermal summer. In the lowland areas, the weather conditions (either good and bad) are more persistent, in comparison the coastal or mountains regions [31].

2.2. Climate Description

According to the climatological Köppen–Geiger classification, the analyzed area is situated in the Dfb zone—a humid continental climate with a fairly equal sum of precipitation for a long-term average of 500–600 mm/year, with a maximum in July and a minimum in February. The average annual air temperature is 8.2 °C, with a maximum in July of 18.3 °C and a minimum in January of −2.2 °C. Polar-maritime air masses from the Atlantic Ocean are prevailing and less frequently polar-continental and tropical air masses. Western sector winds appear most frequently. In most cities in the region, urban heat island UHI takes place—a typical phenomenon for large urban-industrial areas [32,33].

2.3. Data Sources

This work is based on complete hourly data of six meteorological stations situated in the following locations: Zielona Góra (φ = 51°55′ N; λ = 15°31′ E, H 192 m a.s.l.), Poznań (φ = 52°25′ N; λ = 16°50′ E, H = 88 m a.s.l.), Wrocław (φ = 51°06′ N; λ = 16°53′ E, H = 121 m a.s.l.), Toruń (φ = 53°02′ N; λ = 18°35′ E, H = 69 m a.s.l.), Łódź (φ = 51°43′ N; λ = 19°23′ E, H = 180 m a.s.l.), and Warsaw (φ = 52°09′ N; λ = 020°57′ E, H = 107 m a.s.l.) (Figure 1). In terms of population, the largest city is Warsaw (1,862,402), and next is Wrocław (673,531), Łódź (648,711), Poznań (536,818), Toruń (194,273), and Zielona Góra (138,887) [33].
Standard meteorological data recorded at 12:00 UTC (14:00 CEST/13:00 CET) from the Institute of Meteorology and Water Management—National Research Institute was used to analyze the long-term variability (2001–2024) of the sensible climate conditions in the Central (IV) Bioclimatic Region in Poland [31]. They were air temperature (°C), relative air humidity (%), wind speed (m·s−1), and cloudiness (0–8). In this study, meteorological stations were taken into account, which are located in a representative location in the administrative boundaries of the cities. These are synoptic stations and represent large-scale climate conditions. According to the Guide to Instruments and Methods of Observation [34], the synoptic scale is equal to mesoscale, i.e., 3–100 km. These stations capture large-scale climate conditions but may not resolve fine-scale urban variability. The representativeness of stations located in Warsaw was studied by the authors [21,35]. There is no certainty that Urban Heat Island (UHI) has no effect on the Warsaw-Okęcie station, but if there is such an effect, it is less than on other Warsaw stations. Because of the above- mentioned facts, the data from Okęcie was used for this work. The situation is similar in case to the other stations, taking into account in this work and located in the airports, i.e., Wrocław, Poznań, and Łódź. Airport stations were prioritized for consistency in measurement protocols and minimal UHI interference.

2.4. UTCI Calculation

UTCI is defined as the equivalent air temperature at which, in reference conditions, the basic physiological parameters of the human organism would adopt the same values as in real conditions. It is a one-dimensional value reflecting the response of the organism to multidimensionally described meteorological and physiological information. The assumption of this approach is that the heat exchange between humans and their surroundings depends only on air temperature (Ta) at a constant level of the remaining meteorological parameters [36,37]. The index is based on the multifactorial thermoregulation model of the human organism by Fiala [38,39], covering two heat exchange regulation subsystems: passive and active. UTCI values are a measure of the heat stress of the organism and are expressed in °C. To calculate UTCI values, BioKlima 2.6 software was used with default parameters [40] with implemented computation algorithms with the application of the sixth-degree exponential function [41].

2.5. Statistical Analysis

The one-way ANOVA test was used to check for statistically significant differences between the monthly average UTCI values of different cities, both for basic daily values and average monthly values. The test did not yield statistically significant results for the monthly averages, and significance was observed in the daily data.
This can be explained by the fact that meteorological conditions change from day to day, and these changes can be considerable even for a smaller-scale area, whereas climatic conditions, represented as monthly or annual average values, are more homogeneous. On the other hand, a different result of the significance of differences testing can also be explained by the sample size. The value of the test includes the correlation coefficient and the sample size expressed as the number of degrees of freedom. When testing the significance of differences in mean values of two variables and a period of 24 years, the number of degrees of freedom is 22. When testing the significance of differences in daily values (source data), the sample size increases to 8760.
For the obtained UTCI values, according to the heat load scale (Table 1) the appropriate heat load was assigned. The obtained results were presented as the relative frequency of individual thermal loads in different time courses (in %): months, particular years, seasons (spring from March to May, summer from June to August, autumn from September to November, and winter from December to February) and for all of the considered period of 2001–2024. In addition, the relative frequency of individual UTCI index value classes (in %) was calculated.
Then the average, maximum, and minimum values of UTCI for each considered station were determined in the long-term period and the equations of both linear trends and non-linear polynomial trends. The trends that were the best fitted and had the higher R2 determination coefficients were selected and presented in the paper. Then, similarly to UTCI for each category of thermal loads, trend equations with determination coefficient R2 were determined. The statistical significance of trends was verified with a Student’s t-test by the use of Statistica 13.3 software for this purpose.

3. Results

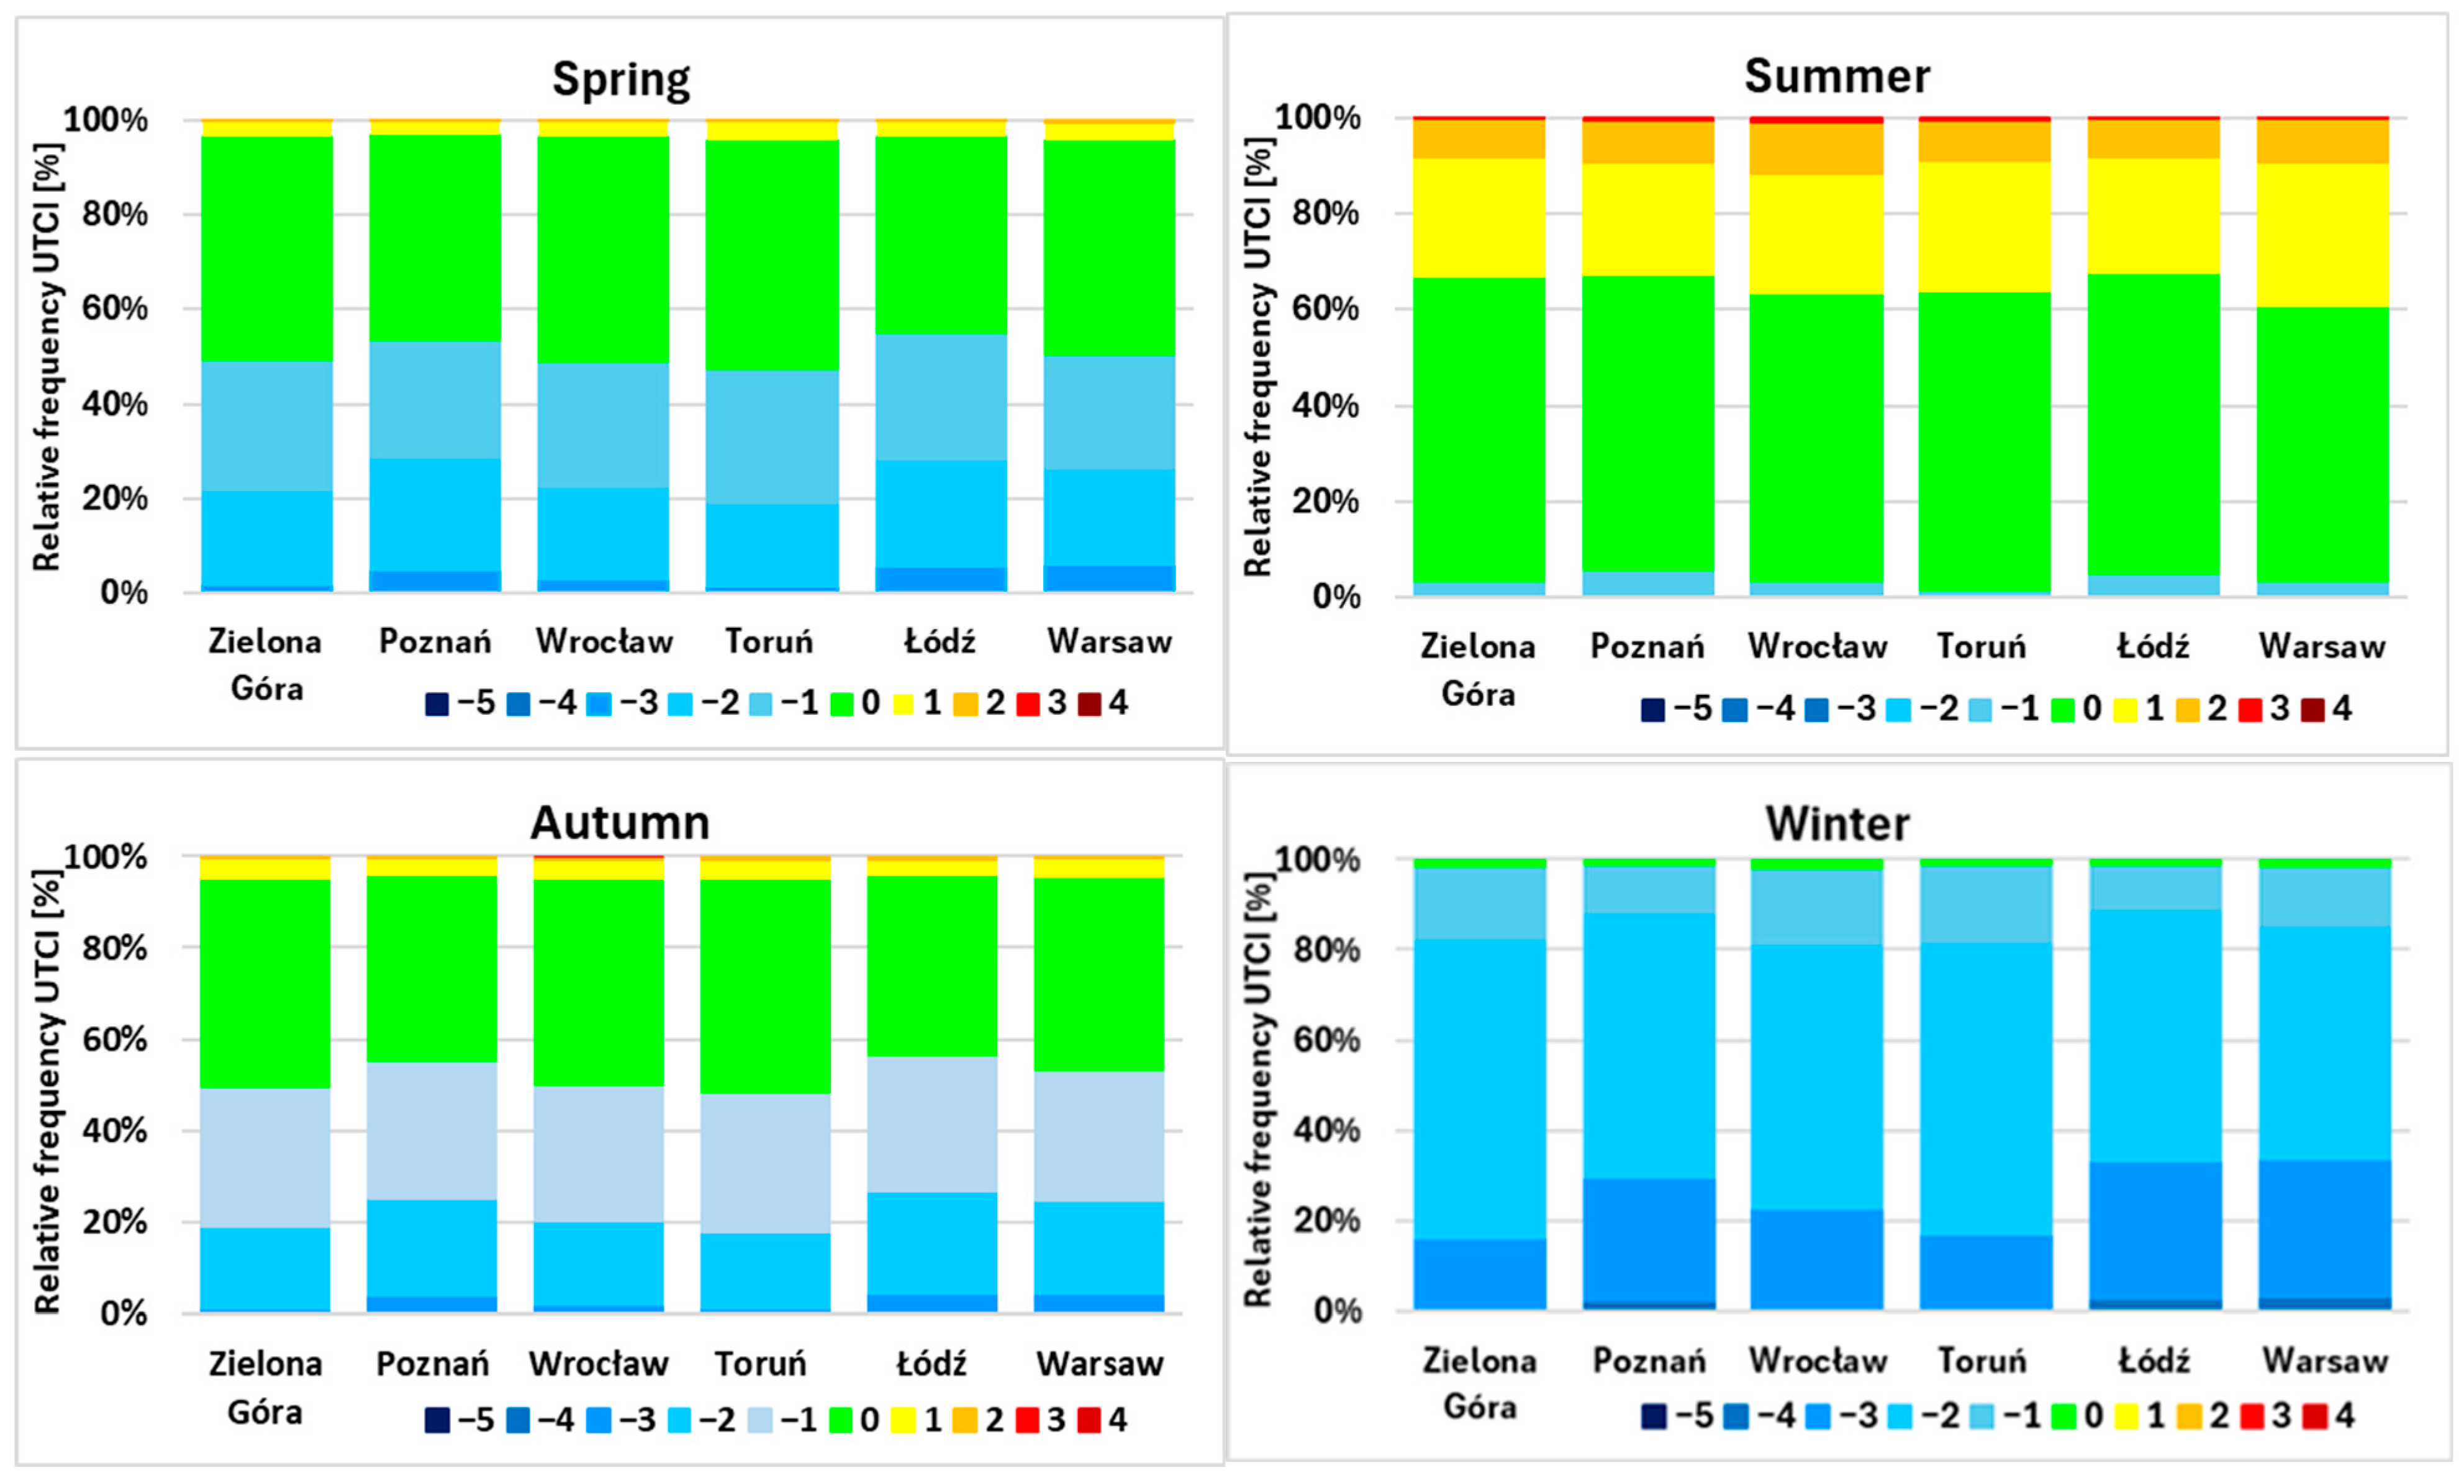
3.1. Spatial Patterns

In the analyzed period of 2001–2024, the average annual UTCI value in the Central Region (IV) was 7.7 °C, which is classified as “slight cold stress” (category −1). However, the index values vary in space, from the west and north-west (Toruń 9.0 °C, Zielona Góra, and Wrocław 8.4 °C) towards the south-east to 7.2 °C Warsaw, 6.5 °C Łódź. The only exception is the value for Poznań 6.7 °C) (Table 2). A similar trend is visible with the distribution of the maximum UTCI value, and the highest ones, i.e., above 40.0 °C, classified to category 3 “very strong heat stress” occurred in Zielona Góra, Wrocław, and Warsaw, and the lowest in Poznań 39.9 °C and 39.4 °C in Łódź, and it is usually in July or in August. In turn, the spatial distribution of the lowest minimum UTCI value (below—40 °C, which is classified as −5 “extreme cold stress”) is similar to the distribution of the average and maximum UTCI values presented above. The severest conditions are in the eastern part of the region, in Warsaw (−44.6 °C) and Łódź (−40.7 °C), and milder in the western part. They are classified to the −4 “very strong cold stress” category in Zielona Góra (−31.1 °C), Wrocław (−34.5 °C), and Toruń (−35.5 °C), which occurs in December or January (Figure 2). The differences in UTCI values between different stations were tested by the use of one-way ANOVA. In the case of the basic daily data, the significance was confirmed at the level of p < 0.01 but for average monthly values was not.
For the cold half-year (from October to March) and particularly in winter (December–February), the minimum values for Warsaw and Łódź—stations located in the eastern part of the region—are lower compared to other locations. In turn, for the Zielona Góra station, the minimum values are the highest. The big difference between the UTCI index values, especially in the cold half-year, can be associated with the fact that during the winter, the polar and arctic continental air masses inflow over the eastern part of the Polish Lowland more frequently, bringing frosty air and more severe winters. In the west, on the other hand, the polar maritime air mass mentioned in the description of the region covers the region more often, mitigating the course of winter. In the warm half of the year, the differences are smaller than cold but also bigger than those for the average and maximum values.
In addition, greater differences in maximum and minimum values may be a confirmation of the nature of climate change in the first decades of the 21st century. One of the effects of climate change is the intensification of extreme phenomena, the occurrence of greater interannual differences in the course of air temperature or amounts of precipitation, etc. Therefore, the minimum and maximum values of the UTCI index have a bigger differentiation, which is not noticed in the course of the average values.

3.2. Statistical Significance

For the average, maximum, and minimum value of the UTCI index, linear trend equations and R2 coefficients of determination were stated. In the case of average values, the trend line equation is statistically significant at the level of p < 0.01 for Zielona Góra, Wrocław, Warsaw, and Łódź. It is slightly worse at the level of p < 0.05 for Poznań and Toruń. In the case of extreme UTCI values, only for the minimum in Zielona Góra a statistically significant trend was obtained. The rate of increase of the average UTCI value ranges from 0.6 °C/decade in Poznań and Toruń to 1.8 °C/decade in Warsaw. In the case of the significant trend for minimum values, the increase varies between 2.7 °C/decade in Zielona Góra to 4.7 °C/decade in Warsaw. In Table 3, equations of the trends are given unified as linear or with all values. In Figure 3, the equations of the trends of average, maximum, and minimum values were presented. The trends of average and minimum values are statistically significant at the level of p < 0.05. The determination coefficients R2 for averages ranges from 0.67 (Warsaw) to 0.36 (Toruń) and for minimal values ranges from 0.37 (Warsaw) to 0.22 (Wrocław).

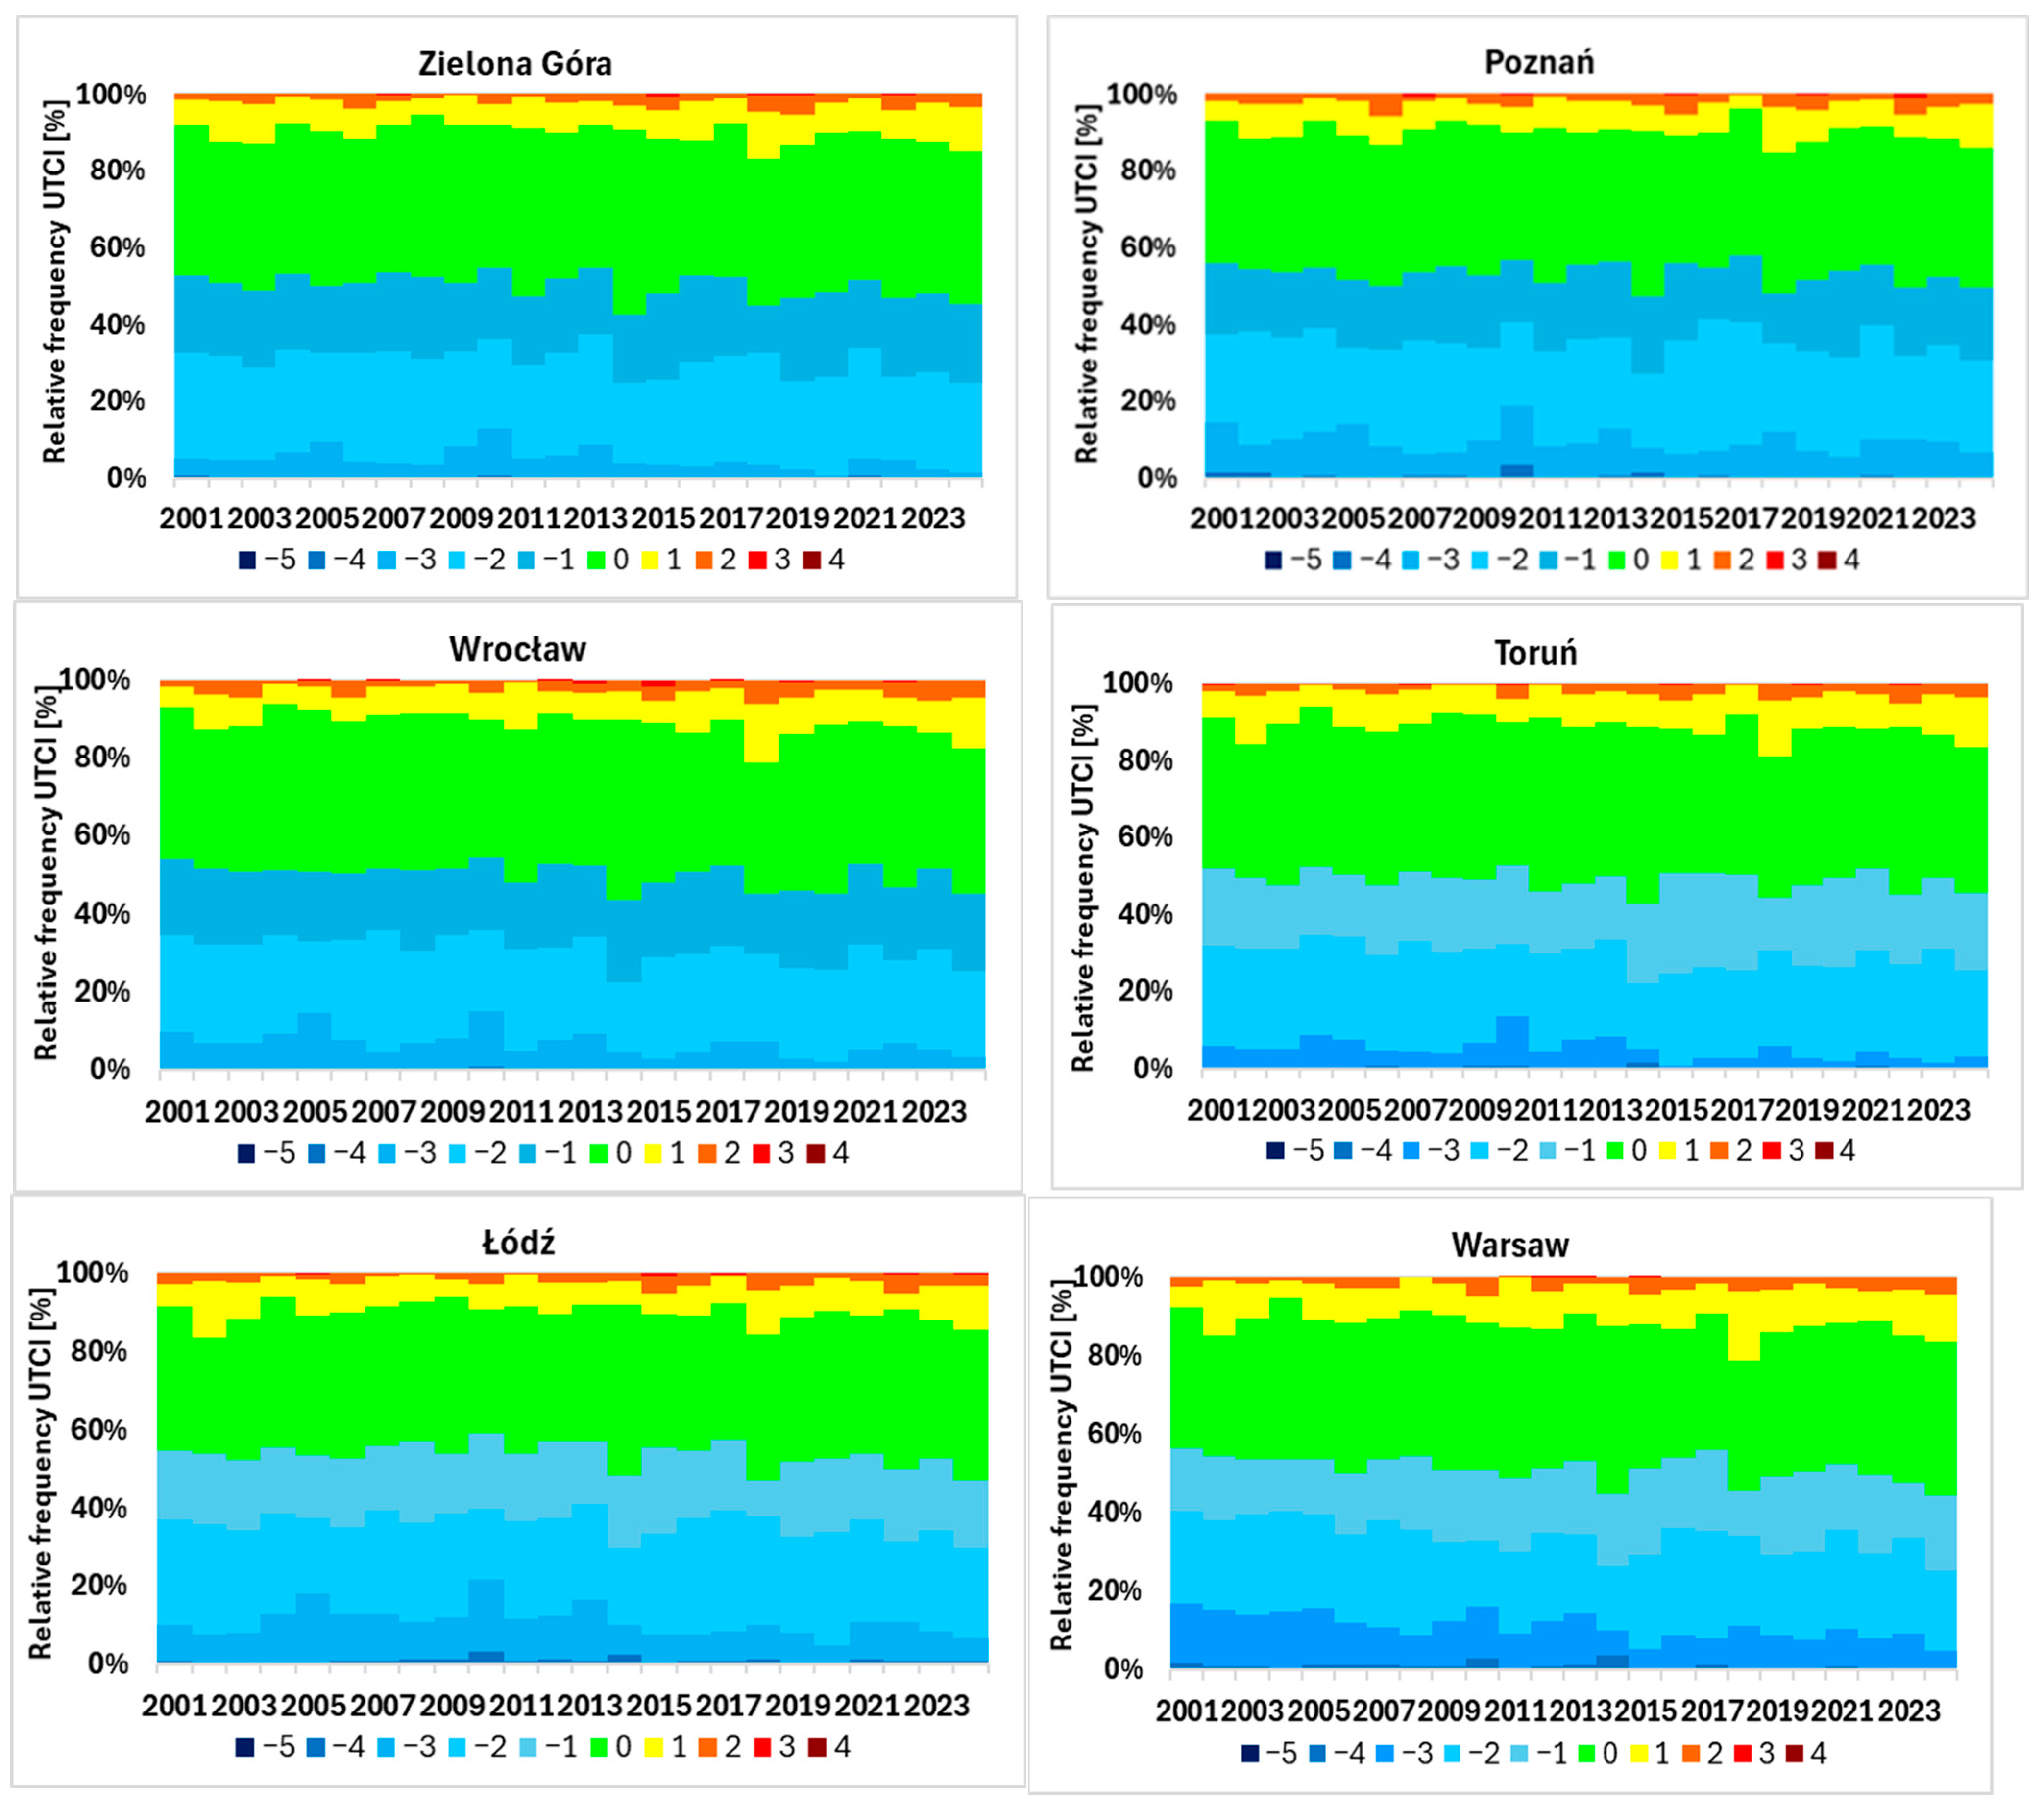
3.3. Temporal Trends

In the next step, linear trend equations were determined for the number of days for individual heat load categories (Figure 4). The determined trends are statistically significant (p < 0.05) only for the category “strong cold stress” (−3) in Wrocław and Warsaw, “moderate heat stress” (1) in Wrocław, and “strong heat stress” (2) in Toruń.
As expected for the category ”strong cold stress” (−3), a negative trend was obtained with the determination coefficients R2 = 51% and 26% for Warsaw and Wrocław, respectively, and for the categories “moderate heat stress” (1) and “strong heat stress” (2), a positive trend was obtained with R2 = 23% and 24% for Wrocław (in category 1 and Toruń in category 2), respectively. According to the linear trend equation, the occurrence change of number of days decreases 11.2 days per decade for Warsaw and 8.4 days per decade for Wrocław in the category “strong cold stress” (−3), increases 6.2 days per decade for Wrocław in the category “moderate heat stress” (1), and increases 3.5 days per decade for Toruń in the category “strong heat stress” (2).

3.4. Extreme Events

In the next step, the relative frequency of occurrence of heat stress in different time intervals was examined: Figure 5 shows the relative frequency in all of the analyzed period 2001–2024; in the seasons, Figure 6; and in months, Figure 7 at all the stations. The most frequent category is (0) or “comfort” in the range of 36–40%, which together with the category of “moderate heat stress” (1) and “slight cold stress” (−1) are called sparing conditions and do not cause heat stress in the human body. Their total frequency is over 60% (from 62% in Poznań to 68% in Toruń). The second most frequent category was (−2) “moderate cold stress”, which ranged from 22.9% (Warsaw) to 25.8% (Poznań, Zielona Góra, Łódź). In the case of burdensome heat loads, i.e., categories 2 and 3—“strong” and “very strong heat stress”, they occur together with a frequency of 2.2% (Zielona Góra) to 3.2% (Wrocław). The least frequent category occurring in all considered cities is category (−3) “strong cold stress” and category (−4) “very strong cold stress”, the frequency of which is below 1%, from 0.1% (Zielona Góra) to 0.8% (Warsaw, Łódź). The most burdensome category (−5) of “extreme cold stress” occurs in the period studied only at two stations, in Warsaw and Łódź, 0.02% and 0.01%, respectively, which means 2 and 1 cases, respectively, for the period 2001–2024. The most burdensome category for the body, i.e., “extreme heat stress”, did not occur at any station even once.
Figure 6 shows the frequency of heat stress in the individual seasons of the year. The most favorable bioclimatic conditions, i.e., those that do not burden the body, occur in almost all seasons of the year except winter. Conditions that do not burden the body, i.e., the three categories of heat stress in all (−1, 0, 1) range from 70 to 80% in spring and autumn to 92% in summer. It is worth noting here that in Wrocław, the lowest frequency of comfortable conditions was in summer (88%), and a higher frequency of “strong heat stress” (category 2) above 10% occurred in comparison to other analyzed cities. It is probably due to the city’s location in the warmest region of Poland, which affects the more frequent heat stress of the human body. In the summer, the highest frequency of heat stress relating to categories 2 and 3, with the highest values, occurs in larger cities: Wrocław, Warsaw, and Poznań, above 9%. Only in winter the highest loads related to cold stress occur, i.e., from “strong” to “extreme cold stress” (categories from −3 to −5), which in total vary within a fairly wide range from 16% (Zielona Góra, Toruń) to 33% (Łódź, Warsaw). Significantly frequent cold stress loads occur at these two stations and only there single cases of the most extreme category (−5), i.e., “extreme cold stress” were recorded there. This can be explained by the location of Warsaw and Łódź in the eastern part of the Central Bioclimatic Region, where continental climate features are evident with colder winters and warmer summers.
Next, our analysis examined the annual cycle of heat load category percentages for each city (Figure 7). Months with the most favorable bioclimatic conditions, i.e., covering 3 categories—“moderate heat stress”, category 1; “comfort”, category 0; and “slight cold stress”, category −1—occur at all analyzed stations from April to October, and the frequency ranges from 75% (for Poznań) to 98% (for Toruń, Wrocław, Zielona Góra). April and November also can be included as favorable months in terms of the body’s thermal load because the frequency of favorable conditions is about 50% in all cities. The least favorable months for the body are January and December, where the frequency of favorable conditions is only 6–18%. However, among the winter months, in February, favorable conditions for the body occurred with a frequency of 16% for Łódź, Warsaw, and Poznań to 26% (for Toruń, Wrocław, Zielona Góra). Conditions burdening with “strong” and “very strong cold stress” (category −3, −4) are much more frequent than conditions with “strong” and “very strong heat stress” (category 2, 3). The frequency of cold stress ranges from 20% (in Zielona Góra) to 40% (Warsaw, Łódź). In the cities of Warsaw and Łódź, unbearable cold stress, i.e., “extreme cold stress” (category −5), also occurred, 0.3% and 0.1%, respectively. On the other hand, the frequency of heat stress (category 2 and 3) was similar at all the stations studied and fluctuated in a small range of about 10%. Category 2, “strong heat stress”, ranged from 9.4% (for Zielona Góra) to 12.9% (for Wrocław), and category 3, “very strong heat stress”, ranged from 0.3% (for Warsaw and Łódź) to 1.1% (for Wrocław).
In the last stage of the work, the frequency of UTCI heat loads was determined in individual years, as shown in Figure 8. The most favorable conditions that do not burden the body, i.e., the three categories of heat stress (−1, 0, 1) are at most stations and exceeded 70% in 2014 and 2015 and in 2020, 2023, and 2024. Only in Poznań conditions are slightly less favorable and ranged from 66 to 69%. The lowest frequency of non-burden conditions ranging from 56 to 61% is characteristic for the first analyzed years from 2001 to 2005 and the years 2010 and 2018. On the other hand, the years with the most frequent and most burdensome bioclimatic conditions in the heat stress categories (from 2 to 4) are at most stations in a similar period and in the following years: 2007, 2010, 2015, 2018, 2019, 2022, and 2024. Rarely observed (1–5 cases total) and not in all years did the “very strong heat stress” (category 3) occur, which ranged from 0.3% to 1.9% (for 2015 in Wrocław). Wrocław is the city with the highest frequency of extreme heat stress. In none of the analyzed years did “extremely heat stress”, i.e., category 4, occur. On the other hand, the analysis of the occurrence of heat load frequency related to cold stress, i.e., categories from (−3) to (−5) (from “strong” to “extreme cold stress”) indicate that their highest frequency occurred in the following years: 2002, 2010, 2013, 2014, 2018, and 2022, with a frequency from 5% to 20%. The most unbearable category (−5), “extreme cold stress” occurred only at two stations: in Warsaw in the years 2002 and 2014 (0.3%) and in Łódź in the year 2014 (0.3%).

4. Discussion and Summary

In the Central Bioclimatic Region (IV) of Poland in the 21st century (in the years 2001–2024) based on the study for 6 cities: Wrocław, Zielona Góra, Poznań, Toruń, Łódź, and Warsaw, the period in which people may enjoy the most favorable conditions for recreation, leisure, and tourism is the period between April and October. During this time, the situations that do not cause any thermal burden on humans are dominant, the so-called conditions that are gentle to the body, which include the following: category 0, “comfort”; category 1, “moderate heat stress”; and category −1, “slight cold stress”, and the UTCI values for these categories range from the frequency of 75% in April (Poznań) to 98% in May, June, and September (Toruń, Wrocław, Zielona Góra). Also, the months of April and November are characterized by favorable, comfortable conditions at the level of 50%.
The most favorable conditions of “no thermal load” (class 0) were also found in summer from 57.3% (Warsaw) to 63.7% (Zielona Góra), in spring from 41.3% (Łódź) to 48.3% (Poznań), in autumn from 39.8% (Łódź) to 47.1% (Toruń), and in winter only from 1.0% (Toruń) to 1.8% (Wrocław). In the period of 2001–2024, the average annual value of the UTCI index in the Central Region (IV) was 7.7 °C, which answers to “slight cold stress” (category −1). The index values were spatially variable and decreased from the west and north-west: Toruń 9.0 °C, Zielona Góra, and Wrocław 8.4 °C and towards the south-east to 7.2 °C Warsaw, 6.7 °C Poznań, and 6.5 °C Łódź.
The threshold values in the individual heat stress categories according to UTCI were determined based on the critical levels of physiological reactions [41,42]. In the analyzed period (2001–2024), the range of UTCI values had a large amplitude. In January, “extreme cold stress” (class −5) was recorded in Warsaw (−44.6 °C), in Łódź (−40.6 °C) and in December below −31 °C in the remaining four cities, which indicates “very strong cold stress” (category −4). In the same period, 2001–2024, the highest value of the index reached above 40 °C, i.e., “very strong heat stress” (category 3) in Zielona Góra, in Wrocław, and in Warsaw for the months of July and August. This indicates that the range of thermal load is very wide, and in every month between four to five categories may occur, and during the year thermal stress from extreme cold stress to very strong heat stress may occur. Conditions loading with “strong cold stress” and “very strong cold stress” (category −3 and −4, respectively) occurred much more often than conditions with “strong heat stress” and “very strong heat stress” (category 2 and 3, respectively). An analysis of frequency for months showed that cold stress (category −3, −4) ranged from 20% (in Zielona Góra) to 40% (in Warsaw and in Łódź). At the same time, in the cities of Warsaw and Łódź, there were also loads of the most burdensome cold, i.e., “extreme cold stress” (category −5) of 0.3% and 0.1%, respectively. On the other hand, categories related to heat stress (category 2 and 3) were similar at all considered stations and fluctuated within a small range of about 10%.
Similar results were obtained with earlier research in Poland [14,17,20,21,43,44,45,46,47,48,49,50]; their studies show that one of the effects of severe heat and cold stress is a possible increase in mortality both in high and low air temperatures, caused by a loading on the body with thermoregulatory reactions in order to adapt the heat management of the body to the prevailing environmental conditions. In low temperatures, the basic condition is a reduction in peripheral blood flow, and in high temperatures, autonomic reactions are activated to protect the body from overheating. This may result in heat shock or permanent damage to protein structures inside the cells. Another danger associated with high ambient temperature is dehydration of the body. Various complications in the functioning of the body may occur, which in extreme cases lead to overheating and death, even in healthy and mature people.
Błażejczyk et al. [43] studied the effect of heat stress on mortality based on the UTCI index of the data from the years 1993–2002. The strongest statistically significant correlations were obtained for Warsaw in February, July, and August. The UTCI threshold above which a significant increase in mortality is observed in summer can be assumed is 32 °C. This value of the index is classed as strong, very strong, and unbearable heat stress, generally called heat stress. The winter UTCI threshold below which mortality increases significantly was assumed as −13 °C, which includes strong, very strong, and extreme cold stress, generally called severe cold stress. It turns out that biothermal conditions characterized by strong cold stress caused a 17% increase in the risk of death (compared to a thermally neutral situation), and in a situation of very strong cold stress, this increase was almost 32%. In cases of strong heat stress, there was also a 17% increase in the risk of death (the value comparable to strong cold stress). On the other hand, on days with very strong heat stress, the risk of death was greater over 50% than in the case of lack of heat loads.
This study showed that the rate of increase of the average UTCI value ranged from 0.6 °C/decade in Poznań and Toruń to 1.8 °C/decade in Wrocław and Warsaw. For the maximum value, the rate of change was smaller, and a differentiation between stations also was smaller and varied from 0.5 °C/decade (in Warsaw) to 1.1 °C/decade (in Łódź and Toruń). On the other hand, for the minimum UTCI value, the greatest increase and differentiation between stations varied from 0.4 °C/decade in Toruń and in Poznań to 4.7 °C/decade in Warsaw.
In summary, in the Central Bioclimatic Region (IV), covering the largest lowland area of Poland, it can be stated that the heat loads between considered stations are similar. Stations located in the western part of the region (Zielona Góra, Wrocław, Poznań, and Toruń) are characterized by slightly milder, more favorable bioclimatic conditions but also higher heat stress, especially extreme loads (in Wrocław). On the other hand, the Łódź and Warsaw stations are characterized by a higher frequency of extreme cold stress loads.
The research by Błażejczyk et al. [14,44], conducted in the years 1973–2014, shows that the number of days with strong heat stress had an upward trend and high variability from year to year, ranging from 1 to 21 days. In this work, the range of fluctuations in the number of days with strong heat stress from year to year is 1–18 days, similar to the range 1–13 obtained in studies for Szczecin by Mąkosza [47]. The forecast for Poland for the years 2000–2100 developed by Błażejczyk et al. [43] confirm such trends. For example, for Warsaw, based on UTCI, an increase in the number of days with heat stress by 0.9 days/decade is predicted. In other regions of Poland, a similar trend of changes in the frequency of days with heat stress can be expected. Tomczyk’s [20,51] research also shows that by the end of the 21st century, an increase in the frequency of hot days associated with significant heat stress should be expected. The greatest changes are predicted for southern and central Poland, which is also confirmed by this research.
The distribution of days in the year in which the lack of thermal stress is most frequent is emphasized in many studies on biothermal conditions in relation to various regions of Poland, regardless of the analyzed periods. For example, on the Baltic Sea coast the frequency of such days is 27–42% [52,53], in Warsaw 43–67% [44,49], in Białystok 9–42.3% [43], in Gorzów Wielkopolski, Zielona Góra and Słubice (the cities also located in the Central Bioclimatic Region of Poland (IV)) 36–40% [44], and in Lesko and Lublin 35–37.8% [54,55].
Tomczyk and Bednorz [20] in their work proposed a new biometeorological classification of Poland. The previous division of Poland into bioclimatic regions by Kozłowska-Szczęsna 1991 [56] with modification by Błażejczyk 2003 (used in work) [57] is based on the frequency of selected characteristic days with stress conditions and additionally on biothermal conditions. On the other hand, the proposed new classification by Tomczyk and Bednorz 2023 [20] is based on the variability of the average annual and seasonal values of the UTCI index and its standard deviations. According to this new division, the large Central Region analyzed in this paper was combined with the central-western part of Poland. According to the new division, two included analyzed cities, Zielona Góra and Toruń, would be located outside the region fixed by Kozłowska-Szczęsna et al. [30,58]. It seems that the criteria of both divisions are important and significant, therefore, for a complex and objective determination of regions in Poland, it would be worth attempting in the future to create a new classification based on the criteria of both divisions, i.e., both the frequency of occurrence of days characteristic for stress conditions and thermal conditions, as well as statistical characteristics and their variability (average, maximum, minimum, and standard deviation).

5. Conclusions

  • The results of the research carried out on the Central Region of Poland (IV) show satisfactory applicability of the UTCI in analysis of spatial and temporal distribution of heat stress.
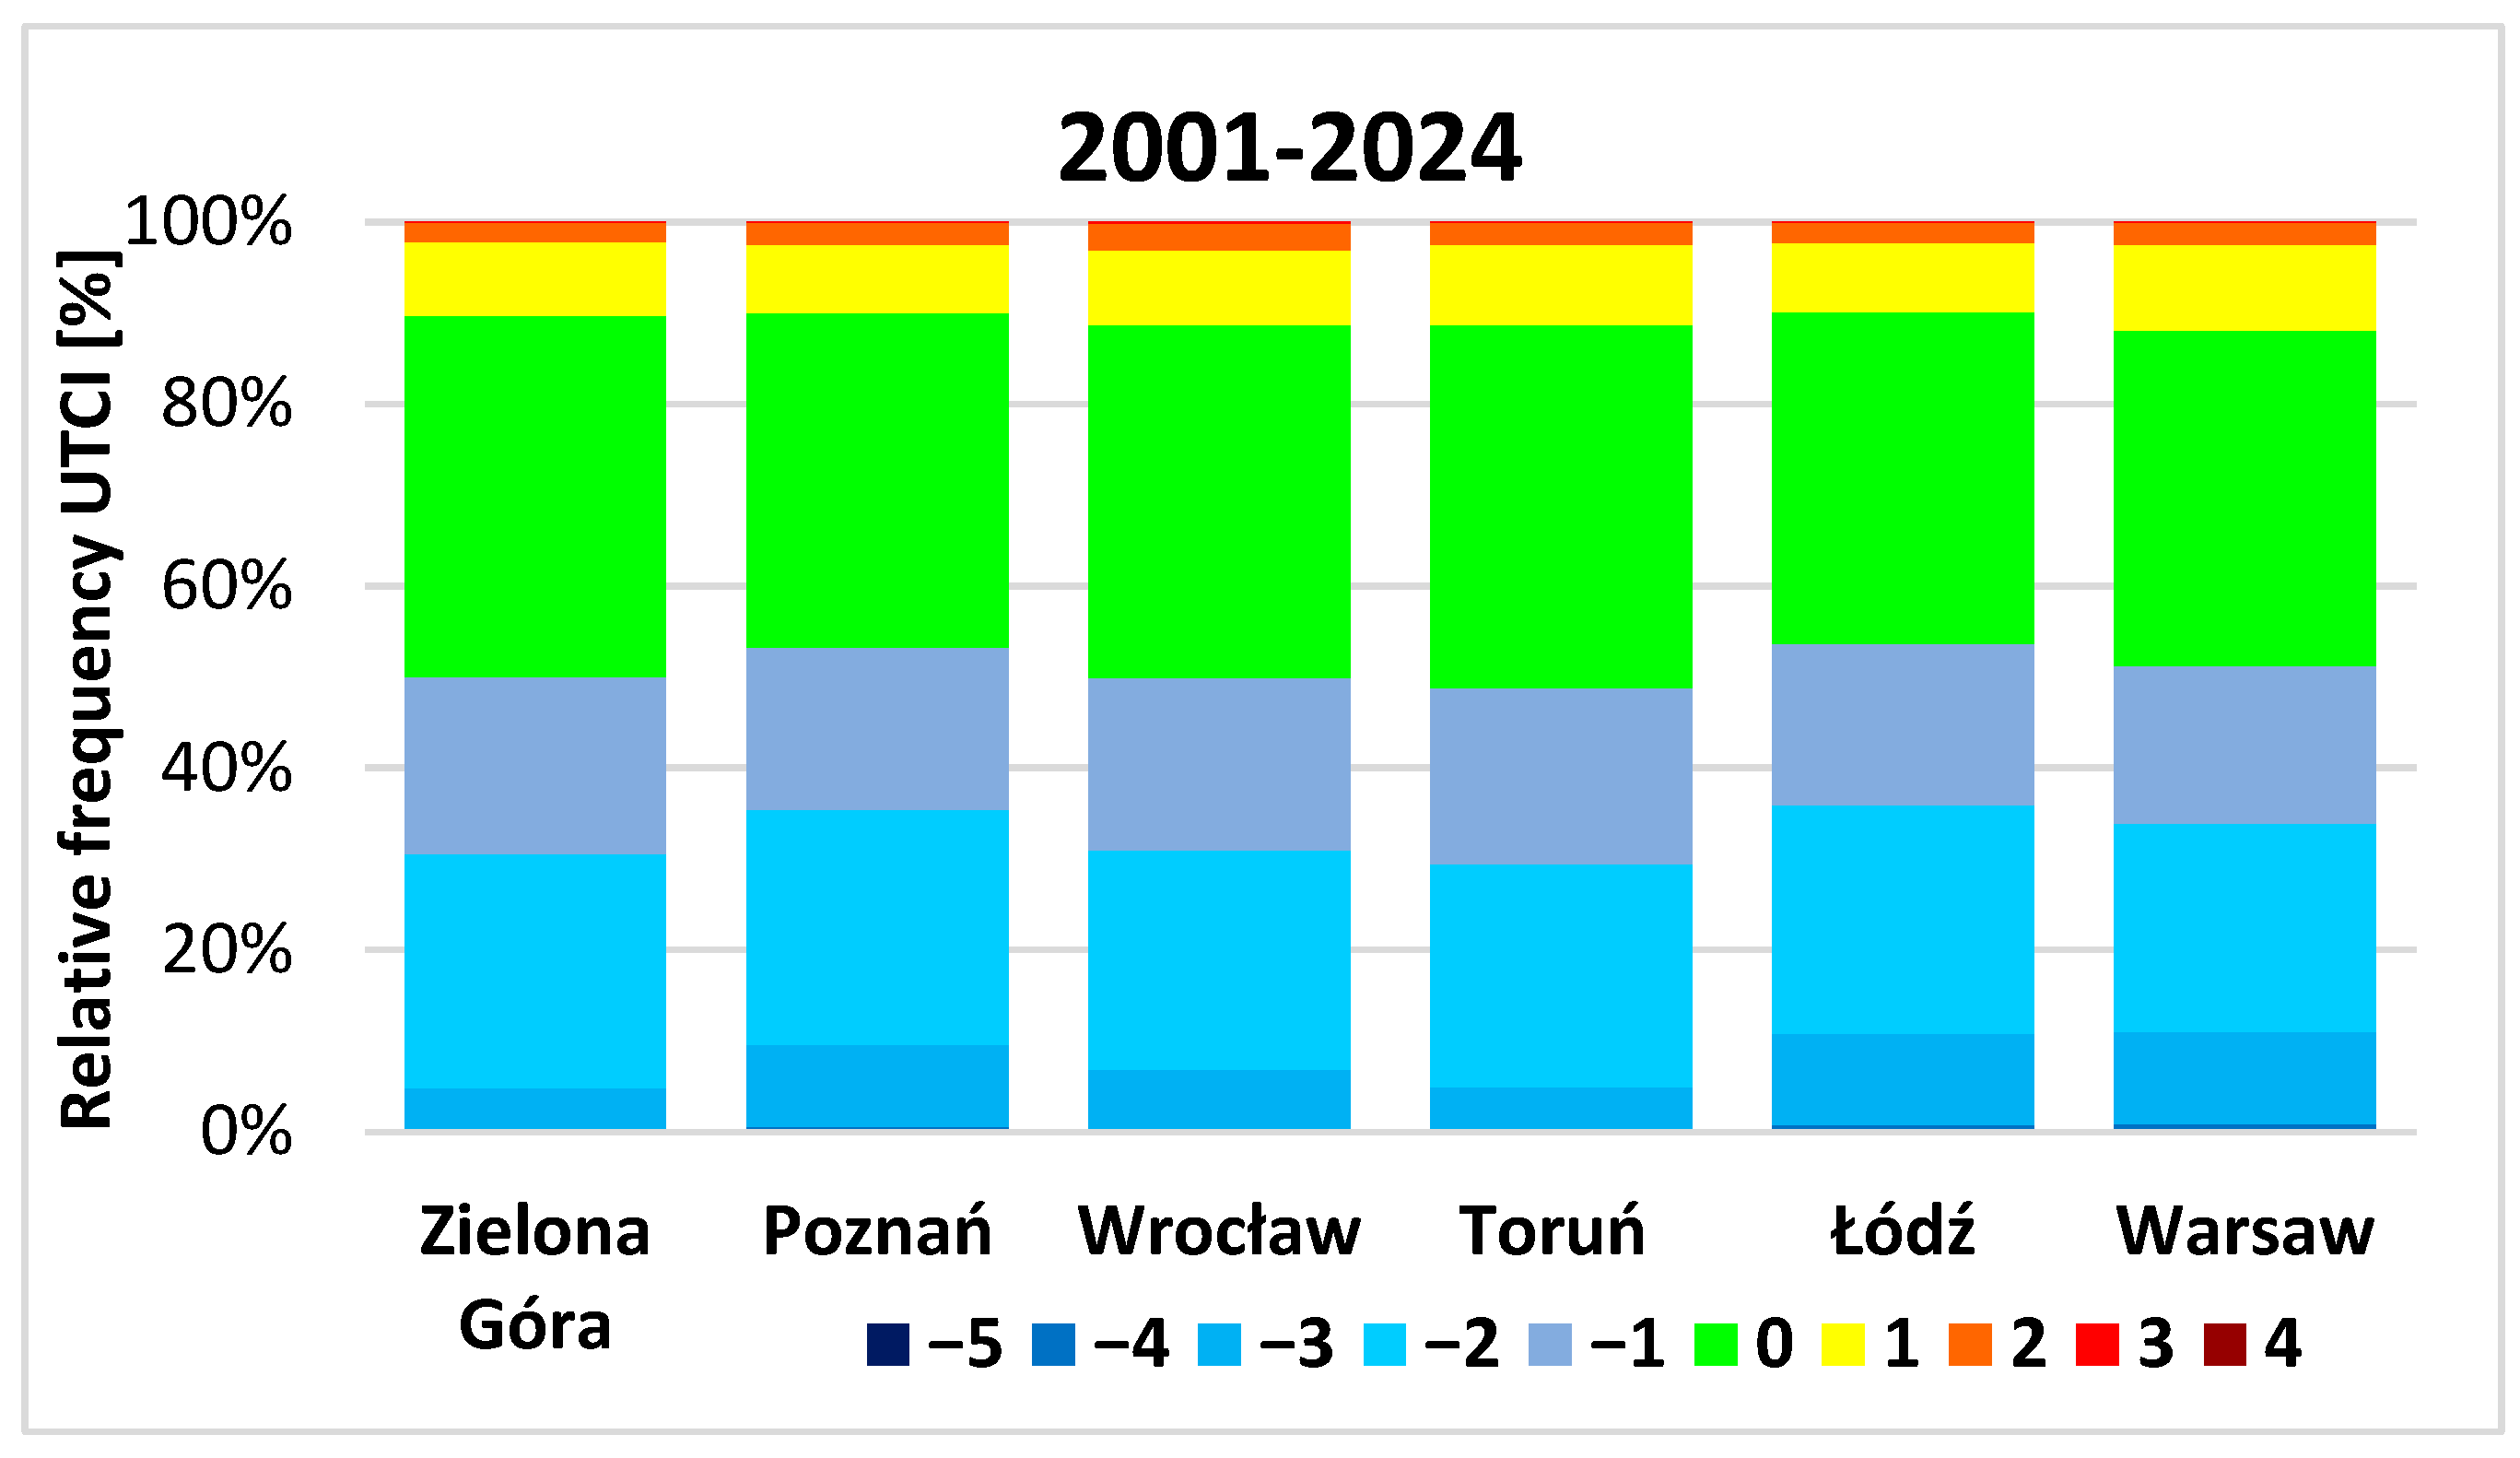
  • Favorable bioclimatic conditions, characterized as “comfort,” comprised over 60% of the total occurrences, primarily during spring and autumn. On the other hand, unfavorable conditions related to extreme cold stress were rarely noted, underscoring the mild thermal stress in the region. The frequency of thermal stress fluctuated across seasons and years, with the most favorable conditions occurring from April to October. January and December were the least favorable months, while instances of “extreme heat stress” did not occur during the study period. Overall, the analysis highlights significant trends in thermal comfort and stress, showing the regional disparities and temporal changes in bioclimate conditions affecting human well-being.
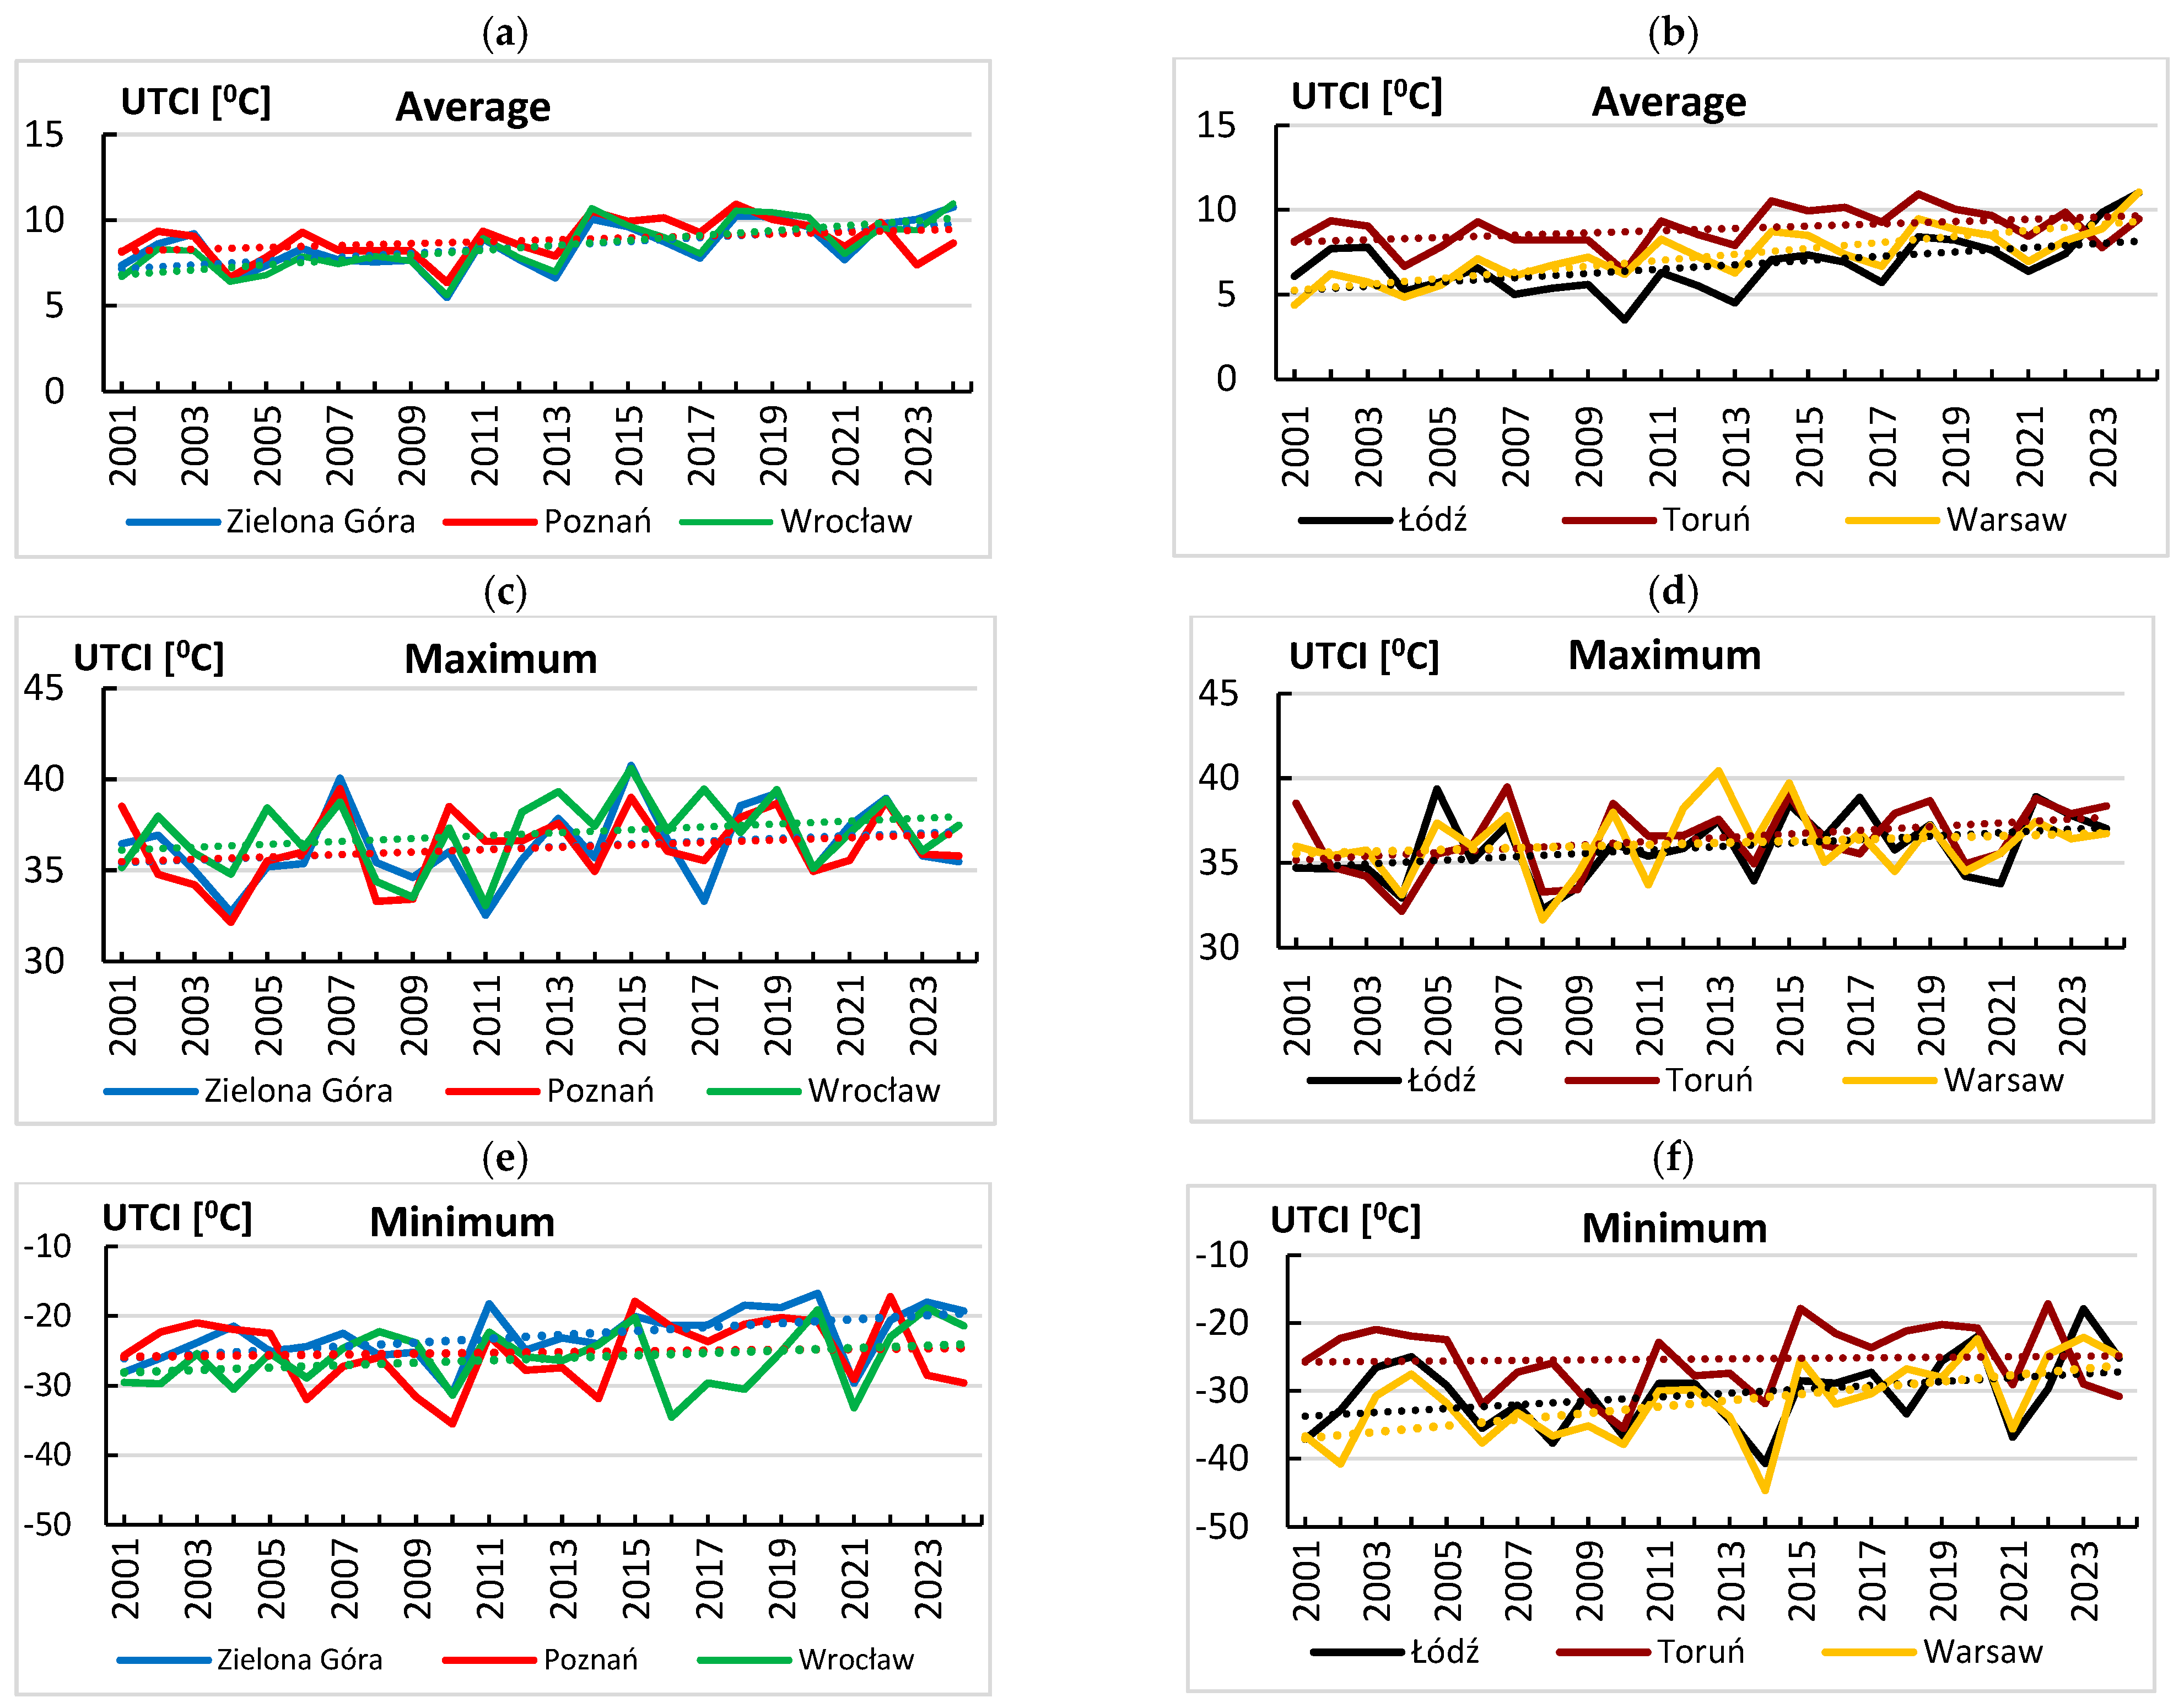
  • The average annual UTCI of 7.7 °C indicates “slight cold stress,” with variations among analyzed cities—higher values in the west and northwest compared to lower ones in the southeast. Maximum UTCI values showing “very strong heat stress” exceeded 40.0 °C mainly in July and August primarily in the western part, i.e., Zielona Góra and Wrocław, although for Warsaw (the largest city in Poland but located in the eastern part) the values also exceed 40.0 °C. It can be associated with the fact that during the summer, continental tropical air masses inflow over this part of Poland more frequently, bringing hot air and heat waves. Minimum values indicating “extreme cold stress” were recorded in the eastern region, occurring during the winter months.
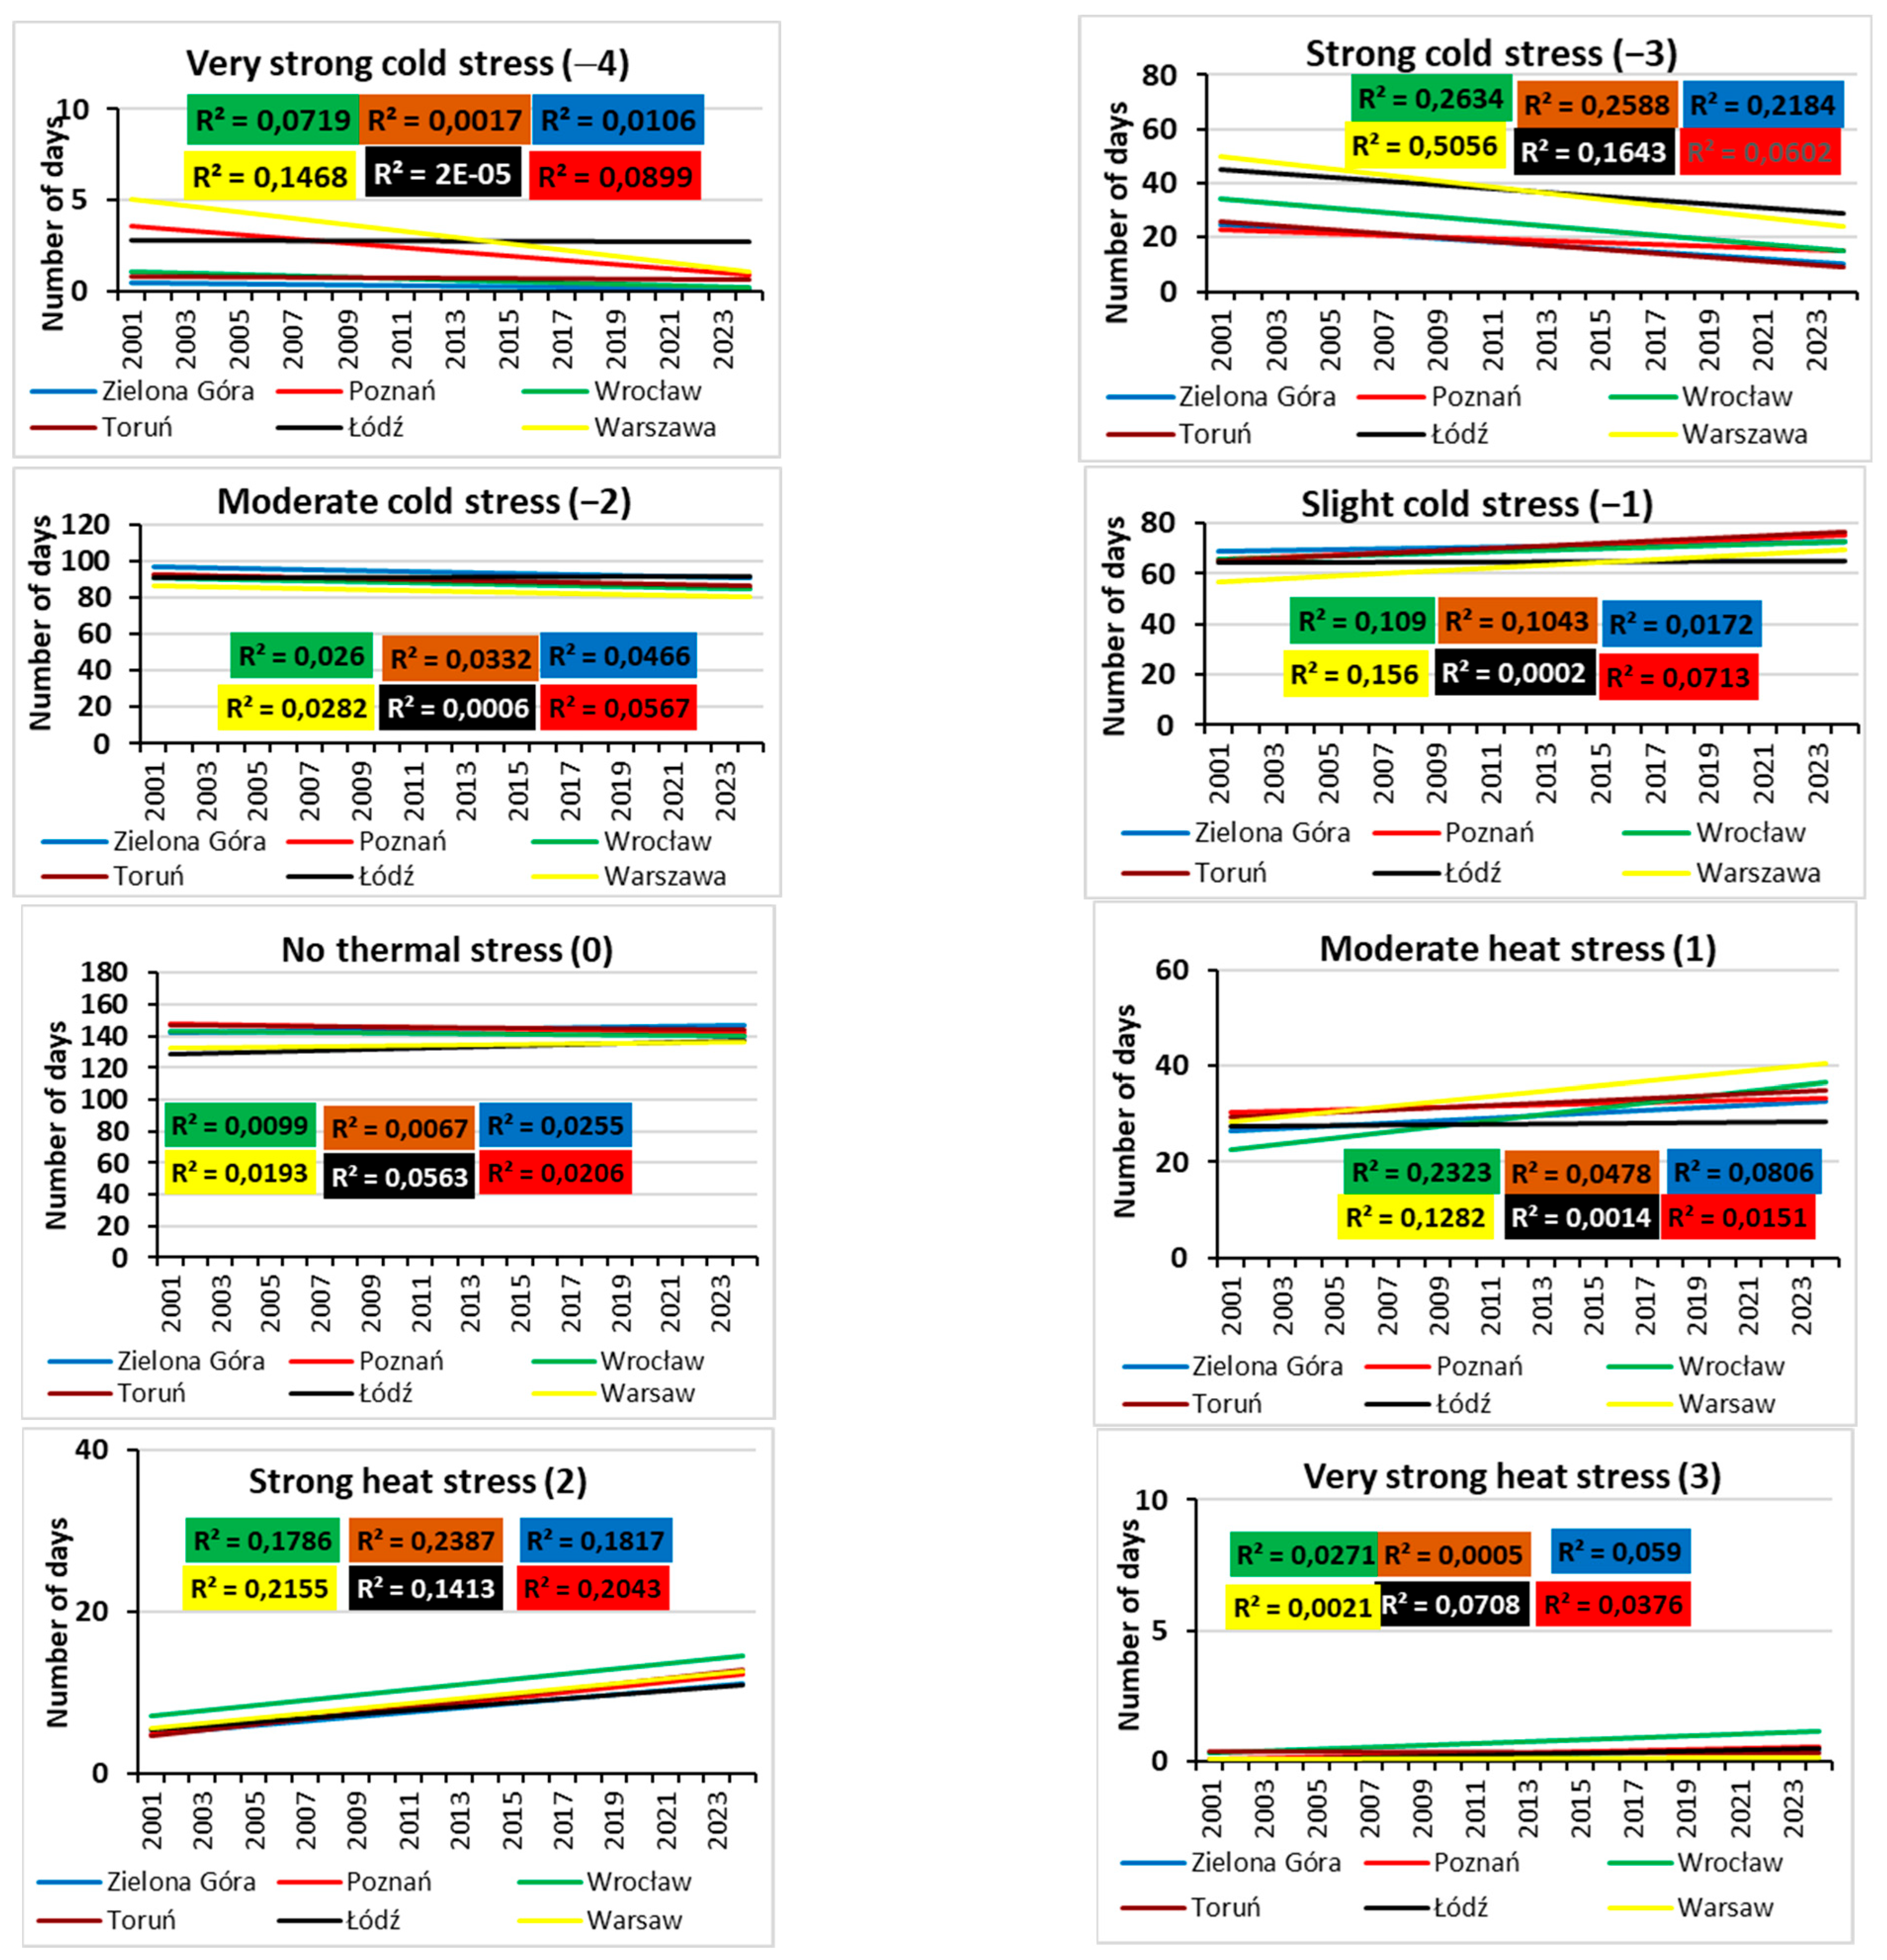
  • The study stated the trends in UTCI values and an overall increase across all analyzed stations in the region, with rates of increase varying from 0.6 °C to 1.8 °C per decade. Non-linear trends had higher coefficients of determination, suggesting that climate systems may exhibit non-linear responses in temporal stress distribution. Positive linear trends for heat stress categories were observed, especially in “strong heat stress” (category 2), contrasted by negative trends for “strong cold stress” (category −3), indicating a decrease in colder conditions. Therefore, it may be generalized that the temporal analysis of UTCI and related heat loads in the region shows a correlation with an increase in the air temperature, consistent with the climate change trend in the period 2001–2024.
  • In the case of obtaining a linear trend, and such a situation occurring for the average UTCI values and the frequencies of individual thermal stress categories, such equations can be extrapolated, with some restrictions. It gives the opportunity of forecasting the occurrence of individual thresholds of the Index and thermal stress categories in the future.
  • The results of this analysis can be used in spatial planning, adaptation, and mitigation of the effects of climate change, particularly in relation to the increasing frequency of extreme thermal stress, as well as to prepare transparent information on the bioclimate for both city tourism and agritourism.
  • These findings underscore the need for further research and analysis of bioclimatic conditions in Poland, as well as other regions, on a new classification. The current classification comes from a period when the commonly used biometeorological indices, e.g., UTCI and others, have not been developed. It is therefore valid to attempt to update or specify the bioclimatic subdivision of Poland, taking into account the spatial and temporal distribution of present-day available parameters.

Author Contributions

Conceptualization, K.R. and T.R.; methodology, K.R.; software, K.R.; formal analysis, K.R., T.R. and G.M.; investigation, K.R.; resources, K.R. and T.R.; data curation, G.M.; writing—original draft preparation, K.R.; visualization, K.R. and T.R.; supervision, K.R. All authors have read and agreed to the published version of the manuscript.

Funding

This research received no external funding.

Institutional Review Board Statement

Not applicable.

Informed Consent Statement

Not applicable.

Data Availability Statement

The original contributions presented in this study are included in the article. Further inquiries can be directed to the corresponding author.

Conflicts of Interest

The authors declare no conflicts of interest.

References

  1. IPCC. Climate Change 2023: Synthesis Report. In Contribution of Working Groups I, II, and III to the 6th Assessment Report of the IPCC; Lee, H., Romeo, J., Eds.; IPCC: Geneva, Switzerland, 2023; pp. 35–115. [Google Scholar] [CrossRef]
  2. Kambezidis, H.D.; Psiloglou, B.E.; Varotsos, K.V.; Giannakopoulos, C. Climate Change and Thermal Comfort in Greece. Climate 2021, 9, 10. [Google Scholar] [CrossRef]
  3. NOAA. Climate at a Glance: Global Time Series 2018. Available online: https://www.ncdc.noaa.gov/cag/ (accessed on 1 February 2025).
  4. Krüger, E.L. (Ed.) Literature Review on UTCI Applications. In Applications of the Universal Thermal Climate Index UTCI in Biometeorology; Springer: Berlin/Heidelberg, Germany, 2021; Volume 4, pp. 23–65. [Google Scholar] [CrossRef]
  5. Antonini, E.; Vodola, V.; Gaspari, J.; De Giglio, M. Outdoor Wellbeing and Quality of Life: A Scientific Literature Review on Thermal Comfort. Energies 2020, 13, 2079. [Google Scholar] [CrossRef]
  6. Naskar, P.R.; Mohapatra, M.; Singh, G.P.; Das, U. Spatiotemporal variations of UTCI based discomfort over India. J. Earth Syst. Sci. 2024, 133, 47. [Google Scholar] [CrossRef]
  7. Pantavou, K.; Kotroni, V.; Kyros, G.; Lagouvardos, K. Thermal bioclimate in Greece based on the Universal Thermal Climate Index (UTCI) and insights into 2021 and 2023 heatwaves. Theor. Appl. Climatol. 2024, 155, 6661–6675. [Google Scholar] [CrossRef]
  8. Vukmirovic, M.; Gavrilovic, S.; Stojanovic, D. The Improvement of the Comfort of Public Spaces as a Local Initiative in Coping with Climate Change. Sustainability 2019, 11, 6546. [Google Scholar] [CrossRef]
  9. Pecelj, M.; Matzarakis, A.; Vujadinovic, M.; Radovanovic, M.; Vagic, N.; Ðuric, D.; Cvetkovic, M. Temporal Analysis of Urban-Suburban PET, mPET and UTCI Indices in Belgrade (Serbia). Atmosphere 2021, 12, 916. [Google Scholar] [CrossRef]
  10. Brecht, B.M.; Schädler, G.; Schipper, J.W. UTCI climatology and its future change in Germany—An RCM ensemble approach. Meteorol. Z. 2020, 29, 97–116. [Google Scholar] [CrossRef]
  11. Błażejczyk, K.; Lindner-Cendrowska, K.; Kuchcik, M.; Baranowski, J.; Szmyd, J.; Mileski, P. Biothermal conditions of some housing estates in Warsaw. In Proceedings of the ICUC8—8th International Conference on Urban Climates, UCD, Dublin, Ireland, 6–10 August 2012. [Google Scholar]
  12. Araźny, A.; Uscka—Kowalkowska, J.; Kejna, M.; Przybylak, R.; Kunz, M. Diversity of biometeorological conditions in Toruń and its suburban area in 2012. Pol. Geogr. Rev. 2016, 88, 1, 87–108. (In Polish) [Google Scholar] [CrossRef]
  13. Mąkosza, A.; Nidzgorska-Lencewicz, J. Selected thermal and biothermal aspects of cities in Poland. Pol. J. Natur. Sc. 2017, 32, 771–782. [Google Scholar]
  14. Błażejczyk, K.; Baranowski, J.; Błażejczyk, A. Wpływ klimatu na stan zdrowia w Polsce: Stan aktualny oraz prognoza do 2100 roku. 2015 Warsaw IGiPZ PAN; Wyd. Akademickie Sedno: Warsaw, Poland, 2015. [Google Scholar]
  15. Lindner-Cendrowska, K.; Bröde, P. The evaluation of biothermal conditions for various forms of climatic therapy based on UTCI adjusted for activity. Geogr. Pol. 2021, 94, 167–182. [Google Scholar] [CrossRef]
  16. Jalali, R.; Romaszko, J.; Dragańska, E.; Gromadziński, L.; Cymes, I.; Sokołowski, J.B.; Poterała, M.; Markuszewski, L.; Romaszko-Wojtowicz, A.M.; Jeznach-Steinhagen, A.; et al. Heat and cold stress increases the risk of paroxysmal supraventricular tachycardia. PLoS ONE 2024, 19, e0296412. [Google Scholar] [CrossRef]
  17. Krzyżewska, A.; Wereski, S.; Dobek, M. Summer UTCI variability in Poland in the twenty-first century. Int. J. Biometeorol. 2021, 65, 1497–1513. [Google Scholar] [CrossRef] [PubMed]
  18. Miszczuk, B.; Furdak, A. Changes in biothermal conditions in the Sudetes Mountains and their foreland in relation to the circulation conditions. Misc. Geogr. Reg. Stud. Dev. 2024, 28, 29–38. [Google Scholar] [CrossRef]
  19. Tomczyk, A.M.; Matzarakis, A. Characteristic of bioclimatic conditions in Poland based on Physiologically Equivalent Temperature. Int. J. Biometeorol. 2023, 67, 1991–2009. [Google Scholar] [CrossRef]
  20. Tomczyk, A.M.; Bednorz, E. Regional and seasonal variability in human thermal stress in Poland. Theor. Appl. Climatol. 2023, 152, 787–800. [Google Scholar] [CrossRef]
  21. Rozbicka, K.; Rozbicki, T. Long-term variability of bioclimatic conditions and tourism potential for Warsaw agglomeration (Poland). Int. J. Biometeorol. 2021, 65, 1485–1495. [Google Scholar] [CrossRef] [PubMed]
  22. Rozbicka, K.; Rozbicki, T. Summer weather perception and preferences in Powsin Culture Park (Warsaw, Poland). Int. J. Biometeorol. 2023, 67, 793–805. [Google Scholar] [CrossRef]
  23. Głogowski, A.; Perona, P.; Bryś, T.; Bryś, K. Changes of Bioclimatic Conditions in the Kłodzko Region (SW Poland). Sustainability 2022, 14, 6770. [Google Scholar] [CrossRef]
  24. Oudin, Å.D.; Schifano, P.; Asta, F.; Lallo, A.; Michelozzi, P.; Rocklöv, J.; Forsberg, B. The Effect of Heat Waves on Mortality in Susceptible Groups: A Cohort Study of a Mediterranean and a Northern European City. Environ. Health 2015, 14, 30. [Google Scholar] [CrossRef]
  25. Pogačar, T.; Žnidaršič, Z.; Kajfež Bogataj, L.; Flouris, A.D.; Poulianiti, K.; Črepinšek, Z. Heat Waves Occurrence and Outdoor Workers’ Self-Assessment of Heat Stress in Slovenia and Greece. Int. J. Environ. Res. Public Health 2019, 16, 597. [Google Scholar] [CrossRef]
  26. Crepinšek, Z.; Žnidaršic, Z.; Pogacar, T. Spatio-Temporal Analysis of the Universal Thermal Climate Index (UTCI) for the Summertime in the Period 2000–2021 in Slovenia: The Implication of Heat Stress for Agricultural Workers. Agronomy 2023, 13, 331. [Google Scholar] [CrossRef]
  27. Szer, I.; Szer, J. The influence of external environment on workers on scaffolding illustrated by UTCI. Open Eng. 2021, 11, 929–936. [Google Scholar] [CrossRef]
  28. Chodor, W.; Chmura, P.; Chmura, J.; Andrzejewski, M.; Jówko, E.; Buraczewski, T.; Drozdwowski, A.; Rokita, A.; Konefał, M. Impact of climatic conditions projected at the World Cup in Qatar 2022 on repeated maximal efforts in soccer players. Peer J. 2021, 9, e12658. [Google Scholar] [CrossRef]
  29. Matzarakis, A.; Graw, K. Human Bioclimate Analysis for the Paris Olympic Games. Atmosphere 2022, 13, 269. [Google Scholar] [CrossRef]
  30. Kozłowska-Szczęsna, T.; Błażejczyk, K.; Krawczyk, B.; Limanówka, D. Bioklimat Uzdrowisk Polskich i Możliwości Jego Wykorzystania w Lecznictwie; PANL IgiPZ: Warszawa, Poland, 2002. [Google Scholar]
  31. Kozłowska-Szczęsna, T.; Krawczyk, K.; Błażejczyk, B. Human Bioclimatology. Methods and Applications Monographies; Polish Academy of Sciences, Institute of Geaography and Spatial Organization: Warsaw, Poland, 1997; Volume 1, p. 200. (In Polish) [Google Scholar]
  32. Arnfield, A.J. Köppen Climate Classification|Definition, System, Map. Encyclopaedia Britannica. 2020. Available online: https://www.britannica.com/science/Koppen-climate-classification (accessed on 1 June 2025).
  33. Institute of Meteorology and Water Management—National Research Institute. Available online: https://klimat.imgw.pl/pl/biuletyn-monitoring/ (accessed on 25 April 2025).
  34. World Meteorological Organization (WMO). Guide to Instruments and Methods of Observation (WMO-No. 8); World Meteorological Organization: Geneva, Switzerland, 2021–2023. [Google Scholar]
  35. Rozbicki, T.; Kleniewska, M.; Rozbicka, K.; Majewski, G.; Gołaszewski, D. Relating urban development and densification to temporary changes in the air temperature in Warsaw (Poland). Theor. Appl. Climatol. 2020, 142, 513–523. [Google Scholar] [CrossRef]
  36. Institute of Meteorology and Water Management—National Research Institute. Public Data. Available online: https://danepubliczne.imgw.pl (accessed on 10 January 2025).
  37. Błażejczyk, K.; Epstein, Y.; Jendritzky, G.; Staiger, H.; Tinz, B. Comparison of UTCI to selected thermal indices. Int. J. Biometeorol. 2012, 56, 515–535. [Google Scholar] [CrossRef]
  38. Bröde, P.; Fiala, D.; Błazejczyk, K.; Holmér, I.; Jendritzki, G.; Kampmann, B.; Tinz, B.; Havenith, G. Deriving the operational procedure for the Universal Thermal Climate Index (UTCI). Int. J. Biometeorol. 2012, 56, 481–494. [Google Scholar] [CrossRef] [PubMed]
  39. Fiala, D.; Lomas, K.J.; Stohrer, M. A computer model of human thermoregulation for a wide range of environmental conditions: The passive system. J. Appl. Physiol. 1999, 87, 1957–1972. [Google Scholar] [CrossRef]
  40. Fiala, D.; Lomas, K.J.; Stohrer, M. Computer prediction of human thermoregulatory and temperature responses to a wide range of environmental conditions. Int. J. Biometeorol. 2001, 45, 143–159. [Google Scholar] [CrossRef]
  41. Polish Academy of Sciences, Department of Geoecology and Climatology. BioKlima (n.d.) ver.2.6. Available online: https://www.igipz.pan.pl/climate-research-department.html (accessed on 15 January 2025).
  42. Błażejczyk, K.; Jendritzky, G.; Brode, P.; Fiala, D.; Havenith, G.; Epstein, Y.; Psikuta, A.; Kampmann, B. An Introduction to the Universal Thermal Climate Indeks (UTCI). Geogr. Pol. 2013, 86, 5–10. [Google Scholar] [CrossRef]
  43. Błażejczyk, K.; Idzikowska, D.; Błażejczyk, A. Forecast changes for heat and cold stress in Warsaw in the 21st century, and their possible influence on mortality risk. Pap. Glob. Chang. 2013, 20, 47–62. [Google Scholar] [CrossRef]
  44. Lindner, K. Ocena klimatu odczuwalnego w Warszawie na podstawie wskaźnika UTCI. (Assessment of sensible climate in Warsaw using UTCI). Pr. Stud. Geogr. 2011, 47, 285–291. [Google Scholar]
  45. Kuchcik, M. Thermal conditions in Poland at the turn of the 20th and 21st centuries, and their impact on mortality. Geogr. Stud. 2017, 263, 1–10. (In Polish) [Google Scholar]
  46. Mąkosza, A. Bioclimatic conditions of the Lubuskie Voivodeship. Geogr. Pol. 2013, 86, 37–46. [Google Scholar] [CrossRef]
  47. Mąkosza, A. Bioclimatic conditions and thermal seasons of the year in Szczecin. Geogr. Pol. 2021, 94, 283–299. [Google Scholar] [CrossRef]
  48. Błażejczyk, K. UTCI—10 years of applications. Int. J. Biometeorol. 2021, 65, 1461–1462. [Google Scholar] [CrossRef]
  49. Rozbicka, K.; Rozbicki, T. Variability of UTCI index in South Warsaw depending on atmospheric circulation. Theor. Appl. Climatol. 2018, 133, 511–520. [Google Scholar] [CrossRef]
  50. Okoniewska, M. Specificity of Meteorological and Biometeorological Conditions in Central Europe in Centre of Urban Areas in June 2019 (Bydgoszcz, Poland). Atmosphere 2021, 12, 1002. [Google Scholar] [CrossRef]
  51. Tomczyk, A.M. Bioclimatic Conditions of June 2019 in Poland on a Multi-Year Background (1966–2019). Atmosphere 2021, 12, 1117. [Google Scholar] [CrossRef]
  52. Półrolniczak, M.; Szyga-Pluta, K.; Kolendowicz, L. Bioklimat wybranych miast pasa Pobrzeży Południowobałtyckich na podstawie uniwersalnego wskaźnika obciążenia cieplnego. Acta Geogr. Lodz. 2016, 104, 147–161. [Google Scholar]
  53. Koźmiński, C.Z.; Michalska, B. Ocena bioklimatycznych warunków rekreacji i turystyki w strefie polskiego Wybrzeża Bałtyku na podstawie wskaźnika UTCI (Assessment of bioclimatic conditions for recreation and tourism in the Polish Baltic coastal zone using the UTCI index). Pol. Geogr. Rev. 2019, 91, 113–126. [Google Scholar]
  54. Nowosad, M.; Rodzik, B.; Wereski, S.; Dobek, M. The UTCI index in Lesko and Lublin and its circulation determinants. Geogr. Pol. 2013, 86, 29–36. [Google Scholar] [CrossRef]
  55. Dobek, M.; Demczuk, P.; Nowosad, M. Spatial variation of the Universal Thermal Climate Index in Lublin in specified weather scenarios. Ann. UMCS Sec. B. 2013, 68, 21–38. [Google Scholar]
  56. Kozłowska-Szczęsna, T. Anthropoclimate of Poland: An Attempt of a Synthesis; Zeszyty Instytutu Geografii i Przestrzennego Zagospodarowania PAN: Warsaw, Poland, 1991. [Google Scholar]
  57. Błażejczyk, K. Biotermiczne cechy klimatu Polski. Przegląd Geogr. 2003, 75, 525–543. [Google Scholar]
  58. Kozłowska-Szczęsna, T.; Krawczyk, B.; Błażejczyk, K. The main features of bioclimatic conditions at Polish health resorts. Geogr. Pol. 2004, 77, 45–61. [Google Scholar]
Figure 1. Locations of the stations in the Central (IV) bioclimatic region in Poland.
Atmosphere 16 00774 g001
Figure 2. Annual course, average, maximum, and minimum of UTCI values in bioclimatic Central Region (IV) of Poland, 2001−2024.
Atmosphere 16 00774 g002
Figure 3. Variability of average (a,b), maximum (c,d), and minimum (e,f) values of UTCI index with trends (dotted line) in analyzed stations in 2001–2024.
Atmosphere 16 00774 g003
Figure 4. Annual number of days with thermal stress categories according to UTCI in the succeeding years of 2001–2024 in analyzed stations with trend lines.
Atmosphere 16 00774 g004
Figure 5. Relative frequency (%) of thermal stress categories according to UTCI index at 12 UTC in analyzed stations, 2001–2024.
Atmosphere 16 00774 g005
Figure 6. Relative frequency (%) of thermal categories according to UTCI values at 12 UTC in 2001–2024.
Atmosphere 16 00774 g006
Figure 7. Relative frequency (%) of thermal stress categories by UTCI index at 12 UTC in particular months in analyzed stations, 22001–2024.
Atmosphere 16 00774 g007
Figure 8. Relative frequency (%) of thermal stress categories according to UTCI index at 12 UTC in particular years in analyzed stations, 2001–2024.
Atmosphere 16 00774 g008
Table 1. UTCI assessment scale of human heat stress [42].
UTCI (°C) RangeNumber CategoryStress Category
above 46.04extreme heat stress
38.1–46.03very strong heat stress
32.1–38.02strong heat stress
26.1–32.01moderate heat stress
9.1–26.00no thermal stress
0.1–9.0−1slight cold stress
−12.9–0.0−2moderate cold stress
−26.9–13.0−3strong cold stress
−39.9–27.0−4very strong cold stress
below −40.0−5extreme cold stress
Table 2. Annual average values of UTCI [°C] in stations, 2001−2024.
StationsAnnual Average Values of UTCI [°C]
Zielona Góra8.4
Poznań6.7
Wrocław8.4
Toruń9.0
Łódź6.5
Warsaw7.2
2001–20247.7
Table 3. Trend equations and determination coefficients (R2) for the analyzed stations in the period of 2001–2024.
StationsTrend equationsR2
AveragePoznańy = 0.0554x + 8.14020.11
Zielona Góray = 0.1133x + 7.06030.33
Wrocławy = 0.1433x + 6.67270.47
Toruńy = 0.067x + 8.04450.17
Warsawy = 0.1772x + 5.07340.64
Łódźy = 0.1264x + 5.1170.28
MaximumPoznańy = 0.0658x + 35.4170.05
Zielona Góray = 0.0748x + 35.3410.06
Wrocławy = 0.0796x + 36.0380.08
Toruńy = 0.1099x + 35.0570.14
Warsawy = 0.0515x + 35.5150.03
Łódźy = 0.1028x + 34.6270.13
MinimumPoznańy = 0.0551x − 25.9090.01
Zielona Góray = 0.2788x − 26.3180.27
Wrocławy = 0.1749x − 28.2610.08
Toruńy = 0.0381x − 25.770.00
Warsawy = 0.4659x − 37.430.32
Łódźy = 0.284x − 34.0210.14
Bold font shows average and minimum values significant at 99% confidence level.
Disclaimer/Publisher’s Note: The statements, opinions and data contained in all publications are solely those of the individual author(s) and contributor(s) and not of MDPI and/or the editor(s). MDPI and/or the editor(s) disclaim responsibility for any injury to people or property resulting from any ideas, methods, instructions or products referred to in the content.

