1. Introduction
Rainfall is an important factor in the water and energy cycles, with significant implications for hydrometeorology, agriculture, and water supply [
1,
2,
3,
4]. However, it is difficult to get dependable and enduring global rainfall data that have both high spatial and temporal resolutions [
5,
6,
7,
8]. Although ground rain gauges are capable of providing high temporal frequency rainfall data, their accuracy is limited by their uneven distribution and the limited number of rain gauge networks [
9,
10,
11,
12]. Consequently, satellites have become an acceptable option for monitoring precipitation on a regional or global scale, providing a high degree of precision in both temporal and spatial aspects [
13,
14,
15].
Several studies have compared ground gauges and satellite products, and many correction approaches have been proposed [
16,
17]. Satellite products have become famous since they give more spatial coverage and temporal resolution than ground rain gauges [
18,
19]. Several satellite rainfall products have been created internationally. There are five commonly utilized open-sourced satellite products: GPCP (Global Precipitation Climatology Project), PERSIANN-CDR (Precipitation Estimation from Remotely Sensed Information using Artificial Neural Networks-Climate Data Record), GPM (Global Precipitation Measurement), PERSIANN (Precipitation Estimation from Remotely Sensed Information using Artificial Neural Networks) and CHIRPS (Climate Hazards Group InfraRed Precipitation with Station data) [
15,
20,
21,
22,
23]. However, satellite products are prone to systematic mistakes and biases, which may impair their accuracy [
7,
24]. To overcome this, many bias correction methods such as linear and nonlinear regression methods, quantile mapping, and machine learning techniques such as neural networks have been developed [
25,
26,
27,
28,
29,
30,
31,
32,
33,
34].
The basic goal of statistical bias correction techniques is to establish a statistical link between the variables being modeled and the observed data over the same historical time, and then to use that relationship to project the model [
35]. For example, the quantile-based mapping approach aims to project the cumulative distribution function (CDF) of the model outputs into the distribution of the observations. Quantile mapping aligns the quantiles of satellite rainfall with observed rainfall at each station. Very effective for correcting distribution shape, extremes, and totals. This strategy can enhance not only the mean, but the complete distribution of the variables [
36,
37,
38]. The mean bias correction is a simple scaling factor to align the means of satellite and ground data. It is fast but limited in correcting distributional biases. The cumulative distribution function (CDF) matching matches CDFs between products and observations. It is more sophisticated than mean correction. Bayesian or machine learning-based correction is useful when multiple predictors (e.g., elevation, land cover) influence bias patterns. The techniques include Gaussian process regression, XGBoost, or random. Another bias correction technique is the artificial neural networks (ANNs), which is are powerful nonlinear regression algorithms that capable of approximating practically any continuous input and output mapping [
39,
40]. The ANN model is more practical than other standard modeling methods because of its processing speed and capacity to handle complicated nonlinear systems [
35]. The ANN’s robust, fault-tolerant, and parallel structure, which makes ANN models potent and resilient instruments for global climate models and ecological research [
41]. For instance, Maier et al. [
42] reviewed more than 200 journal publications from 1999 to 2007 that used ANN models to predict flow in rivers.
The quality satellite rainfall products have been evaluated in some regions in Saudi Arabia. For example, Almazroui et al. [
43] evaluated rainfall data for Saudi Arabia collected by the Tropical Rainfall Measuring Mission (TRMM) between 1998 and 2009. Although the TRMM product showed varying degrees of accuracy, Almazroui et al. [
43] suggest that TRMM can be used to make up for the absence of rain gauges. Tekeli [
44] had favorable results while using TRMM-3B42RT to identify an extraordinary rainfall occurrence in Jeddah, Saudi Arabia. Tekeli and Fouli [
45] proposed an early flood warning system for Riyadh using the TRMM rainfall product for flash flood forecasting and came to the conclusion that during such a severe occurrence, the TRMM product might give some useful information. The three IMERG products were verified by Mahmoud et al. [
46] over Saudi Arabia using ground rainfall measurements at daily and event time periods. They recommended adopting the IMERG final version as an additional or alternative source of rainfall data for locations that have inadequate or nonexistent readings. AL-Areeq et al. [
47] compared the performance of the three satellite rainfall products, IMERG, TRMM, and PERSIANN-CCS, across a 1725 km
2 arid watershed over the Makkah watershed. The study suggested that IMERG’s early and late products are more reliable for predicting rainfall and its hydrological effects in arid areas.
The motivation of this study was to improve the accuracy of rainfall estimates in the region and to provide more reliable information for various applications, including climate change adaptation, planning and water management. The specific of this study include the following: (a) comparison of the accuracy of multi-satellite-based rainfall estimates with ground-based measurements in the Makkah region; (b) evaluation of the effectiveness of bias correction methods, such as statistical methods, and machine learning methods, in correcting the systematic errors or biases in satellite-based estimates of rainfall in the study area; (c) provide recommendations for the selection of bias correction methods based on the characteristics of the datasets and the specific application in Makkah. The findings of the study can significantly enhance water resource management in Saudi Arabia. Considering the limited number of rainfall monitoring stations available in the study area, satellite data can be a valuable source of information. Once corrected, it can offer a comprehensive view of rainfall patterns across the study area, especially in the sparsely populated eastern part of the Makkah region. By analyzing long-term satellite data records, decision-makers can obtain insights into rainfall trends and climate variability over time. This information can prove to be invaluable in making informed decisions.
The current work is structured as follows:
Section 2 provides an overview of the materials and procedures used in the study. The evaluation outcomes are shown in
Section 3, while the discussion is presented in
Section 4. The conclusions are finally presented in
Section 5.
2. Material and Methods
2.1. Study Area
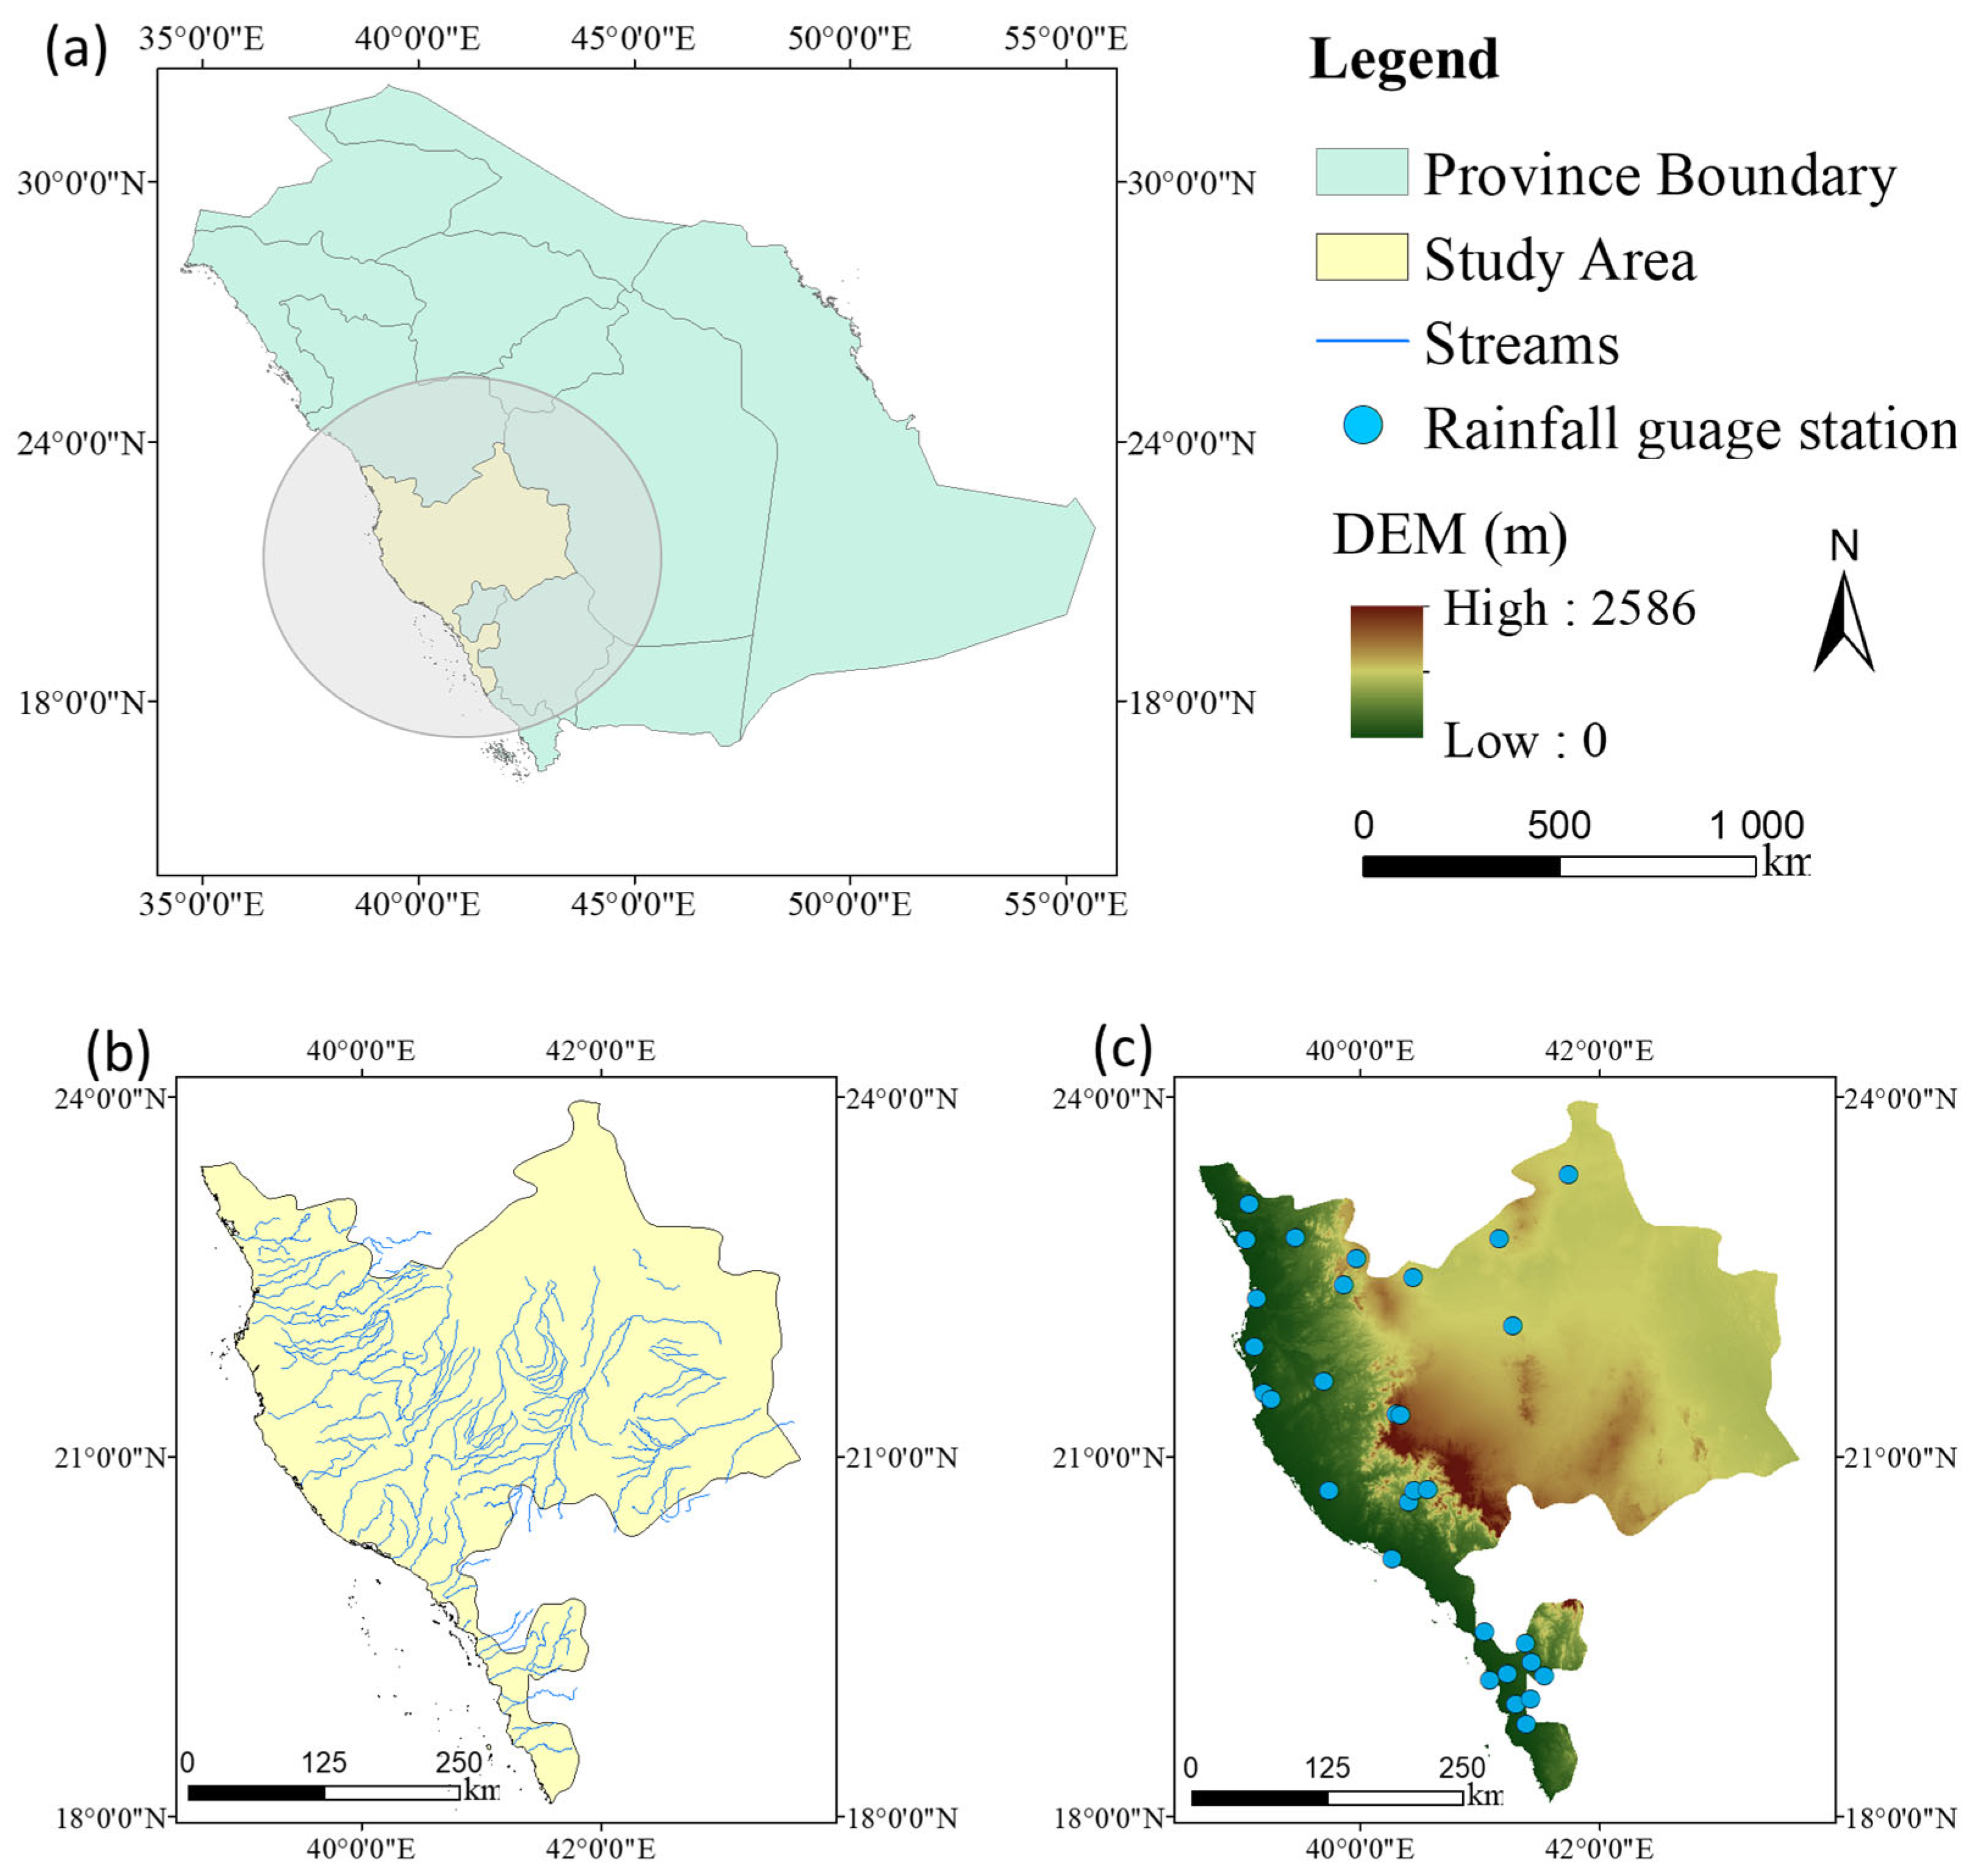
The Makkah region is considered the one of the most important regions in Saudi Arabia because of its historical and religious significance, high population density, economic significance as the commercial hub, and placement at the center of the western region’s middle section. The Red Sea, Riyadh Province, Al-Madinah Al-Munawwarah, and the provinces of Al Baha and Asir form the western, eastern, northern, and southern limits of Makkah’s administrative boundaries (
Figure 1). Makkah’s 141,216 km
2 administrative area is located between 18°15′ to 23°50′ N latitude, and 38°42′ to 43°47′ E longitude. From 1966 to 2010, yearly rainfall over Makkah City ranged from 3.8 to 318.5 mm, with an annual average of 102.6 mm [
48].
There is typically a gap between rainfall events, which is marked by considerable uncertainty in both spatial and temporal aspects. Autumn and winter are the primary rainy seasons, and the steep terrain of the region often leads to a short time of concentration, resulting in the rapid formation of wadis during the rainfall–runoff process. This increases the risk of flash floods. The region’s climate is influenced by a variety of air masses, ranging from Mediterranean (cyclone-type) systems in the winter to monsoon-type conditions in the summer [
49].
The study area, as shown in
Figure 1, includes steep elevation gradients and proximity to the Red Sea, which influence localized convective rainfall through orographic lifting [
50]. These spatial variations in rainfall often reduce the accuracy of satellite-based precipitation (SBP) products like PERSIANN-CDR, particularly in mountainous areas [
21].
2.2. Ground Rain Gauge Data
Surface meteorological stations provide daily observation data, which are acquired from the Ministry of Environment, Water, and Agriculture. This research used daily rainfall data from January 2015 to November 2020 collected from 28 stations to verify the accuracy of the Satellite rainfall product. The quality of rainfall data was assessed for outliers, normality, homogeneity, and bias using four statistical tests: Kolmogorov–Smirnov, Shapiro–Wilk, Lilliefors, and Breusch–Pagan.
2.3. Satellite Products
Satellite products can monitor remote or inaccessible areas that are difficult to observe using ground-based instruments. Many satellite sensors (especially from geostationary satellites) provide continuous or near-continuous data, ideal for real-time monitoring. Satellites capture data across various wavelengths (visible, infrared, microwave), enabling different types of analyses such as vegetation health, water content, and thermal anomalies. Satellite products provide several years or decades, allowing for climate monitoring and trend analysis [
51].
The limitations of satellite products can be summarized as follows: specific sensors rely on sunlight, where they cannot collect visible imagery at night but thermal infrared and active sensors can provide data at night. Optical and infrared sensors often cannot penetrate clouds, leading to data gaps in cloudy regions. Some satellite instruments have a coarse spatial resolution, which is insufficient for detailed local analysis. It may have some problem with temporal coverage, water vapour and gases. Raw satellite data often require complex pre-processing (e.g., atmospheric correction, geo-referencing), and errors in calibration can affect data reliability. Finally, the Cost and Access Restrictions, while many datasets are open-access, high-resolution commercial data can be expensive and come with usage restrictions [
52].
The key features of the five satellite-based precipitation products (SBPs) employed in this study are shown in
Table 1. The SBPs were obtained from their respective host websites, which are both free and open source. CHIRPS, PERSIANN, CDR, GPCP, and GPM are the five SBPs under consideration. CHIRPS was created principally by the USGS Famine Early Warning Systems Network and the University of California’s Climate Hazards Group [
23]. With a high spatial resolution of 0.05 degree from 50° S to 50° N, it has supplied rainfall products worldwide since 1981. The CHIRPS has attracted a lot of attention and found a lot of uses recently because of its long recording periods and excellent spatial resolution [
53,
54].
The University of California, Irvine’s Center for Hydrometeorology and Remote Sensing developed PERSIANN [
21]. PERSIANN calculates the rainfall rate using cloud-top temperature inferred from IR pictures [
55]. PERSIANN CDR, with a three-month time lag, is a long-term (from 1983 to the present) daily-calibrated product with a reasonably high spatial resolution (0.25) that is commonly used for the trend analyses of hydrometeorological events. In this work, PERSIANN CDR (hereinafter referred to as PERSIANN) was used for comparison analysis.
The GPCP monthly rainfall dataset is a collaborative analysis of global rainfall patterns spanning from 1979 to the present. Data from multiple sources are merged on a worldwide 2.5° × 2.5° grid, including microwave-based estimates from the Special Sensor Microwave Imager (SSM/I), rainfall estimations derived from surface rain gauges, infrared (IR) observations made by geostationary and polar-orbiting satellites. The analytic approach is intended to capitalize on the unique capabilities of the distinct input datasets, particularly in terms of bias reduction [
56].
GPM was created by NASA in partnership with JAXA as the successor to NASA’s TMPA and is another extensively used rainfall product of the GPM mission generated with the IMERG algorithm [
57]. The extensive and uninterrupted historical data of the retroactive IMERG rainfall product enhance its usefulness in the field of hydrometeorology research and practical applications. The IMERG final run, which has been calibrated using data from the Global Rainfall Climatology Centre (GPCC) rain gauges, provides more accurate estimates and has been used for comparison in this study.
2.4. Rainfall Correction Methods
2.4.1. Linear Correction Method
In the linear correction approach, the daily rainfall quantities (
P) obtained from the satellite are adjusted using a transformation equation, resulting in a transformed variable (
P*). This transformation Equation is given by
where (
a) represents the scaling factor and (
b) is the offset. The scaling factor (
a) is determined by the ratio of the monthly mean observed rainfall (Ō) to the monthly mean rainfall from the satellite (
).
The linear correction approach is classified within the same category as the ‘factor of change’ or ‘delta change’ method, as discussed by Hay et al. [
58]. The present approach possesses the benefit of being straightforward and requiring a little amount of data. Specifically, it needs just monthly climatological data in order to compute monthly correction factors. Nevertheless, focusing solely on adjusting the average monthly rainfall might potentially skew the comparative fluctuation of the distribution of rainfall across months and may have negative consequences on other statistical measures of daily rainfall probability distribution [
59].
2.4.2. Nonlinear Correction Method
The authors of [
60,
61] advocate using power law adjustments since a linear scaling factor will change the mean of the monthly rainfall but will not change the standard deviation of the rainfall.
where
b is a scaling exponent.
It has an advantage with the linear technique in that it calls for monthly observed data, but it also requires knowledge of the coefficient of variation of rainfall (CV) in addition to the mean. While the nonlinear approach does not directly address biases in higher-order moments, it does mitigate them to some extent
2.4.3. Quantile Mapping
Additional bias correction strategies that are more flexible also aim to modify the variance of the model distribution in order to align it more accurately with the observed variance [
62]. Quantile mapping is a generalized technique that encompasses all of these techniques. It involves the use of a quantile-based modification of distributions [
63].
The widely used nonparametric quantile mapping technique involves aligning the empirical cumulative distribution function (CDF) of satellite-derived rainfall estimates with those of gauge measurements by the use of a transfer function. The procedure for computing the empirical cumulative distribution functions (CDFs) is described by Wilks [
64] and used for the quantile mapping (QM) of daily rainfall data from climate models by Themeßl et al. [
65].
2.4.4. Artificial Neural Network (ANN)
The ANN methodology is used to acquire knowledge of the bias structure by analyzing historical model outputs and their related observations [
35]. The capacity of artificial neural networks (ANNs) to generalize is enhanced by including diverse forms of information and using a sufficiently big network to prevent overfitting to the specific stored knowledge and experiences. The architecture of the ANN is derived on the organization of biological brain systems, with numerous layers of artificial neurons (also known as nodes). The input layer is composed of input nodes that are linked to the input variables. The hidden layers, which may be one or more, are also connected to the input nodes. The output layer consists of output nodes that provide the output variables.
To determine the bias-corrected rainfall from the satellite rainfall using ANN, direct mapping was performed using the satellite rainfall as the input and the observed rainfall as the output.
ANN performed better than traditional methods because it can capture complex, nonlinear patterns between satellite and ground rainfall data, which are common in arid regions like Makkah [
66]. It also handles sparse and noisy data more effectively, which is important in areas with limited ground stations [
67]. Similar results have been reported in studies from Iran and North Africa, where ANN models showed better accuracy than conventional correction techniques [
68,
69].
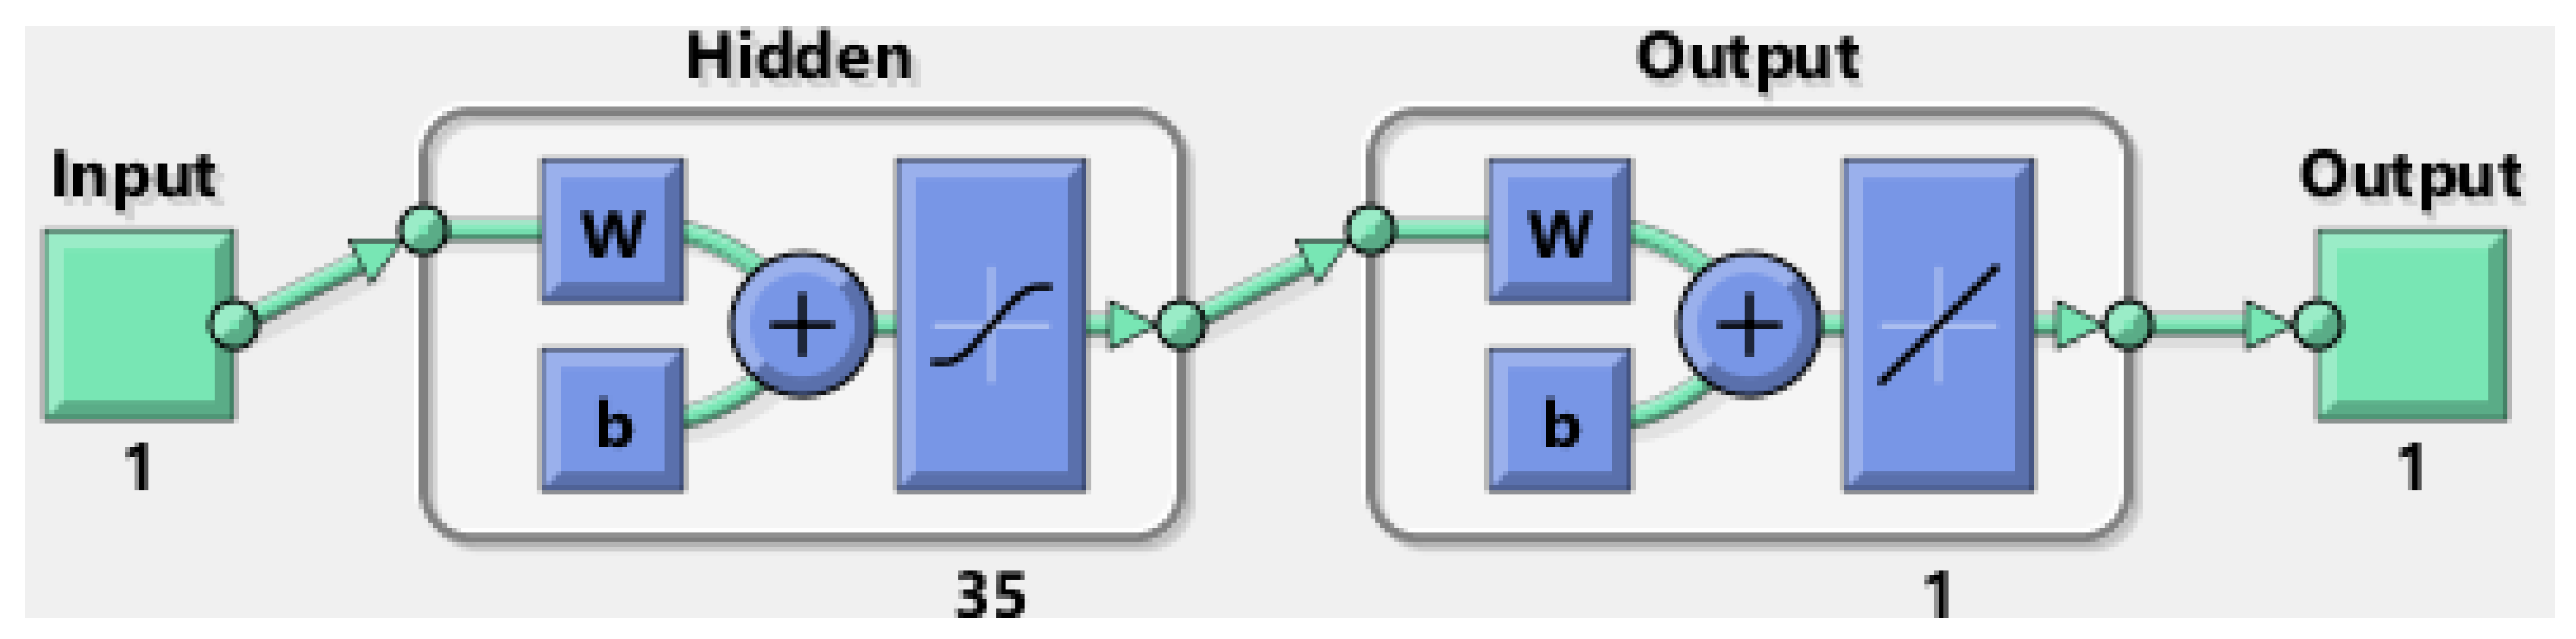
The objective is to optimize the performance and decrease the root mean square error (RMSE) of the corrected rainfall, while also assuring a tighter alignment with the standard deviation and mean of the measured rainfall. The optimal output was obtained using a three-layer feed-forward network with 35 hidden nodes.
The bias correction in this study was applied at the regional level, rather than individually at each station. This approach was chosen to account for spatial coherence in rainfall patterns and avoid overfitting the model to local noise or anomalies [
63,
70]. By training the ANN on aggregated regional data—i.e., merging monthly rainfall records from all 28 stations into a single dataset—the model was able to learn broader bias structures and shared climate signals, which can improve the robustness and generalization of the results across the study area [
66,
71].
The determination of the number of hidden layers often involves a trial-and-error approach [
72]. The best number of hidden layers in this research was 35 as a result of trial and error. Out of a total of 214 data points for monthly rainfall, 150 (70%) were allocated for training, 32 (15%) for testing, and the remaining 32 (15%) for verification. This split was chosen to ensure a balanced evaluation of model performance at different stages [
73]. The testing dataset was used to monitor the model’s learning behavior during training, while the verification dataset served to assess its generalization capability on completely unseen data [
74]. Although cross-validation was not applied in this study, the consistency between testing and verification performance was used to indicate model robustness [
75].
Figure 2 depicts the arrangement of a feedforward three-layer ANN. These types of ANNs have a broad range of applications, including data storage and retrieval, pattern classification, input–output mapping, pattern grouping, and solving limited optimization problems. The green arrows illustrate the flow of data through the network, beginning with the input and progressing through weight (w) and bias (b) computations, followed by a nonlinear function in the hidden layer.
2.5. Statistical Evaluation
The performance of the satellite products was evaluated by comparing it with the monthly rainfall data obtained from each rain gauge. The rainfall data for the same latitude and longitude were collected from both the satellite and the rain gauge and then integrated into a monthly scale. After that, a comparison was made using four statistical metrics: correlation coefficient (CC), relative bias (RB), mean absolute error (MAE), and root mean square error (RMSE). The CC indicates the level of agreement between the satellite estimation and the rain gauge observation regarding dynamics. The RB measures the systematic bias of satellite rainfall from rain gauge observations. The MAE provides the magnitude of uncertainty, while the RMSE calculates the average absolute error of satellite rainfall. Smaller values of RMSE suggest more agreement between the two datasets.
Table 2 presents statistical metrics for evaluating SBP, which were used in this research.
3. Results
3.1. Evaluation of Rainfall Products at the Monthly Scale
The geographical distribution of the annual average rainfall, as determined using observed data and SBPs, is shown in
Figure 3. The inverse distance weighted (IDW) approach was employed to interpolate all the SBPs to assess their effectiveness in reproducing the geographical distribution of rainfall.
For IDW interpolation, a pairwise comparison was performed with the rain gauge locations as the reference. The rainfall from each satellite product was obtained at the 28 locations, and then IDW interpolation was performed.
Figure 3 shows the actual and predicted rainfall distribution for the Makkah region. The research area included both low-rainfall regions in the northeast coastal region and high-rainfall zones in the middle part of Makkah. The PERSIANN dataset tends to overestimate rainfall levels over the whole study area, with particularly pronounced overestimation in the western region. Conversely, the GPM dataset indicated considerably greater rainfall in the northern portion of the Makkah region.
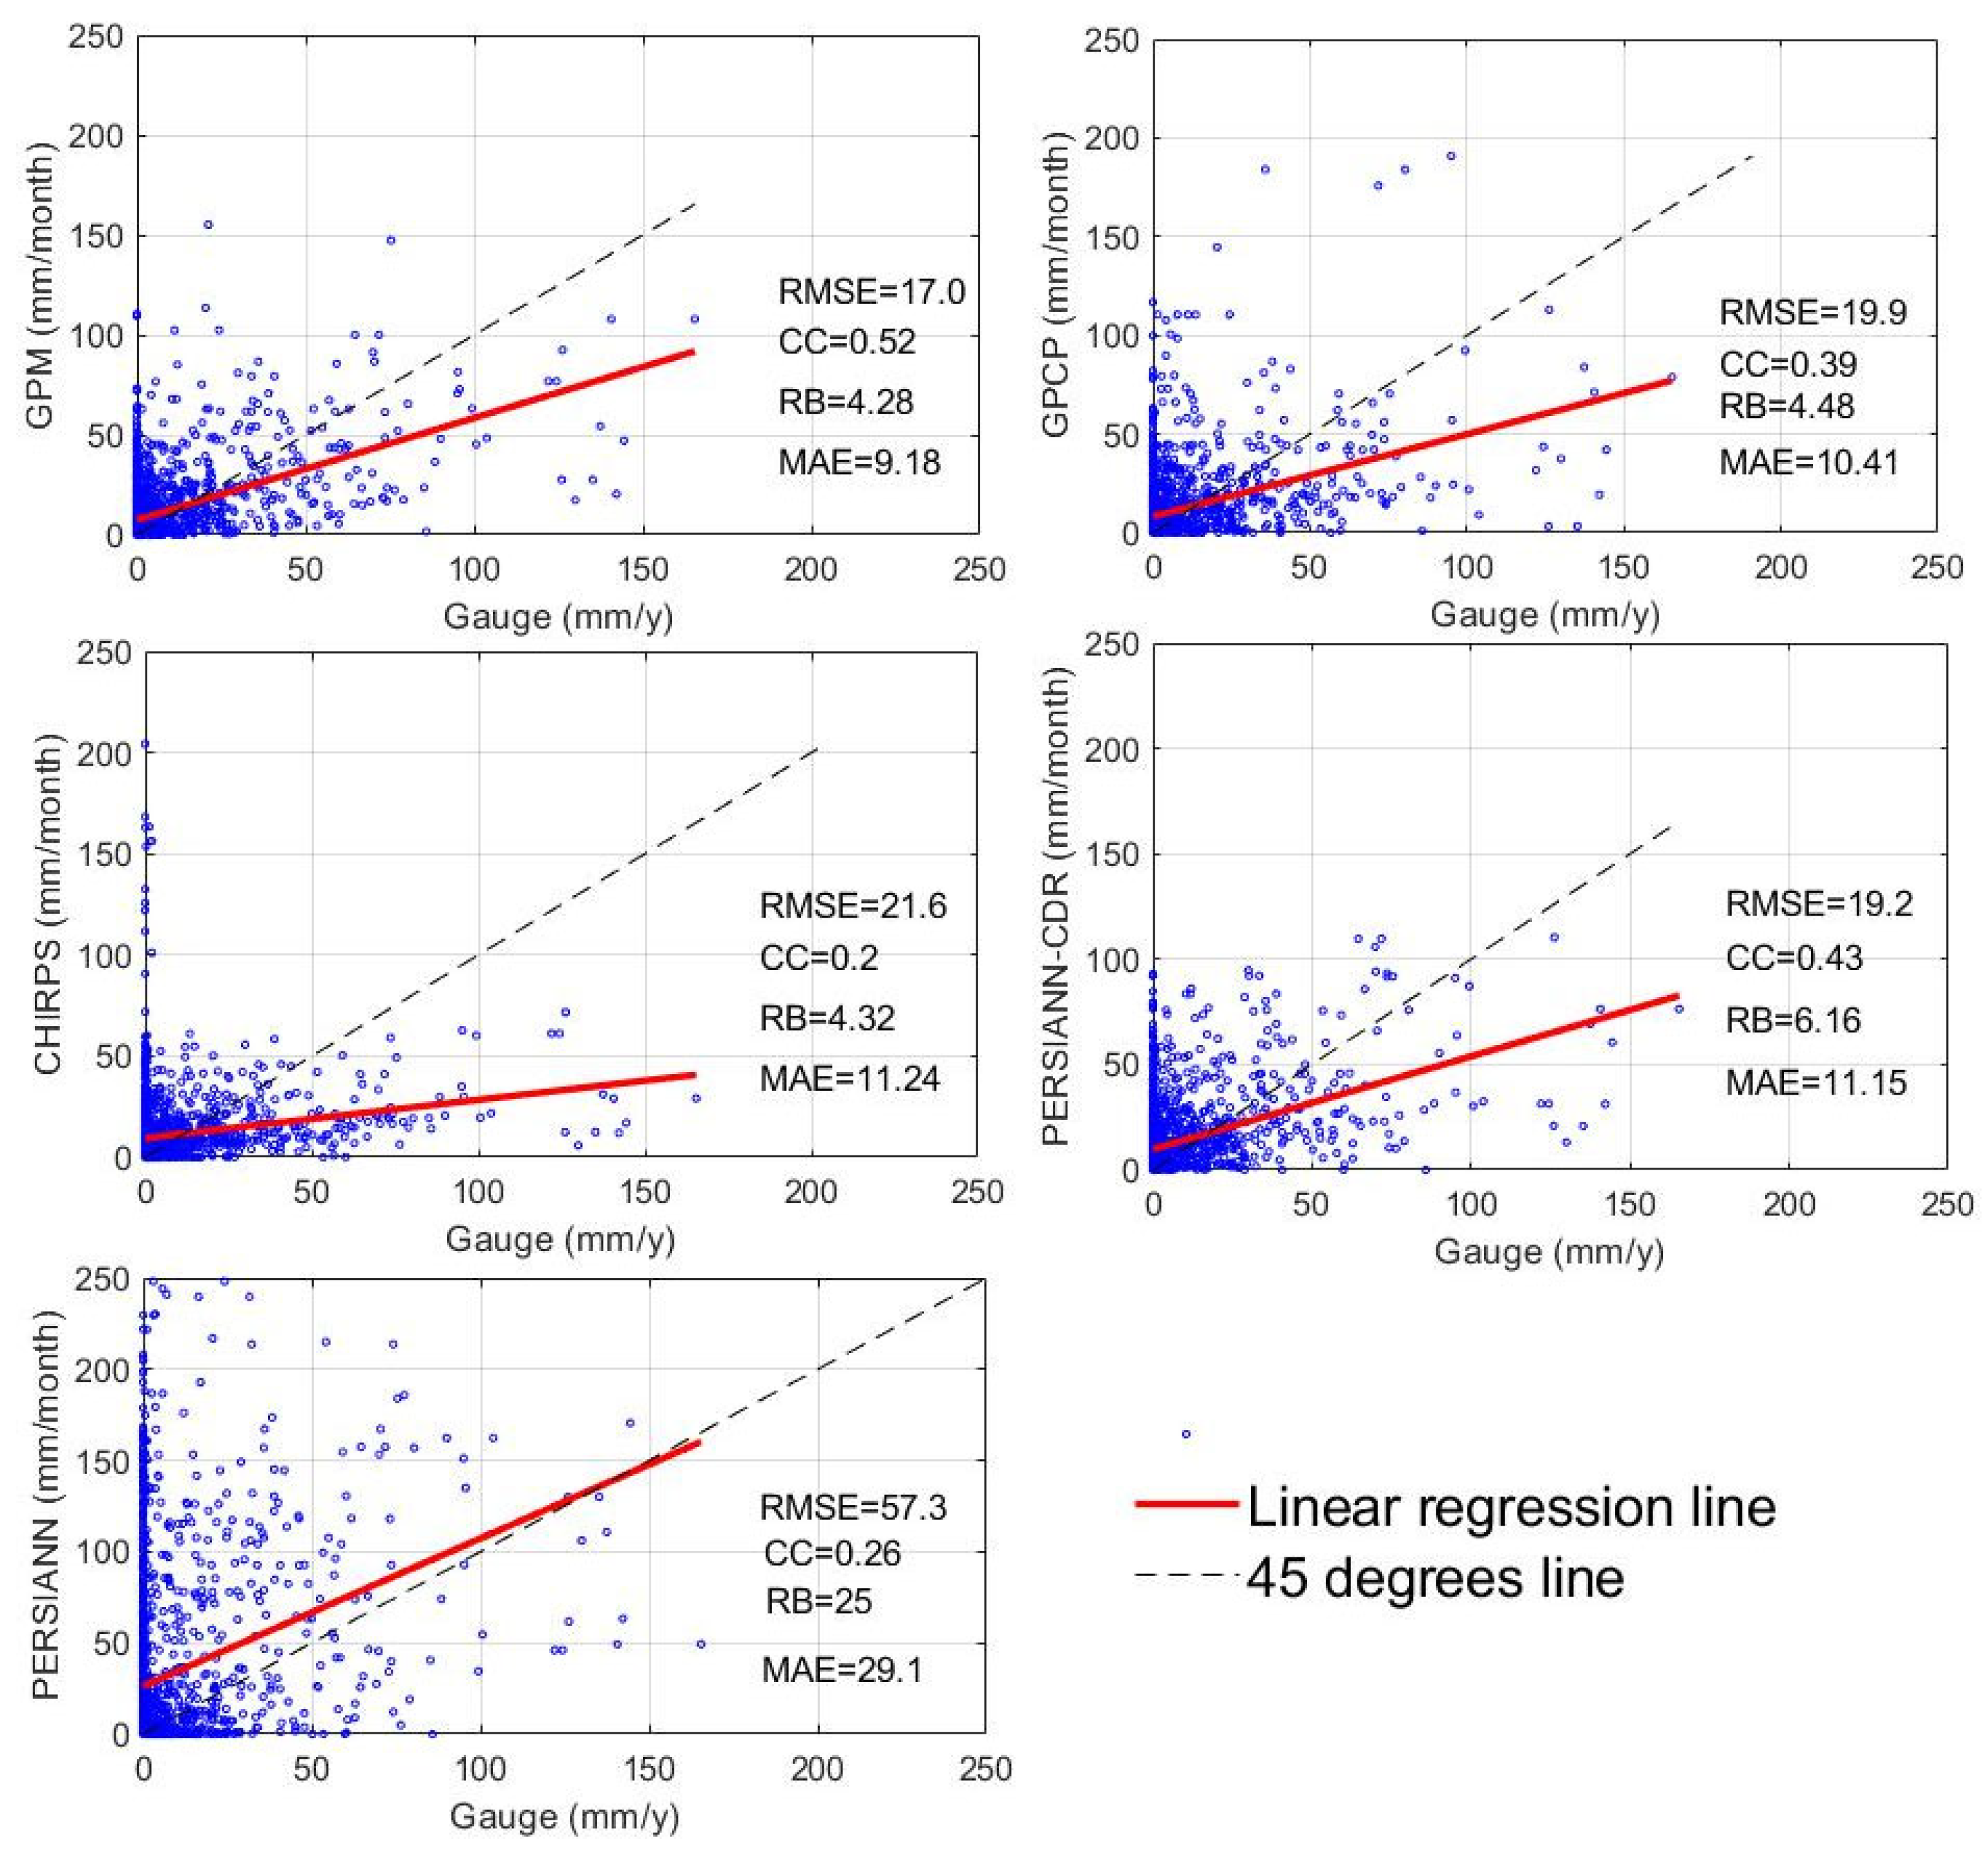
All statistical comparisons between observed and satellite-derived rainfall are performed at the individual gauge level, rather than on spatially pooled data. For each of the 28-gauge stations, we extracted the complete monthly rainfall series (2015–2020) from both the ground observations and each SBP product at the station’s coordinates. After removing months with missing gauge data, a correlation coefficient (CC) was calculated for each station. The mean correlation coefficient reported in the text is the arithmetic average of these 28 station-level CC values.
Similarly, station-level RMSE, RB and MAE were computed and then averaged across all gauges to produce the summary performance metrics. Although
Figure 4 displays pooled scatterplots of all station–month pairs for visual reference, its inset values of RMSE, CC, RB and MAE are based on the station-wise analyses described above. This procedure preserves local performance variability and avoids the interpretational pitfalls of correlating spatial averages.
Comparisons were performed using scatterplots of monthly rainfall from all rainfall products and the rain gauge data over the study area.
Figure 4 shows the best and worst performers among the rainfall products. Overall, the GPM product showed the highest level of accuracy, while the PERSIANN product showed the weakest performance in terms of RMSE, CC, RB, and MAE values. To enhance the overall performance of IR-based algorithms, it is recommended that rainfall estimates be corrected with data from rain gauges at different elevations [
76]. Given that the GPM product was the only one to be better in all statistical criteria, bias correction methods will only be applied to GPM, as will be discussed in the following section.
3.2. Evaluation of Bias Correction Methods
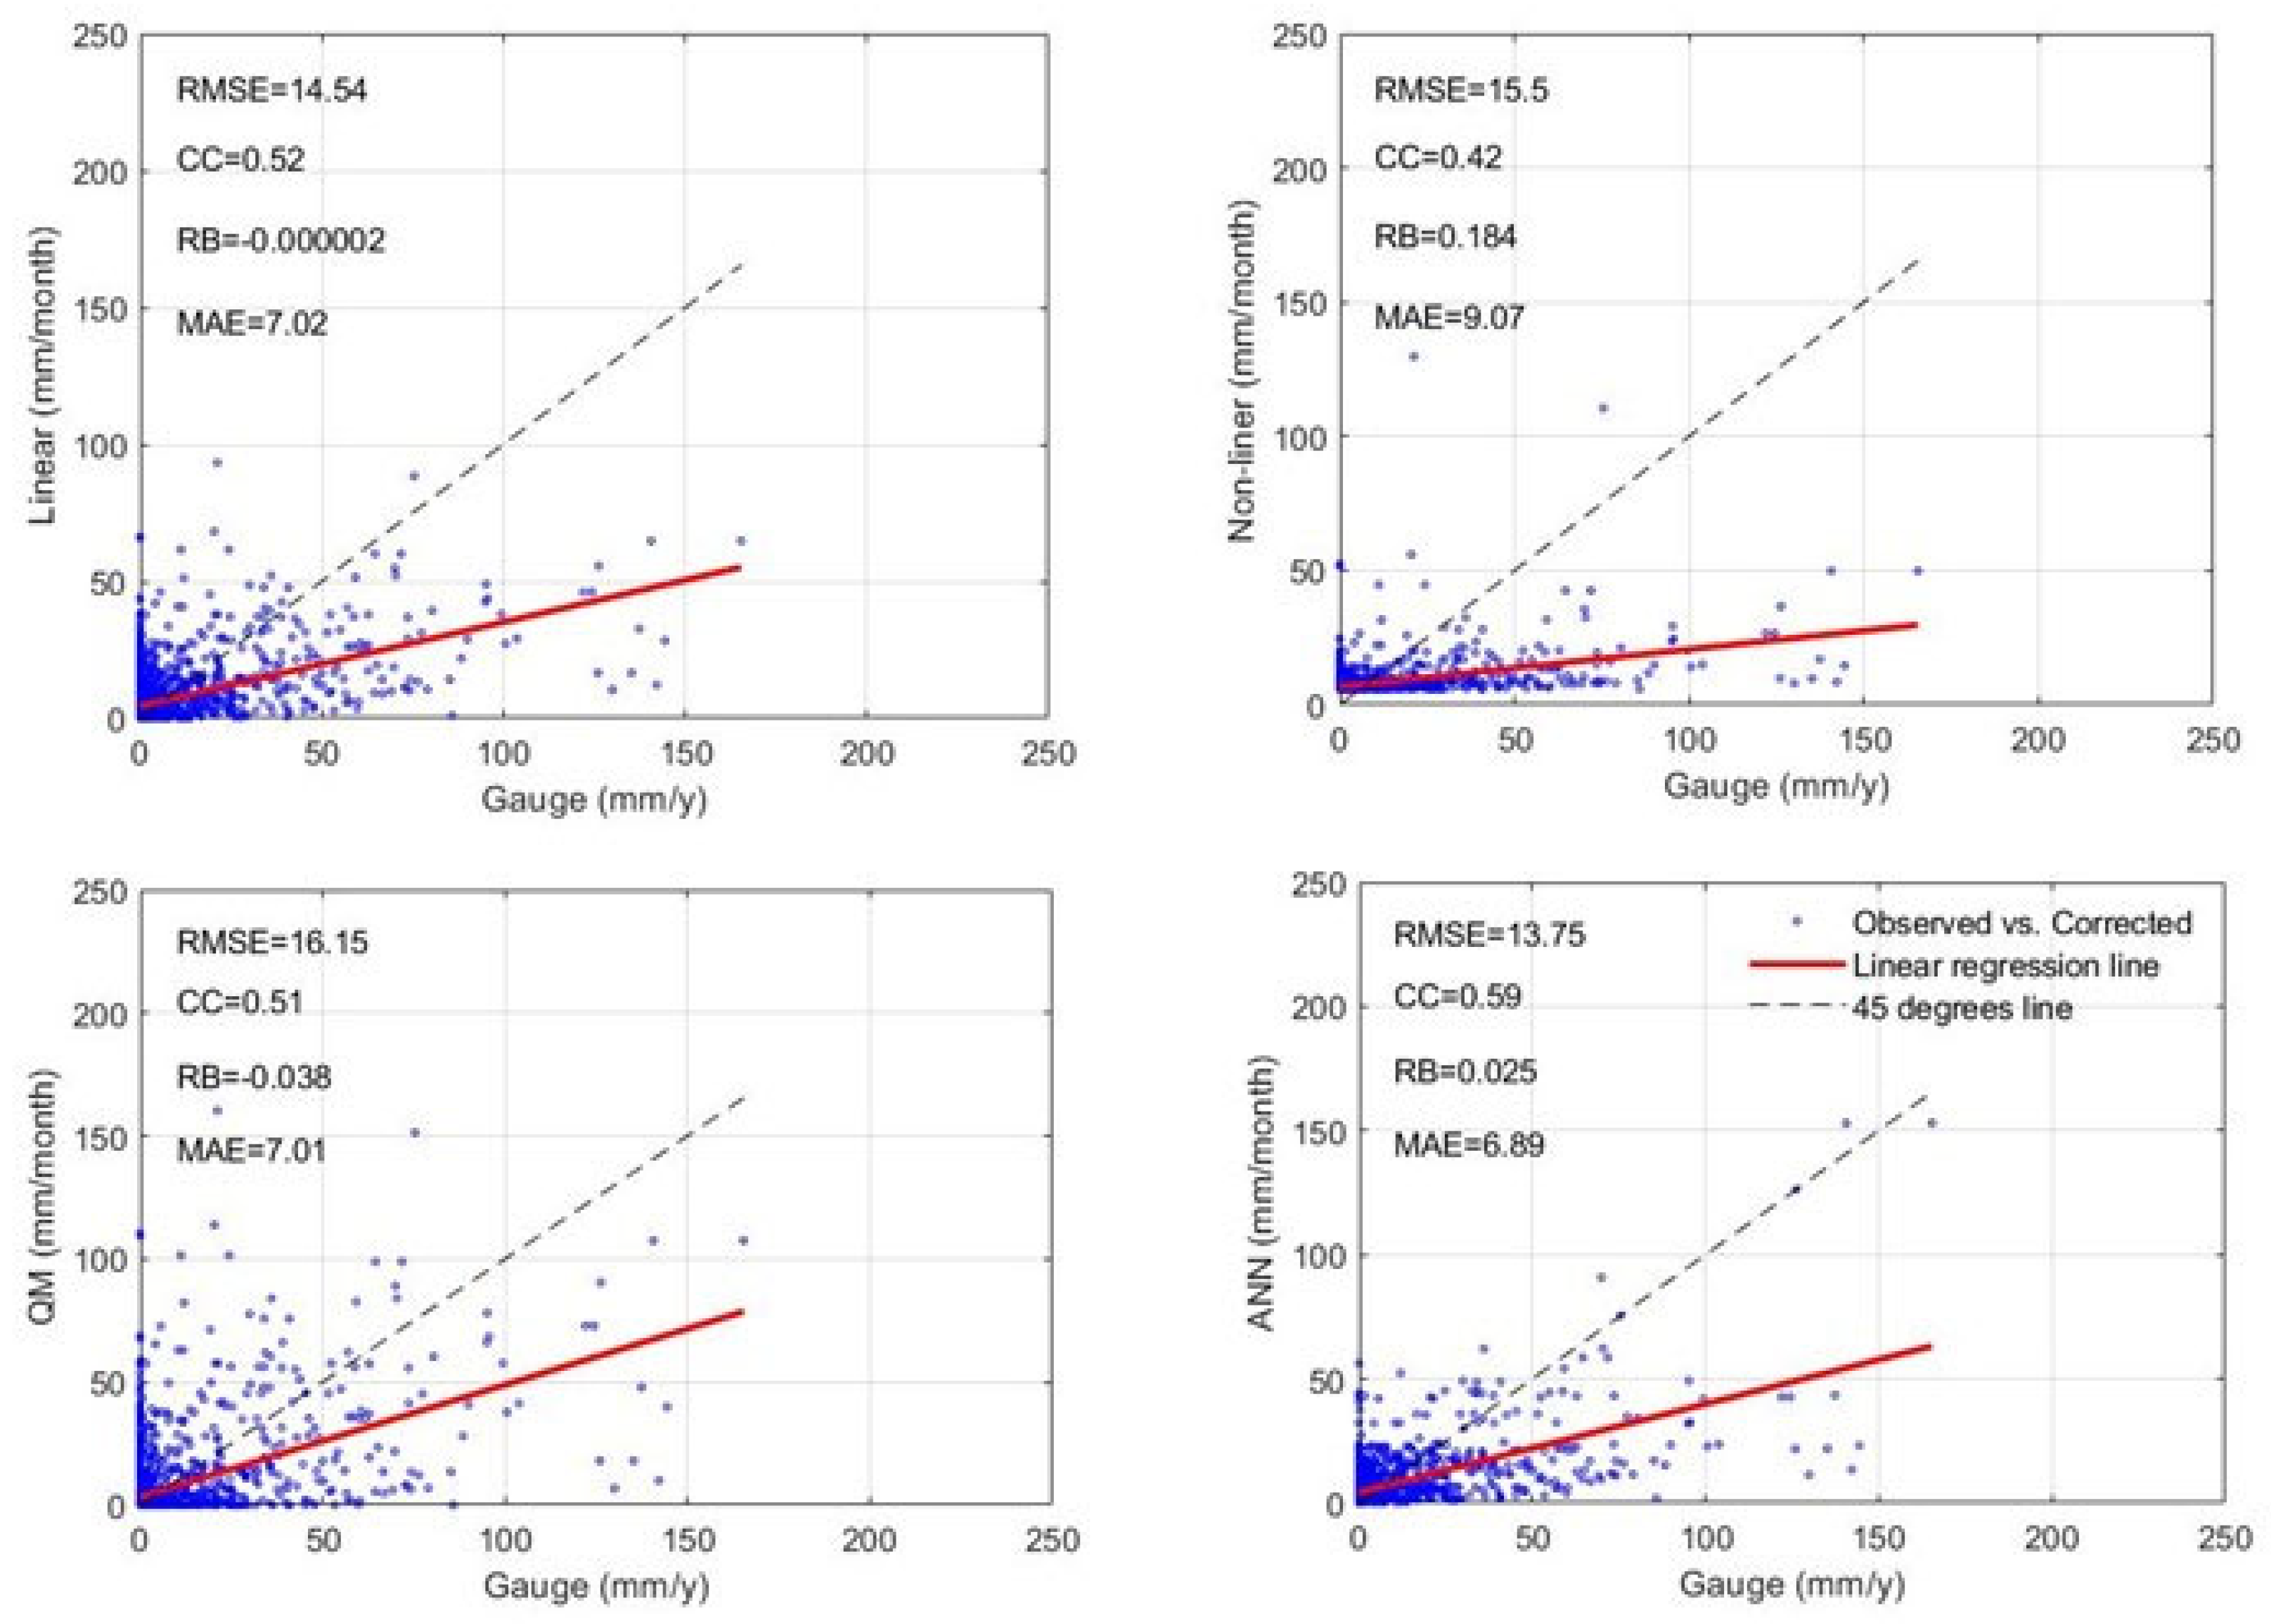
Figure 5 presents four scatter plots of different correction methods (linear, nonlinear, QM, and ANN compared to observed data. The
x-axis represents the gauge observed data (mm), and the
y-axis represents GPM corrected data (mm). The red regression lines indicate the fitted models, while the 45-degree line is used as a reference. The results show that the linear method clusters data points around lower gauge values, while the nonlinear method has more spread in data points. The QM method has a wider spread of data points, while the ANN method shows a uniform distribution across gauge values. The ANN method shows the best results, with an RMSE of 13.75 mm, CC of 0.59, RB of 0.025 and an MAE of 6.89 mm.
4. Discussion
The focus of this study is on evaluating and contrasting many satellite-based rainfall products (SBPs) for the Makkah region. We performed a comparative study of the rainfall time series at six sites from 2015 to 2020 to evaluate the performance of the SBPs. Four statistical indicators were used for assessment, and the results were are shown in
Figure 4. The results show that GPM had the lowest median root mean square error (RMSE) value among the SBPs, indicating it performed the best. PERSIANN, on the other hand, had the largest RMSE value, indicating worse accuracy in replicating actual rainfall. The GPM also demonstrated a robust association with the observed station data, as seen by its higher correlation coefficient (CC) value in comparison to other SBPs. One factor is that satellite-based precipitation (SBP) products often overestimate rainfall, especially in arid regions, due to their reliance on infrared (IR) sensors that use cloud-top temperature as a proxy for rainfall intensity. In dry climates, high and cold cloud tops do not always produce rainfall at the surface, which can lead to false detection and overestimation [
21]. The limited availability of ground-based observations in such regions makes it difficult to properly calibrate and validate SBP data, further amplifying the error [
77].
In this work, IDW was used to interpolate rainfall data. IDW interpolation can profoundly affect spatial analysis and comparative studies by estimating values at unsampled areas based on the proximity of known data points. IDW assumes that nearby points have more influence on the value of an unknown location than those farther away. IDW can fill gaps in datasets, enabling smoother visualizations and more complete analyses. The results of IDW are sensitive to the spatial distribution of data points and to the parameters used [
78]. IDW is relatively easy to implement and understand. It does not require complex statistical modeling, making it accessible for a wide range of users. The method allows users to control the influence of nearby points using a power parameter, enabling more refined interpolation depending on the context. It produces reproducible results, as the same inputs will always lead to the same outputs, which is useful for consistent comparisons. In areas with a high density of sample points, IDW can produce reliable and realistic interpolation results [
79].
On the other hand, regarding the limitations of IDW interpolation, it is sensitive to sample distribution, where it may perform poorly in regions with sparse or unevenly distributed data points. No Uncertainty Estimation, unlike kriging or other geostatistical methods, IDW does not provide a measure of estimation error or uncertainty, limiting confidence in results. The interpolation tends to be less reliable near the edges of the study area, where fewer neighbouring points are available. IDW may oversimplify spatial variability, leading to underestimation of local extremes or anomalies [
80].
Overall, our findings showed that satellite products significantly overestimated rainfall. Previous studies on satellites showed that products often overestimate rainfall in arid regions due to various factors [
81]. One factor is the limited ground-based rain gauge networks in the study regions which lead to sparse data coverage, making it challenging to estimate rainfall. Additionally, the topographical complexity of the study area, such as mountainous terrain, can further contribute to inaccuracies in satellite-based rainfall estimates [
82,
83,
84]. Therefore, bias correction techniques, such as ANN, are crucial in improving the performance of satellite products by adjusting for these overestimations. Furthermore, the frequency and intensity of rainfall events in the study area differ from those in more temperate areas, leading to discrepancies in estimating rainfall amounts. A combination of data limitations, terrain complexities, and regional climatic characteristics contributed to the tendency of rainfall satellite products to overestimate rainfall in the study regions.
The findings show that, based on the compilation of average monthly observed and satellite rainfall data from 2015 to 2020, the GPM has a superior match in comparison to other SBPs. PERSIANN-CDR showed good performance following GPM; however, PERSIANN had the lowest accuracy in representing the observed rainfall probability. The research indicates that GPM is the most dependable SBP for rainfall estimation in the Makkah area because to its persistent reduced errors, greater correlation with observed data, and superior fit to the observed rainfall distribution.
The results underscore the significance of choosing suitable SBPs for precise rainfall evaluation and point out the constraints of specific datasets in this specific area.
The corrected GPM data can significantly improve water resource management in Saudi Arabia by providing more reliable rainfall estimates. This improved accuracy supports better flood forecasting, allowing stakeholders to identify high-risk areas and respond more effectively to extreme rainfall events. In agriculture, corrected rainfall data help optimize irrigation scheduling and crop planning, which is especially valuable in arid zones where water resources are limited.
5. Conclusions
This study set out to evaluate five satellite-based precipitation (SBP) products—GPM, GPCP, CHIRPS, PERSIANN-CDR, and PERSIANN—in the arid environment of western Saudi Arabia (Makkah region). The motivation stems from the challenges of rainfall data scarcity and the known biases of global rainfall products in arid climates. Accurate rainfall information in such regions is critical, yet satellite estimates often struggle due to sparse gauges, complex terrain, and highly irregular rainfall patterns. Accordingly, the study’s objective was to quantify how well these SBPs can reproduce observed monthly rainfall at 28 station locations (2015–2020) and to identify the best-performing product for this dry region.
To achieve this, we compared SBP estimates against ground observations on a station-by-station, monthly basis using several statistical metrics. These included the correlation coefficient (CC) to assess linear agreement, root mean square error (RMSE) and mean absolute error (MAE) to quantify overall deviations, and relative bias (RB) to measure systematic errors. By applying these metrics, we gained a detailed view of each product’s accuracy and bias in capturing observed rainfall totals. In addition, we implemented an ANN-based bias correction approach as a post-processing step for the satellite data. For context, simpler bias correction methods (linear and nonlinear adjustments, as well as quantile mapping) were also considered, allowing for a comparative evaluation of ANN’s effectiveness in improving the SBP data.
The results revealed substantial variation in performance among the five SBPs, underlining the difficulty of satellite rainfall estimation in this arid region. Overall, the raw (uncorrected) satellite products showed only modest agreement with gauge data. GPM emerged as the most accurate product with a CC of 0.52 and an RMSE of 17 mm, indicating the closest match to the ground observations. PERSIANN-CDR was the next best performer (CC 0.43; RMSE 19.2 mm), while GPCP showed intermediate accuracy (CC 0.39; RMSE 19.9 mm). In contrast, CHIRPS exhibited a very low correlation with ground data (CC 0.2) and a higher error (RMSE 21.6 mm), making it the second-least reliable in this region. PERSIANN had the poorest performance (CC 0.26; RMSE 57.3 mm), reflecting a severe overestimation of rainfall. These numerical findings confirm that, even among widely used SBPs, performance can vary greatly in arid climates. Notably, the newer generation product (GPM) outperformed the others in western Saudi Arabia, whereas older datasets like PERSIANN showed large discrepancies. This underscores the importance of selecting appropriate SBPs for reliable rainfall assessment and highlights the limitations of certain products in capturing the sparse and convective rainfall characteristic of the study area.
Applying the ANN-based bias correction markedly improved the accuracy of the satellite rainfall estimates. In particular, the ANN correction on the GPM product reduced the RMSE from 17 mm to 13.75 mm and raised the CC from 0.52 to 0.59, indicating a much closer alignment with observed values. The ANN method also achieved a very low relative bias (RB ≈ 0.025, or ~2.5%) and a reduced MAE of 6.89 mm, demonstrating that the corrected satellite data nearly eliminated systematic errors and significantly lowered random errors. Compared to other bias correction techniques, the ANN proved to be the most effective; for example, linear adjustment tended to under-correct (grouping data near lower gauge values), and quantile mapping or basic nonlinear methods left more scatter and residual bias. In contrast, the ANN approach provided a more consistent correction across all rainfall ranges, yielding adjusted estimates that track the gauge measurements more faithfully. This successful application of a machine learning bias correction is a key contribution of our study, as it shows that advanced methods can substantially enhance satellite rainfall product performance in arid regions.
The improvements obtained have important practical implications for hydrological modeling and water resource management in arid and semi-arid climates. Using raw satellite rainfall data in hydrological simulations (for instance, for flood runoff modeling or groundwater recharge estimation) could lead to significant errors due to the biases and inaccuracies we observed. For the Makkah region and similar areas, our findings suggest that the GPM product (especially after bias correction) can serve as a more dependable rainfall input for models. By reducing error and bias, the ANN-corrected SBP data can improve the reliability of flood forecasting, drought monitoring, and infrastructure design in data-sparse basins. In essence, this study demonstrates how integrating ground observations with satellite data and correcting biases can unlock the potential of SBPs for practical applications. Hydrologists and water planners in arid regions can leverage these insights to choose better rainfall data sources and thus make more informed decisions, ultimately leading to more resilient water management strategies under scarce rainfall conditions.
Finally, we recommend several directions for future work to build on these findings. First, subsequent studies should extend the analysis over longer time series beyond the 2015–2020 period; incorporating more years (and including extreme wet or dry episodes) would help verify the robustness of the performance rankings and bias corrections reported here. It would also be beneficial to conduct seasonal and annual-scale evaluations, since SBP errors may vary with season (e.g., differences between rare winter storms and any summer convection in the region); such analysis could identify season-specific biases and allow for the seasonal calibration of the satellite products. Moreover, applying this evaluation framework to other arid and semi-arid regions would determine if our conclusions are generalizable or if they are unique to the climate and terrain of western Saudi Arabia. Lastly, exploring hybrid correction models presents a promising avenue, for example, merging multiple satellite products to leverage their complementary strengths, or incorporating additional data (such as atmospheric reanalysis or more in situ rain gauges) into machine learning bias correction schemes. These hybrid approaches, possibly combined with ANN or other advanced algorithms, could further reduce uncertainties in satellite rainfall estimates. By pursuing these future research directions, the scientific community can continue to improve the accuracy of satellite-based rainfall information, ultimately enhancing its usefulness for hydrology and water resource planning in arid regions.
Author Contributions
Conceptualization, I.H.E., A.Q.K., A.O.A. and R.A.; methodology, I.H.E., A.Q.K., A.O.A. and R.A.; validation, I.H.E., A.Q.K. and A.O.A.; formal analysis, I.H.E., A.Q.K., A.O.A. and R.A.; data curation, I.H.E., A.Q.K., A.O.A. and R.A.; writing—original draft preparation, I.H.E., A.Q.K. and A.O.A.; writing—review and editing, I.H.E., A.Q.K. and A.O.A.; visualization, I.H.E., A.Q.K. and A.O.A. All authors have read and agreed to the published version of the manuscript.
Funding
This research was supported by the Ongoing Research Funding Program (ORF-2025-1229), King Saud University, Riyadh, Saudi Arabia.
Institutional Review Board Statement
Not applicable.
Informed Consent Statement
Not applicable.
Data Availability Statement
The raw data supporting the conclusions of this article will be made available by the authors on request.
Acknowledgments
The authors extend their sincere appreciation to the Ongoing Research Funding Program (ORF-2025-1229), King Saud University, for funding the research project.
Conflicts of Interest
The authors declare no conflicts of interest.
References
- Tan, X.; Yong, B.; Ren, L. Error Features of the Hourly GSMaP Multi-Satellite Precipitation Estimates Over Nine Major Basins of China. Hydrol. Res. 2017, 49, 761–779. [Google Scholar] [CrossRef]
- Kucera, P.A.; Ebert, E.E.; Turk, F.J.; Levizzani, V.; Kirschbaum, D.; Tapiador, F.J.; Loew, A.; Borsche, M. Precipitation from Space: Advancing Earth System Science. Bull. Am. Meteorol. Soc. 2013, 94, 365–375. [Google Scholar] [CrossRef]
- Dibi-Anoh, P.A.; Koné, M.; Gerdener, H.; Kusche, J.; N’Da, C.K. Hydrometeorological Extreme Events in West Africa: Droughts. Surv. Geophys. 2023, 44, 173–195. [Google Scholar] [CrossRef]
- Ghodichore, N.; Dhanya, C.T.; Hendricks Franssen, H.-J. Isolating the Effects of Land Use Land Cover Change and Inter-Decadal Climate Variations on the Water and Energy Cycles over India, 1981–2010. J. Hydrol. 2022, 612, 128267. [Google Scholar] [CrossRef]
- Mei, Y.; Anagnostou, E.N.; Nikolopoulos, E.I.; Borga, M. Error Analysis of Satellite Precipitation Products in Mountainous Basins. J. Hydrometeorol. 2014, 15, 1778–1793. [Google Scholar] [CrossRef]
- Tang, G.; Clark, M.P.; Papalexiou, S.M.; Ma, Z.; Hong, Y. Have Satellite Precipitation Products Improved Over Last Two Decades? A Comprehensive Comparison of GPM IMERG with Nine Satellite and Reanalysis Datasets. Remote Sens. Environ. 2020, 240, 111697. [Google Scholar] [CrossRef]
- Atiah, W.A.; Johnson, R.; Muthoni, F.K.; Mengistu, G.T.; Amekudzi, L.K.; Kwabena, O.; Kizito, F. Bias Correction and Spatial Disaggregation of Satellite-Based Data for the Detection of Rainfall Seasonality Indices. Heliyon 2023, 9, e17604. [Google Scholar] [CrossRef]
- Degefu, M.A.; Bewket, W.; Amha, Y. Evaluating Performance of 20 Global and Quasi-Global Precipitation Products in Representing Drought Events in Ethiopia I: Visual and Correlation Analysis. Weather. Clim. Extrem. 2022, 35, 100416. [Google Scholar] [CrossRef]
- Xie, P.; Janowiak, J.E.; Arkin, P.A.; Adler, R.; Gruber, A.; Ferraro, R.; Huffman, G.J.; Curtis, S. GPCP Pentad Precipitation Analyses: An Experimental Dataset Based on Gauge Observations and Satellite Estimates. J. Clim. 2003, 16, 2197–2214. [Google Scholar] [CrossRef]
- Xie, P.; Xiong, A.-Y. A Conceptual Model for Constructing High-Resolution Gauge-Satellite Merged Precipitation Analyses. J. Geophys. Res. 2011, 116. [Google Scholar] [CrossRef]
- Bouizrou, I.; Bouadila, A.; Aqnouy, M.; Gourfi, A. Assessment of Remotely Sensed Precipitation Products for Climatic and Hydrological Studies in Arid to Semi-Arid Data-Scarce Region, Central-Western Morocco. Remote Sens. Appl. Soc. Environ. 2023, 30, 100976. [Google Scholar] [CrossRef]
- Saddique, N.; Muzammil, M.; Jahangir, I.; Sarwar, A.; Ahmed, E.; Aslam, R.A.; Bernhofer, C. Hydrological Evaluation of 14 Satellite-Based, Gauge-Based and Reanalysis Precipitation Products in a Data-Scarce Mountainous Catchment. Hydrol. Sci. J. 2022, 67, 436–450. [Google Scholar] [CrossRef]
- Sun, Q.; Miao, C.; Duan, Q.; Ashouri, H.; Sorooshian, S.; Hsu, K.-L. A Review of Global Precipitation Data Sets: Data Sources, Estimation, and Intercomparisons. Rev. Geophys. 2018, 56, 79–107. [Google Scholar] [CrossRef]
- Shaowei, N.; Jie, W.; Juliang, J.; Xiaoyan, X.; Yuliang, Z.; Fan, S.; Linlin, Z. Comprehensive Evaluation of Satellite-Derived Precipitation Products Considering Spatial Distribution Difference of Daily Precipitation over Eastern China. J. Hydrol. Reg. Stud. 2022, 44, 101242. [Google Scholar] [CrossRef]
- Duarte, L.V.; Formiga, K.T.M.; Costa, V.A.F. Analysis of the IMERG-GPM Precipitation Product Analysis in Brazilian Midwestern Basins Considering Different Time and Spatial Scales. Water 2022, 14, 2472. [Google Scholar] [CrossRef]
- Zhou, L.; Koike, T.; Takeuchi, K.; Rasmy, M.; Onuma, K.; Ito, H.; Selvarajah, H.; Liu, L.; Li, X.; Ao, T. A Study on Availability of Ground Observations and Its Impacts on Bias Correction of Satellite Precipitation Products and Hydrologic Simulation Efficiency. J. Hydrol. 2022, 610, 127595. [Google Scholar] [CrossRef]
- Lu, X.; Chen, Y.; Tang, G.; Wang, X.; Liu, Y.; Wei, M. Quantitative Estimation of Hourly Precipitation in the Tianshan Mountains Based on Area-to-Point Kriging Downscaling and Satellite-Gauge Data Merging. J. Mt. Sci. 2022, 19, 58–72. [Google Scholar] [CrossRef]
- Guo, B.; Xu, T.; Yang, Q.; Zhang, J.; Dai, Z.; Deng, Y.; Zou, J. Multiple Spatial and Temporal Scales Evaluation of Eight Satellite Precipitation Products in a Mountainous Catchment of South China. Remote Sens. 2023, 15, 1373. [Google Scholar] [CrossRef]
- Reddy, N.M.; Saravanan, S. Evaluation of the Accuracy of Seven Gridded Satellite Precipitation Products over the Godavari River Basin, India. Int. J. Environ. Sci. Technol. 2023, 20, 10179–10204. [Google Scholar] [CrossRef]
- Huffman, G.J.; Adler, R.F.; Morrissey, M.M.; Bolvin, D.T.; Curtis, S.; Joyce, R.; McGavock, B.; Susskind, J. Global Precipitation at One-Degree Daily Resolution from Multisatellite Observations. J. Hydrometeorol. 2001, 2, 36–50. [Google Scholar] [CrossRef]
- Ashouri, H.; Hsu, K.-L.; Sorooshian, S.; Braithwaite, D.K.; Knapp, K.R.; Cecil, L.D.; Nelson, B.R.; Prat, O.P. PERSIANN-CDR: Daily Precipitation Climate Data Record from Multisatellite Observations for Hydrological and Climate Studies. Bull. Am. Meteorol. Soc. 2015, 96, 69–83. [Google Scholar] [CrossRef]
- Salmani-Dehaghi, N.; Samani, N. Development of Bias-Correction PERSIANN-CDR Models for the Simulation and Completion of Precipitation Time Series. Atmos. Environ. 2021, 246, 117981. [Google Scholar] [CrossRef]
- Funk, C.; Peterson, P.; Landsfeld, M.; Pedreros, D.; Verdin, J.; Shukla, S.; Husak, G.; Rowland, J.; Harrison, L.; Hoell, A.; et al. The Climate Hazards Infrared Precipitation with Stations—A New Environmental Record for Monitoring Extremes. Sci. Data 2015, 2, 150066. [Google Scholar] [CrossRef]
- Li, W.; Jiang, Q.; He, X.; Sun, H.; Sun, W.; Scaioni, M.; Chen, S.; Li, X.; Gao, J.; Hong, Y. Effective Multi-Satellite Precipitation Fusion Procedure Conditioned by Gauge Background Fields over the Chinese Mainland. J. Hydrol. 2022, 610, 127783. [Google Scholar] [CrossRef]
- Zhang, L.; Chen, X.; Lai, R.; Zhu, Z. Performance of Satellite-Based and Reanalysis Precipitation Products under Multi-Temporal Scales and Extreme Weather in Mainland China. J. Hydrol. 2022, 605, 127389. [Google Scholar] [CrossRef]
- Sun, Z.; Long, D.; Hong, Z.; Hamouda, M.A.; Mohamed, M.M.; Wang, J. How China’s Fengyun Satellite Precipitation Product Compares with Other Mainstream Satellite Precipitation Products. J. Hydrometeorol. 2022, 23, 785–806. [Google Scholar] [CrossRef]
- Peña-Guerrero, M.D.; Umirbekov, A.; Tarasova, L.; Müller, D. Comparing the Performance of High-Resolution Global Precipitation Products across Topographic and Climatic Gradients of Central Asia. Int. J. Climatol. 2022, 42, 5554–5569. [Google Scholar] [CrossRef]
- Dangol, S.; Talchabhadel, R.; Pandey, V.P. Performance Evaluation and Bias Correction of Gridded Precipitation Products over Arun River Basin in Nepal for Hydrological Applications. Theor. Appl. Climatol. 2022, 148, 1353–1372. [Google Scholar] [CrossRef]
- Ageet, S.; Fink, A.H.; Maranan, M.; Diem, J.E.; Hartter, J.; Ssali, A.L.; Ayabagabo, P. Validation of Satellite Rainfall Estimates Over Equatorial East Africa. J. Hydrometeorol. 2022, 23, 129–151. [Google Scholar] [CrossRef]
- Nwachukwu, P.N.; Satge, F.; Yacoubi, S.E.; Pinel, S.; Bonnet, M.-P. From TRMM to GPM: How Reliable Are Satellite-Based Precipitation Data across Nigeria? Remote Sens. 2020, 12, 3964. [Google Scholar] [CrossRef]
- Satgé, F.; Defrance, D.; Sultan, B.; Bonnet, M.-P.; Seyler, F.; Rouché, N.; Pierron, F.; Paturel, J.-E. Evaluation of 23 Gridded Precipitation Datasets across West Africa. J. Hydrol. 2020, 581, 124412. [Google Scholar] [CrossRef]
- Wu, Z.; Xu, Z.; Wang, F.; He, H.; Zhou, J.; Wu, X.; Liu, Z. Hydrologic Evaluation of Multi-Source Satellite Precipitation Products for the Upper Huaihe River Basin, China. Remote Sens. 2018, 10, 840. [Google Scholar] [CrossRef]
- Seo, G.-Y.; Ahn, J.-B. Comparison of Bias Correction Methods for Summertime Daily Rainfall in South Korea Using Quantile Mapping and Machine Learning Model. Atmosphere 2023, 14, 1057. [Google Scholar] [CrossRef]
- Salehnia, N.; Ahn, J. Modelling and Reconstructing Tree Ring Growth Index with Climate Variables through Artificial Intelligence and Statistical Methods. Ecol. Indic. 2022, 134, 108496. [Google Scholar] [CrossRef]
- Moghim, S.; Bras, R.L. Bias Correction of Climate Modeled Temperature and Precipitation Using Artificial Neural Networks. J. Hydrometeorol. 2017, 18, 1867–1884. [Google Scholar] [CrossRef]
- Hayhoe, K.; Cayan, D.; Field, C.B.; Frumhoff, P.C.; Maurer, E.P.; Miller, N.L.; Moser, S.C.; Schneider, S.H.; Cahill, K.N.; Cleland, E.E.; et al. Emissions Pathways, Climate Change, and Impacts on California. Proc. Natl. Acad. Sci. USA 2004, 101, 12422–12427. [Google Scholar] [CrossRef]
- Cayan, D.R.; Maurer, E.P.; Dettinger, M.D.; Tyree, M.; Hayhoe, K. Climate Change Scenarios for the California Region. Clim. Change 2008, 87, 21–42. [Google Scholar] [CrossRef]
- Maurer, E.P.; Hidalgo, H.G. Utility of Daily vs. Monthly Large-Scale Climate Data: An Intercomparison of Two Statistical Downscaling Methods. Hydrol. Earth Syst. Sci. 2008, 12, 551–563. [Google Scholar] [CrossRef]
- Hornik, K. Approximation Capabilities of Multilayer Feedforward Networks. Neural Netw. 1991, 4, 251–257. [Google Scholar] [CrossRef]
- Hornik, K.; Stinchcombe, M.; White, H. Multilayer Feedforward Networks Are Universal Approximators. Neural Netw. 1989, 2, 359–366. [Google Scholar] [CrossRef]
- Liu, Z.; Peng, C.; Xiang, W.; Tian, D.; Deng, X.; Zhao, M. Application of Artificial Neural Networks in Global Climate Change and Ecological Research: An Overview. Chin. Sci. Bull. 2010, 55, 3853–3863. [Google Scholar] [CrossRef]
- Maier, H.R.; Jain, A.; Dandy, G.C.; Sudheer, K.P. Methods Used for the Development of Neural Networks for the Prediction of Water Resource Variables in River Systems: Current Status and Future Directions. Environ. Model. Softw. 2010, 25, 891–909. [Google Scholar] [CrossRef]
- Almazroui, M.; Islam, M.N.; Jones, P.D.; Athar, H.; Rahman, M.A. Recent Climate Change in the Arabian Peninsula: Seasonal Rainfall and Temperature Climatology of Saudi Arabia for 1979–2009. Atmos. Res. 2012, 111, 29–45. [Google Scholar] [CrossRef]
- Tekeli, A.E. Exploring Jeddah Floods by Tropical Rainfall Measuring Mission Analysis. Water 2017, 9, 612. [Google Scholar] [CrossRef]
- Tekeli, A.E.; Fouli, H. Evaluation of TRMM Satellite-Based Precipitation Indexes for Flood Forecasting over Riyadh City, Saudi Arabia. J. Hydrol. 2016, 541, 471–479. [Google Scholar] [CrossRef]
- Mahmoud, M.T.; Al-Zahrani, M.A.; Sharif, H.O. Assessment of Global Precipitation Measurement Satellite Products over Saudi Arabia. J. Hydrol. 2018, 559, 1–12. [Google Scholar] [CrossRef]
- Al-Areeq, A.M.; Al-Zahrani, M.A.; Sharif, H.O. Assessment of the Performance of Satellite Rainfall Products over Makkah Watershed Using a Physically Based Hydrologic Model. Appl. Water Sci. 2022, 12, 246. [Google Scholar] [CrossRef]
- Dawod, G.M.; Mirza, M.N.; Al-Ghamdi, K.A. Assessment of Several Flood Estimation Methodologies in Makkah Metropolitan Area, Saudi Arabia. Arab. J. Geosci. 2013, 6, 985–993. [Google Scholar] [CrossRef]
- Bahrawi, J. Rainfall Distribution and Its Characteristics in Makkah Al-Mukarramah Region, Saudi Arabia. Appl. Ecol. Environ. Res. 2018, 16, 4129–4144. [Google Scholar] [CrossRef]
- Almazroui, M. Rainfall Trends and Extremes in Saudi Arabia in Recent Decades. Atmosphere 2020, 11, 964. [Google Scholar] [CrossRef]
- Abdelmajeed, A.Y.A.; Juszczak, R. Challenges and Limitations of Remote Sensing Applications in Northern Peatlands: Present and Future Prospects. Remote Sens. 2024, 16, 591. [Google Scholar] [CrossRef]
- Evagorou, E.; Argyriou, A.; Papadopoulos, N.; Mettas, C.; Alexandrakis, G.; Hadjimitsis, D. Evaluation of Satellite-Derived Bathymetry from High and Medium-Resolution Sensors Using Empirical Methods. Remote Sens. 2022, 14, 772. [Google Scholar] [CrossRef]
- Aksu, H.; Akgül, M.A. Performance Evaluation of CHIRPS Satellite Precipitation Estimates over Turkey. Theor. Appl. Climatol. 2020, 142, 71–84. [Google Scholar] [CrossRef]
- Nicholson, S.E.; Klotter, D.A. Assessing the Reliability of Satellite and Reanalysis Estimates of Rainfall in Equatorial Africa. Remote Sens. 2021, 13, 3609. [Google Scholar] [CrossRef]
- Nguyen, P.; Ombadi, M.; Sorooshian, S.; Hsu, K.; AghaKouchak, A.; Braithwaite, D.; Ashouri, H.; Thorstensen, A.R. The PERSIANN Family of Global Satellite Precipitation Data: A Review and Evaluation of Products. Hydrol. Earth Syst. Sci. 2018, 22, 5801–5816. [Google Scholar] [CrossRef]
- Gu, G.; Adler, R.F.; Huffman, G.J.; Curtis, S. Tropical Rainfall Variability on Interannual-to-Interdecadal and Longer Time Scales Derived from the GPCP Monthly Product. J. Clim. 2007, 20, 4033–4046. [Google Scholar] [CrossRef]
- Huffman, G.J.; Bolvin, D.T.; Braithwaite, D.; Hsu, K.; Joyce, R.; Kidd, C.; Nelkin, E.J.; Sorooshian, S.; Tan, J.; Xie, P. NASA Global Precipitation Measurement (GPM) Integrated Multi-Satellite Retrievals for GPM (IMERG). Algorithm Theoretical Basis Document (ATBD) Version 06; NASA/GSFC: Greenbelt, MD, USA, 2019; p. 30.
- Hay, L.E.; Clark, M.P.; Wilby, R.L.; Gutowski, W.J.; Leavesley, G.H.; Pan, Z.; Arritt, R.W.; Takle, E.S. Use of Regional Climate Model Output for Hydrologic Simulations. J. Hydrometeorol. 2002, 3, 571–590. [Google Scholar] [CrossRef]
- Diaz-Nieto, J.; Wilby, R.L. A Comparison of Statistical Downscaling and Climate Change Factor Methods: Impacts on Low Flows in the River Thames, United Kingdom. Clim. Change 2005, 69, 245–268. [Google Scholar] [CrossRef]
- Shabalova, M.V.; Deursen, W.P.A.v.; Buishand, T.A. Assessing Future Discharge of the River Rhine Using Regional Climate Model Integrations and a Hydrological Model. Clim. Res. 2003, 23, 233–246. [Google Scholar] [CrossRef]
- Leander, R.; Buishand, T.A. Resampling of Regional Climate Model Output for the Simulation of Extreme River Flows. J. Hydrol. 2007, 332, 487–496. [Google Scholar] [CrossRef]
- Teutschbein, C.; Seibert, J. Bias Correction of Regional Climate Model Simulations for Hydrological Climate-Change Impact Studies: Review and Evaluation of Different Methods. J. Hydrol. 2012, 456–457, 12–29. [Google Scholar] [CrossRef]
- Maraun, D. Bias Correcting Climate Change Simulations-A Critical Review. Curr. Clim. Change Rep. 2016, 2, 211–220. [Google Scholar] [CrossRef]
- Wilks, D. Statistical Methods in the Atmospheric Sciences; Academic Press: Cambridge, MA, USA, 2011; Volume 100, ISBN 0-12-385022-3. [Google Scholar]
- Themeßl, M.J.; Gobiet, A.; Heinrich, G. Empirical-Statistical Downscaling and Error Correction of Regional Climate Models and Its Impact on the Climate Change Signal. Clim. Change 2012, 112, 449–468. [Google Scholar] [CrossRef]
- Baño-Medina, J.; Manzanas, R.; Gutiérrez, J.M. Configuration and Intercomparison of Deep Learning Neural Models for Statistical Downscaling. Geosci. Model Dev. 2020, 13, 2109–2124. [Google Scholar] [CrossRef]
- Sai Kishore, K.M.; Kumar Behera, M.; Chakravarty, S.; Dash, S. Hyperspectral Image Classification Using Minimum Noise Fraction and Random Forest. In Proceedings of the 2020 IEEE International Women in Engineering (WIE) Conference on Electrical and Computer Engineering (WIECON-ECE), Bhubaneswar, India, 26–27 December 2020; pp. 296–299. [Google Scholar]
- Rahimikhoob, H.; Sohrabi, T.; Delshad, M. Assessment of Reference Evapotranspiration Estimation Methods in Controlled Greenhouse Conditions. Irrig. Sci. 2020, 38, 389–400. [Google Scholar] [CrossRef]
- Sharifi, E.; Saghafian, B.; Steinacker, R. Downscaling Satellite Precipitation Estimates with Multiple Linear Regression, Artificial Neural Networks, and Spline Interpolation Techniques. J. Geophys. Res. Atmos. 2019, 124, 789–805. [Google Scholar] [CrossRef]
- Ahmed, K.; Sachindra, D.A.; Shahid, S.; Demirel, M.C.; Chung, E.S. Selection of multi-model ensemble of general circulation models for the simulation of precipitation and maximum and minimum temperature based on spatial assessment metrics. Hydrol. Earth Syst. Sci. 2019, 23, 4803–4824. [Google Scholar] [CrossRef]
- Vandal, T.; Kodra, E.; Ganguly, S.; Michaelis, A.; Nemani, R.; Ganguly, A.R. DeepSD: Generating High Resolution Climate Change Projections through Single Image Super-Resolution. In Proceedings of the 23rd ACM SIGKDD International Conference on Knowledge Discovery and Data Mining, Halifax, NS, Canada, 13–17 August 2017; Association for Computing Machinery: New York, NY, USA, 2017; pp. 1663–1672. [Google Scholar]
- ASCE Task Committee on Application of Artificial Neural Networks in Hydrology Artificial Neural Networks in Hydrology. II: Hydrologic Applications. J. Hydrol. Eng. 2000, 5, 124–137. [Google Scholar] [CrossRef]
- Goodfellow, I.; Bengio, Y.; Courville, A. Deep Learning; MIT Press: Cambridge, MA, USA, 2015. [Google Scholar]
- Geron, A. Hands-On Machine Learning with Scikit-Learn, Keras, and TensorFlow Concepts, Tools, and Techniques to Build Intelligent Systems, 2nd ed.; O’Reilly Media, Inc.: Sebastopol, CA, USA, 2019; Available online: https://www.scirp.org/reference/referencespapers?referenceid=3265407 (accessed on 12 June 2025).
- Chollet, F.; Chollet, F. Deep Learning with Python, 2nd ed.; Simon and Schuster: New York, NY, USA, 2021; ISBN 978-1-61729-686-4. [Google Scholar]
- Thorne, V.; Coakeley, P.; Grimes, D.; Dugdale, G. Comparison of TAMSAT and CPC Rainfall Estimates with Raingauges, for Southern Africa. Int. J. Remote Sens. 2001, 22, 1951–1974. [Google Scholar] [CrossRef]
- Prakash, S.; Srinivasan, J. A Comprehensive Evaluation of Near-Real-Time and Research Products of IMERG Precipitation over India for the Southwest Monsoon Period. Remote Sens. 2021, 13, 3676. [Google Scholar] [CrossRef]
- Liu, Z.; Zhang, Z.; Zhou, C.; Ming, W.; Du, Z. An Adaptive Inverse-Distance Weighting Interpolation Method Considering Spatial Differentiation in 3D Geological Modeling. Geosciences 2021, 11, 51. [Google Scholar] [CrossRef]
- Wang, S.; Huang, G.; Lin, Q.; Li, Z.; Zhang, H.; Fan, Y. Comparison of Interpolation Methods for Estimating Spatial Distribution of Precipitation in Ontario, Canada. Int. J. Climatol. 2014, 34, 3745–3751. [Google Scholar] [CrossRef]
- Gong, G.; Mattevada, S.; O’Bryant, S. Comparison of the Accuracy of Kriging and IDW Interpolations in Estimating Groundwater Arsenic Concentrations in Texas. Environ. Res. 2014, 130, 59–69. [Google Scholar] [CrossRef] [PubMed]
- Zeng, W.; Ding, X.; Sun, W.; Mu, X. Improvement of Satellite-Based Rainfall Product CHIRPS in Estimating Rainfall Erosivity on the Loess Plateau. Land Degrad. Dev. 2023, 34, 4517–4528. [Google Scholar] [CrossRef]
- Rachidi, S.; El Mazoudi, E.H.; El Alami, J.; Jadoud, M.; Er-Raki, S. Assessment and Comparison of Satellite-Based Rainfall Products: Validation by Hydrological Modeling Using ANN in a Semi-Arid Zone. Water 2023, 15, 1997. [Google Scholar] [CrossRef]
- Baig, F.; Abrar, M.; Chen, H.; Sherif, M. Evaluation of Precipitation Estimates from Remote Sensing and Artificial Neural Network Based Products (PERSIANN) Family in an Arid Region. Remote Sens. 2023, 15, 1078. [Google Scholar] [CrossRef]
- Macharia, D.; Fankhauser, K.; Selker, J.S.; Neff, J.C.; Thomas, E.A. Validation and Intercomparison of Satellite-Based Rainfall Products over Africa with TAHMO In Situ Rainfall Observations. J. Hydrometeorol. 2022, 23, 1131–1154. [Google Scholar] [CrossRef]
| Disclaimer/Publisher’s Note: The statements, opinions and data contained in all publications are solely those of the individual author(s) and contributor(s) and not of MDPI and/or the editor(s). MDPI and/or the editor(s) disclaim responsibility for any injury to people or property resulting from any ideas, methods, instructions or products referred to in the content. |
© 2025 by the authors. Licensee MDPI, Basel, Switzerland. This article is an open access article distributed under the terms and conditions of the Creative Commons Attribution (CC BY) license (https://creativecommons.org/licenses/by/4.0/).


