Article

Study on Dust Distribution Law in Open-Pit Coal Mines Based on Depth Variation

1
Safety Engineering College of NCIST, North China Institute of Science and Technology, Beijing 100043, China
2
School of Resources and Safety Engineering, University of Science and Technology Beijing, Beijing 100083, China
*
Author to whom correspondence should be addressed.
These authors contributed equally to this work.
Atmosphere 2025, 16(7), 771; https://doi.org/10.3390/atmos16070771 (registering DOI)
Submission received: 22 April 2025 / Revised: 29 May 2025 / Accepted: 18 June 2025 / Published: 23 June 2025
(This article belongs to the Section Air Pollution Control)

Abstract

This study examines the influence mechanism of mining depth evolution on dust distribution, using the An Tai Bao open-pit coal mine as the research subject. A spatial coordinate system of the mining area was established utilizing a GIS positioning system, and high-resolution topographic data were extracted using Global Mapper. The research team developed a three-dimensional geological model updating algorithm with depth gradient as the characteristic parameter, enabling dynamic monitoring of mining depth with a model iteration accuracy of 0.5 m per update. A Fluent-based numerical simulation method was employed to construct a depth-dependent dust migration field solving system, aiming to elucidate the three-dimensional coupling mechanism between mining depth and dust dispersion. The findings reveal that mining depth demonstrates a three-stage critical response to dust migration. When the depth surpasses the threshold of 150 m, the wind speed attenuation rate at the pit bottom exhibits a marked change, and the dust dispersion distance decreases by 62% compared to shallow mining conditions. The slope pressure field evolution shows a significant depth-enhancement effect, with the maximum wind pressure at the leeward step boundary increasing by 22–35% for every additional 50 m of depth, resulting in dust accumulation zones with distinct depth-related characteristics. The west wind scenario demonstrates a particularly notable depth amplification effect, with the dust dispersion range in a 200-meter-deep pit expanding by 53.7% compared to the standard west wind condition. Furthermore, the interaction between particle size and depth causes the dust migration distance to exhibit exponential decay as depth increases. This research elucidates the progressive constraining influence of mining depth, a critical control parameter, on dust migration patterns. It establishes a depth-oriented theoretical framework for dust prevention and control strategies in deep open-pit mines.

1. Introduction

Open-pit coal mining, as a primary method for modern coal resource exploitation, has substantially enhanced energy supply efficiency through large-scale extraction techniques. However, this advancement has also intensified ecological and environmental pressures within and surrounding mining areas. In recent years, the progressive deepening of open-pit operations, combined with the interplay between complex terrain and microclimatic conditions, has resulted in emerging characteristics of dust dispersion behavior. Particularly in ecologically vulnerable regions, dust pollution not only accelerates surface vegetation degradation but also presents health risks to mine workers through respiratory exposure. These challenges have rendered the study of dust transport mechanisms and associated control technologies in open-pit mines a crucial topic in the field of environmental engineering.
In the field of dust pollution research, both domestic and international scholars have made significant contributions. Wanjun T. et al. [1] utilized Fluent simulations and monitoring data to reveal a power–law relationship between PM10 and PM2.5 in open-pit mines, as well as the variation in dust escape time with particle size. Wu T. et al. [2] employed numerical simulations to analyze the micro-scale migration and macro-scale diffusion of dust, identifying an inverse relationship between particle size and escape rate, with circulation phenomena contributing to concentrated dust distribution. Zhou W. et al. [3], using a computational fluid dynamics model, discovered that vertical wind shear significantly affects dust dispersion caused by truck movement; under a wind speed of 9 m/s, negative pressure reached −68 Pa. The study also emphasized the importance of maintaining adequate spacing between trucks to reduce occupational exposure risks. Lal B. et al. [4] developed a dust concentration prediction model using an artificial neural network, where Model 3 outperformed the traditional Gaussian-plume model in prediction accuracy. Li L. et al. [5] proposed an LSTM-Attention hybrid model, which improved prediction accuracy by 5.6% and 3.0% compared to ARIMA and standalone LSTM models, respectively. Du S. et al. [6] combined Split Hopkinson Pressure Bar (SHPB) testing with image recognition techniques to construct a predictive model for blast dust emissions, achieving a field-verified error margin of less than 10%. Trechera P. et al. [7] conducted a comprehensive assessment of dust emission potential in open-pit coal mines in northwest China, highlighting the necessity of health studies on mineralogical differences in respirable dust (RD). Yan J. et al. [8] analyzed the wettability of explosion dust and developed a novel dust suppressant, which increased coal dust penetration height tenfold and reduced total suspended particulate (TSP) concentrations by 81.4%. Wang Z. et al. [9] proposed a meteorology-based dust control method for open-pit mines, recommending the optimization of mining schedules using weather forecasts to improve dust suppression efficiency. Li G. et al. [10], through physical and numerical simulations, revealed the arching effect of weak interlayer-bearing slopes and delineated a three-zone deformation pattern. Rojano R.E. et al. [11] assessed the transboundary impacts of PM emissions from the world’s largest open-pit coal mine, finding that under prevailing northeast wind conditions, annual PM10 increases ranged from 6.2% to 7.7%, indicating the need to strengthen local dust control measures. Luo H. et al. [12] focused on wintertime PM pollution at the bottom of the Haerwusu open-pit mine. Through continuous dual-point monitoring from December to February, they analyzed the relationship between PM concentrations and meteorological factors. The results showed that humidity was the primary influencing factor, with PM2.5 exhibiting greater sensitivity to meteorological changes. Ma J. et al. [13], using the Anjialing open-pit mine in the Pingshuo mining area as a case study, adopted a solar-powered multi-point network monitoring approach to investigate the influencing factors and spatial distribution of PM2.5, PM10, and TSP concentrations. The findings indicated that PM2.5 and PM10 concentrations were positively correlated with humidity and air pressure, and negatively correlated with wind speed, temperature, and noise; TSP was positively correlated with temperature and negatively correlated with humidity. Wang G. et al. [14] monitored TSP, PM10, and PM2.5 concentrations in both operational and non-operational zones of a large open-pit coal mine, along with meteorological parameters. Multivariate statistical analysis revealed that coarse particles (2.5–10 μm) predominated in operational zones, while fine particles (0–2.5 μm) were dominant in non-operational zones. Production intensity significantly affected dust concentrations in operational zones but had no clear impact on peripheral areas. Meteorological factors such as wind speed, temperature, and humidity were correlated with particle concentration, and the LSTM model demonstrated superior performance in dust prediction. Deng Y. et al. [15] conducted atmospheric dustfall sampling in a northwest arid desert region from March to December 2018 to analyze dust flux, particle size distribution, and their relationship with meteorological factors. The results showed higher dustfall fluxes in spring and summer across both mining and desert areas, with particle size distributions exhibiting unimodal characteristics. The largest average particle sizes were observed in desert areas during spring and summer. Wind speed was identified as the primary driver of dustfall flux, relative humidity significantly influenced particle size, while no direct correlation was found between dustfall flux and particle size. Jie Zhang et al. [16] performed numerical simulations to examine the process of external air inflow into the fractured soft coal seam, offering insights into dust behavior under specific geological and operational conditions. Hao Tianxuan et al. [17] examined dust migration and deposition patterns within the breathing zone of a fully mechanized mining face, analyzing dust distribution patterns relevant to occupational exposure. Nie Wen et al. [18] employed CFD-based simulations to examine dust transport mechanisms and air age in tunnels under varying ventilation methods, demonstrating how ventilation strategies affect dust dispersion and air quality in underground settings. Jing Deji et al. [19] studied dust migration in transportation roadways and developed a spray dust suppression system to enhance dust control in critical mine transportation areas. Chen Fang et al. [20] examined the coupled migration of airflow and respiratory dust in an 8 m high fully mechanized mining face, elucidating the interactions between airflow dynamics and fine dust movement in large-height mining operations.
Previous research has primarily emphasized horizontal dust diffusion patterns while inadequately addressing dust distribution characteristics associated with dynamic changes in mining depth. This study addresses this gap by developing mathematical and geometrical models based on fluid mechanics theory to analyze the influence of mining depth gradients on dust distribution patterns. The Fluent (Available online: https://www.ansys.com/products/fluids/ansys-fluent, accessed on 17 March 2025) software was utilized to simulate the dynamic process of dust dispersion at various mining stages. This enables a more intuitive demonstration of the dust transport patterns as the pit depth varies.

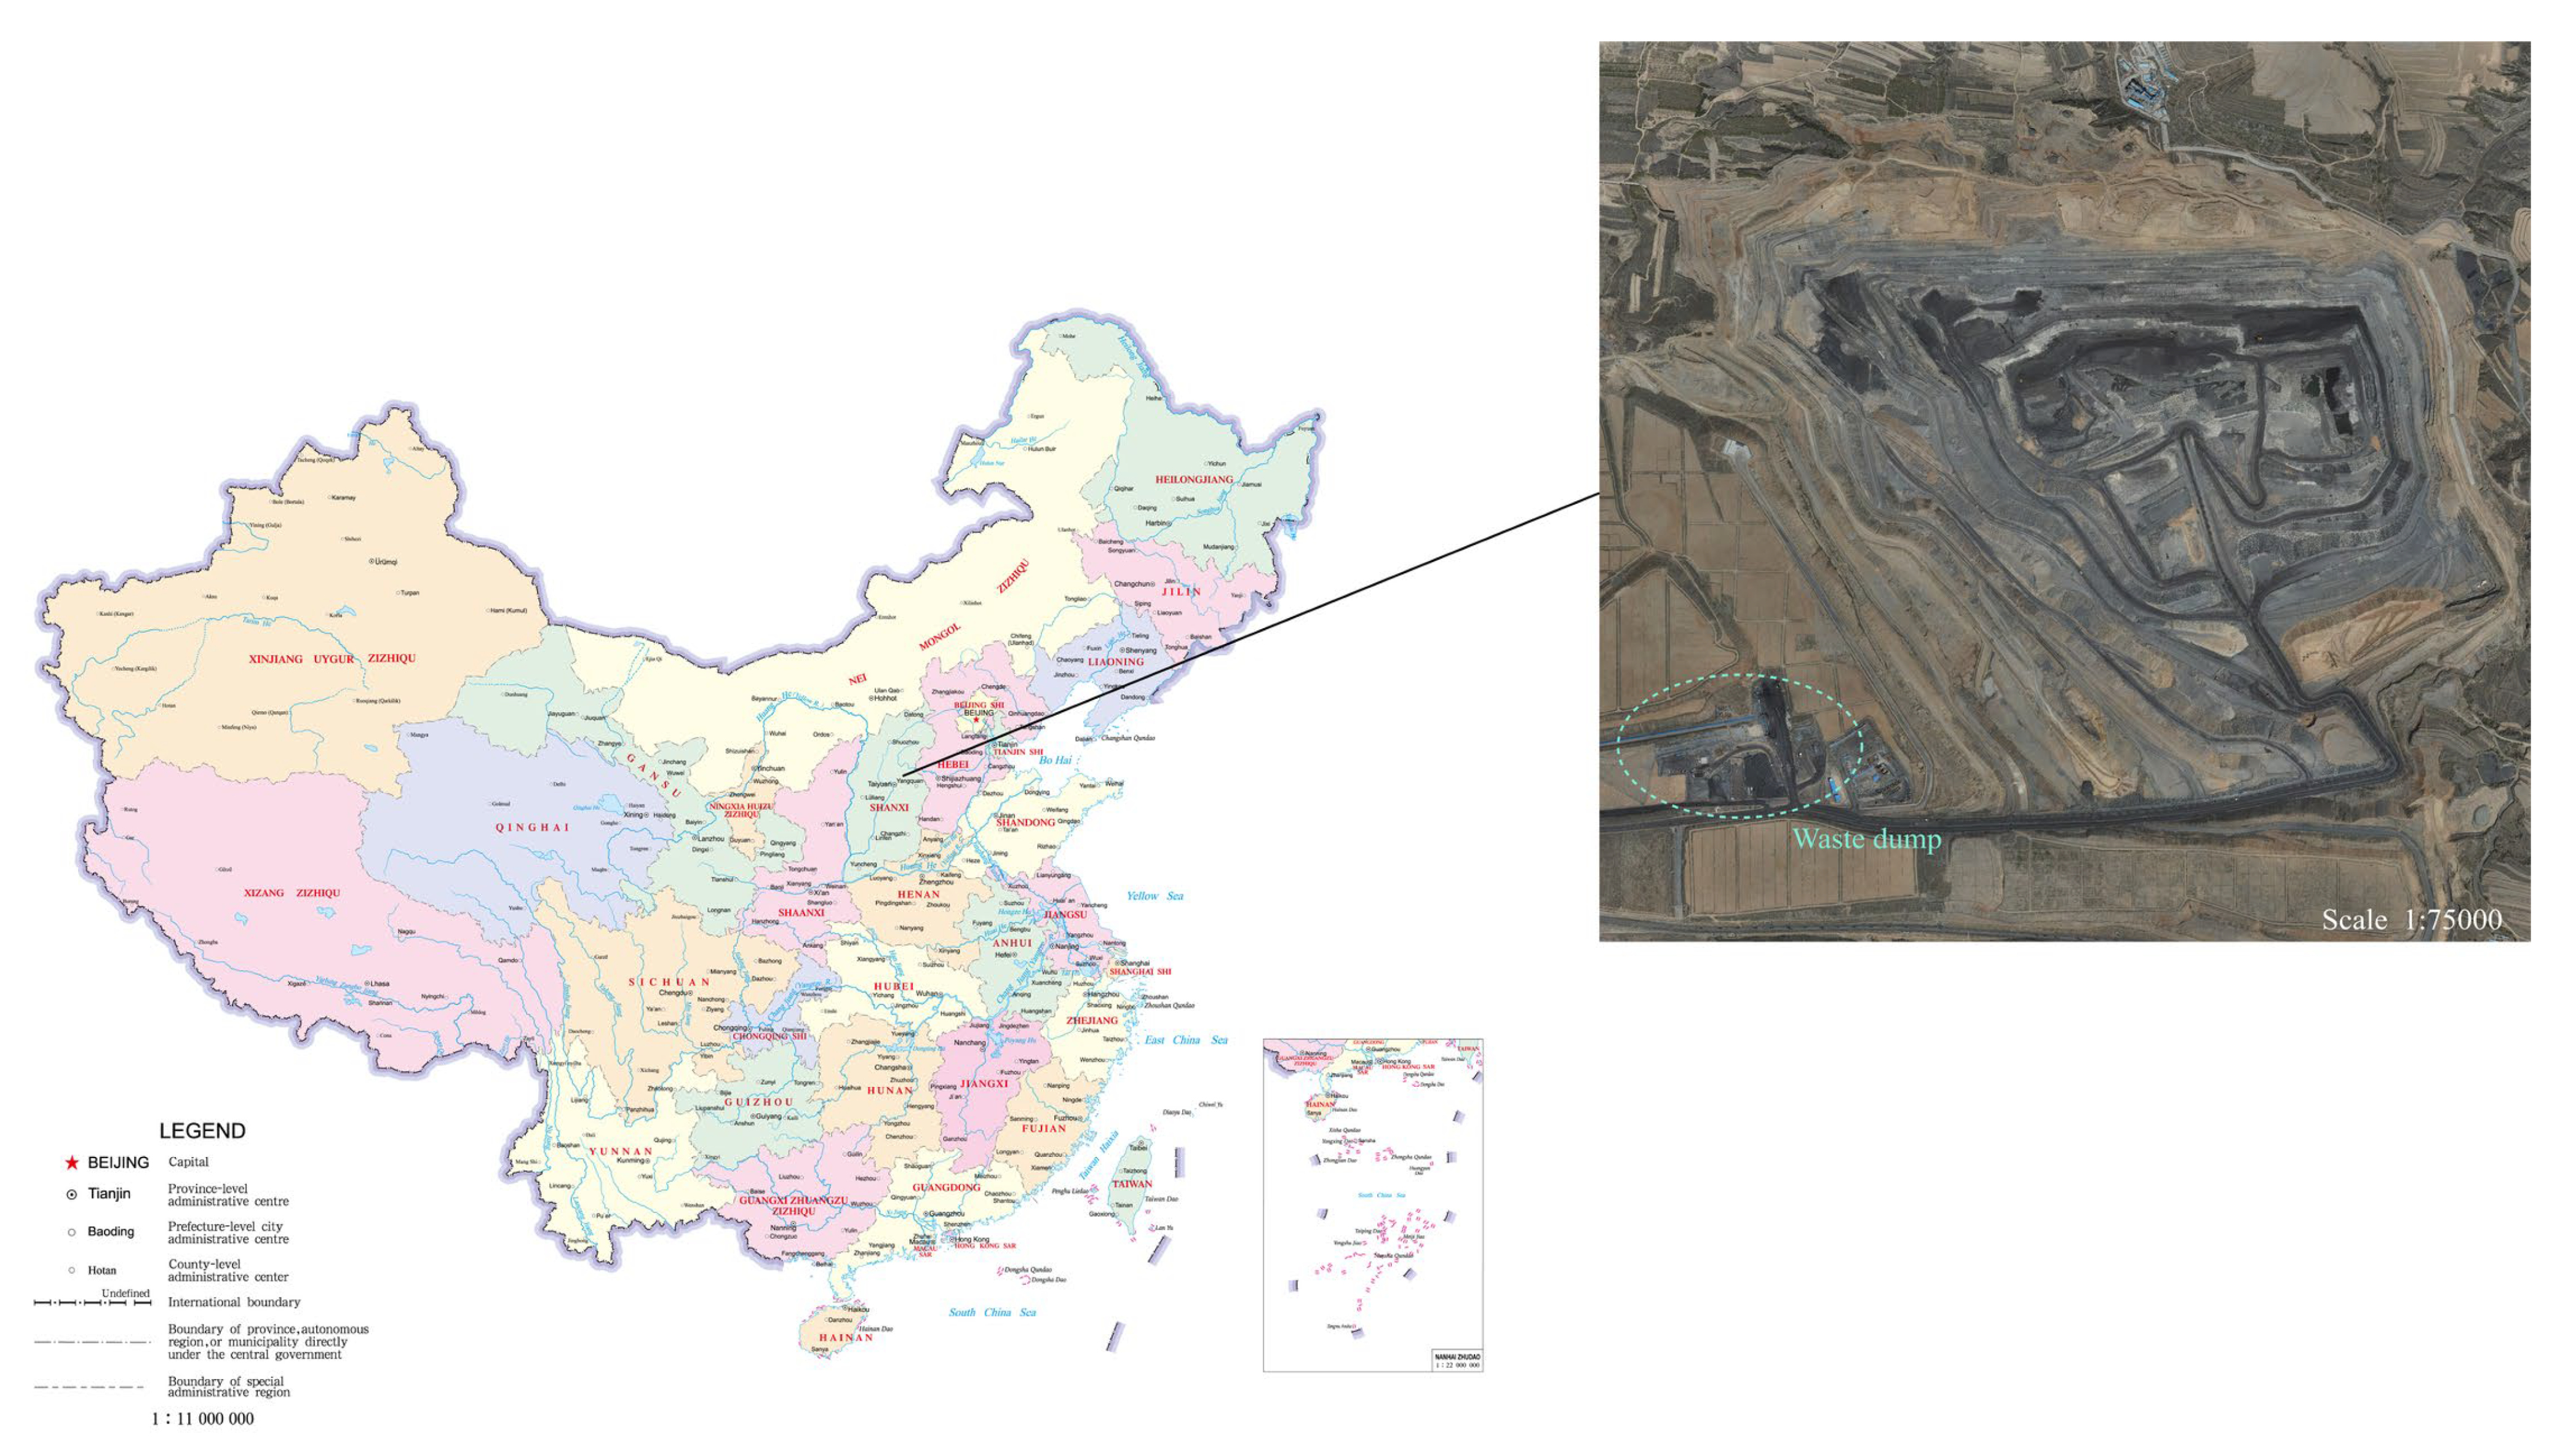
2. Fundamental Characteristics of the An Tai Bao Open-Pit Coal Mine

2.1. Environmental Parameters of the Open-Pit Coal Mine

This study utilized the Pingshuo An Tai Bao open-pit coal mine as a research model. The mine is situated in the northern section of the Ningwu Coalfield, within the Pinglu District of Shuozhou City, approximately 22.5 km from the city center. The area experiences a temperate continental climate with an average annual temperature of 13.8 °C. Northwest winds predominate, particularly during winter and spring seasons, with an average annual wind speed of 4.2 m/s. The mining pit at the mine’s base measures approximately 270 m in length from east to west and 130 m in width from north to south, encompassing an area of about 35,100 m2. The pit’s shape approximates a regular hexahedron. The topography generally slopes from higher elevations on the periphery to lower elevations in the center. The highest point, at an elevation of +1490 m, is located northeast of the mining area, while the lowest point, at +1232 m, is found in the southern part of the mining area in an excavated but unfilled pit bottom. The elevation difference between these points is 258 m. The mine’s planned raw coal production capacity is 11 million tonnes, with an internal overburden removal of 27.29 million cubic meters and total stripping volume of 35.57 million cubic meters, yielding a stripping ratio of 3.23 m3 per tonne of raw coal. The sedimentary strata thickness ranges from 2600 to 3500 m, with recently exposed central strata belonging to the Mesozoic Jurassic system, comprising grayish-yellow feldspathic sandstone, sandy mudstone, and coal seams. Figure 1 illustrates the mining area of the An Tai Bao open-pit coal mine.

2.2. The New Model of the Company

The mining operations at the An Tai Bao open-pit coal mine primarily comprise two systems: the soil and rock stripping system and the raw coal handling system. The stripping system employs a single-bucket excavator to remove loose materials, loess, and rock overburden from above the upper coal seam. The handling system involves transporting these materials to the waste dump site using dump trucks. The primary production processes of the open-pit mine include drilling, blasting, shoveling, and transportation, as illustrated in Figure 2, which depicts the process flowchart of the An Tai Bao open-pit coal mine.

3. Influence of Depth Variation on Dust Distribution

3.1. Intensity of Mining Operations

The stripping volume of rock and the mining volume at each stage were analyzed statistically, using the mining pit depth as a variable. The results are presented in Table 1. As the pit depth increases, both the stripping volume and mining volume exhibit a gradual increase, with the cumulative mining volume reaching approximately 2.73 million tons. Consequently, the dust concentration rises with the increasing depth of the mining pit. At the pit bottom, dust accumulation is more pronounced due to gravitational effects.
This research examines the dust distribution characteristics and evolutionary patterns in undisturbed areas of open-pit mines. As mining operations progress and depth increases, two significant changes in production processes are observed: Firstly, the rock stripping volume per mining step increases incrementally, resulting in a corresponding rise in the total amount of primary dust generated from rock fragmentation. Secondly, the vertical lifting height of the transportation system continuously increases, substantially elevating the likelihood of secondary dust generation during ore transfer. These two critical factors collectively contribute to an exponential increase in dust generation intensity within the mining area.
The dust in undisturbed areas demonstrates significant environmental dependence, while its high diffusivity under rapid accumulation conditions reveals novel spatiotemporal distribution characteristics. The loose soil–rock mixture resulting from large-scale overburden disposal creates a unique “dust amplifier” effect during the continuous elevation of the waste dump. The freshly blasted rock bodies at the lower part of the waste dump possess higher porosity, providing an excellent diffusion channel for dust migration. Additionally, the layered structure formed by gravitational compaction of the upper accumulation is susceptible to creating a “canyon wind” effect under monsoon influence, increasing dust dispersion distance by 2–3 times compared to flat ground environments.
As mining operations reach a critical depth threshold, the daily average dust concentration in undisturbed areas can increase significantly, reaching levels up to 3.2 times higher than those observed during shallow mining stages. Furthermore, the duration of peak concentration periods can extend by more than 40%. This pronounced spatiotemporal variability in dust distribution primarily results from the nonlinear interactions between heightened rock fragmentation energy levels, increased frequency of material transfer, and alterations in terrain and topography associated with deep mining activities.

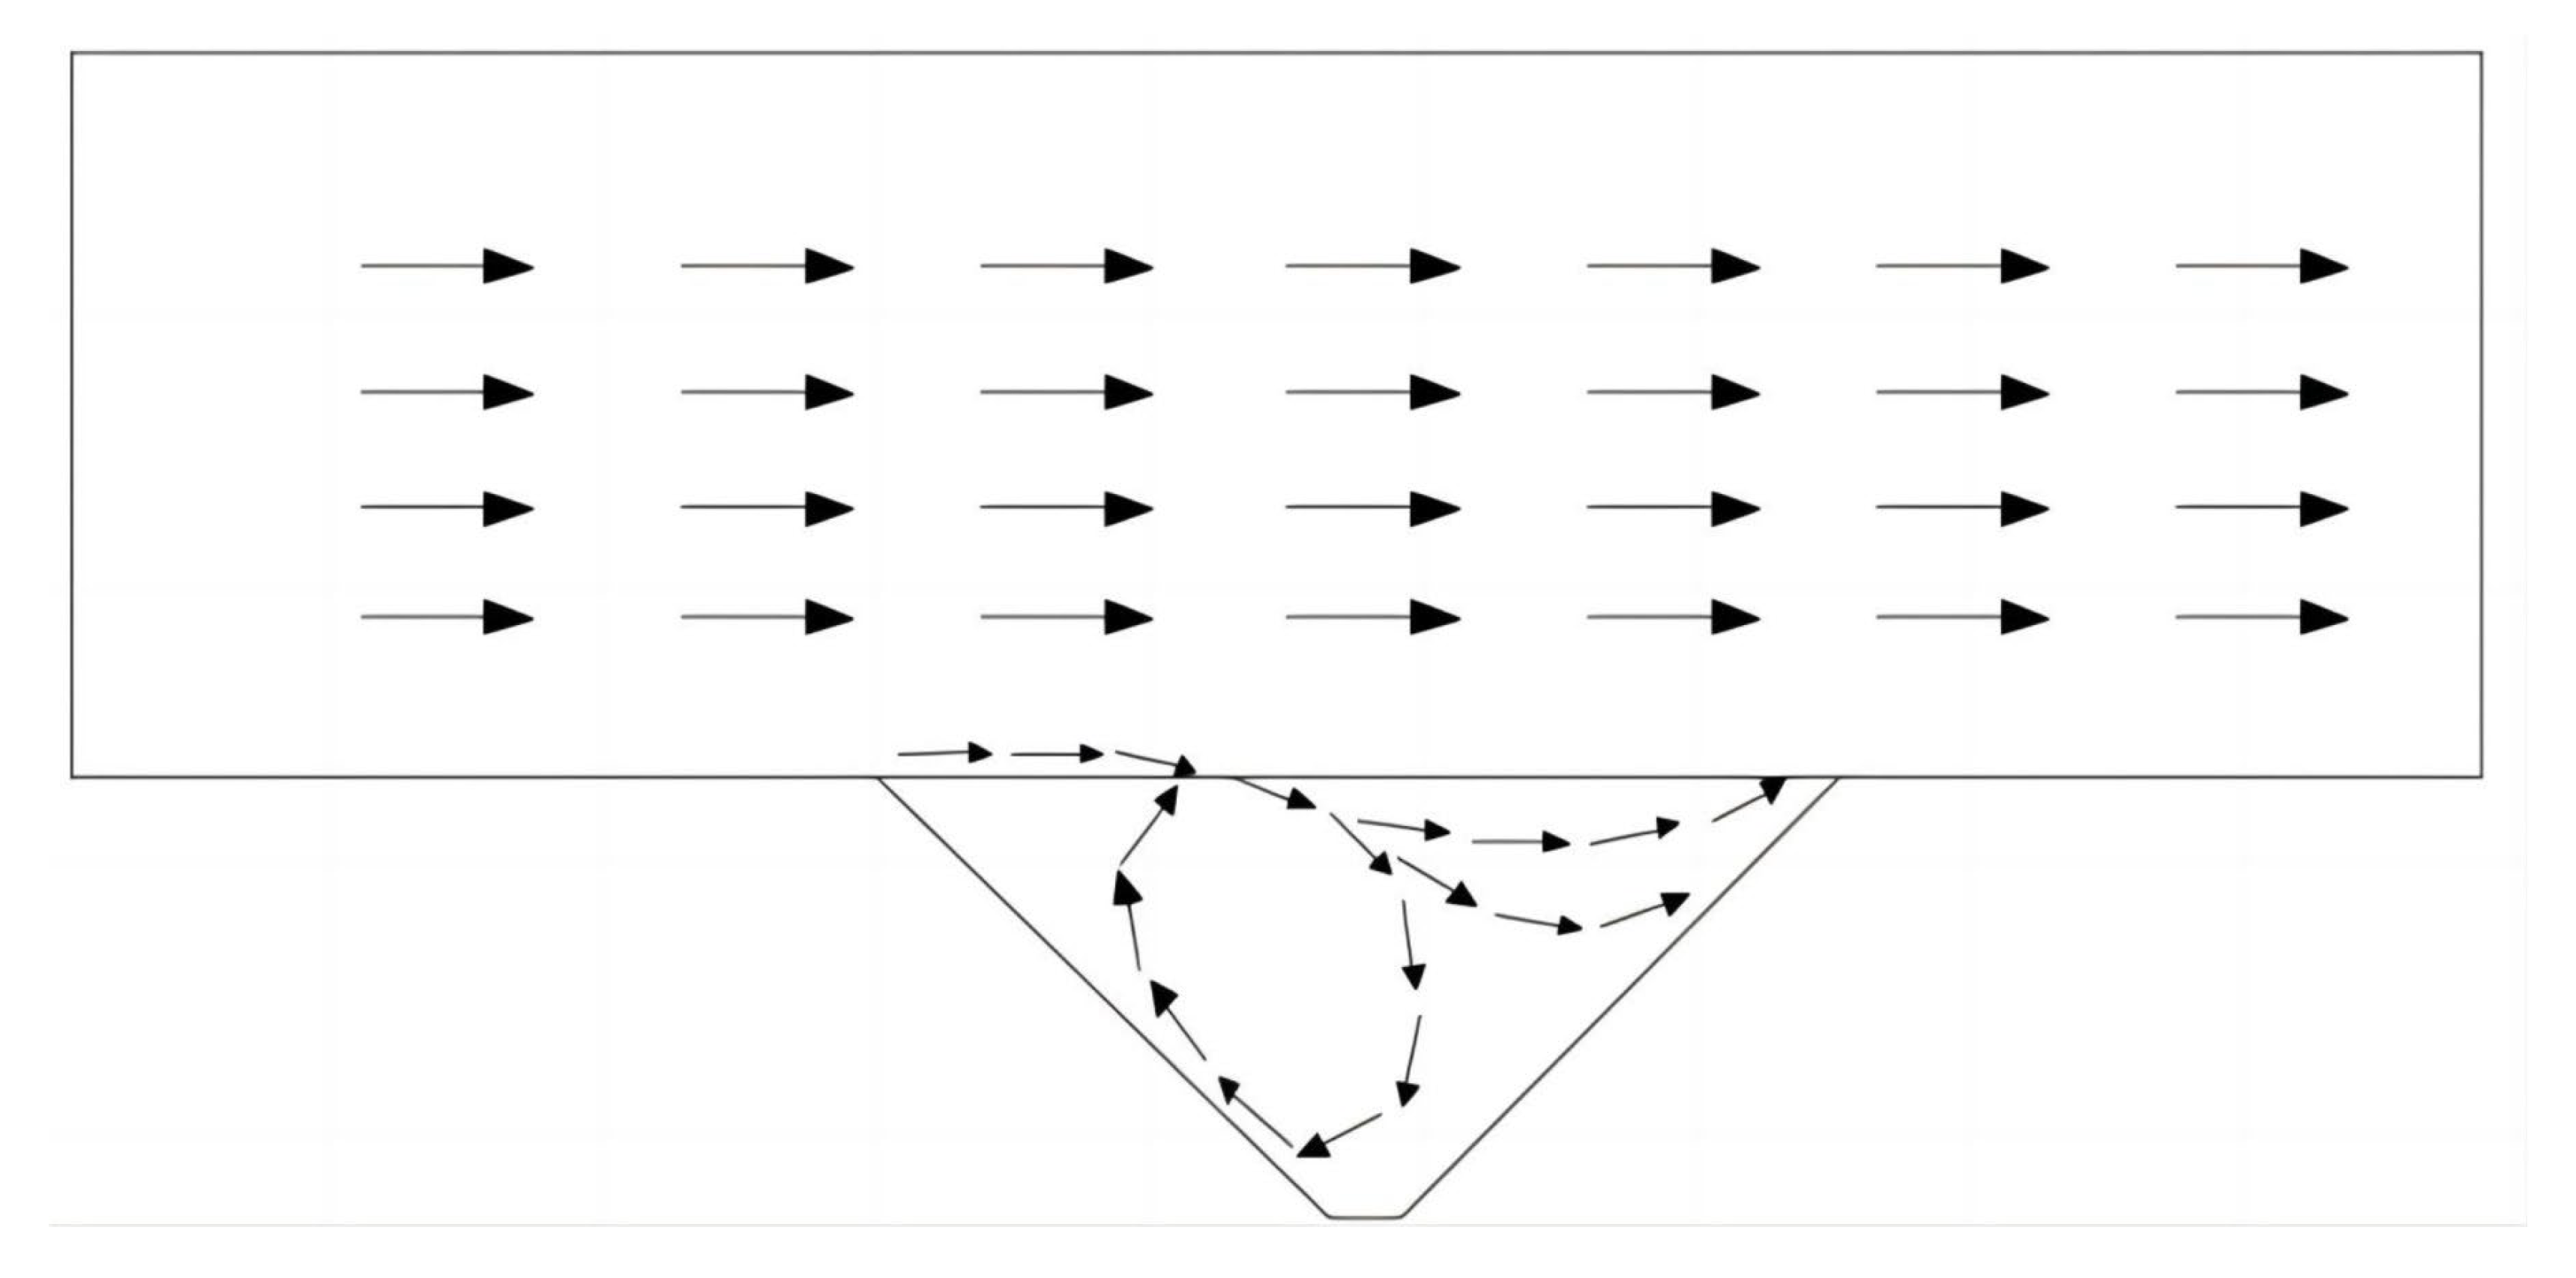
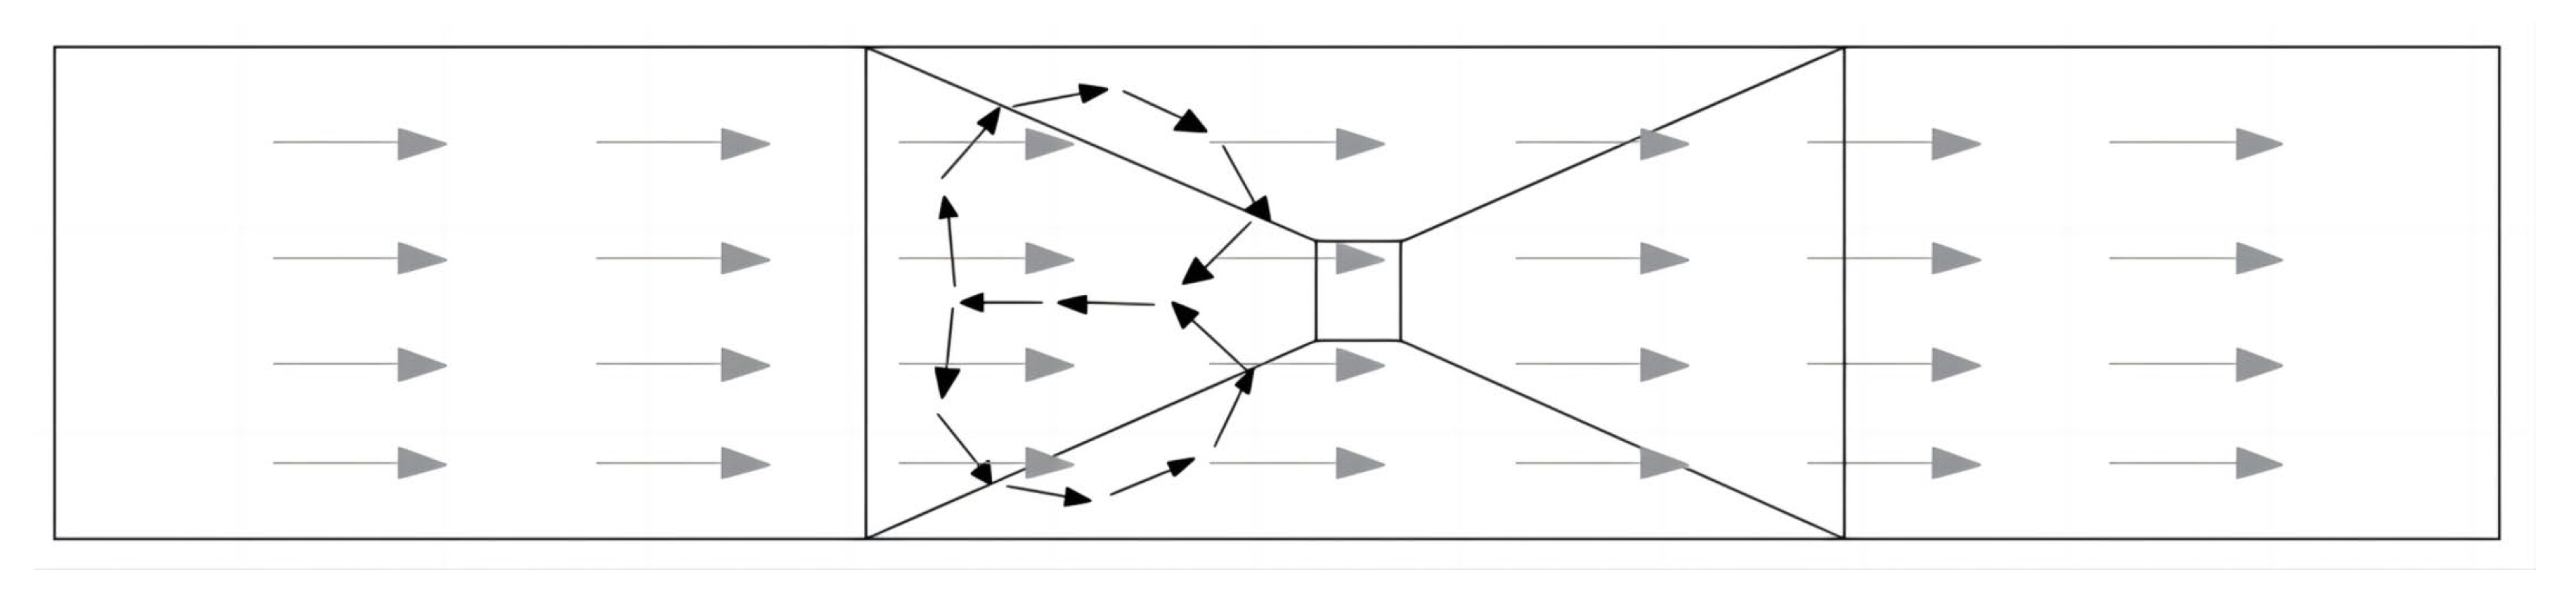
3.2. Characteristics of Atmospheric Flow Field in Mining Areas

The distinctive topography resulting from increased mining depth in open-pit coal mines significantly influences atmospheric circulation patterns. At a pit depth of 300 m, the geometric constraints imposed by the pit slopes become the dominant factor in flow field evolution. The steep rock walls, with slope angles exceeding 30°, mechanically obstruct horizontal natural wind, compelling the primary wind to descend into the pit and generating a pronounced vortex separation phenomenon. This topographical forcing effect induces a three-dimensional composite circulation system, characterized by a core of constrained horizontal circulation and intensified vertical circulation.
The flow field reconstruction within the deep pit demonstrates a characteristic “dual vortex coupling” pattern: horizontally, wind flow obstructed by the slopes generates a vortex circulation with a diameter spanning approximately 60–80% of the pit width, with rotational velocity decreasing logarithmically as depth increases; vertically, temperature-driven density flow creates a chimney effect, where upward airflow velocity increases by 0.5–0.8 m/s per 100 m of depth. Monitoring data reveals that when pit depth exceeds 200 m, the vertical circulation flux constitutes over 45% of the total wind exchange, establishing a distinct “air pump” phenomenon.
This composite circulation system exerts a dual impact on dust dispersion: the vertical circulation, by establishing a stable upward channel, can reduce the PM2.5 concentration at the pit bottom to 30–40% of that in the horizontal circulation zone. However, it also contributes to the formation of deposition peak areas for particles exceeding 10 μm in the circulation convergence zone. Notably, the slope’s modulation effect on the flow field increases nonlinearly with depth. At a mining depth of 500 m, the effective diffusion radius of the horizontal circulation decreases to 20% of the pit diameter, while the dust diffusion height carried by the vertical circulation can extend up to 300 m above ground level, creating a unique “deep pit-high altitude” dispersion pathway. This depth-dependent flow field reconstruction mechanism fundamentally alters conventional dust migration patterns in open-pit mines, as illustrated in Figure 3 and Figure 4.

4. Establishment of Mathematical Model for Dust Diffusion

The movement of dust in open-pit mines fundamentally represents a two-phase gas–solid flow. This study, grounded in gas–solid two-phase flow theory, investigates the gas phase motion using an Eulerian coordinate system and the dust particle motion through a Lagrangian coordinate system. A Euler–Lagrange model is developed, utilizing the wind flow above the open-pit mine as the background fluid, which is resolved using the Euler method [21,22]. The dust within the open-pit mine is conceptualized as discretely distributed particles within the wind flow, and the Lagrangian method is employed to determine the dust particle trajectories.
In applying the Lagrangian method to calculate dust trajectories within open-pit mines, the influence of relatively minor forces can be disregarded. The analysis primarily considers gravity and air resistance. Consequently, the force balance equation for dust particles is expressed as follows:
d u p d t = F D ( u u p ) + g x ( ρ p ρ ) ρ p
In the equation, g x represents the component of gravitational acceleration in the x-direction, and F D represents the drag force per unit mass for the dust particles.
F D = 0.75 C D ρ u p u ρ p d p
In the equation, C D is the drag coefficient (This coefficient is a dimensionless quantity);
FD is the drag force per unit mass for the dust particles, in s−1;
u is the fluid phase velocity, in m/s;
u p is the particle velocity, in m/s;
ρ is the fluid density, in kg/m3;
ρ p is the particle density, in kg/m3;
d p is the particle diameter, in m.
The particle trajectory control equation is
d v d t = g 1 ρ f ρ p + 3 ρ f C D w 4 ρ p d w
In the equation, d v d t is the rate of change of particle velocity with respect to time, in m/s2;
g is the gravitational acceleration vector, in m/s2;
ρ f is the density of the continuous phase (gas);
w is the relative velocity vector between the gas and the particles;
d is the diameter of the dust particles.
Under the influence of turbulence, the trajectories of particles exhibit randomness. The instantaneous airflow velocity can be regarded as the sum of a mean component and a fluctuating component, i.e.,
u = u ¯ + u ( t )
For the k ε model, the duration of the particle integration can be approximated as the duration of the Lagrangian integration of the airflow, i.e.,
T L = 0.15 k ε
When particles and fluid discrete vortices interact, it is assumed that the fluctuating velocity of the u fluid within the turbulent vortex follows a Gaussian probability density distribution. Thus, u can be expressed as
u = ξ ( u ) 2
In the equation, ( u ) 2 is the root mean square of the local fluctuating velocity, and ξ is a random number that follows a normal distribution. For the k ε model, it is assumed that the local turbulence is isotropic [22,23]:
( u ) 2 = ( v ) 2 = ( w ) 2 = 2 k 3
By performing piecewise time integration of the instantaneous velocity, it is possible to estimate how turbulence randomly affects the diffusion characteristics of particles. The use of the discrete coordinate method for numerical calculation enables the achievement of higher accuracy [24,25].

5. Numerical Simulation

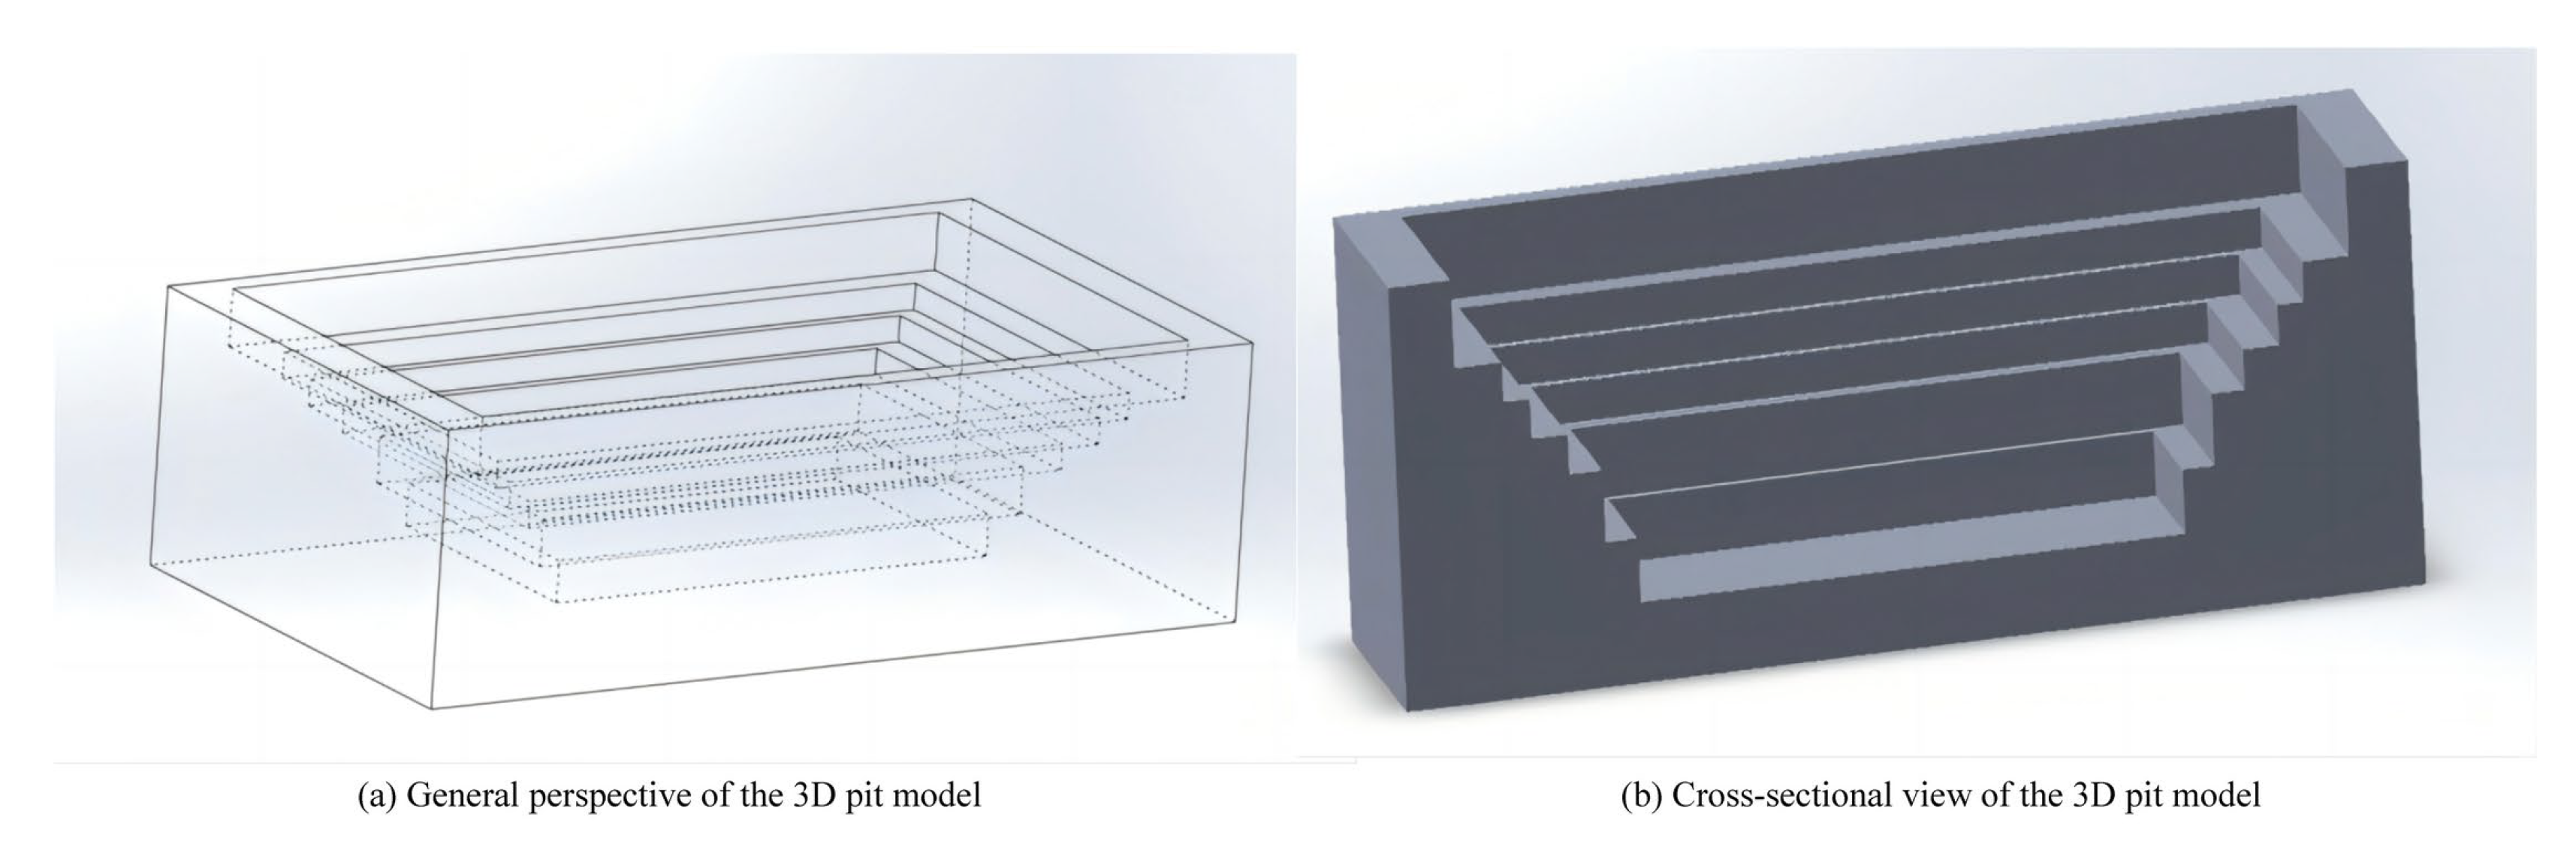
5.1. Open-Pit Coal Mine Model

The geographic location of the An Tai Bao open-pit mine in Shuozhou, Shanxi, was identified using geographic spatial data cloud. The acquired data was imported into Global Mapper (Available online: https://www.bluemarblegeo.com/global-mapper/, Accessed on 17 March 2025) software for stitching and integration, generating regional contour lines. These contour lines were then imported into SketchUp (Available online: https://www.sketchup.com/zh-cn, Accessed on 17 March 2025) to create a quadrilateral network-style terrain of the open-pit mine. The model was subsequently refined using modeling software, and the pit model was generated based on the open-pit mine’s contour lines. The open-pit mine extends 4.42–5.47 km east to west and 6.53–10.3 km north to south, encompassing a total exploration area of 48.73 km2.
Geospatial data cloud technology was utilized to extract terrain data for the region using the Digital Elevation Model (DEM) with GDEMV330M (Available online: https://www.earthdata.nasa.gov/topics/land-surface/digital-elevation-terrain-model-dem, accessed on 17 March 2025) resolution digital elevation data. Advanced retrieval techniques were employed to obtain the terrain information. Subsequently, Global Mapper software (Available online: https://www.bluemarblegeo.com/global-mapper/, accessed on 17 March 2025) was employed to process and generate contour lines for the region. A three-dimensional model of the mine pit was constructed using SolidWorks (Available online: https://www.solidworks.com/, accessed on 17 March 2025), creating a comprehensive representation of the open-pit mine. The model’s parameters include a surface length (L) of 3600 m, an excavation depth (H) of 780 m, and a slope angle of 40°, as illustrated in Figure 5.
Three horizontal planes are constructed: plane-a on the X-Y (Z = 0) plane, plane-b on the Z-Y (X = 0) plane, and plane-c along the X-Z (Y = 250 m) plane. To facilitate a more comprehensive analysis of pressure distribution within the pit, four lines are designated on the horizontal cross-section of plane-a. These lines, labeled a, b, c, and d, are perpendicular to the X-axis and parallel to the Y-axis. Lines a and b are symmetrically positioned with respect to the Y-axis, with an absolute distance of 650 m between them. Similarly, lines c and d are symmetrical to the Y-axis, with an absolute distance of 750 m. For reference purposes, line-c and line-a are designated as negative, while line-b and line-d are considered positive. This configuration is illustrated in Figure 6.

5.2. Simulation Parameter Settings

In the simulation process, to ensure consistency between the wind flow direction in the flow field and the actual direction, the east was designated as the inlet and the west as the outlet from a top-down perspective. The gravitational acceleration was set to −9.81 m/s2, and the boundary condition for the side walls of the upper fluid domain in the model was defined as escape. The specific calculation parameters were established based on actual data, as presented in Table 2.

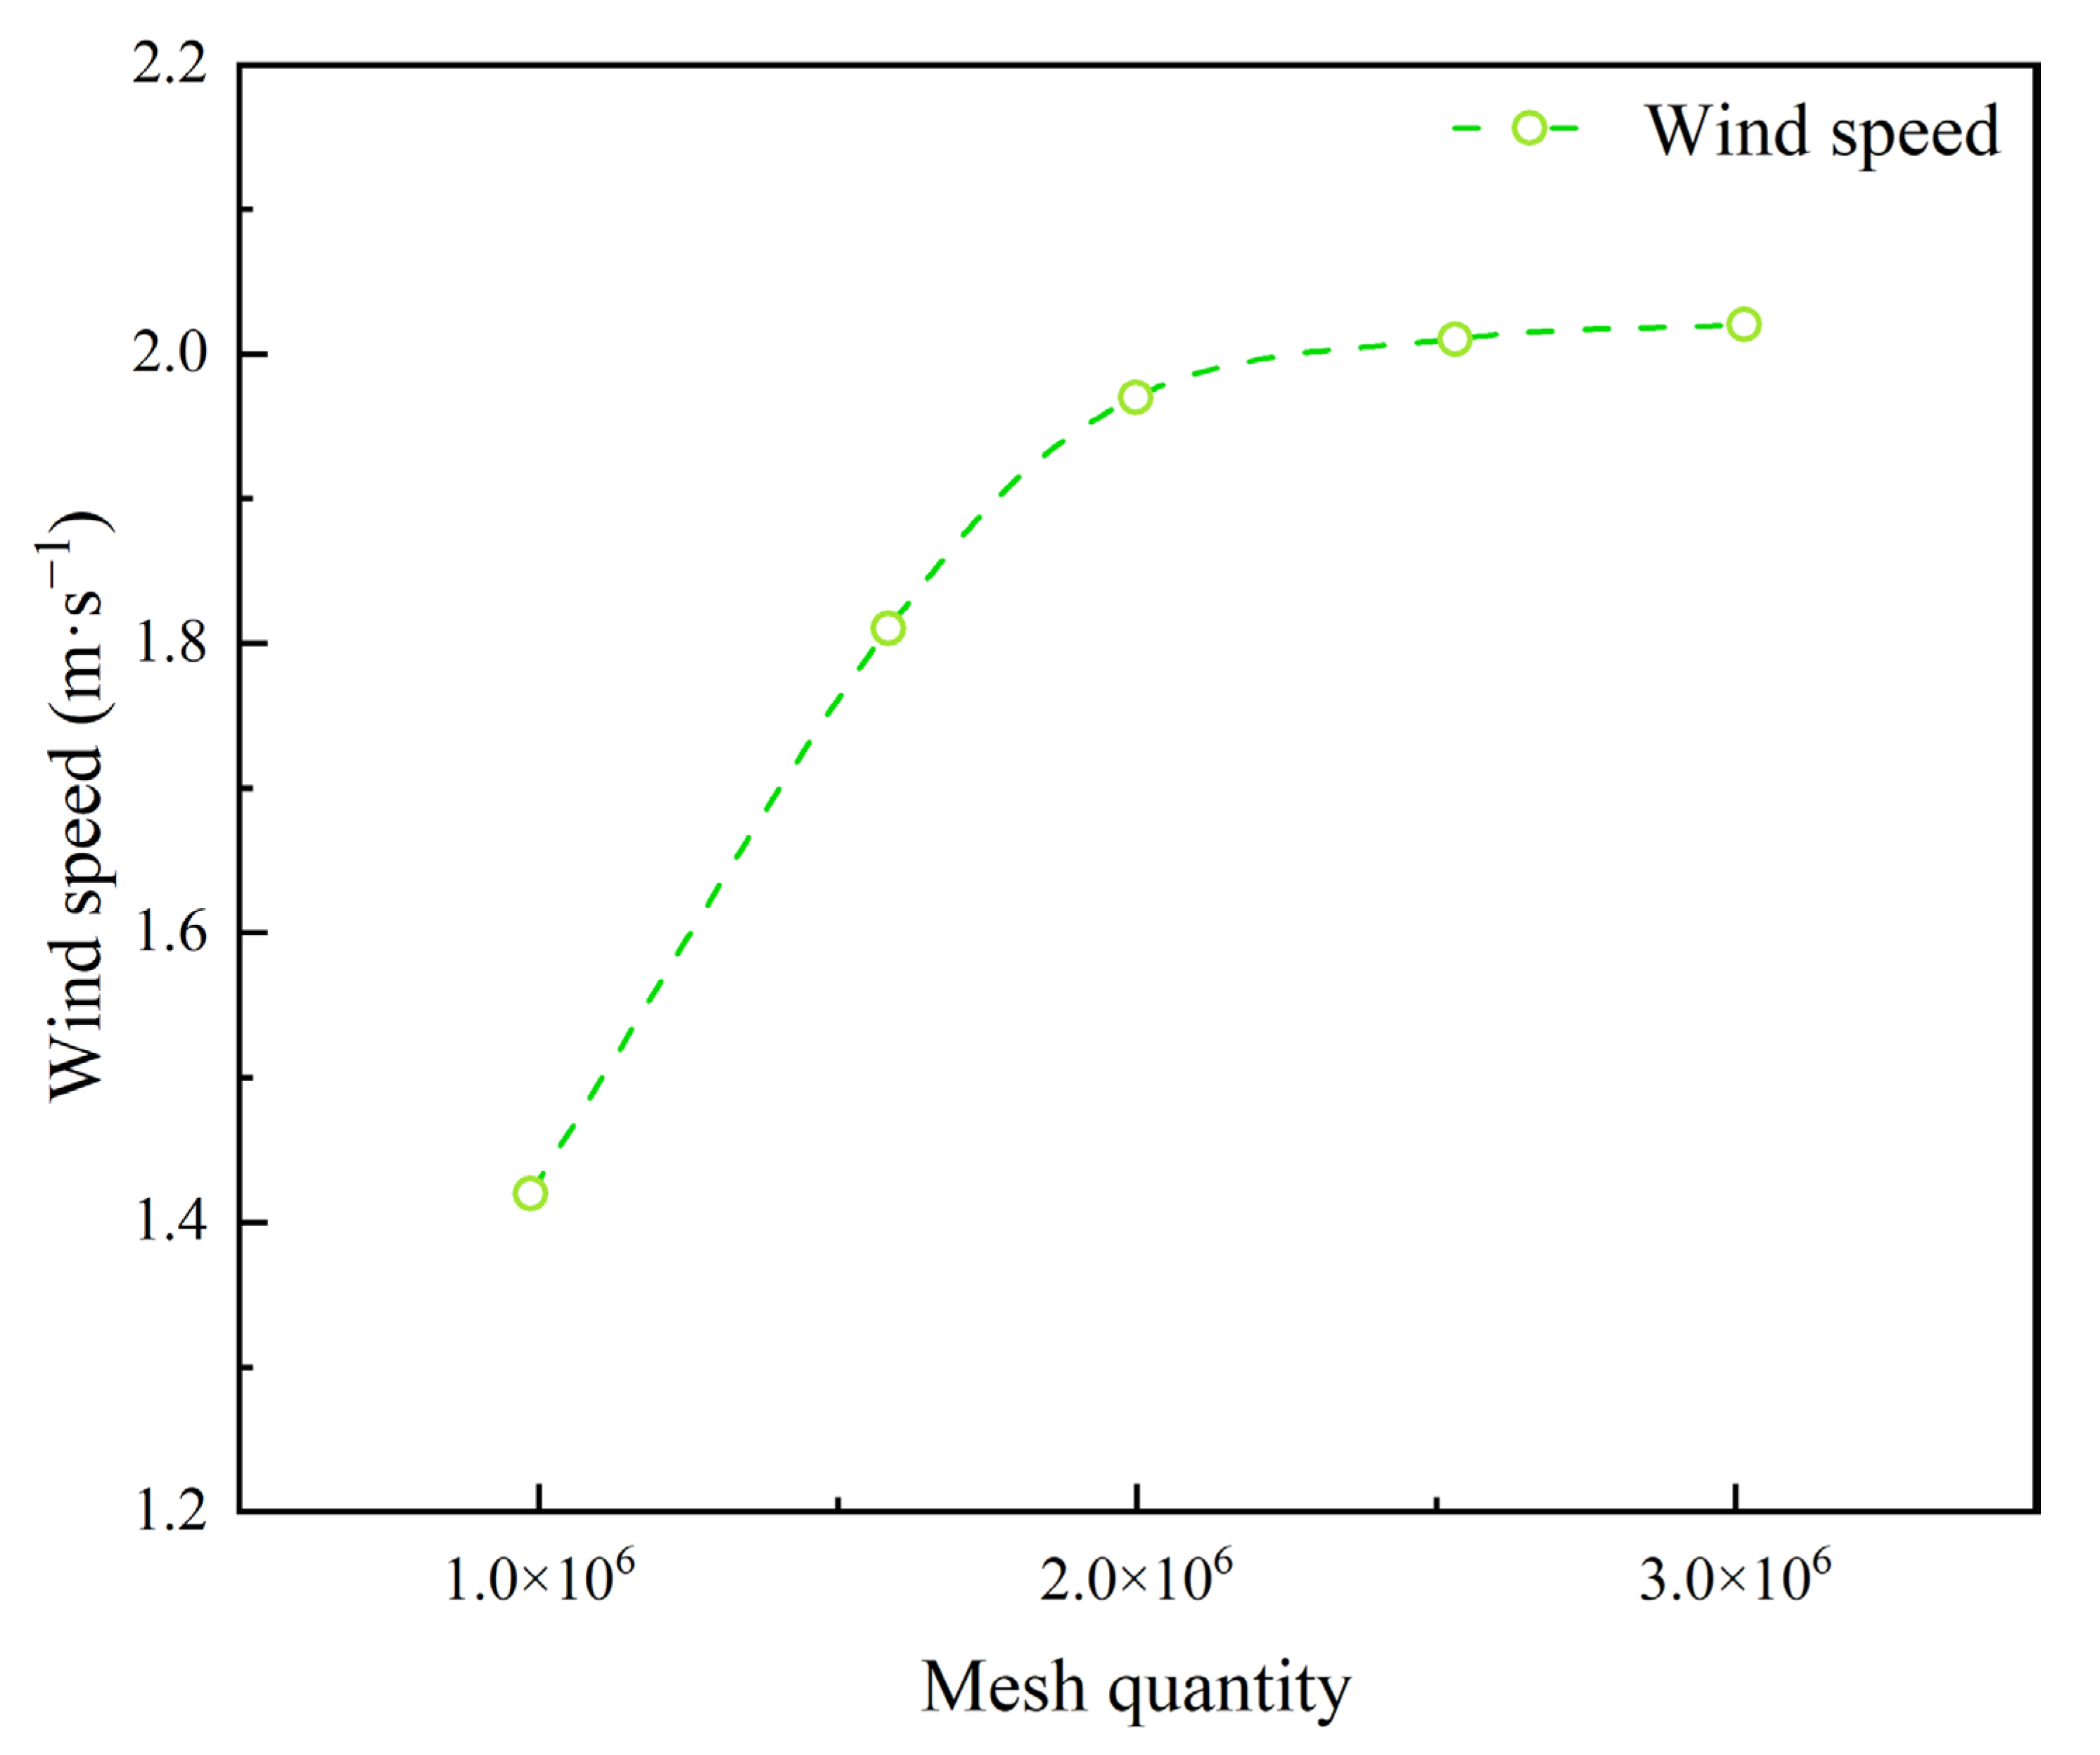
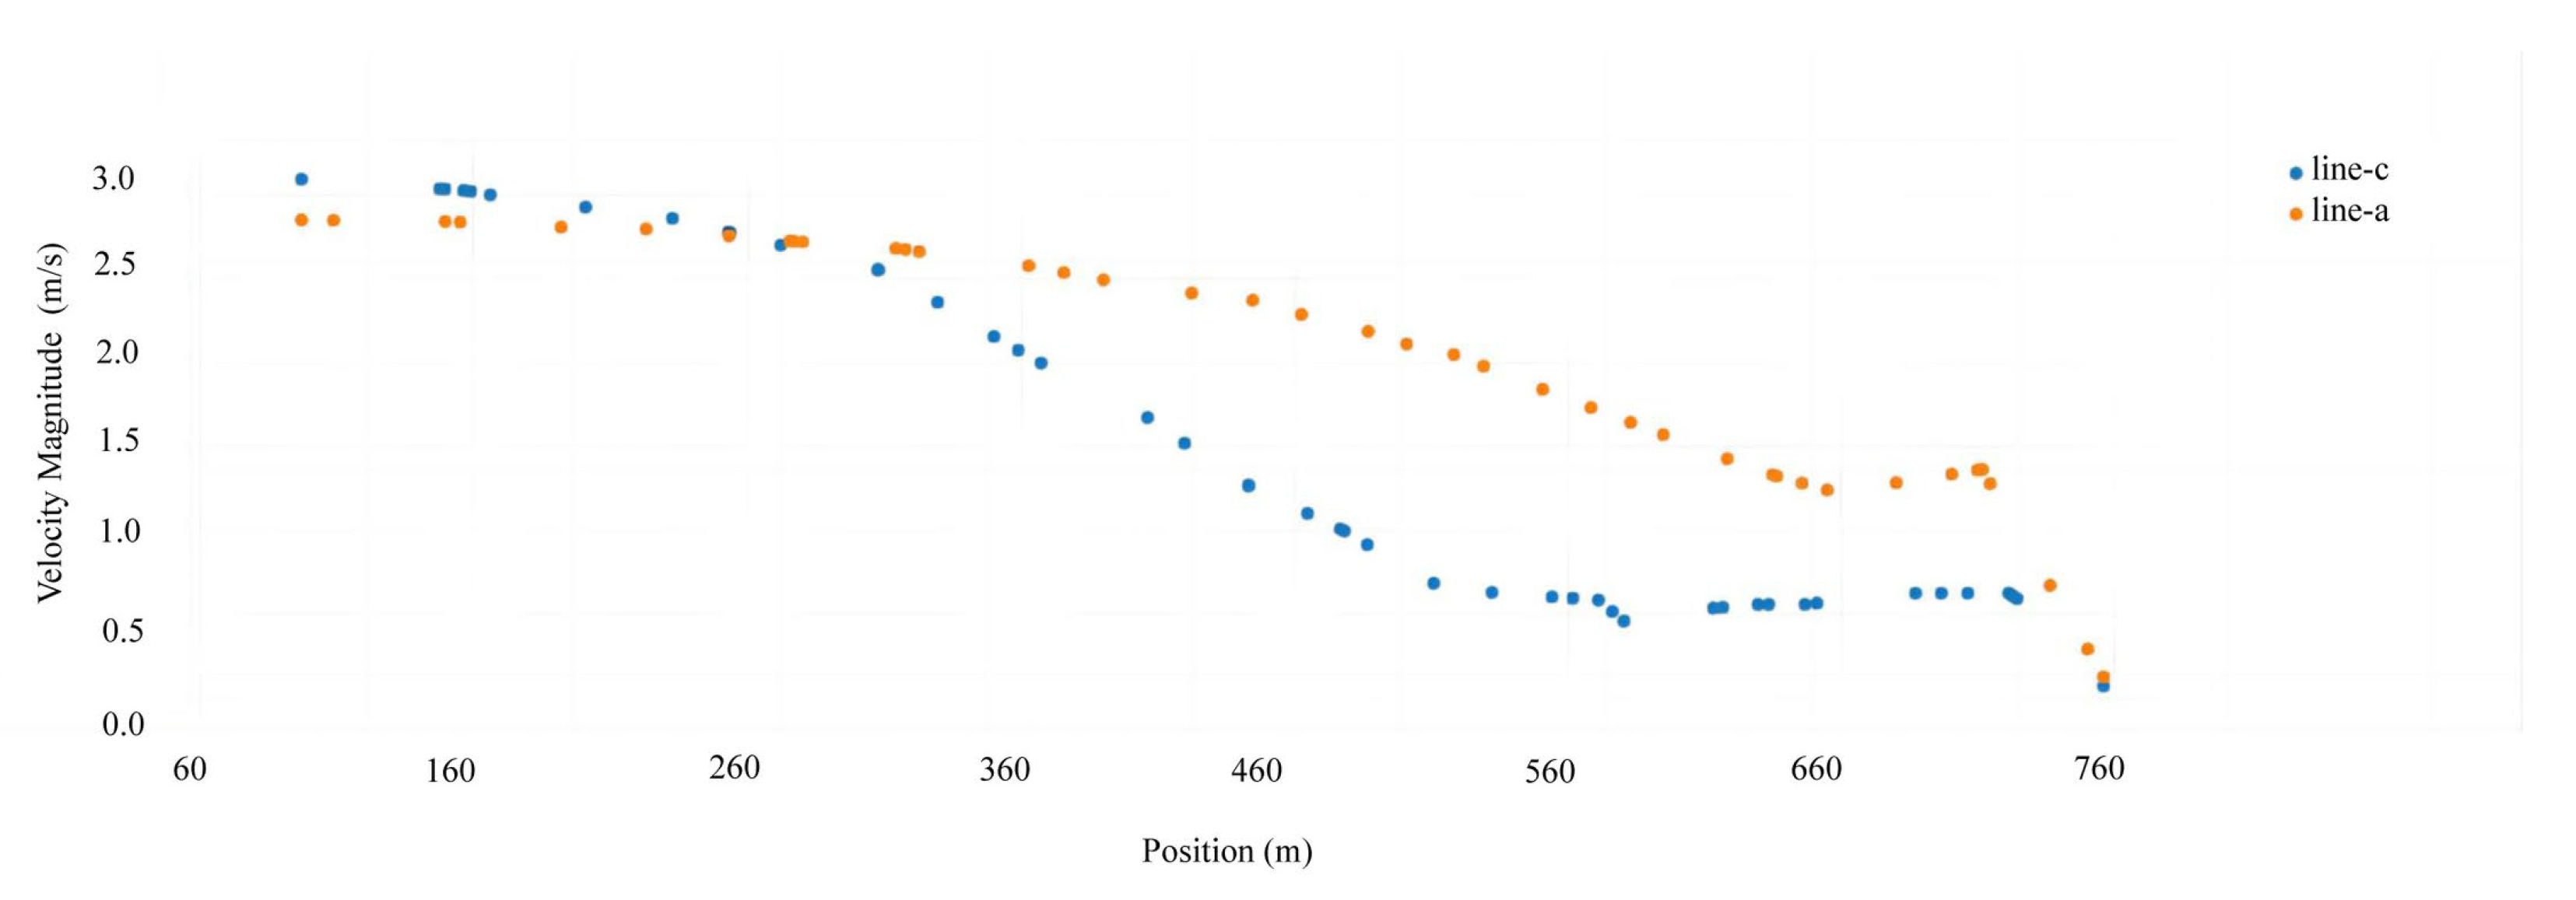
5.3. Validation of Simulation

To ensure numerical simulation result independence and eliminate mesh quality influence, a grid independence test preceded the simulation. The open-pit coal mine flow field was discretized into five mesh groups containing 986,852; 1,584,913; 1,998,231; 2,531,752 and 3,014,367 cells, respectively. A monitoring point at coordinates (0, −50, 0) was selected within the model, and wind speed at this location was measured to evaluate mesh resolution effects on simulation results. The results are shown in Figure 7. As the number of mesh elements increases, the wind speed gradually increases. When the number of mesh elements reaches 1,998,231, the fluctuation in wind speed becomes relatively small. Therefore, this mesh resolution was selected for the simulation in this study.

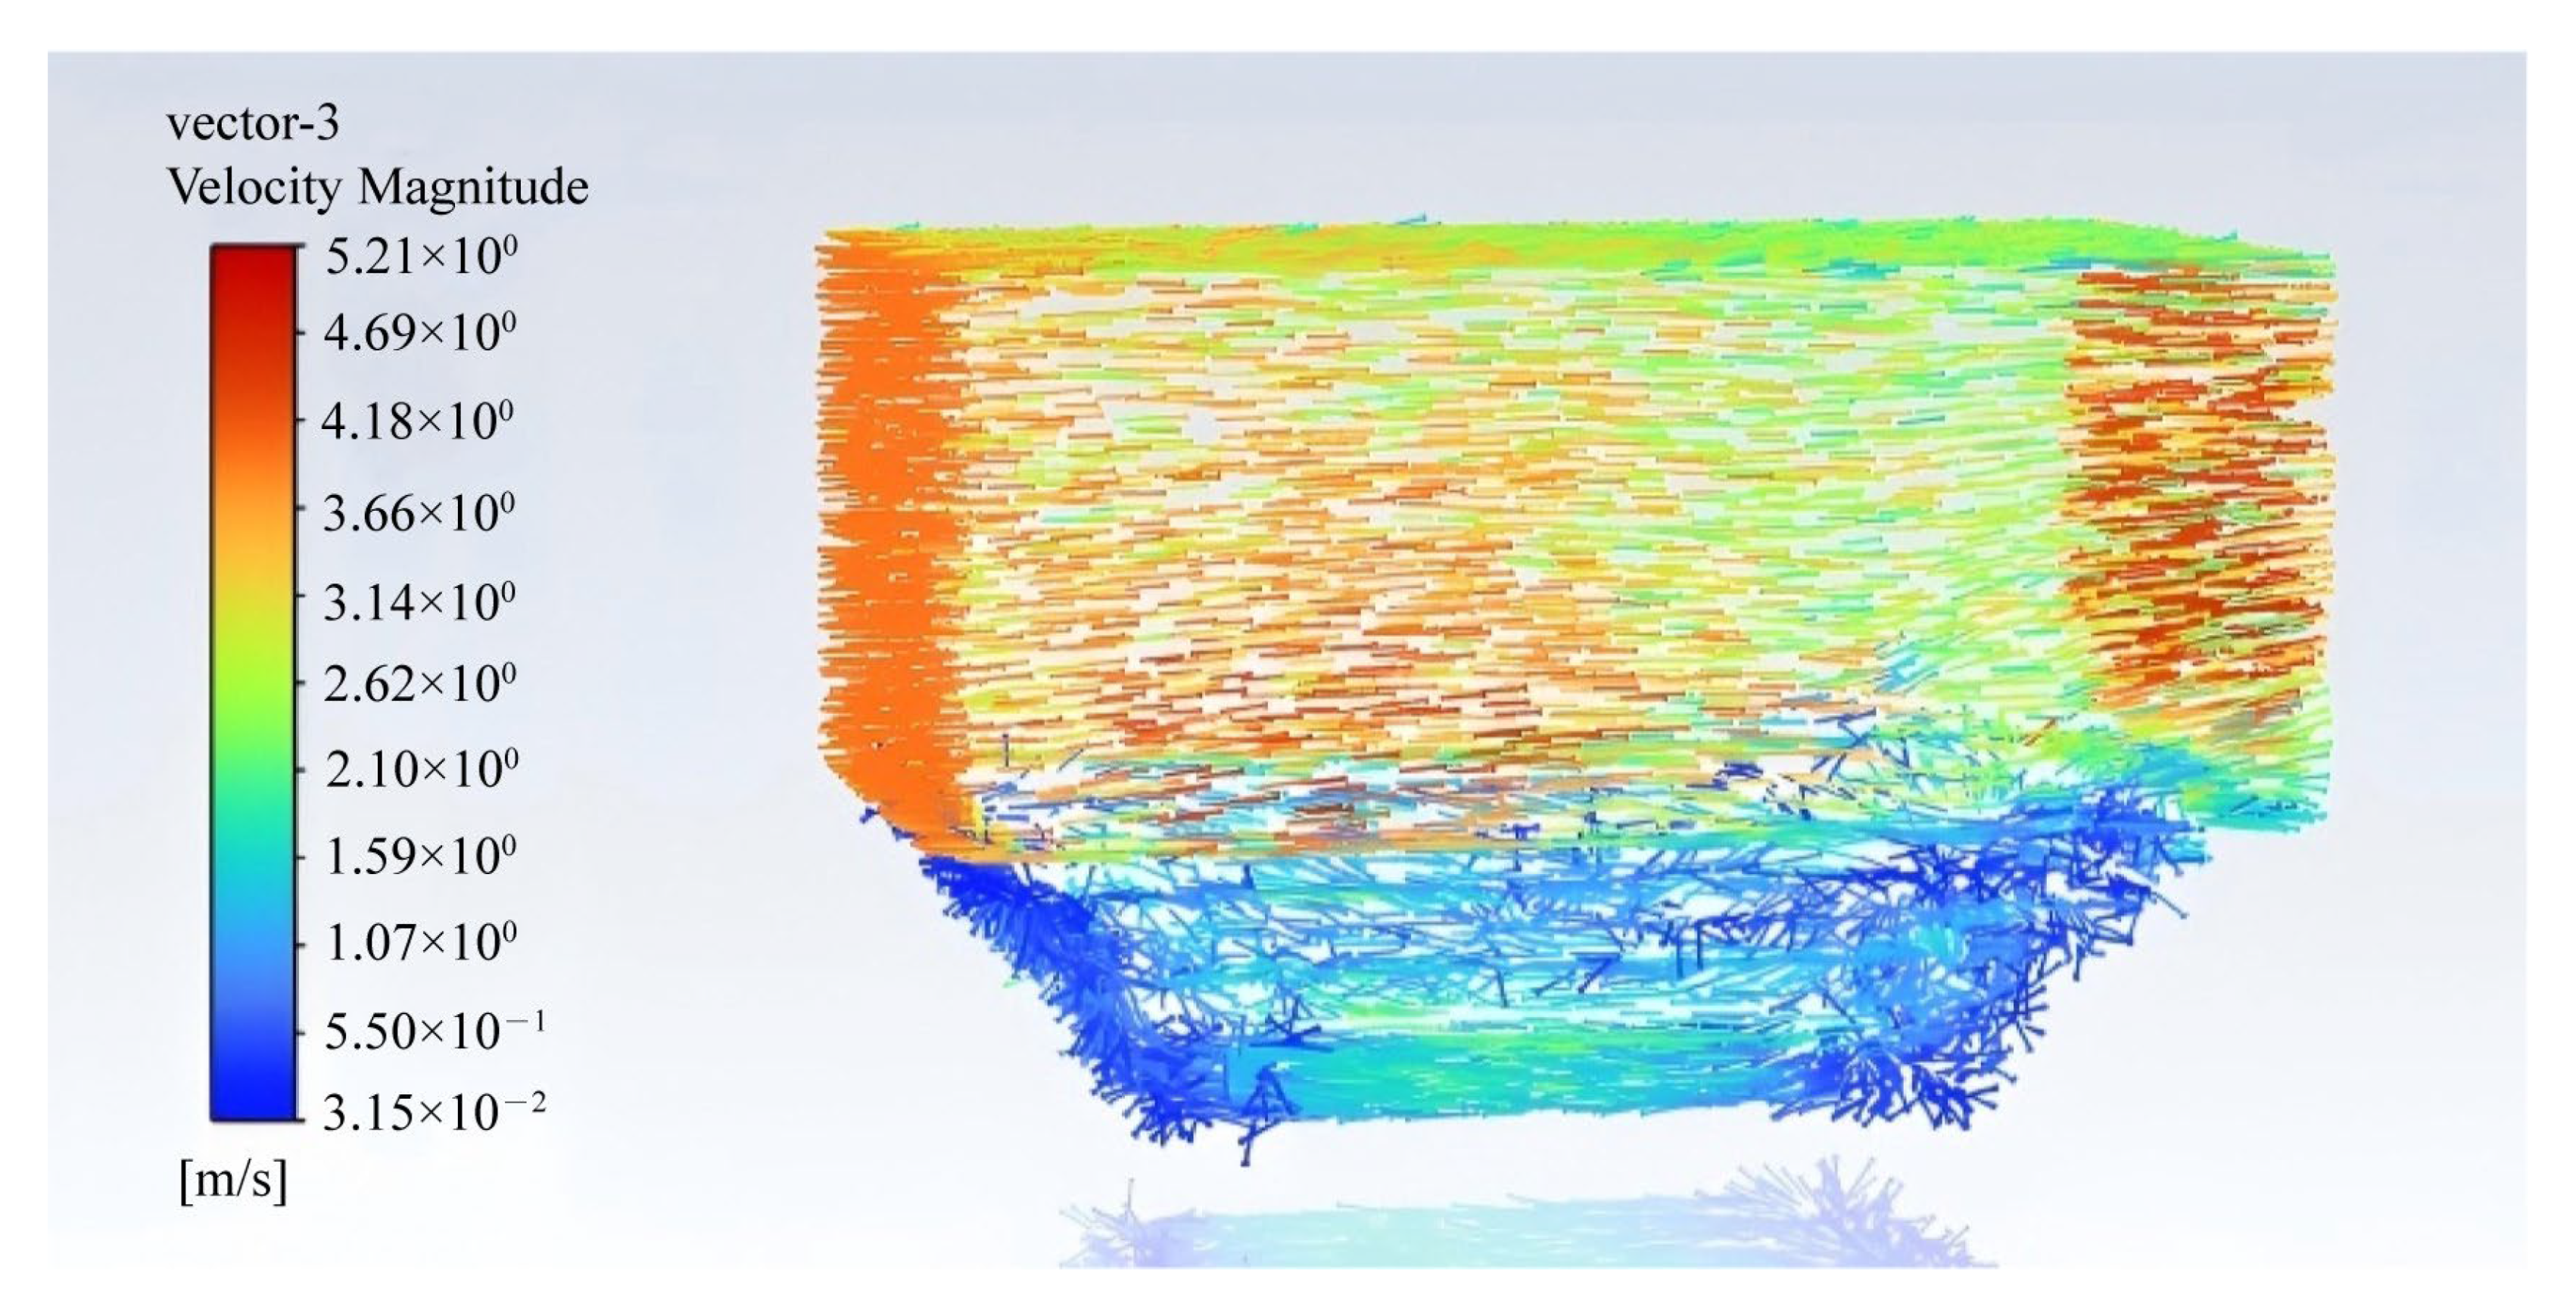
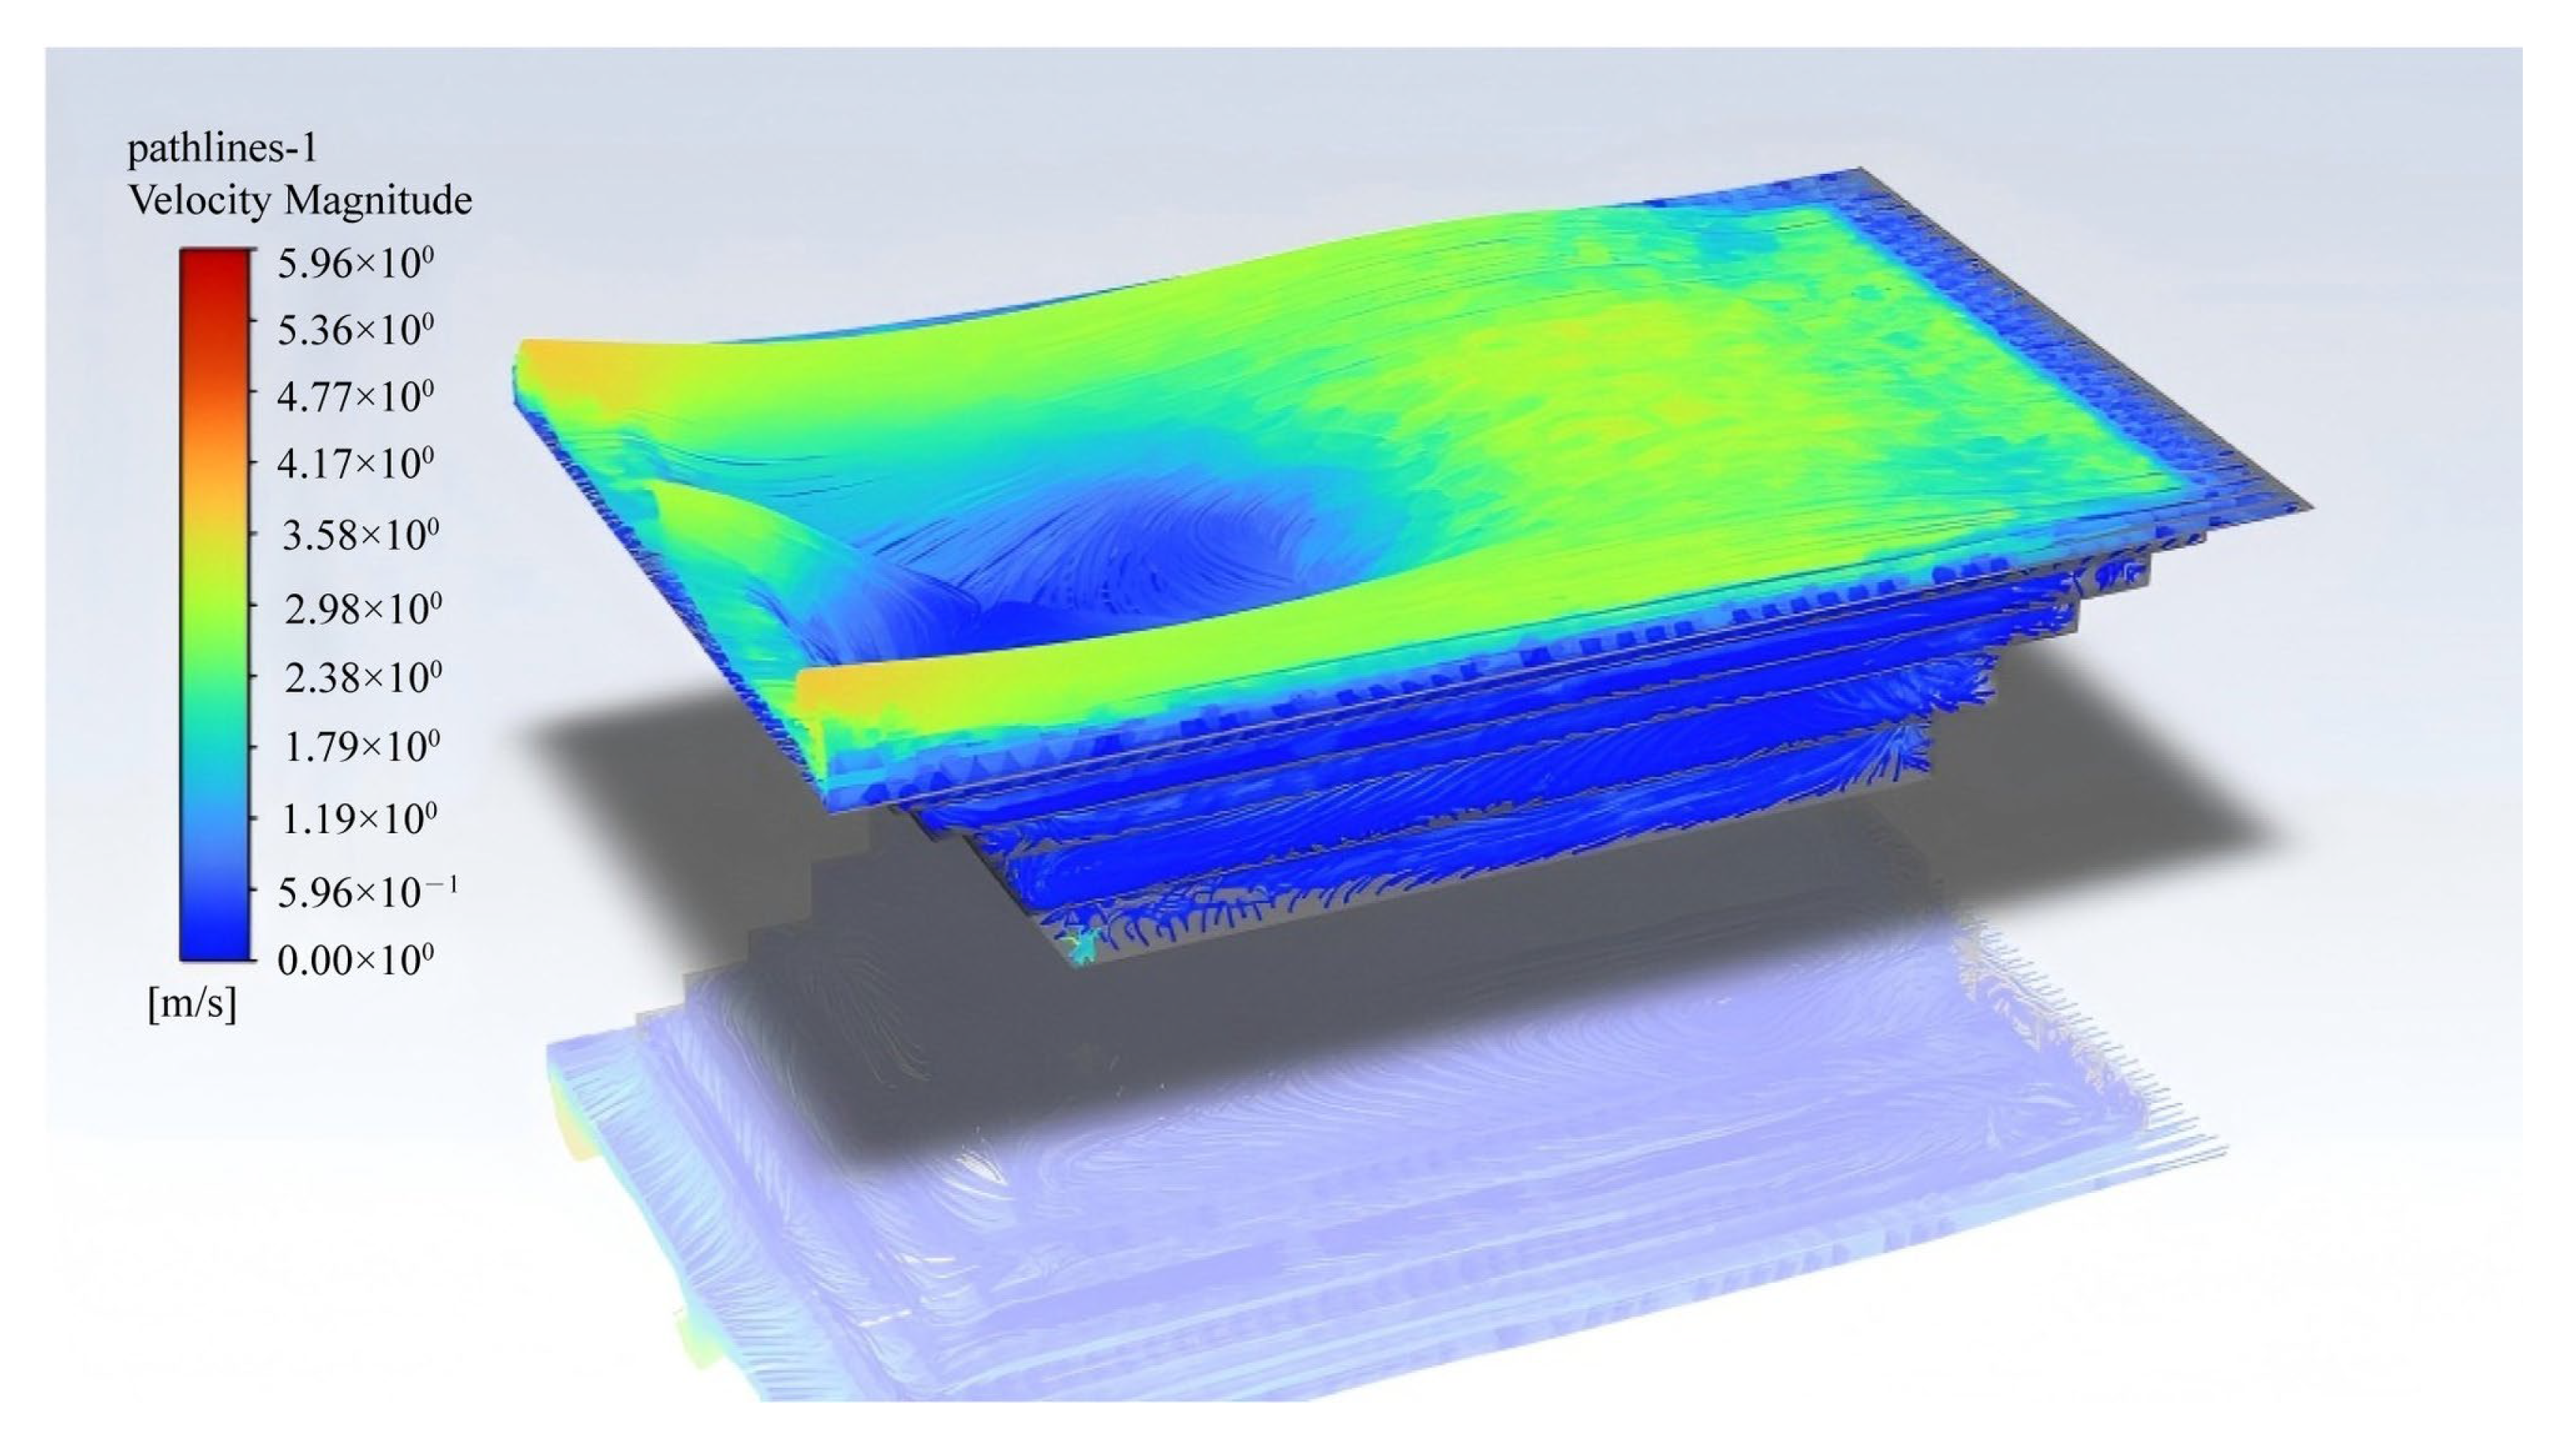
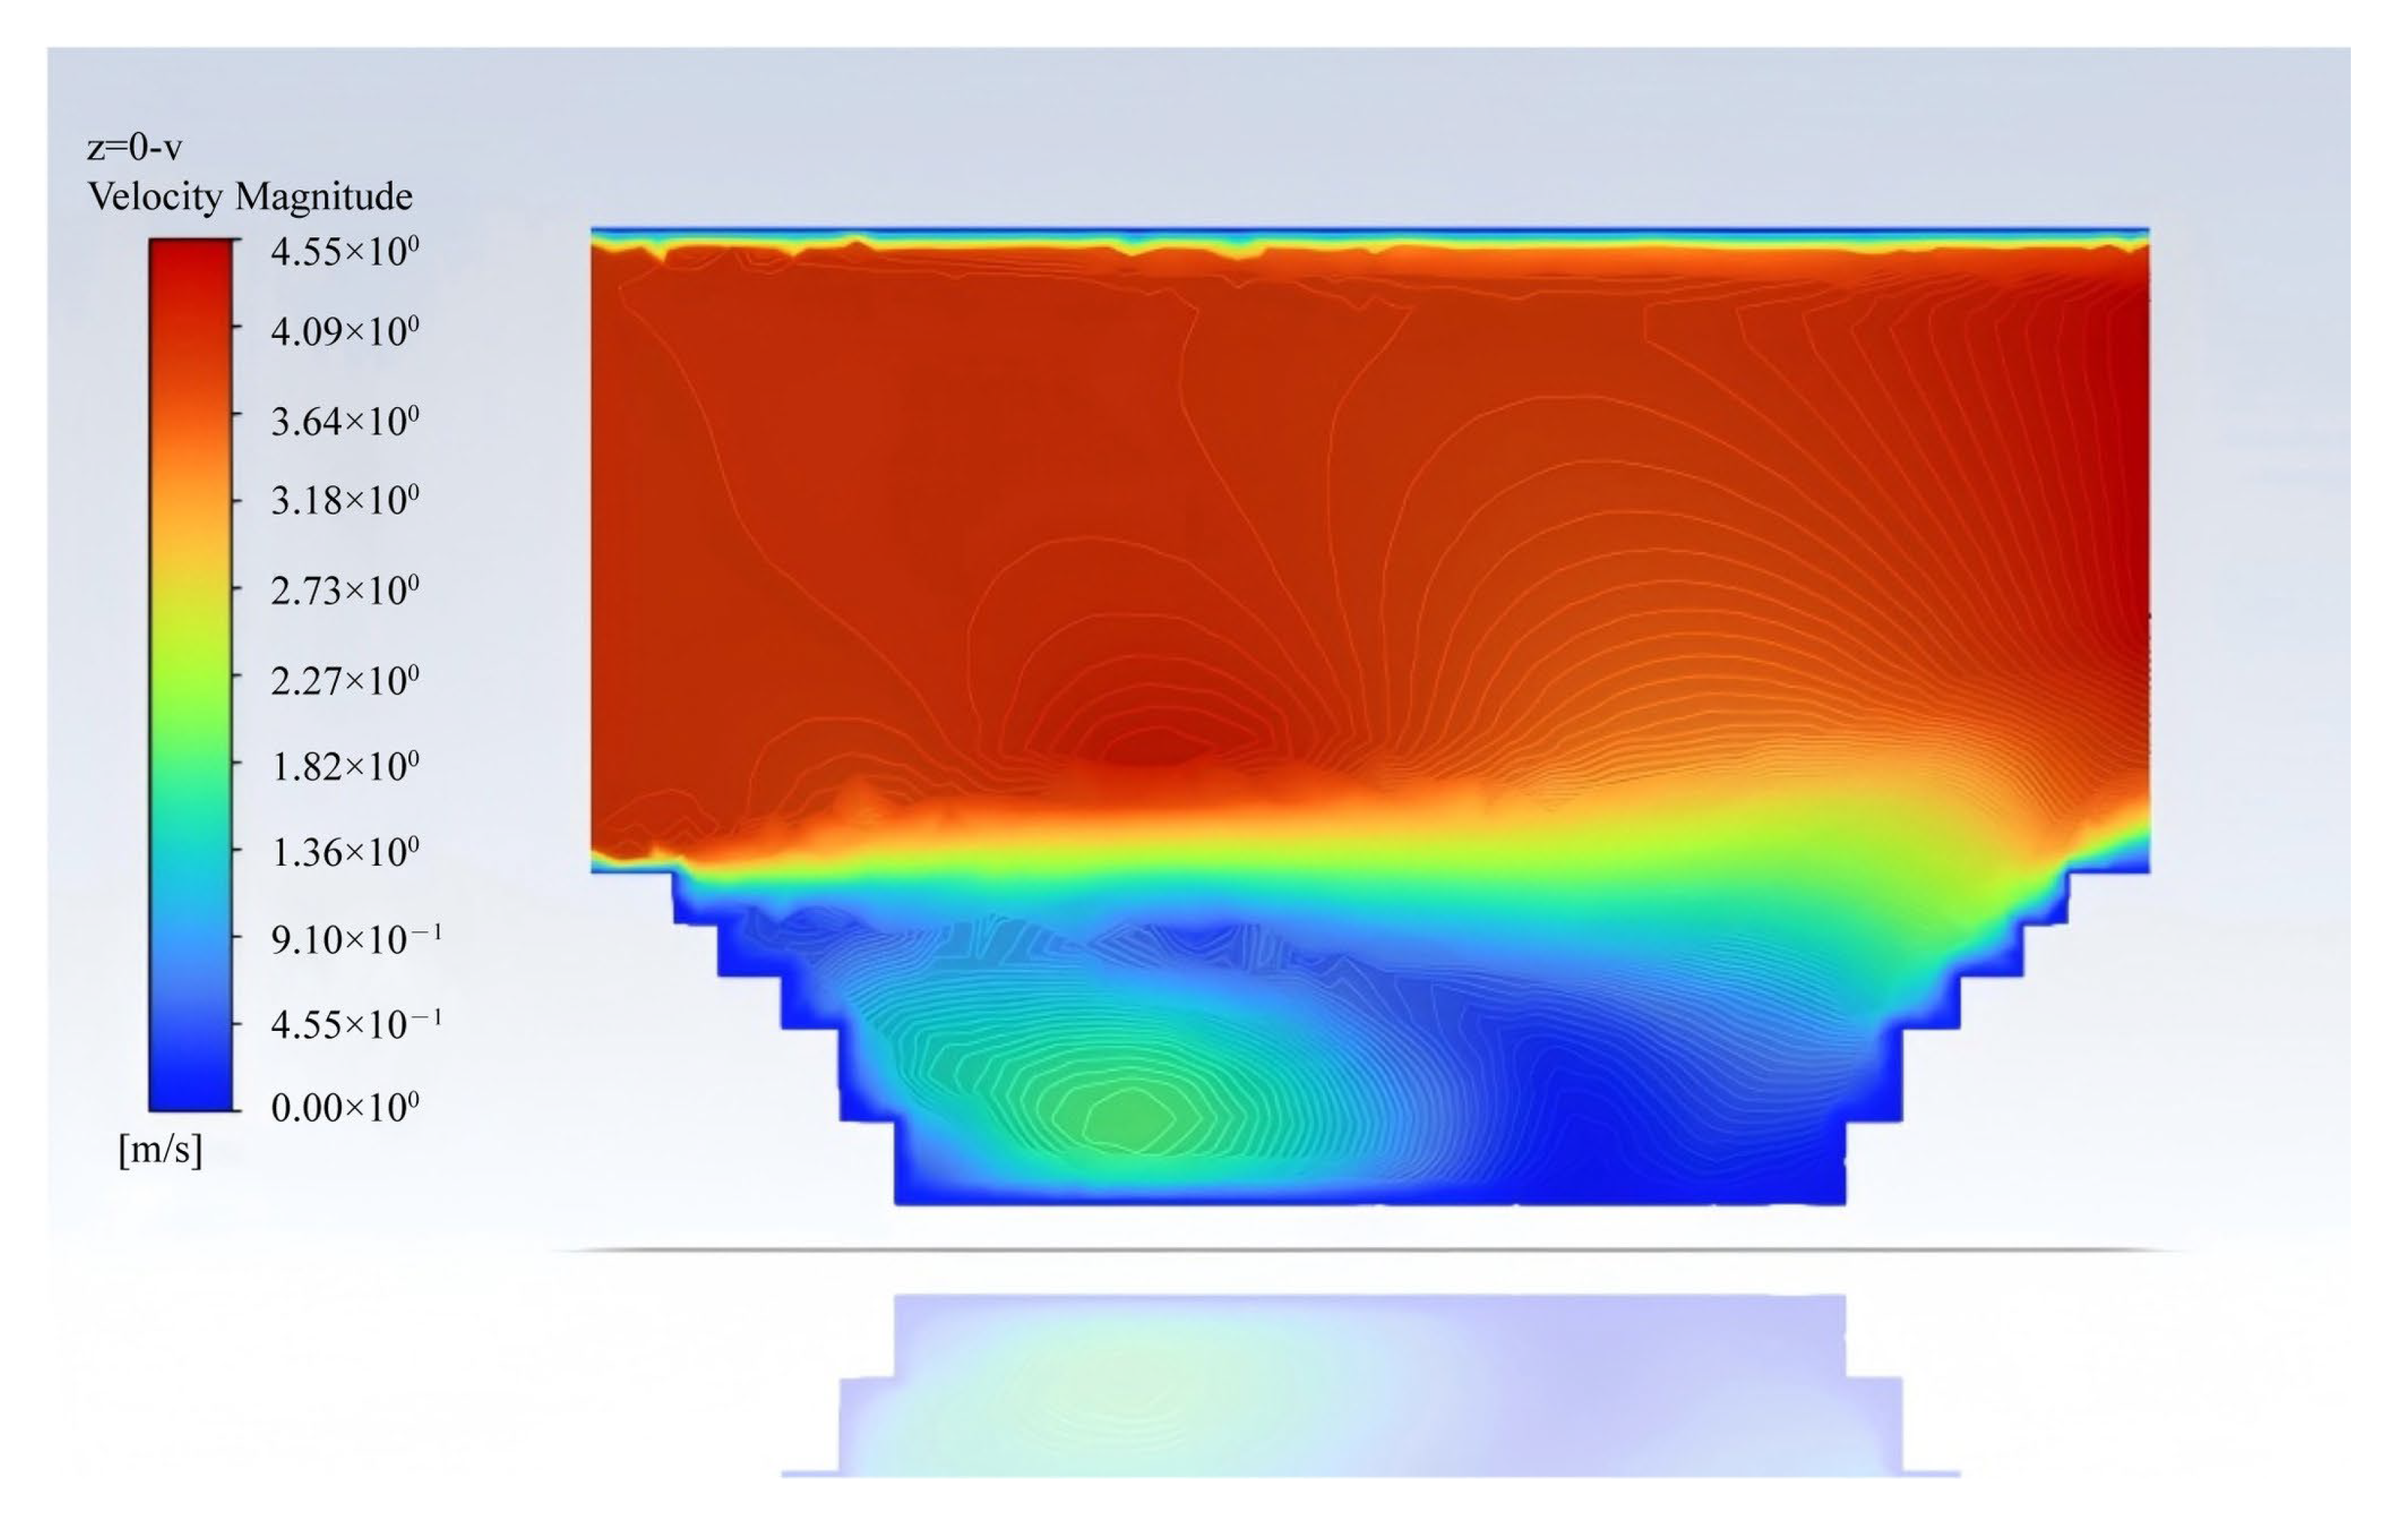
5.4. Results of Wind Intensity Variation with Depth

For this simulation, a wind speed of 4 m/s was selected, with the wind direction set to westerly. Particle trajectory tracking was conducted using CFD-Post (Available online: https://ansyshelp.ansys.com/public/account/secured?returnurl=/Views/Secured/corp/v242/en/cfd_post/cfd_post.html, accessed on 17 March 2025) software, and the resulting velocity vector trajectory diagram is illustrated in Figure 8.
Figure 8 illustrates the westerly wind velocity vector map of the pit, where arrows indicate wind direction, and their color and length represent wind speed. The velocity vector diagram reveals that the wind speed in most areas of the pit is 2 m/s, decreasing to approximately 0.5 m/s at the bottom as pit depth increases. While a small vortex appears at the deepest part of the pit, no large-scale recirculation zone is observed. Notably, a negative circulation phenomenon exists at the bottom of the mining area. The substantial distance between two points on the horizontal cross-section of the circulation center axis, combined with the large angle between the negative circulation center axis and the horizontal direction, exacerbates dust accumulation in the deeper regions of the pit.
As illustrated in Figure 9, the upper region of the pit exhibits smooth airflow patterns, creating favorable conditions for pollutant dispersion. Dust generated above the working face in this area can be directly expelled from the mine. However, as depth increases, the lower part of the direct current (DC) area, while not displaying a large recirculation zone, develops a vortex formation. This vortex impedes airflow in the lower DC area. Consequently, localized pollution becomes more pronounced in the bottom and leeward regions, indicating that dust control measures should prioritize the deeper sections of the pit.
As illustrated in Figure 10, the wind speed diminishes with increasing depth, approaching 0 m/s in the lower regions of the pit. This phenomenon creates a substantial windless zone where airflow fails to penetrate the pit’s interior.
As illustrated in Figure 11, at depths less than approximately 260 m, the wind velocity at line-a is lower than at line-c. At approximately 260 m, the wind velocities at both lines converge. Beyond 260 m depth, the wind velocity at line-a surpasses that of line-c. Initially, the wind velocity at the first valley is below 1 m/s, subsequently stabilizing around 0.5 m/s. As the depth approaches the pit bottom, the wind velocity gradually decreases to 0 m/s. This phenomenon occurs because the wind inlet is in closer proximity to line-c than line-a, resulting in higher initial wind velocities at line-c as depth increases. However, with further depth increase, wind velocity transmission becomes less effective, leading to the formation of a negative circulation. In conjunction with gravitational effects, this results in dust accumulation at the pit edge and bottom, impeding the expulsion of dust from the pit.

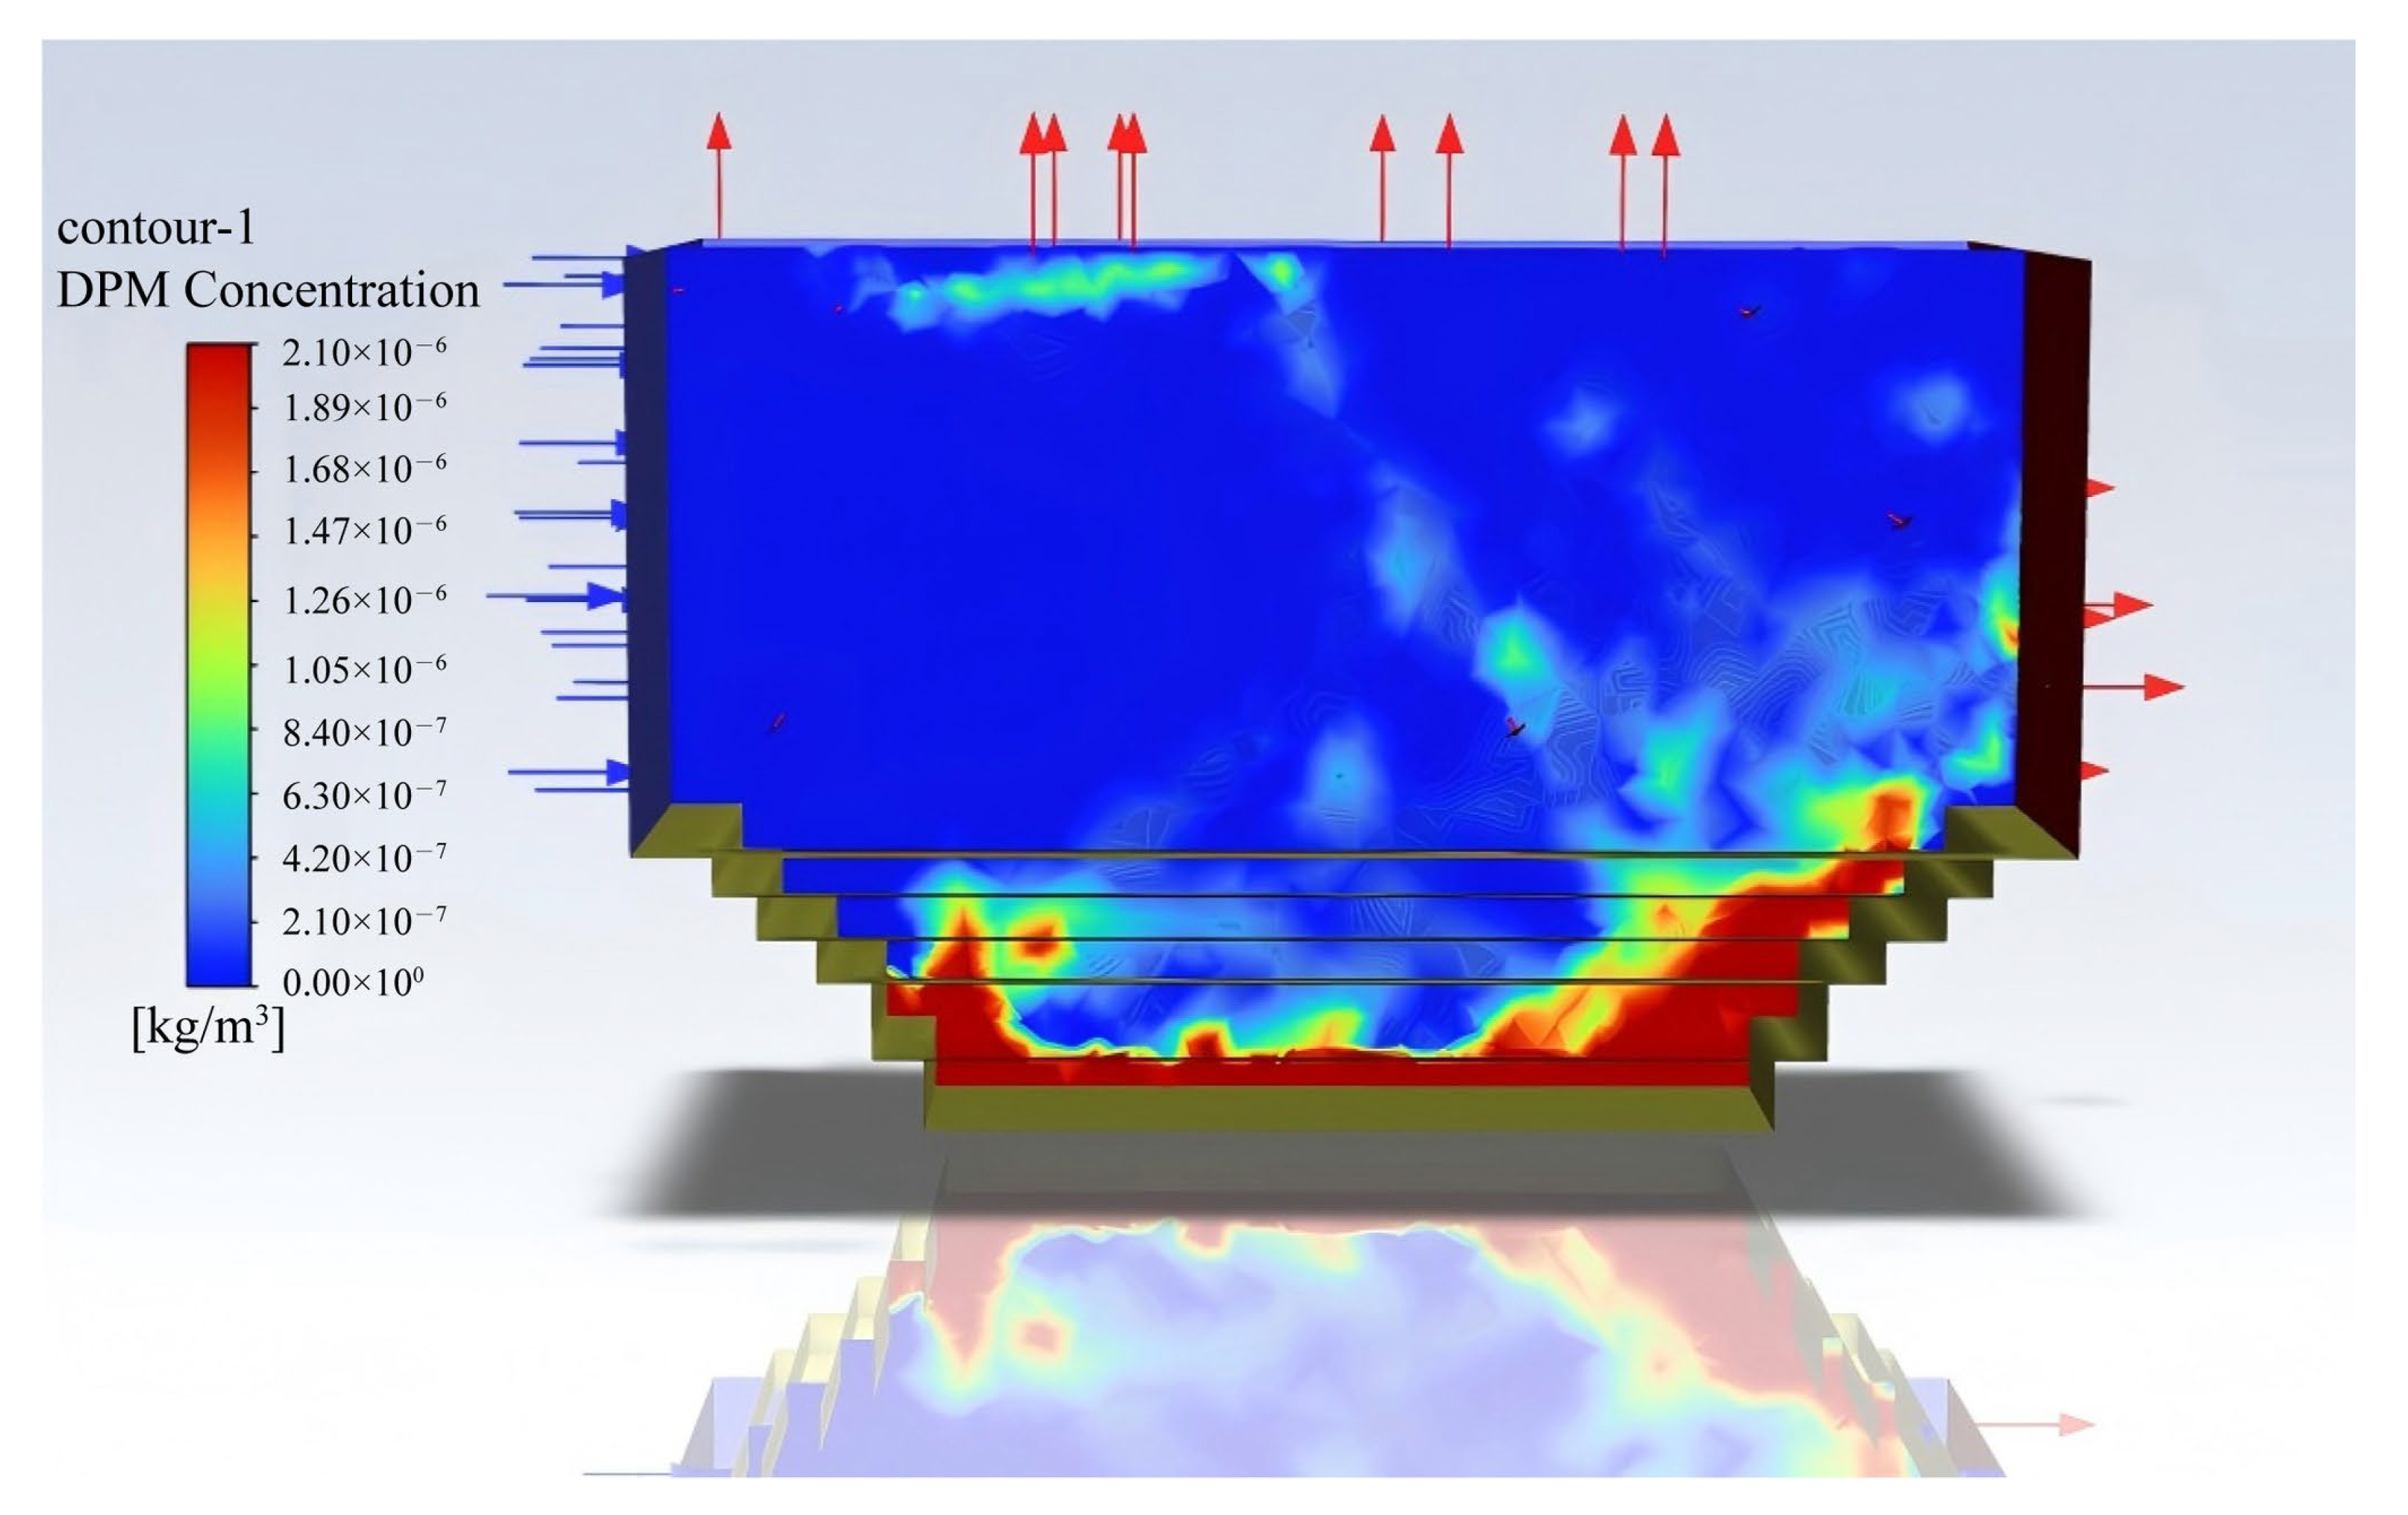
5.5. Results of the Variation in Dust Mass Concentration with Depth

The simulation employs a wind speed of 4 m/s, originating from the west. Figure 12 illustrates the dust concentration distribution cloud map of plane-a. This visualization reveals the formation of vortices within the pit, resulting in significant dust accumulation that cannot be readily expelled. Notably, the peak dust concentration substantially surpasses the maximum permissible threshold.
Figure 12 illustrates that the dust concentration on the windward side is elevated and surpasses the maximum permissible concentration. A significant accumulation of dust occurs on the windward side of the pit. Analysis of the airflow conditions within the pit reveals the formation of a complete vortex in this area, impeding dust dispersion.
As illustrated in Figure 13, the dust concentration exhibits a gradual increase with increasing depth. This phenomenon is primarily attributed to the vortex effect generated by wind direction and velocity. As depth increases, substantial dust accumulation occurs within the pit. Under the specific wind conditions of the An Tai Bao open-pit coal mine, the majority of particles concentrate at the pit bottom across various depths. This accumulation results from the vortex phenomenon at the pit base, which leads to significant dust aggregation and impedes its expulsion from the pit.

6. Discussion

Nonlinear Decay Relationship Between Airflow Intensity and Depth: As the pit depth increases, airflow intensity decreases markedly. Numerical simulations reveal that in the pit’s deep sections, terrain shielding effects generate vortices and negative circulation, impeding vertical airflow diffusion. Areas dominated by horizontal circulation exhibit diminished dust dispersion capacity.
The dust mass concentration demonstrates a positive correlation with pit depth, exhibiting an exponential growth trend. Simulation results indicate that as pit depth increases, dust dispersion distance gradually decreases, while dust concentration at the pit bottom rises. The coupling effect between particle size and depth results in smaller dust particles remaining in the vortex area for extended periods, thereby limiting their dispersion range.
Study Limitations: The conclusions are derived primarily from numerical simulation data, which are constrained by idealized model assumptions and do not fully account for factors such as dynamic mining processes and variable meteorological conditions. Future research should focus on validating and refining the model’s accuracy through the use of comprehensive, long-term in-situ monitoring data.

Author Contributions

D.T.: funding acquisition and conceptualization. X.W.: writing—original draft preparation. J.Y.: software. W.Q.: writing—review and editing and project administration. J.S.: investigation. K.Y.: validation. J.W.: data curation. All authors have read and agreed to the published version of the manuscript.

Funding

This research was funded by [National Outstanding Youth Science Fund Project of National Natural Science Foundation of China] grant number [No. 51704118], [the National Key Research and Development Program of China] grant number [No. 2018YFC0808200], [the Ministry of Emergency Management of the People’s Republic of China] grant number [No. zhishu-0013-2016AQ] and [the Central Universities Fund Support] grant number [Nos. AQ1201A and 3142015105]. And The APC was funded by [National Outstanding Youth Science Fund Project of National Natural Science Foundation of China] (No. 51704118).

Institutional Review Board Statement

Not applicable.

Informed Consent Statement

Not applicable.

Data Availability Statement

The original contributions presented in this study are included in the article. Further inquiries can be directed to the corresponding author.

Acknowledgments

This study was supported by the National Outstanding Youth Science Fund Project of National Natural Science Foundation of China (No. 51704118), the National Key Research and Development Program of China (No. 2018YFC0808200), the Ministry of Emergency Management of the People’s Republic of China (No. zhishu-0013-2016AQ), and the Central Universities Fund Support (Nos. AQ1201A and 3142015105). The funders had no role in study design, data collection and analysis, decision to publish, or preparation of the manuscript.

Conflicts of Interest

The authors declare no conflicts of interest.

References

  1. Wanjun, T.; Qingxiang, C.A.I. Dust distribution in open-pit mines based on monitoring data and fluent simulation. Environ. Monit. Assess. 2018, 190, 632. [Google Scholar] [CrossRef] [PubMed]
  2. Wu, T.; Yang, Z.; Wang, A.; Zhang, K.; Wang, B. A study on movement characteristics and distribution law of dust particles in open-pit coal mine. Sci. Rep. 2021, 11, 14703. [Google Scholar] [CrossRef] [PubMed]
  3. Zhou, W.; Cui, Y.; Wang, H.; Chen, L.; Xu, K.; Wu, C.; Ren, G. Study on the characteristics of dust diffusion during a truck travelling in an open-pit coal mine affected by the vertical wind shear. J. Hazard. Mater. 2025, 483, 136611. [Google Scholar] [CrossRef]
  4. Lal, B.; Tripathy, S.S. Prediction of dust concentration in open cast coal mine using artificial neural network. Atmos. Pollut. Res. 2012, 3, 211–218. [Google Scholar] [CrossRef]
  5. Li, L.; Zhang, R.; Sun, J.; He, Q.; Kong, L.; Liu, X. Monitoring and prediction of dust concentration in an open-pit mine using a deep-learning algorithm. J. Environ. Health Sci. Eng. 2021, 19, 401–414. [Google Scholar] [CrossRef]
  6. Du, S.; Chen, H.; Ding, X.; Liao, Z.; Lu, X. Development of Dust Emission Prediction Model for Open-Pit Mines Based on SHPB Experiment and Image Recognition Method. Atmosphere 2024, 15, 1118. [Google Scholar] [CrossRef]
  7. Trechera, P.; Moreno, T.; Córdoba, P.; Moreno, N.; Zhuang, X.; Li, B.; Li, J.; Shangguan, Y.; Dominguez, A.O.; Kelly, F.; et al. Comprehensive evaluation of potential coal mine dust emissions in an open-pit coal mine in Northwest China. Int. J. Coal Geol. 2021, 235, 103677. [Google Scholar] [CrossRef]
  8. Yan, J.; Wang, Z.; Lu, X.; Wu, Y.; Luo, H.; Liu, X. Physical and Chemical Characteristics of Explosive Dust at Large Open-Pit Coal Mines in Inner Mongolia, China and Dust Control Research. Atmosphere 2023, 14, 1678. [Google Scholar] [CrossRef]
  9. Wang, Z.; Zhou, W.; Jiskani, I.M.; Yan, J.; Luo, H. Optimizing open-pit coal mining operations: Leveraging meteorological conditions for dust removal and diffusion. Int. J. Coal Sci. Technol. 2024, 11, 54. [Google Scholar] [CrossRef]
  10. Li, G.; Hu, Z.; Wang, D.; Wang, L.; Wang, Y.; Zhao, L.; Jia, H.; Fang, K. Instability mechanisms of slope in open-pit coal mines: From physical and numerical modeling. Int. J. Min. Sci. Technol. 2024, 34, 1509–1528. [Google Scholar] [CrossRef]
  11. Rojano, R.E.; Manzano, C.A.; Toro, R.A.; Morales, R.G.E.S.; Restrepo, G.; Leiva, M.A.G. Potential local and regional impacts of particulate matter emitted from one of the world’s largest open-pit coal mines. Air Qual. Atmos. Health 2018, 11, 601–610. [Google Scholar] [CrossRef]
  12. Luo, H.; Zhou, W.; Jiskani, I.M.; Wang, Z. Analyzing characteristics of particulate matter pollution in open-pit coal mines: Implications for green mining. Energies 2021, 14, 2680. [Google Scholar] [CrossRef]
  13. Ma, J.; Zhang, R.; Li, L.; Liu, Z.; Sun, J.; Kong, L.; Liu, X. Analysis of the dust-concentration distribution law in an open-pit mine and its influencing factors. ACS Omega 2022, 7, 43609–43620. [Google Scholar] [CrossRef] [PubMed]
  14. Wang, G.; Zhou, W.; Wang, Z.; Lu, X.; Zhang, Y. Characterization and Concentration Prediction of Dust Pollution in Open-Pit Coal Mines. Atmosphere 2024, 15, 1408. [Google Scholar] [CrossRef]
  15. Deng, Y.; Wu, H.; Zhao, T.; Shi, C. Characteristics of atmospheric dustfall fluxes and particle size in an open pit coal mining area and surrounding areas. Sci. Rep. 2025, 15, 9597. [Google Scholar] [CrossRef]
  16. Zhang, J.; Han, Z.; Chen, T.; Yao, N.; Yang, X.; Chen, C.; Cai, J. A Numerical Simulation of the Coal Dust Migration Law in Directional Air Drilling in a Broken Soft Coal Seam. Processes 2024, 12, 309. [Google Scholar] [CrossRef]
  17. Hao, T.; Wang, L.; Wang, Z.; Li, F.; Jiang, W.; Jiang, S. Research on Dust Migration and Dust Deposition Rules of Breathing Zone in Fully Mechanized Mining Face. ACS Omega 2023, 8, 39143–39153. [Google Scholar] [CrossRef]
  18. Nie, W.; Jiang, C.; Sun, N.; Guo, L.; Liu, Q.; Liu, C.; Niu, W. CFD-based simulation study of dust transport law and air age in tunnel under different ventilation methods. Environ. Sci. Pollut. Res. Int. 2023, 30, 114484–114500. [Google Scholar] [CrossRef]
  19. Jing, D.; Ma, M.; Ge, S.; Zhang, T.; Meng, X.; Ren, S. Study on the dust migration law and a spray dust suppression scheme in transportation roadway. Environ. Sci. Pollut. Res. Int. 2023, 30, 59316–59326. [Google Scholar] [CrossRef]
  20. Chen, F.; Mo, J.; Ma, W. Study on the coupling migration law of airflow-respiratory dust of an 8-m high fully-mechanized mining face. Energy Explor. Exploit. 2022, 40, 1360–1381. [Google Scholar] [CrossRef]
  21. Hoomans, B.P.B. Granular Dynamics of Gas-Solid Two-Phase Flows. Ph.D. Thesis, University of Twente, Enschede, The Netherlands, 2000. [Google Scholar]
  22. Comini, G.; Del Giudice, S. A (k-ε) model of turbulent flow. Numer. Heat Transf. 1985, 8, 133–147. [Google Scholar] [CrossRef]
  23. Lacasse, D.; Turgeon, E.; Pelletier, D. On the judicious use of the k–ε model, wall functions and adaptivity. Int. J. Therm. Sci. 2004, 43, 925–938. [Google Scholar] [CrossRef]
  24. Suleimenov, I.; Bakirov, A. Prospects for Using Finite Algebraic Rings for Constructing Discrete Coordinate Systems. Symmetry 2025, 17, 410. [Google Scholar] [CrossRef]
  25. Azmy, Y.; Sartori, E.; Larsen, E.W.; Morel, J.E. Advances in discrete-ordinates methodology. In Nuclear Computational Science: A Century in Review; Springer: Berlin/Heidelberg, Germany, 2010; pp. 1–84. [Google Scholar]
Figure 1. Aerial photograph of the An Tai Bao Open-Pit Coal Mine.
Atmosphere 16 00771 g001
Figure 2. An Tai Bao open-pit mine process flow chart.
Atmosphere 16 00771 g002
Figure 3. Schematic diagram of vertical circulation.
Atmosphere 16 00771 g003
Figure 4. Schematic diagram of horizontal circulation.
Atmosphere 16 00771 g004
Figure 5. Schematic diagram of the three-dimensional mine model.
Atmosphere 16 00771 g005
Figure 6. Schematic diagram of model coordinates.
Atmosphere 16 00771 g006
Figure 7. Grid independence analysis.
Atmosphere 16 00771 g007
Figure 8. Vector diagram of westerly wind speed in the mine.
Atmosphere 16 00771 g008
Figure 9. West wind velocity trace in the mine.
Atmosphere 16 00771 g009
Figure 10. Cloud diagram depicting the distribution of westerly wind speeds in the horizontal central section a.
Atmosphere 16 00771 g010
Figure 11. Scatter plot of westerly wind variation with depth.
Atmosphere 16 00771 g011
Figure 12. Dust concentration cloud map in open pit.
Atmosphere 16 00771 g012
Figure 13. Scatter plot of dust concentration changing with increasing pit depth.
Atmosphere 16 00771 g013
Table 1. Rock stripping and mining volume at different depths in the mine.
Mine Depth/mRock Stripping Volume
/10,000 m3
Production Volume/10,000 tonsCumulative Rock Stripping Volume/10,000 m3Cumulative Mining Volume/10,000 tons
0–1305.20.05.20.0
131–26086.20.091.50.0
261–390400.84.6492.34.6
391–520707.930.41200.235.0
521–650727.482.21927.6117.3
651–780787.5156.32715.1273.6
Table 2. Import and export boundary condition types and associated parameter settings.
Boundary ConditionsParameters Setting
Turbulence Model k ε
Inlet BoundaryVelocity-Inlet
Outlet BoundaryOutflow
Pressure–Velocity CouplingSIMPLE
Scheme of Pressure InterpolationStandard
Spatial DiscretizationThe Second Order Wind
Discrete Phase ModelOpen
Injection TypeSurface
Surface OptionsScale Flow Rate by Face Area
Density1.225 kg/m3
Temperature288.16 K
Velocity4 m/s
Viscosity1.7894 × 10−5 kg/m2·s
Ratio of Specific Heats1.4
Disclaimer/Publisher’s Note: The statements, opinions and data contained in all publications are solely those of the individual author(s) and contributor(s) and not of MDPI and/or the editor(s). MDPI and/or the editor(s) disclaim responsibility for any injury to people or property resulting from any ideas, methods, instructions or products referred to in the content.

