Abstract
Ozone (O3) and fine particulate matter (PM2.5) are critical atmospheric pollutants whose complex chemical coupling presents significant challenges for multi-pollutant control strategies. This study investigated the spatiotemporal variations and driving mechanisms of O3 and PM2.5 in Jiaxing, China, during different COVID-19 lockdown periods from November 2019 to January 2024. Using high-resolution monitoring data, random forest modeling, and HYSPLIT backward trajectory analysis, we quantified the relative contributions of anthropogenic emissions, meteorological conditions, and regional transport to the formation and variation of O3 and PM2.5 concentrations. The results revealed a distinct inverse relationship between O3 and PM2.5, with meteorologically normalized PM2.5 decreasing significantly (−5.0 μg/m3 compared to the pre-lockdown baseline of 0.6 μg/m3), while O3 increased substantially (15.2 μg/m3 compared to the baseline of 5.3 μg/m3). Partial dependency analysis revealed that PM2.5-O3 relationships evolved from linear to non-linear patterns across lockdown periods, while NO2-O3 interactions indicated shifts from VOC-limited to NOx-limited regimes. Regional transport patterns exhibited significant temporal variations, with source regions shifting from predominantly northern areas pre-lockdown to more diverse directional contributions afterward. Notably, the partial lockdown period demonstrated the most balanced pollution control outcomes, maintaining reduced PM2.5 levels while avoiding O3 increases. These findings provide critical insights for developing targeted multi-pollutant control strategies in the Yangtze River Delta region and similar urban environments.
1. Introduction
Surface ozone (O3) and fine particulate matter (PM2.5) represent two critical pollutants affecting urban air quality and public health, with significant implications for human health and climate [1,2]. Epidemiological studies confirm that prolonged O3 exposure can increase respiratory disease incidence and cardiovascular mortality [3,4], while PM2.5 is associated with approximately 4.2 million excess deaths annually worldwide [5]. Beyond health impacts, O3 acts as a greenhouse gas contributing to global warming [6]. O3 significantly damages vegetation by impairing photosynthesis and reducing carbon fixation rates, affecting substantial portions of global forest areas [7]. Under climate change scenarios, drought conditions can further alter O3 deposition pathways in ecosystems, creating concerning feedback loops between climate stressors and atmospheric pollution [8]. These pollutants exhibit complex chemical coupling whereby PM2.5 precursors (e.g., NOx, VOCs) participate in photochemical O3 formation, and concurrently, the strong oxidative properties of O3 promote secondary organic aerosol (SOA) formation [9,10]. This synergistic relationship complicates pollution control strategies, as exemplified by NOx reduction potentially increasing O3 concentrations under specific conditions due to enhanced atmospheric oxidation capacity.
The COVID-19 lockdown measures during 2020—2022 provided an unprecedented “natural experiment” for studying atmospheric pollution evolution under extreme emission reduction scenarios. Observations across global cities revealed significant decreases in primary PM2.5 due to reduced transportation and industrial activities, yet surface O3 concentrations paradoxically increased [11,12,13]. This inverse relationship highlights the complexity of compound pollution management. However, existing research has primarily focused on single-pollutant attribution analyses without elucidating how meteorological conditions, abrupt emission structure changes, and regional transport collectively drive O3-PM2.5 co-variation. For instance, Shi et al. (2021) attributed PM2.5 reduction in eastern China during the lockdown primarily to industrial emission reductions, while explanations for O3 increases remain controversial [14]. Liu et al. (2022) found that NOx and VOC reductions exhibited significant regional differences in their impact on O3, identifying precursor saturation levels and meteorological conditions as key factors controlling short-term O3 fluctuations [15].
Air pollution management relies on diverse modeling approaches to understand pollutant dynamics and inform control strategies. Chemical transport models (CTMs) such as CMAQ, CAMx, and WRF-Chem integrate emissions inventories, meteorological inputs, and chemical mechanisms to simulate atmospheric processes [16,17,18]. These models offer comprehensive physical–chemical representations of pollutant formation, transport, and removal pathways. Regional-scale CTMs have been widely applied to evaluate emission reduction scenarios and support regulatory decisions in the Yangtze River Delta region [19,20]. Meanwhile, receptor models, including Positive Matrix Factorization (PMF) and Chemical Mass Balance (CMB), provide complementary insights by statistically apportioning observed pollution to potential sources based on chemical composition data [21,22].
Statistical methods such as multiple linear regression, principal component analysis (PCA), and generalized additive models (GAMs) have been widely applied in air quality analysis. These approaches play a crucial role in identifying relationships between influencing factors and air pollutant variations, contributing to meteorological normalization and trend analysis [23,24]. However, when addressing special circumstances, such as the COVID-19 lockdown period, traditional methods may face certain challenges. For instance, CTMs require more refined adjustments when emission inventories change dramatically, while conventional statistical methods may need additional mathematical transformations when dealing with highly non-linear pollutant interactions. This has prompted researchers to explore complementary approaches to enhance analytical capabilities.
Machine learning methods have provided new perspectives for air pollution analysis in recent years, particularly for studying multi-pollutant interactions in complex scenarios. These data-driven approaches can identify key driving factors and visualize variable relationships through feature importance ranking and partial dependence analysis. Techniques such as random forest, support vector machines (SVMs), and artificial neural networks (ANNs) can learn patterns from observational data, offering supplementary insights for pollution prediction and source attribution [25,26]. For example, Lyu et al. (2023) employed random forest modeling to determine that the 35.9% NH3 concentration reduction in Beijing during the pandemic was primarily attributable to emission reductions and rapid NH3 to NH4+ conversion [27]. Zhou et al. (2023) used machine learning to decouple meteorological influences, revealing that the 2021 haze rebound in Beijing resulted mainly from unfavorable meteorological conditions and secondary aerosol formation [28]. However, no studies have applied these techniques to multi-pollutant analyses across different lockdown periods.
The Yangtze River Delta region, a focal point of the “blue sky action” in China, faces significant challenges in O3-PM2.5 co-control. In this context, this study examines Jiaxing City in Zhejiang Province, eastern China, integrating high-temporal-resolution pollution monitoring data, ground meteorological observations, and HYSPLIT backward trajectory modeling from 2019 to 2023. We aim to elucidate how O3 and PM2.5 spatiotemporal patterns deviated from historical trends during lockdown periods, quantify the actual effects of anthropogenic emission reductions after meteorological normalization, and determine whether regional transport potential changed due to lockdown measures. This research provides case support for atmospheric pollution emergency management during public health crises while offering new insights for optimizing long-term “pollution reduction and carbon mitigation” strategies in the Yangtze River Delta region.
2. Materials and Methods
2.1. Study Area and Data Acquisition
This study focuses on Jiaxing (30.21–31.02° N, 120.18–121.16° E, Figure S1), an important industrial–agricultural composite city in the Yangtze River Delta region. Analysis was conducted using pollutant observation data from Qinghe Elementary School and Jiaxing College national environmental monitoring stations from 1 November 2019 to 31 January 2024. Pollutant data were sourced from the China National Environmental Monitoring Center (http://www.cnemc.cn/sssj/) and third-party platforms (https://quotsoft.net/air/) (last accessed: 10 October 2024). Meteorological data were obtained from the ERA5 hourly reanalysis database (https://cds.climate.copernicus.eu/datasets/reanalysis-era5-single-levels?tab=download) (last accessed: 16 October 2024). All pollutant observation data and meteorological data are based on hourly averages. Before analysis, we conducted a comprehensive quality assessment of the data. Missing values in pollutant concentration data were identified and removed from the dataset to maintain the integrity of the analysis. Data points were considered outliers and excluded from the analysis if they exceeded 3 standard deviations from the mean or fell outside physically reasonable ranges for each parameter (e.g., negative values for pollutant concentrations). All data processing procedures were implemented using R (version 4.3.0), primarily relying on the tidyverse package (version 2.0.0) for data cleaning, transformation, and visualization. Backward trajectory air mass data were acquired from the Air Resources Laboratory of the National Oceanic and Atmospheric Administration (https://www.ready.noaa.gov/data/archives/gdas1/) (last accessed: 25 September 2024). To investigate O3 and PM2.5 pollution across different periods, we categorized pollutant concentration data from November 2019 to January 2020, February to April 2020, November 2021 to January 2022, and November 2023 to January 2024 into four distinct periods: pre-lockdown, strict lockdown, partial lockdown, and post-lockdown.
2.2. Machine Learning and Backward Trajectory Models
2.2.1. Machine Learning Model Construction and Hyperparameter Optimization
This study employed random forest regression models to predict the influence of meteorological factors and pollutants on O3 and PM2.5. Random forest regression is an ensemble method based on bootstrap aggregation that generates multiple training sets through sampling with replacement and uses these sets to train multiple decision trees [29]. This approach combines the predictions from numerous diverse decision trees to produce a more accurate and stable result than any single tree could provide. The strength of random forest lies in its ability to reduce overfitting through randomization while capturing complex non-linear relationships in environmental data. Each tree in the forest is constructed using a different subset of training data, and at each node split, only a random subset of features is considered, creating diversity among the trees and enhancing the robustness of the model to noise and outliers. The prediction of the random forest model can be expressed as follows:
where is the predicted value, is the number of trees in the forest, and represents the prediction of the th decision tree for input feature vector , and the final prediction is the average of all individual tree predictions. Each decision tree is constructed using a bootstrap sample from the original training data and a random subset of features at each split to ensure diversity among trees.
For this study, random forest was particularly suitable due to its robust performance with complex environmental data while requiring minimal preprocessing [30,31]. The method offers strong interpretability through feature importance metrics and partial dependence plots, enabling us to examine the relationships between pollutants and their influencing factors in detail. This interpretability is essential for our research objective of not only predicting pollution levels but also understanding the underlying mechanisms driving O3 and PM2.5 variations during lockdown periods. Additionally, random forest demonstrates excellent resistance to overfitting with limited sample sizes, which is beneficial for analyzing specific lockdown timeframes [32]. Previous atmospheric pollution studies have also validated the effectiveness of this approach for similar analytical tasks [33,34,35].
For O3 prediction, CO, NO2, PM2.5, relative humidity, temperature, and U/V components were used as input variables; for PM2.5 prediction, CO, NO2, O3, relative humidity, temperature, and U/V component served as inputs. All models were divided into training (12,320 data points) and testing sets (5280 data points) at a 7:3 ratio. Hyperparameters such as the number of decision trees (ntree) and the number of variables randomly sampled at each split (mtry) were optimized through grid search combined with 10-fold cross-validation [36]. Model performance was evaluated on test data using the coefficient of determination (R2), mean absolute error (MAE), and root mean square error (RMSE). The R2, MAE, and RMSE were calculated using the following formulas:
where denotes the total number of data points. is the index of the data point. , , and represent the observed value, predicted value, and the average of the observed values of the pollutant for each data point (μg m−3), respectively [37,38].
The optimal model was selected based on these performance metrics for final analysis (see Supplementary Materials Section S1). All analyses were performed using the “tidymodels” package in R [39].
2.2.2. Pollution Source Potential Analysis
Backward trajectory analyses were conducted using the HYSPLIT model for four time periods: November 2019 to January 2020, February to April 2020, November 2021 to January 2022, and November 2023 to January 2024. These analyses were performed in TrajStat software (v1.2) [40]. Trajectories were calculated hourly based on HYSPLIT meteorological data with a 72 h backward tracking period at a height of 20 m. Our results incorporated 348 backward transport trajectories across these four periods, which formed the basis for calculating pollution source potential.
Pollution source potential was determined using the concentration-weighted trajectory (CWT) method. CWT assesses the contribution of transport grid source regions to receptor points by calculating the weighted concentration of each backward trajectory [41,42]. The calculation formula is as follows:
where is the average weighted concentration in a grid cell, is the trajectory index, is the total number of trajectories, is the observed concentration when trajectory arrives, and is the time spent by trajectory in grid cell (). High values of indicate that air masses passing through the grid cell are, on average, associated with high concentrations at the receptor. A weighting function was applied to the CWT analysis to reduce the influence of small values.
3. Results
3.1. Characteristics of O3 and PM2.5 Pollution in Jiaxing During Different Lockdown Periods
To assess the impact of different lockdown periods on O3 and PM2.5 pollution characteristics in Jiaxing, we conducted analysis and meteorological normalization of monitoring data. Figure 1 and Table 1 illustrate the averaged concentration trends of O3 and PM2.5 in Jiaxing across different lockdown periods during the study period. Comparative analysis between measured data and meteorologically normalized results reveals the compound effects of anthropogenic activity changes and meteorological conditions on air quality.
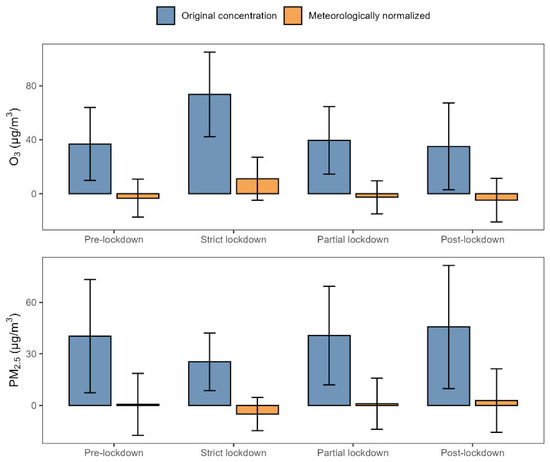
Figure 1.
Concentrations of O3 and PM2.5 in Jiaxing during the pre-lockdown, strict lockdown, partial lockdown, and post-lockdown periods. Gray-blue bars represent mean observed concentrations, with error bars indicating standard deviations. Light orange bars show meteorologically normalized concentrations derived from random forest regression models, with error bars representing standard deviations. The meteorological normalization process removes the influence of meteorological factors on pollutant concentrations, revealing the impact of emission changes during different lockdown periods.

Table 1.
Observed and meteorologically normalized concentrations (mean ± standard deviation) of O3 and PM2.5 in Jiaxing across different lockdown periods. The meteorologically normalized values were obtained through random forest regression modeling to eliminate meteorological influences, thereby isolating the effects of emission changes during each period. All concentration values are reported in μg/m3.
3.1.1. Characteristics of O3 Concentration Changes
Measured data show that O3 concentrations peaked during the strict lockdown period (74.5 ± 32.3 μg/m3), significantly higher than pre-lockdown levels (36.8 ± 27.1 μg/m3). After meteorological normalization using the random forest model, the normalized O3 concentration during the strict lockdown was 15.2 μg/m3, representing a 186% increase from the pre-lockdown baseline (5.3 μg/m3). This indicates that even after eliminating meteorological influences, anthropogenic factors still led to a significant O3 increase.
Meteorological condition analysis reveals that unfavorable weather conditions during the strict lockdown contributed an additional 6.8 μg/m3 to O3 concentrations, while post-lockdown meteorological influence turned negative (−3.2 μg/m3). This suggests that the abnormal O3 increase during the strict lockdown resulted from both changes in anthropogenic emission structures (+9.9 μg/m3) and unfavorable meteorological conditions (+6.8 μg/m3).
As lockdown measures gradually relaxed, O3 concentrations showed a declining trend: normalized concentrations during partial lockdown were 12.4 μg/m3 (+134% compared to pre-lockdown) and further decreased to 8.7 μg/m3 (+64% compared to pre-lockdown) after lockdown. This change indicates that as human activities progressively returned to normal, the emission ratio between NOx and VOCs likely gradually rebalanced, mitigating the chemical conditions favorable for O3 formation.
3.1.2. Characteristics of PM2.5 Concentration Changes
Contrary to the “lockdown period increase” trend exhibited by O3, PM2.5 concentrations reached their lowest during the strict lockdown (25.6 ± 16.7 μg/m3) and rebounded to their highest levels post-lockdown (46.8 ± 36.4 μg/m3). After meteorological normalization, the normalized PM2.5 concentration during the strict lockdown was −5.0 μg/m3, significantly lower than the pre-lockdown baseline (0.6 μg/m3), conclusively demonstrating the effective suppression of particulate pollution through strict control measures.
Notably, the actual PM2.5 reduction during the strict lockdown was achieved under extremely unfavorable meteorological conditions (+11.1 μg/m3). Excluding meteorological influences, the net effect of anthropogenic emission reductions reached −16.1 μg/m3, indicating that strict control of human activities could effectively reduce PM2.5 pollution, even under adverse weather conditions.
As lockdown measures relaxed, normalized PM2.5 concentrations gradually increased: partial lockdown levels reached 0.9 μg/m3 (approaching pre-lockdown levels), while post-lockdown levels rose to 2.7 μg/m3 (significantly higher than pre-lockdown). Particularly, during the post-lockdown period, despite favorable meteorological conditions (−4.7 μg/m3), PM2.5 concentrations rebounded substantially, suggesting that fully restored economic activities may have led to emission levels exceeding pre-pandemic levels.
The research results clearly demonstrate an inverse relationship between O3 and PM2.5: during the strict lockdown, PM2.5 decreased significantly while O3 abnormally increased; as lockdown measures relaxed, O3 concentrations gradually declined while PM2.5 continuously rebounded. This phenomenon reveals the complex chemical coupling relationships between atmospheric pollutants and the unexpected impacts that control measures targeting a single pollutant may have on other pollutants.
3.2. Influencing Factors for O3 and PM2.5 Formation
Random forest model analysis reveals that the primary influencing factors for O3 and PM2.5 in Jiaxing exhibited significant variations across different lockdown periods (see Figure 2 and Figure 3). For O3, NO2 was the dominant driving factor during the pre-lockdown and partial lockdown periods, while relative humidity became the primary influencing factor during the strict lockdown and post-lockdown periods. For PM2.5, CO consistently remained the most significant driving factor through the first three periods, with NO2 replacing CO as the primary influencing factor during the post-lockdown period.

Figure 2.
Feature importance ranking derived from impurity reduction calculations in random forest regression models for O3 during four different periods: (a) pre-lockdown, (b) strict lockdown, (c) partial lockdown, and (d) post-lockdown. Higher importance values indicate a greater contribution of the corresponding variable to the model performance.
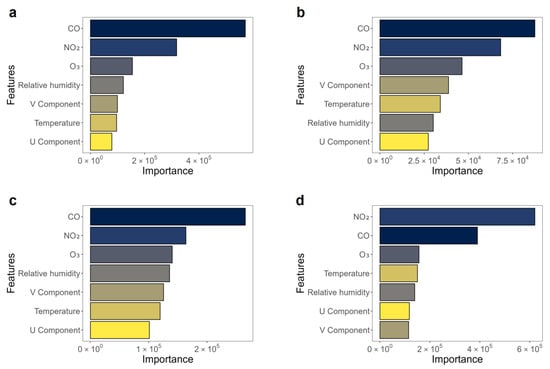
Figure 3.
Feature importance ranking derived from impurity reduction calculations in random forest regression models for PM2.5 during four different periods: (a) pre-lockdown, (b) strict lockdown, (c) partial lockdown, and (d) post-lockdown. Higher importance values indicate a greater contribution of the corresponding variable to the model performance.
Based on feature importance analysis, we focused on three key variables among the seven predictors: the influence of NO2 on O3 and PM2.5 and the interaction between O3 and PM2.5. This selection was guided by two factors. Environmental variables, like CO and relative humidity, showed consistent partial dependency patterns across all study periods (Figures S3–S10), while wind components (U, V) consistently demonstrated low importance in our models. In contrast, NO2, O3, and PM2.5 exhibited both high importance in the models and significant relationship changes across lockdown periods, likely reflecting emission-driven shifts in atmospheric chemistry. Analyzing these three variables provides crucial insights into how lockdown measures altered pollutant formation mechanisms through changing emission patterns.
Partial dependency analysis revealed significant variations in NO2 influences on O3 and PM2.5 across different lockdown periods, reflecting atmospheric chemical process adjustments driven by emission pattern changes (Figure 4). For NO2 effects on O3, the pre-lockdown and strict lockdown periods exhibited characteristic VOC-limited response patterns: high O3 at low NO2 concentrations, decreasing O3 with increasing NO2, and slight O3 recovery at high NO2 levels. This non-monotonic response pattern corresponds to the characteristic features of VOC-limited regimes widely observed in photochemical studies, indicating predominant VOC-limited photochemical conditions during these periods [43,44]. As control measures evolved, partial lockdown and post-lockdown periods showed transformation toward nearly linear positive correlations between NO2 and O3, suggesting photochemical regime transition from VOC-limited toward NOx-limited or transitional conditions due to altered VOCs/NOx ratios.
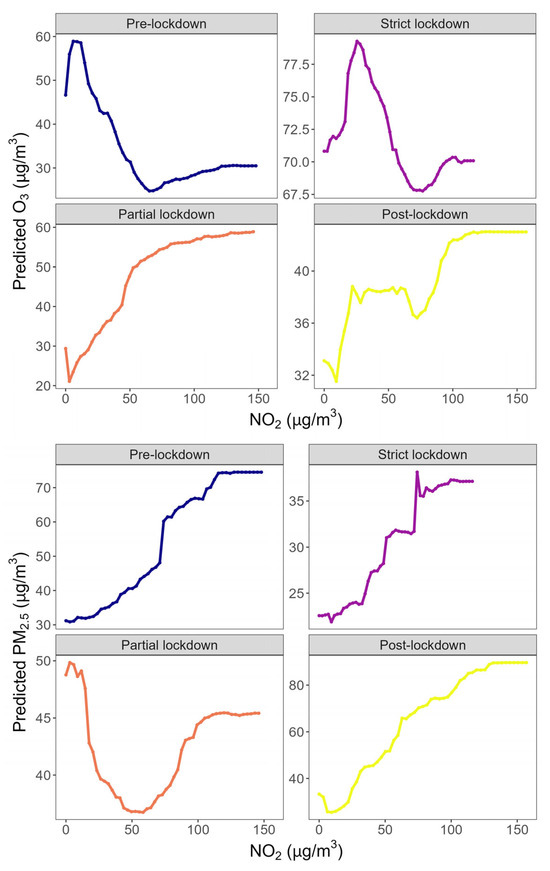
Figure 4.
Partial dependence plots illustrating the relationships between NO2 (μg/m3) with O3 and PM2.5 concentrations in Jiaxing during the four lockdown periods.
For NO2 effects on PM2.5, the pre-lockdown and strict lockdown periods displayed approximately linear positive correlations, indicating the direct promotion of secondary inorganic aerosol formation by NO2 as a key precursor. However, during the partial lockdown, this relationship transformed into a non-linear concave pattern, suggesting potential PM2.5 formation inhibition mechanisms within specific NO2 concentration ranges. The post-lockdown period relationship reverted to a near-linear positive correlation, potentially reflecting permanent adjustments in emission source composition.
These dynamic changes reveal significant impacts of precursor emission ratios on atmospheric chemical processes. Particularly, the transformation in NO2-O3 response patterns indicates that moderate NOx reduction coupled with VOC control may be key for effective O3 pollution management.
Partial dependency plots further revealed distinct changes in PM2.5-O3 relationships across the different lockdown periods (Figure 5). During the pre-lockdown and strict lockdown periods, these pollutants exhibited nearly linear positive correlations, suggesting mutual enhancement mechanisms. This relationship likely stems from common precursors or complex processes, where O3 promotes secondary organic aerosol formation while PM2.5 indirectly affects O3 generation through photochemical reaction modification.
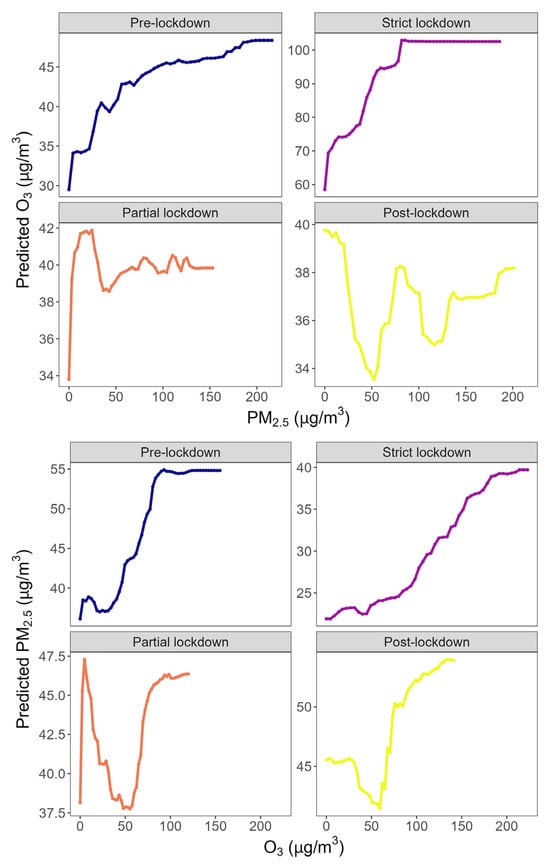
Figure 5.
Partial dependence plots illustrating the bidirectional relationships between PM2.5 and O3 concentrations in Jiaxing across the four lockdown periods.
As control measures shifted during the partial lockdown and post-lockdown periods, the PM2.5-O3 relationship transformed into non-linear patterns. PM2.5 promoted O3 formation at lower concentrations, with this effect plateauing at higher PM2.5 levels. During the partial lockdown, these non-linear fluctuations remained relatively stable, while post-lockdown periods showed more pronounced variations, reflecting increased atmospheric chemical instability due to changing emission patterns and intensities.
Concurrently, O3 influence on PM2.5 evolved from linear positive correlation to complex non-linear patterns characterized by PM2.5 concentrations that first increased, then decreased, and then increased again with rising O3 levels. This complexity likely reflects varying O3 contributions to secondary aerosols across different concentration ranges plus multiple effects of changing atmospheric oxidation capacity on particulate matter transformation.
Despite strict lockdown measures significantly reducing PM2.5 concentrations, O3 pollution persisted or even increased in some regions. This phenomenon likely resulted from disproportionate NOx and VOC emission reductions, elevating VOCs/NOx ratios and promoting O3 formation in previously VOC-limited regions [45,46]. Additionally, reduced PM2.5 weakened aerosol attenuation of UV radiation, enhancing photochemical reactions [44,47].
Our research identified the partial lockdown period as potentially closest to multi-pollutant control equilibrium, with PM2.5 maintaining relatively low levels (approximately 20% below pre-lockdown), and O3 concentrations decreased (about 15%). This suggests that moderate restrictions may better facilitate multi-pollutant synergistic control than comprehensive strict measures, aligning with previous research indicating that effective control requires balanced VOC and NOx emission reduction ratios [45,47].
3.3. Pollution Source Potential of O3 and PM2.5
We further employed backward trajectory and pollution source potential analysis to investigate regional transport sources of air pollutants affecting O3 and PM2.5 formation in Jiaxing. Figure 6 presents the O3 concentration-weighted trajectory analysis results across the four different periods, where increasingly red coloration indicates a higher probability of a region serving as a potential O3 source area.
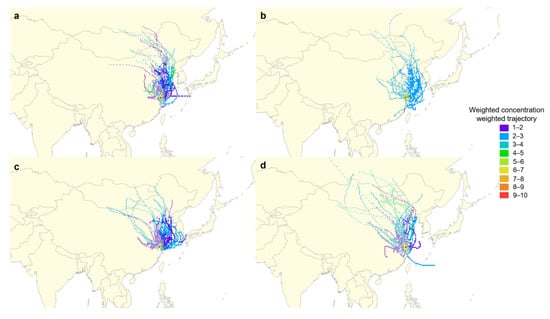
Figure 6.
Potential source contribution analysis for O3 in Jiaxing based on the Weighted Concentration Weighted Trajectory (WCWT) method during four different periods: (a) pre-lockdown, (b) strict lockdown, (c) partial lockdown, and (d) post-lockdown. The color gradient represents the likelihood of pollution source regions contributing to O3 concentrations in Jiaxing, with red areas indicating high potential contribution sources and blue areas indicating low potential contribution sources.
The research reveals that potential O3 source regions exhibited distinct variations across different lockdown periods. Pre-lockdown sources were primarily concentrated in northern areas; during the strict lockdown, they shifted to northwestern and northeastern regions; during the partial lockdown, they expanded to northeastern and southeastern regions; while during post-lockdown, they reconcentrated in northern and northwestern areas. These variations reflect how reduced local emissions during lockdown enhanced the contribution of regional transport and how the resurgence of local emissions after work resumption led industrial and transportation sources to regain dominance in O3 formation.
Figure 7 presents the WCWT analysis results for PM2.5 during the same periods. Potential source regions for PM2.5 likewise exhibited significant spatiotemporal variations. Pre-lockdown sources were mainly concentrated in southwestern areas; during the strict lockdown, they shifted to northern and northwestern regions; during the partial lockdown, they concentrated in northern and northeastern areas; while during post-lockdown, they were primarily located in northwestern regions. These variations may be attributed to reduced local emissions due to lockdown measures, which elevated regional transport (such as northern dust and northwestern industrial emissions) as the primary PM2.5 sources. The gradual resumption of emissions from northern industries during the partial lockdown period, along with enhanced northwestern industrial sources and regional transport during the post-lockdown period, collectively shaped the source characteristics of PM2.5 across different periods.

Figure 7.
Potential source contribution analysis for PM2.5 in Jiaxing based on the Weighted Concentration Weighted Trajectory (WCWT) method during four different periods: (a) pre-lockdown, (b) strict lockdown, (c) partial lockdown, and (d) post-lockdown. The color gradient represents the likelihood of pollution source regions contributing to PM2.5 concentrations in Jiaxing, with red areas indicating high potential contribution sources and blue areas indicating low potential contribution sources.
4. Discussion
Our analysis of air quality changes across different lockdown periods in Jiaxing reveals the complex impacts of pollution control measures and their important implications for environmental policy. Our research shows that during the strict lockdown period, O3 concentrations in Jiaxing increased significantly (186% increase after meteorological normalization), while PM2.5 concentrations decreased markedly. The inverse relationship observed between O3 and PM2.5 aligns with similar findings from other parts of China [48,49,50] and studies around the world [51,52], suggesting that this “control dilemma” may be a common phenomenon in urban areas under emission reduction scenarios. For example, Wang et al. (2021) found that despite substantial reductions in nitrogen oxide (NOx) emissions (>50%) during the COVID-19 lockdown in the Yangtze River Delta region, O3 concentrations increased significantly, consistent with our observations [53]. Grange et al. (2021) showed that during the strictest mobility restrictions in 102 European urban areas, O3 concentrations at traffic and urban background monitoring sites were 30% and 21% higher than expected, respectively, while NO2 concentrations decreased by approximately one-third [13]. Siciliano et al. (2020) also found that despite significant reductions in CO and NO2 concentrations in Rio de Janeiro, Brazil, O3 levels increased at all study locations [12]. These global observations suggest that emission changes under lockdown measures led to widespread atmospheric chemical responses.
The core mechanism behind this O3-PM2.5 trade-off can be attributed to a transition from VOC-limited to NOx-limited photochemical regimes during lockdown. Our observation of the NO2-O3 relationship transforming from an “inverted U-shape” to a linear positive correlation supports this explanation. Liu et al. (2021) further revealed differences in O3 changes across different regions of China during lockdown [15]. Unlike most regions where O3 concentrations increased, daytime O3 actually decreased in subtropical southern regions. They found that these regional differences primarily stemmed from decreasing NOx saturation from north to south and variations in NOx and VOC reduction magnitudes across different regions. In VOC-limited northern regions, NOx reductions (46%) and VOC reductions (32%) together led to net increases in O3; in central regions, the opposing effects of NOx reductions (49%) and VOC reductions (24%) offset each other; while in southern regions, comparable reductions in both precursors (45–55%) resulted in net decreases in O3.
Jiaxing experienced a transition from VOC-limited to NOx-limited or transitional photochemical regimes across different lockdown periods. Du et al. (2022) found through 108 emission reduction scenarios simulated for the Chengdu metropolitan area that O3 concentrations exhibit different response characteristics when different proportions of reductions are implemented for NOx and VOCs; particularly, when VOC emissions are reduced by 50%, the O3 formation mechanism shifts from transitional to VOC limited [54]. Additionally, reduced PM2.5 concentrations weakened aerosol attenuation of ultraviolet radiation, potentially further enhancing photochemical reactions [44,47]. These findings suggest that single-pollutant control strategies may lead to unexpected atmospheric chemical consequences, highlighting the importance of understanding pollutant precursor ratios rather than focusing solely on absolute concentrations.
Notably, the partial lockdown period appears to have achieved better multi-pollutant co-control effects, indicating that moderate multi-sector emissions reductions may be superior to aggressive single-sector controls. Our research analyzed the potential multi-pollutant control balance point achieved during the partial lockdown period through random forest modeling, finding that moderate restrictions may be more conducive to multi-pollutant co-control than comprehensive strict measures, as the reduction ratios of NOx and VOCs may be more balanced in such scenarios. Tian et al. (2024) also indicated that to achieve O3 concentration reductions in all cities, a 10% reduction in total NOx emissions requires at least an 18% reduction in VOCs (a ratio of 1.8:1), and appropriately coordinated VOCs and NOx reductions can reduce MDA8 ozone concentrations in the Central Plains urban agglomeration by 0.14–4.78% [55], which aligns with our empirical findings. Despite favorable meteorological conditions, the post-lockdown rebound of PM2.5 concentrations exceeding pre-lockdown levels suggests possible “emission compensation” behaviors. This has important implications for designing transition strategies following temporary control measures.
COVID-19 lockdown measures led to notable changes in regional pollutant transport patterns, reflecting the substantial impact of emission adjustments on transport pathways. The dynamic changes in pollution source regions revealed by trajectory analysis emphasized the necessity of regional collaborative governance. Tudor et al. (2022) demonstrated through trajectory analysis of London and Edinburgh that transport patterns underwent a measurable transformation during the lockdown period, consistent with the source region displacement phenomenon we observed in Jiaxing [56]. Kim et al. (2022) provided deeper mechanistic insights, finding that despite overall emission reductions in northeastern China, continued release from residential coal combustion promoted secondary transformation processes, which affected pollutant composition in downwind areas through long-range transport, explaining our observation of PM2.5 source regions shifting from southwestern to northern and northwestern areas [57]. Gu et al. (2021)’s research on Shanghai provided quantitative evidence, finding that regional transport contributed 40–80% of PM2.5 in Shanghai, and the reduction magnitude of transport-contributed aerosols (13.2–21.8%) was significantly less than that of local particles (37.1–64.8%) [58], explaining why our observed source regions shifted rather than disappeared. Particularly, when local emissions are suppressed, the relative contribution of regional transport significantly increases, which has important implications for designing air pollution control strategies in city clusters. These studies collectively indicate that emission changes under lockdown measures altered regional pollutant flow patterns by affecting atmospheric chemical processes and transport conditions. This finding suggests that the Yangtze River Delta region needs to establish regional joint prevention and control mechanisms that consider changes in transport characteristics, especially targeting northwestern and northern industrial emission sources, as these source regions maintain significant influence under different emission scenarios.
Our methodological framework overcomes limitations in previous lockdown studies that struggled to separate meteorological influences from anthropogenic factors, though limitations remain in fully accounting for VOC speciation changes and quantifying interactions between regional transport and local emissions. The lack of detailed VOC speciation data impacts our ability to comprehensively explain certain non-linear atmospheric chemical processes. Different VOC species (such as alkanes, alkenes, aromatics, etc.) have varying photochemical reactivity and NO2 interaction mechanisms, leading to complex variations in O3 formation pathways. Without these detailed classification data, we cannot precisely determine whether specific regions were VOC limited or NOx limited during different lockdown phases, which could explain some of the complex O3 responses observed.
Additionally, while our WCWT analysis effectively identified potential source regions for pollutants, this methodology primarily reveals source–receptor relationships rather than quantifying the specific interactions between transported pollutants and local emissions. Our study demonstrates that regional transport patterns shifted during different lockdown phases, but we cannot fully evaluate how these transported pollutants specifically interacted with and modified local emission processes and atmospheric chemistry. A comprehensive assessment of these interactions would require additional methodologies, such as chemical transport modeling with emission sensitivity tests or detailed source apportionment techniques, which were beyond the scope of this study.
While these limitations constitute certain constraints, they do not affect the core findings and methodological validity of this study. By combining meteorological normalization methods, random forest modeling, and trajectory analysis, we were able to more comprehensively assess the impact of COVID-19 lockdown measures on air quality and distinguish the relative contributions of different factors. Future research should focus on developing more sophisticated multi-pollutant co-control models, investigating specific VOC species changes and their impacts on atmospheric chemistry, exploring the long-term effects of temporary emission reductions, and assessing the health benefits of different control scenarios. In particular, deeper research is needed on the dynamic characteristics of regional transport networks under different emission scenarios to provide more precise scientific guidance for regional joint prevention and control policies. Future studies should also employ integrated modeling approaches to quantitatively evaluate how transported pollutants interact with local emissions and modify atmospheric chemical processes, which would provide valuable insights for designing more effective regional collaborative air pollution control strategies. Additionally, integrated research methods combining satellite remote sensing, ground observations, and model simulations may provide new perspectives for understanding the impact of large-scale emission changes on atmospheric chemistry and transport processes.
5. Conclusions
This analysis of O3 and PM2.5 dynamics in Jiaxing during COVID-19 lockdowns reveals insights into atmospheric chemical processes. Strict lockdown measures produced contrasting effects: PM2.5 decreased by approximately 30% while O3 paradoxically increased by 186% after meteorological normalization. The relative importance of influencing factors varied temporally, with NO2 dominating O3 formation during pre-lockdown and partial lockdown, while humidity became most influential during the strict lockdown. For PM2.5, CO dominated initially, with NO2 becoming primary post-lockdown as transportation and industrial activities resumed. Partial dependency analysis showed that PM2.5-O3 relationships evolved from linear to non-linear patterns across lockdown phases, with NO2-O3 interactions indicating shifts from VOC-limited to NOx-limited regimes. This inverse relationship between pollutants stemmed from disproportionate NOx reductions relative to VOCs and decreased PM2.5-related UV attenuation. Regional transport patterns shifted significantly across periods, with their relative contribution enhanced during the strict lockdown due to reduced local emissions. Notably, the partial lockdown period achieved the most balanced pollution control outcomes, with PM2.5 remaining 20% below pre-lockdown levels while O3 decreased by 15%, suggesting that moderate restrictions may better facilitate multi-pollutant co-control than comprehensive measures.
Supplementary Materials
The following supporting information can be downloaded at https://www.mdpi.com/article/10.3390/atmos16060710/s1, Figure S1: Map of the study area; Figure S2: Performance metrics of random forest regression models for O3 prediction during different periods; Figure S3: Performance metrics of random forest regression models for PM2.5 prediction during different periods; Figures S4–S7: Partial dependence plots illustrating the relationships between key influencing factors and O3 concentrations in Jiaxing during the four lockdown periods; Figures S8–S11: Partial dependence plots illustrating the relationships between key influencing factors and PM2.5 concentrations in Jiaxing during the four lockdown periods; Figures S12–S15: Performance changes in O3 prediction model after removal of top three important features during the four lockdown periods; Figures S16–S19: Performance changes in PM2.5 prediction model after removal of top three important features during the four lockdown periods; Table S1: Range of model performance metrics (RMSE, MAE, and R2) across hyperparameter combinations for O3 and PM2.5 prediction models; Table S2: Percentage change in model performance metrics after removal of top three important features.
Author Contributions
Conceptualization, H.Z., Q.Y., J.L., and L.W.; methodology, H.Z.; validation, Q.Y. and L.W.; resources, Q.X., Y.X., and J.Z.; data curation, L.W.; writing—original draft preparation, Q.Y. and L.W.; writing—review and editing, W.Q., Y.S., Q.X., Y.X., J.Z., S.L., H.Z., and J.L.; visualization, H.Z.; supervision, H.Z.; project administration, H.Z.; funding acquisition, Q.Y., Q.X., Y.X., J.Z., H.Z., and J.L. All authors have read and agreed to the published version of the manuscript.
Funding
This work was financially supported by the Personal Startup Funding of Jiaxing Nanhu University (grant NO.: QD61220045, QD61220056), the Jiaxing Public Welfare Research Program Projects (grant NO.: 2023AY11018, 2024AY10017), a project supported by the scientific research fund of Zhejiang Provincial Education Department (grant NO.: Y202352075, Y202147864), the Jiaxing Nanhu University Student Innovation and Entrepreneurship Project (grant NO.: 238519247), and the Research Project of Jiaxing Nanhu University (grant NO.: 62104YL, 62313YL).
Institutional Review Board Statement
Not applicable.
Informed Consent Statement
Not applicable.
Data Availability Statement
The pollutant data, meteorological data, and air mass data can be accessed and downloaded via https://quotsoft.net/air/ (accessed on 10 October 2024), https://cds.climate.copernicus.eu/datasets/reanalysis-era5-single-levels?tab=download (accessed on 16 October 2024) and https://www.ready.noaa.gov/data/archives/gdas1/ (accessed on 25 September 2024), respectively.
Conflicts of Interest
The authors declare no conflicts of interest.
Abbreviations
The following abbreviations are used in this manuscript:
| O3 | ozone |
| PM2.5 | particulate matter ≤2.5 μm |
| NOx | nitrogen oxides |
| VOCs | volatile organic compounds |
| SOA | secondary organic aerosol |
| MAE | mean absolute error |
| RMSE | root mean square error |
References
- Stowell, J.D.; Kim, Y.-m.; Gao, Y.; Fu, J.S.; Chang, H.H.; Liu, Y. The impact of climate change and emissions control on future ozone levels: Implications for human health. Environ. Int. 2017, 108, 41–50. [Google Scholar] [CrossRef] [PubMed]
- An, Z.; Huang, R.-J.; Zhang, R.; Tie, X.; Li, G.; Cao, J.; Zhou, W.; Shi, Z.; Han, Y.; Gu, Z. Severe haze in northern China: A synergy of anthropogenic emissions and atmospheric processes. Proc. Natl. Acad. Sci. USA 2019, 116, 8657–8666. [Google Scholar] [CrossRef] [PubMed]
- Day, D.B.; Xiang, J.; Mo, J.; Li, F.; Chung, M.; Gong, J.; Weschler, C.J.; Ohman-Strickland, P.A.; Sundell, J.; Weng, W.; et al. Association of ozone exposure with cardiorespiratory pathophysiologic mechanisms in healthy adults. JAMA Intern. Med. 2017, 177, 1344–1353. [Google Scholar] [CrossRef] [PubMed]
- Tian, Y.; Wu, Y.; Liu, H.; Si, Y.; Wu, Y.; Wang, X.; Wang, M.; Wu, J.; Chen, L.; Wei, C.; et al. The impact of ambient ozone pollution on pneumonia: A nationwide time-series analysis. Environ. Int. 2020, 136, 105498. [Google Scholar] [CrossRef]
- Cohen, A.J.; Brauer, M.; Burnett, R.; Anderson, H.R.; Frostad, J.; Estep, K.; Balakrishnan, K.; Brunekreef, B.; Dandona, L.; Dandona, R.; et al. Estimates and 25-year trends of the global burden of disease attributable to ambient air pollution: An analysis of data from the Global Burden of Diseases Study 2015. Lancet 2017, 389, 1907–1918. [Google Scholar] [CrossRef]
- Caillol, S. Fighting global warming: The potential of photocatalysis against CO2, CH4, N2O, CFCs, tropospheric O3, BC and other major contributors to climate change. J. Photochem. Photobiol. C Photochem. Rev. 2011, 12, 1–19. [Google Scholar]
- European Environment Agency. EEA Exposure of Europe’s Ecosystems to Ozone [EB/OL]. 2024. Available online: https://www.eea.europa.eu/en/analysis/indicators/exposure-of-europes-ecosystems-to-ozone (accessed on 22 May 2025).
- JURáŇ, S.; Karl, T.; Ofori-Amanfo, K.K.; Šigut, L.; Zavadilová, I.; Grace, J.; Urban, O. Drought shifts ozone deposition pathways in spruce forest from stomatal to non-stomatal flux. Environ. Pollut. 2025, 372, 126081. [Google Scholar] [CrossRef]
- Zhong, H.; Huang, R.-J.; Chang, Y.; Duan, J.; Lin, C.; Chen, Y. Enhanced formation of secondary organic aerosol from photochemical oxidation during the COVID-19 lockdown in a background site in Northwest China. Sci. Total Environ. 2021, 778, 144947. [Google Scholar] [CrossRef]
- Chang, Y.; Huang, R.-J.; Ge, X.; Huang, X.; Hu, J.; Duan, Y.; Zou, Z.; Liu, X.; Lehmann, M.F. Puzzling Haze Events in China During the Coronavirus (COVID-19) Shutdown. Geophys. Res. Lett. 2020, 47, e2020GL088533. [Google Scholar] [CrossRef]
- Sicard, P.; De Marco, A.; Agathokleous, E.; Feng, Z.; Xu, X.; Paoletti, E.; Rodriguez, J.J.D.; Calatayud, V. Amplified ozone pollution in cities during the COVID-19 lockdown. Sci. Total Environ. 2020, 735, 139542. [Google Scholar] [CrossRef]
- Siciliano, B.; Dantas, G.; da Silva, C.M.; Arbilla, G. Increased ozone levels during the COVID-19 lockdown: Analysis for the city of Rio de Janeiro, Brazil. Sci. Total Environ. 2020, 737, 139765. [Google Scholar] [CrossRef] [PubMed]
- Grange, S.K.; Lee, J.D.; Drysdale, W.S.; Lewis, A.C.; Hueglin, C.; Emmenegger, L.; Carslaw, D.C. COVID-19 lockdowns highlight a risk of increasing ozone pollution in European urban areas. Atmos. Chem. Phys. 2021, 21, 4169–4185. [Google Scholar] [CrossRef]
- Shi, Z.; Song, C.; Liu, B.; Lu, G.; Xu, J.; Van Vu, T.; Elliott, R.J.; Li, W.; Bloss, W.J.; Harrison, R.M. Abrupt but smaller than expected changes in surface air quality attributable to COVID-19 lockdowns. Sci. Adv. 2021, 7, eabd6696. [Google Scholar] [CrossRef]
- Liu, Y.; Wang, T.; Stavrakou, T.; Elguindi, N.; Doumbia, T.; Granier, C.; Bouarar, I.; Gaubert, B.; Brasseur, G.P. Diverse response of surface ozone to COVID-19 lockdown in China. Sci. Total Environ. 2021, 789, 147739. [Google Scholar] [CrossRef]
- Tie, X.; Madronich, S.; Li, G.; Ying, Z.; Zhang, R.; Garcia, A.R.; Lee-Taylor, J.; Liu, Y. Characterizations of chemical oxidants in Mexico City: A regional chemical dynamical model (WRF-Chem) study. Atmos. Environ. 2007, 41, 1989–2008. [Google Scholar] [CrossRef]
- Byun, D.; Schere, K.L. Review of the governing equations, computational algorithms, and other components of the Models-3 Community Multiscale Air Quality (CMAQ) modeling system. Appl. Mech. Rev. 2006, 59, 51–77. [Google Scholar] [CrossRef]
- Bove, M.; Brotto, P.; Cassola, F.; Cuccia, E.; Massabò, D.; Mazzino, A.; Piazzalunga, A.; Prati, P. An integrated PM2.5 source apportionment study: Positive matrix factorisation vs. the chemical transport model CAMx. Atmos. Environ. 2014, 94, 274–286. [Google Scholar] [CrossRef]
- Xiong, K.; Xie, X.; Mao, J.; Wang, K.; Huang, L.; Li, J.; Hu, J. Improving the accuracy of O3 prediction from a chemical transport model with a random forest model in the Yangtze River Delta region, China. Environ. Pollut. 2023, 319, 120926. [Google Scholar] [CrossRef]
- Wang, Q.; Wang, X.; Huang, R.; Wu, J.; Xiao, Y.; Hu, M.; Fu, Q.; Duan, Y.; Chen, J. Regional transport of PM2.5 and O3 based on complex network method and chemical transport model in the Yangtze River Delta, China. J. Geophys. Res. Atmos. 2022, 127, e2021JD034807. [Google Scholar] [CrossRef]
- Elser, M.; Huang, R.-J.; Wolf, R.; Slowik, J.G.; Wang, Q.; Canonaco, F.; Li, G.; Bozzetti, C.; Daellenbach, K.R.; Huang, Y. New insights into PM 2.5 chemical composition and sources in two major cities in China during extreme haze events using aerosol mass spectrometry. Atmos. Chem. Phys. 2016, 16, 3207–3225. [Google Scholar] [CrossRef]
- Lee, S.; Liu, W.; Wang, Y.; Russell, A.G.; Edgerton, E.S. Source apportionment of PM2.5: Comparing PMF and CMB results for four ambient monitoring sites in the southeastern United States. Atmos. Environ. 2008, 42, 4126–4137. [Google Scholar] [CrossRef]
- Franceschi, F.; Cobo, M.; Figueredo, M. Discovering relationships and forecasting PM10 and PM2.5 concentrations in Bogotá, Colombia, using artificial neural networks, principal component analysis, and k-means clustering. Atmos. Pollut. Res. 2018, 9, 912–922. [Google Scholar] [CrossRef]
- Zou, B.; Chen, J.; Zhai, L.; Fang, X.; Zheng, Z. Satellite based mapping of ground PM2.5 concentration using generalized additive modeling. Remote Sens. 2016, 9, 1. [Google Scholar] [CrossRef]
- Zhou, Y.; Chang, F.-J.; Chang, L.-C.; Kao, I.-F.; Wang, Y.-S.; Kang, C.-C. Multi-output support vector machine for regional multi-step-ahead PM2.5 forecasting. Sci. Total Environ. 2019, 651, 230–240. [Google Scholar] [CrossRef]
- Wang, X.; Wang, B. Research on prediction of environmental aerosol and PM2.5 based on artificial neural network. Neural Comput. Appl. 2019, 31, 8217–8227. [Google Scholar] [CrossRef]
- Lyu, Y.; Zhang, Q.; Sun, Q.; Gu, M.; He, Y.; Walters, W.W.; Sun, Y.; Pan, Y. Revisiting the dynamics of gaseous ammonia and ammonium aerosols during the COVID-19 lockdown in urban Beijing using machine learning models. Sci. Total Environ. 2023, 905, 166946. [Google Scholar] [CrossRef]
- Zhou, W.; Lei, L.; Du, A.; Zhang, Z.; Li, Y.; Yang, Y.; Tang, G.; Chen, C.; Xu, W.; Sun, J. Unexpected increases of severe haze pollution during the post COVID-19 period: Effects of emissions, meteorology, and secondary production. J. Geophys. Res. Atmos. 2022, 127, e2021JD035710. [Google Scholar] [CrossRef]
- Breiman, L. Random forests. Mach. Learn. 2001, 45, 5–32. [Google Scholar] [CrossRef]
- Fox, E.W.; Hill, R.A.; Leibowitz, S.G.; Olsen, A.R.; Thornbrugh, D.J.; Weber, M.H. Assessing the accuracy and stability of variable selection methods for random forest modeling in ecology. Environ. Monit. Assess. 2017, 189, 316. [Google Scholar] [CrossRef]
- Fox, E.W.; Hoef, J.M.V.; Olsen, A.R. Comparing spatial regression to random forests for large environmental data sets. PLoS ONE 2020, 15, e0229509. [Google Scholar] [CrossRef]
- Barreñada, L.; Dhiman, P.; Timmerman, D.; Boulesteix, A.L.; Van Calster, B. Understanding overfitting in random forest for probability estimation: A visualization and simulation study. Diagn. Progn. Res. 2024, 8, 14. [Google Scholar] [CrossRef]
- Hu, X.; Dhiman, P.; Timmerman, D.; Boulesteix, A.-L.; Van Calster, B. Estimating PM2.5 concentrations in the conterminous United States using the random forest approach. Environ. Sci. Technol. 2017, 51, 6936–6944. [Google Scholar] [CrossRef] [PubMed]
- Keller, C.A.; Evans, M.J. Application of random forest regression to the calculation of gas-phase chemistry within the GEOS-Chem chemistry model v10. Geosci. Model Dev. 2019, 12, 1209–1225. [Google Scholar] [CrossRef]
- Sun, J.; Gong, J.; Zhou, J. Estimating hourly PM2.5 concentrations in Beijing with satellite aerosol optical depth and a random forest approach. Sci. Total Environ. 2021, 762, 144502. [Google Scholar] [CrossRef] [PubMed]
- Refaeilzadeh, P.; Tang, L.; Liu, H. Cross-validation. In Encyclopedia of Database Systems; Springer: Boston, MA, USA, 2009; Volume 5, pp. 532–538. [Google Scholar]
- Jung, C.-R.; Chen, W.-T.; Young, L.-H.; Hsiao, T.-C. A hybrid model for estimating the number concentration of ultrafine particles based on machine learning algorithms in central Taiwan. Environ. Int. 2023, 175, 107937. [Google Scholar] [CrossRef]
- Li, H.; Yang, Y.; Jin, J.; Wang, H.; Li, K.; Wang, P.; Liao, H. Climate-driven deterioration of future ozone pollution in Asia predicted by machine learning with multi-source data. Atmos. Chem. Phys. 2023, 23, 1131–1145. [Google Scholar] [CrossRef]
- Kuhn, M.; Wickham, H. Tidymodels: A Collection of Packages for Modeling and Machine Learning Using Tidyverse Principles; Tidymodels: Boston, MA, USA, 2020. [Google Scholar]
- Draxler, R.R.; Hess, G. An overview of the HYSPLIT_4 modelling system for trajectories. Aust. Meteorol. Mag. 1998, 47, 295–308. [Google Scholar]
- Hsu, Y.-K.; Holsen, T.M.; Hopke, P. Comparison of hybrid receptor models to locate PCB sources in Chicago. Atmos. Environ. 2003, 37, 545–562. [Google Scholar] [CrossRef]
- Seibert, P.; Kromp-Kolb, H.; Baltensperger, U.; Jost, D.; Schwikowski, M. Trajectory Analysis of High-Alpine Air Pollution Data, in Air Pollution Modeling and Its Application X; Springer: Berlin/Heidelberg, Germany, 1994; p. 595. [Google Scholar]
- Sillman, S. The relation between ozone, NOx and hydrocarbons in urban and polluted rural environments. Atmos. Environ. 1999, 33, 1821–1845. [Google Scholar] [CrossRef]
- Wang, T.; Xue, L.; Brimblecombe, P.; Lam, Y.F.; Li, L.; Zhang, L. Ozone pollution in China: A review of concentrations, meteorological influences, chemical precursors, and effects. Sci. Total Environ. 2017, 575, 1582–1596. [Google Scholar] [CrossRef]
- Le, T.; Wang, Y.; Liu, L.; Yang, J.; Yung, Y.L.; Li, G.; Seinfeld, J.H. Unexpected air pollution with marked emission reductions during the COVID-19 outbreak in China. Science 2020, 369, 702–706. [Google Scholar] [CrossRef] [PubMed]
- Huang, X.; Ding, A.; Gao, J.; Zheng, B.; Zhou, D.; Qi, X.; Tang, R.; Wang, J.; Ren, C.; Nie, W. Enhanced secondary pollution offset reduction of primary emissions during COVID-19 lockdown in China. Natl. Sci. Rev. 2021, 8, nwaa137. [Google Scholar] [CrossRef] [PubMed]
- Li, K.; Jacob, D.J.; Liao, H.; Shen, L.; Zhang, Q.; Bates, K.H. Anthropogenic drivers of 2013–2017 trends in summer surface ozone in China. Proc. Natl. Acad. Sci. USA 2019, 116, 422–427. [Google Scholar] [CrossRef]
- Gao, J.; Wang, K.; Wang, Y.; Liu, S.; Zhu, C.; Hao, J.; Liu, H.; Hua, S.; Tian, H. Temporal-spatial characteristics and source apportionment of PM2.5 as well as its associated chemical species in the Beijing-Tianjin-Hebei region of China. Environ. Pollut. 2018, 233, 714–724. [Google Scholar] [CrossRef]
- Li, X.; Su, F. The Dynamic Impacts of COVID-19 Pandemic Lockdown on the Multifractal Cross-Correlations between PM2.5 and O3 Concentrations in and around Shanghai, China. Atmosphere 2022, 13, 1964. [Google Scholar] [CrossRef]
- Zhu, J.; Chen, L.; Liao, H.; Yang, H.; Yang, Y.; Yue, X. Enhanced PM2.5 decreases and O3 increases in China during COVID-19 lockdown by aerosol-radiation feedback. Geophys. Res. Lett. 2021, 48, e2020GL090260. [Google Scholar] [CrossRef]
- Kang, M.; Zhang, J.; Zhang, H.; Ying, Q. On the relevancy of observed ozone increase during COVID-19 lockdown to summertime ozone and PM2.5 control policies in China. Environ. Sci. Technol. Lett. 2021, 8, 289–294. [Google Scholar] [CrossRef]
- Karim, I.; Rappenglück, B. Impact of Covid-19 lockdown regulations on PM2.5 and trace gases (NO2, SO2, CH4, HCHO, C2H2O2 and O3) over Lahore, Pakistan. Atmos. Environ. 2023, 303, 119746. [Google Scholar] [CrossRef]
- Wang, Y.; Zhu, S.; Ma, J.; Shen, J.; Wang, P.; Wang, P.; Zhang, H. Enhanced atmospheric oxidation capacity and associated ozone increases during COVID-19 lockdown in the Yangtze River Delta. Sci. Total Environ. 2021, 768, 144796. [Google Scholar] [CrossRef]
- Du, X.; Tang, W.; Zhang, Z.; Chen, J.; Han, L.; Yu, Y.; Li, Y.; Li, Y.; Li, H.; Chai, F. Responses of ozone concentrations to the synergistic control of NOx and VOCs emissions in the Chengdu metropolitan area. Front. Environ. Sci. 2022, 10, 1024795. [Google Scholar] [CrossRef]
- Tian, J.; Wang, J.; Wang, D.; Fang, C.; Huang, J. Research on ozone pollution control strategies for urban agglomerations based on ozone formation sensitivity and emission source contributions. Environ. Pollut. 2024, 363, 125182. [Google Scholar] [CrossRef]
- Tudor, C. Ozone pollution in London and Edinburgh: Spatiotemporal characteristics, trends, transport and the impact of COVID-19 control measures. Heliyon 2022, 8, e11384. [Google Scholar] [CrossRef] [PubMed]
- Kim, Y.; Jeon, K.; Park, J.; Shim, K.; Kim, S.-W.; Shin, H.-J.; Yi, S.-M.; Hopke, P.K. Local and transboundary impacts of PM2.5 sources identified in Seoul during the early stage of the COVID-19 outbreak. Atmos. Pollut. Res. 2022, 13, 101510. [Google Scholar] [CrossRef] [PubMed]
- Gu, Y.; Yan, F.; Xu, J.; Duan, Y.; Fu, Q.; Qu, Y.; Liao, H. Mitigated PM2.5 Changes by the Regional Transport During the COVID-19 Lockdown in Shanghai, China. Geophys. Res. Lett. 2021, 48, e2021GL092395. [Google Scholar] [CrossRef] [PubMed]
Disclaimer/Publisher’s Note: The statements, opinions and data contained in all publications are solely those of the individual author(s) and contributor(s) and not of MDPI and/or the editor(s). MDPI and/or the editor(s) disclaim responsibility for any injury to people or property resulting from any ideas, methods, instructions or products referred to in the content. |
© 2025 by the authors. Licensee MDPI, Basel, Switzerland. This article is an open access article distributed under the terms and conditions of the Creative Commons Attribution (CC BY) license (https://creativecommons.org/licenses/by/4.0/).