Abstract
Ammonium nitrate (NH4NO3) is a major constituent of fine particulate matter (PM2.5), playing a critical role in air quality and atmospheric chemistry. However, the dual regulatory role of ammonia (NH3) in both the formation and volatilization of NH4NO3 under ambient atmospheric conditions remains inadequately understood. To address this gap, we conducted high-resolution field measurements at a clean tropical coastal site in China using an integrated system of Aerosol Ion Monitor-Ion Chromatography, a Scanning Mobility Particle Sizer, and online OC/EC analyzers. These observations were complemented by thermodynamic modeling (E-AIM) and source apportionment via a Positive Matrix Factorization (PMF) model. The E-AIM simulations revealed persistent thermodynamic disequilibrium, with particulate NO3− tending to volatilize even under NH3gas-rich conditions during the northeast monsoon. This suggests that NH4NO3 in PM2.5 forms rapidly within fresh combustion plumes and/or those modified by non-precipitation clouds and then undergoes substantial evaporation as it disperses through the atmosphere. Under the southeast monsoon conditions, reactions constrained by sea salt aerosols became dominant, promoting the formation of particulate NO3− while suppressing NH4NO3 formation despite ongoing plume influence. In scenarios of regional accumulation, elevated NH3 concentrations suppressed NH4NO3 volatilization, thereby enhancing the stability of particulate NO3− in PM2.5. PMF analysis identified five source factors, with NO3− in PM2.5 primarily associated with emissions from local power plants and the large-scale regional background, showing marked seasonal variability. These findings highlight the complex and dynamic interplay between the formation and evaporation of NH4NO3 in NH3gas-rich coastal atmospheres.
1. Introduction
Ammonium nitrate (NH4NO3), a significant water-soluble inorganic component in atmospheric particles, plays a critical role in influencing regional visibility, cloud condensation nuclei (CCN) activity, and radiative forcing through its spatial distribution and gas–particle partitioning behavior [1,2,3,4,5,6,7,8,9,10,11,12]. The thermodynamic properties of NH4NO3 make its concentration highly sensitive to changes in ambient temperature (T) and relative humidity (RH) [2,13,14,15,16,17,18,19,20]. For example, elevated RH enhances the partitioning of both HNO3gas and NH3gas into the submicron particle phase, as well as the transfer of HNO3gas to supermicron particles through the neutralization of negative charges by non-volatile metal ions, thereby further regulating the formation and stability of NH4NO3 and nitrate metal salts [2,14,15,17,18,19]. Conversely, elevated T and low RH conditions tend to drive the dissociation of NH4NO3 back into the gas phase [17,18,19]. These coupled thermodynamic and chemical interactions underscore the importance of elucidating the formation and depletion mechanisms of NH4NO3 in the atmosphere [9,11,21,22,23].
In the formation of submicron NH4NO3 particles, NH3gas, the primary component of atmospheric alkaline gases, serves as both a key precursor and a stabilizing agent [24,25,26,27,28,29,30]. Additionally, N2O5gas contributes to nighttime nitrate formation through particle-phase condensation processes, during which NH3gas further enhances the stability of NH4NO3 [31,32,33,34,35,36]. This is particularly true under conditions of low alkali metal ion concentrations in submicron particles such as Na+ and K+. Globally, the primary source of NH3 is agricultural activities, although transportation and industrial emissions in urban areas also contribute to NH3 emissions [37,38,39,40,41,42,43]. Thus, the regulatory effect of NH3 on NH4NO3 demonstrates significant spatial heterogeneity and concentration dependence [12,24,44,45,46,47,48]. Observational evidence suggests that when the NH3 concentration exceeds the stoichiometric threshold required for the complete neutralization of sulfate, its role shifts from “precursor-limited” to “thermodynamic-limited” [10,48,49,50,51,52,53]. The shift fundamentally alters the pathways of NH4NO3 formation and its phase stability.
In contrast to previous studies that primarily focused on the formation pathways, environmental impacts, climatic effects, and policy implications of NH4NO3, Xiao et al. [54] used isotopic traces and found that nitrate in PM2.5 (atmospheric particles with diameter less than 2.5 μm) primarily originated from primary combustion in a central Chinese city. Shen et al. [23] provided comprehensive evidence showing that high concentrations of NH4NO3 during severe PM2.5 air pollution events are primarily due to prolonged, rapid conversion within combustion plumes under cold, humid, and stable meteorological conditions, followed by subsequent evaporation along the plume dispersion track in ambient air. Furthermore, two independent thermodynamic modeling studies in Beijing showed that thermodynamic force did not support the formation of NH4NO3, even under NH3gas-rich atmospheres [49,55]. More recently, Sun et al. [8] and Yang et al. [44] identified high concentrations of NH4NO3 at approximately 400 m above ground level in northern and eastern China, consistent with emission heights and plume rise from strong industrial sources. If NH4NO3 aerosols in ambient air primarily originated from primary emissions and prolonged combustion plumes, NH4NO3 evaporation would generally be expected to occur [56,57]. This raises the following question: does atmospheric NH3 play a role in reducing NH4NO3 evaporation or in promoting NH4NO3 formation in ambient air?
This paper aims to comprehensively investigate the dual regulatory roles of ammonia in both the formation and evaporation of NH4NO3, using high-resolution data collected at a clean coastal site on a tropical island in China [58]. The simplicity and clarity of the pollution sources at this location offer an ideal environment for isolating the regulatory effects of NH3, thereby enhancing the robustness of the analysis. By combining field observational data analysis, thermodynamic equilibrium modeling, and source apportionment analysis, the study objectives are (1) to determine whether NH3 not only serves as a precursor facilitating NH4NO3 formation, but also suppresses its evaporation by shifting the gas–particle equilibrium toward the particulate phase; (2) to investigate whether the regulatory effect of NH3 on nitrate partitioning evolves under varying meteorological and chemical conditions—including differences in monsoonal air masses, ambient T, RH, and NH3 availability; (3) to characterize the episodic behavior of NO3− in PM2.5 and explore the possible contributions from local primary sources versus secondary formation. This work provides novel scientific insights into the synergistic regulation of nitrate aerosols in PM2.5. The findings are expected to offer theoretical foundations for improved air pollution mitigation strategies and for advancing our understanding of aerosol–climate interactions.
2. Materials and Methods
2.1. Study Area
The sampling site for this study is situated on the third floor of a research building within a high-tech industrial park in southeastern Hainan Province (18.328° N, 109.169° E, Figure 1a,b). This region represents a land–sea transition zone, positioned approximately 1.9 km west of the South China Sea coastline [58]. It is seasonally influenced by alternating southeasterly and northeasterly monsoons under the overarching control of the East Asian monsoon system. To the south of the site, a 487 m high hill situated 1.3 km away acts as a local topographic barrier, fostering local circulation patterns under weak synoptic forcing. Between the sampling site and the hill lies the Huaneng Nanshan Power Plant—a natural gas-fired facility located 1.2 km to the south at the hill’s base (Figure 1c,d). The plant has a total installed capacity of 2 × 46 MW (new generators are visible on the left side of Figure 1c) and 132 MW (original units largely obscured on the right side of Figure 1c) and serves as a major source of industrial air pollutant emissions in the area. Plumes from the facility are occasionally observed traversing the sampling location. Additionally, within a 5 km radius of the park, the surrounding landscape comprises undeveloped wastelands and agricultural land, with approximately 2.3 km2 designated for future development. A major traffic road is located 50 m east of the sampling point, with traffic volumes reaching 810 vehicles per hour during peak periods (07:00–09:00 and 17:00–19:00), 24% of which are electric vehicles (zero-emission models), classifying it as a low mobile pollution source area.
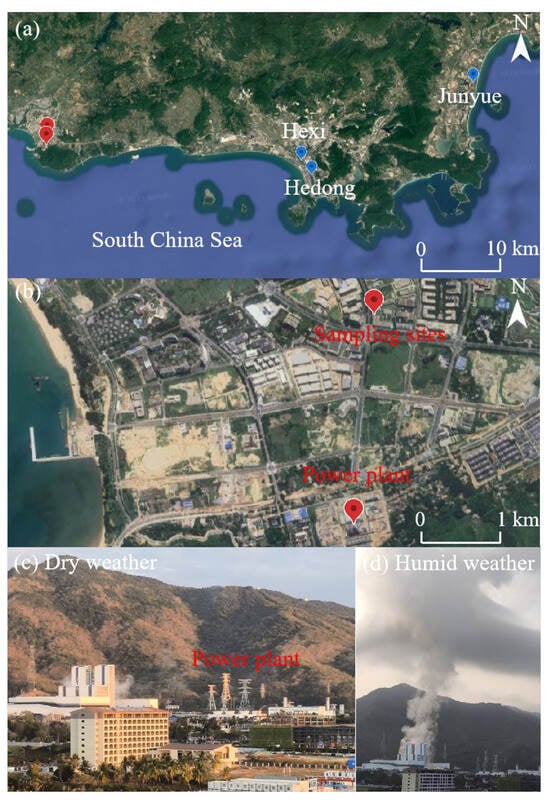
Figure 1.
Map of the sampling site: (a,b) high-resolution terrain map from Google Earth, with red markers indicating the sampling site and power plant locations, and blue markers showing the locations of the three national control points in Sanya. (c) Dispersion of emissions from the power plant under dry weather. (d) Dispersion of emissions under humid weather.
2.2. Study Data
The study utilized an Aerosol Ion Monitor-Ion Chromatography system (AIM-IC) (Thermo Fisher, Waltham, MA, USA) for the continuous monitoring of both gaseous and particulate matter in the atmosphere. The detection limits for NO3− and NH4+ were 5 × 10⁻² μg m−3 and 4 × 10⁻⁴ μg m−3, respectively. The AIM-IC system was installed within the laboratory and connected to ambient air via a 2.5 m long stainless steel inlet tube (3.5 cm inner diameter), with the sampling probe positioned approximately 10 m above ground level. Regular maintenance and calibration procedures were carried out throughout the observation period to ensure the accuracy and instrument stability. Data collected during two periods—November to December 2023 and June 2024—were used for analysis, capturing atmospheric composition under varying meteorological conditions. Detailed operational information for the AIM-IC system is available in our previous publications [18,58,59]. The AIM-IC system is equipped with two analytical columns, one for cations (Ion Pac CS20, 2 × 250 mm) and one for anions (Ion Pac AS 11-HC, 2 × 250 mm), along with two guard columns, one for cations (CG20, 2 × 50 mm) and one for anions (AG 11-HC, 2 × 50 mm). Additionally, the system is equipped with a PM2.5 cyclone separator to ensure accurate sampling of fine particulates, operating at a flow rate of 3 L min−1. The system provides hourly concentration data for reactive gases (NH3, SO2, HNO3, etc.) and water-soluble ions (NH4+, NO3−, etc.). It is important to note that the HNO3 signal measured by AIM-IC includes not only gaseous HNO3 but also contributions from its atmospheric precursors, such as N2O5, a fraction of organic nitrate, and trace amounts of NO2 in ambient air, similar to other acidic vapor species measured by the system [59]. Therefore, HNO3* was used instead of HNO3 in the subsequent analysis.
Particle size spectrum data were measured simultaneously using a Scanning Mobility Particle Sizer (SMPS, Grimm, Germany). During sampling, the air was dried before entering a differential analyzer, where the number concentration size distribution from 11 to 1110 nm was obtained at a sampling flow rate of 0.3 L min−1, with a 4 min resolution and 112 sampling channels, providing high-precision particle size distribution data. Additionally, an OC-EC online analyzer (Model 4, Sunset, Tigard, OR, USA) was employed for the continuous monitoring of organic carbon (OC) and elemental carbon (EC) in PM2.5. Owing to the relatively clean atmospheric conditions at the sampling site (annual mean PM2.5 < 10 μg m−3), OC and EC concentrations were monitored with a time resolution of 2 h to improve signal-to-noise reliability. However, the OC-EC analyzer experienced frequent malfunctions. Data points identified as outliers due to instrument malfunction or external contamination events were excluded during quality control to ensure the accuracy and integrity of the dataset.
2.3. Modeling Method
For model applications, this study utilized the Extended AIM Aerosol Thermodynamics Model (E-AIM, versions Model II and Model IV, available at: http://www.aim.env.uea.ac.uk/aim/aim.php, accessed on 13 February 2025) to simulate the gas–particle partitioning equilibrium of NH4NO3. E-AIM remains the only publicly available thermodynamic model capable of simultaneously resolving multiphase equilibrium processes involving both inorganic and organic aerosols. The core assumptions of E-AIM are as follows: (1) homogeneous internal mixing of aerosol components and (2) thermodynamic equilibrium between aerosols and ambient gases [58,59]. In this study, both Model II and Model IV were used to calculate equilibrium partitioning among the gaseous, aqueous, and solid phases. Model II is suitable across a broad range of relative humidity (0.1 < RH < 1.0) and accounts for the multiphase behavior of the NH3-HNO3-H2SO4-NH4+-NO3−-SO42− (including solid salt precipitation and liquid water dissolution), resolving the distribution of species such as (NH4)2SO4, NH4NO3, etc. Model IV extends the capabilities of Model II by incorporating Cl− and Na+ to represent the influence of sea salt aerosols. Meteorological data were obtained from the China Meteorological Data Service Center (http://data.cma.cn/, accessed on 10 January 2025), and hourly PM2.5 mass concentration data were retrieved from three national monitoring sites in Sanya. Using the NOAA HYSPLIT model (https://www.ready.noaa.gov/HYSPLIT.php, accessed on 10 January 2025) and adopting the MeteoInfo (version 3.9.9) software with GDAS meteorological data (1° × 1° spatial resolution, 3 h temporal resolution), 24 h backward trajectories were calculated at a height of 500 m, reflecting air mass transport characteristics at the top of the boundary layer during the day or above it at night, with a time resolution of 1 h. A 24 h backward trajectory is selected because it corresponds well with the atmospheric lifetime of NOx, which typically undergoes oxidation and transformation within a day. In addition, both NH3 and HNO3 have relatively high dry deposition rates, and their atmospheric residence times are generally short. Therefore, a 24 h period is appropriate for capturing the relevant air mass transport influencing local nitrate formation. The 500 m arrival height was chosen to reflect regional-scale transport while avoiding the limitations of near-surface trajectories, which can be highly uncertain due to local topographic influences and boundary layer turbulence. This altitude is generally above the marine mixing layer, providing a more stable representation of air mass pathways.
To apportion the source contributions of NO3− in PM2.5 ([NO3−]PM2.5), the study integrated the modified particle number concentration spectrum (11–700 nm, with 39 size segments reduced from the original ones) with the [NO3−]PM2.5 composition matrix using the Positive Matrix Factorization (PMF) model for positive matrix decomposition. This method clarified the contributions of various source aerosols to the formation and evolution of NO3−. Strong new particle formation (NPF) events were excluded during the PMF analysis to minimize their dominant effect on the dataset. The study used the Q-value (Q/Qexp) as a fitting evaluation index, comparing changes in Q-values across different factor solutions and considering residual distribution and the physical significance of factor spectra to determine the optimal solution [60]. After running the model 20 times with data from 2023 and 2024, the five best factors were identified, with a Q/Qexp ratio of 1.1.
3. Results and Discussion
3.1. Overview of Observational Results at the Coastal Site
Figure 2 illustrates time series of concentrations of major ions (including NO3−, NH4+, SO42−, and Na+) and carbonaceous components (OC and EC) in PM2.5, along with hourly measurements of NH3 and HNO3* gases during the observation periods (14 November to 12 December 2023 and 7–20 June 2024). During the continuous observation in November 2023 (excluding 27–30 November), the [NO3−]PM2.5 remained relatively low, fluctuating around 0.6 ± 0.3 μg m−3, with a maximum value of only 1.7 μg m−3. However, between 27 and 30 November, several peaks in [NO3−]PM2.5 were observed, with the highest concentration reaching 3.9 μg m−3. A weak correlation was observed between [NO3−]PM2.5 and the corresponding SO42− and NH4+ concentrations (R2 = 0.42 and 0.52, respectively; p-value < 0.01), whereas SO42− and NH4+ were strongly correlated (R2 = 0.91; p-value < 0.01). These results suggested that NO3− in PM2.5 partly existed as NH4NO3, while SO42− primarily existed as NH4+ salts. Furthermore, [NO3−]PM2.5 showed no correlation with Na+, indicating that aged sea salts, such as NaNO3, were not major contributors to the observed NO3− in PM2.5. Additionally, NO3− in PM2.5 and other ions exhibited significant diurnal variations, though their patterns varied inconsistently.
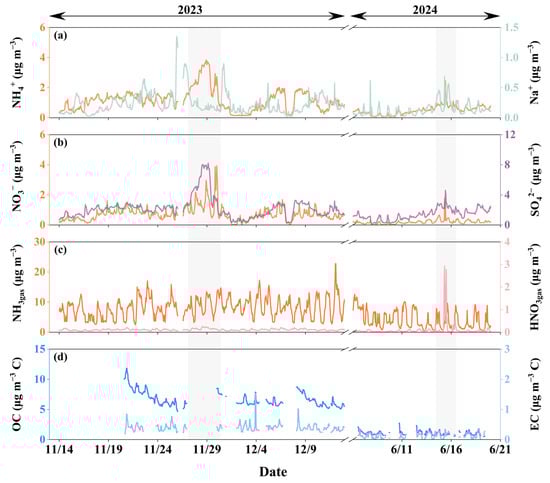
Figure 2.
Time series of various species concentrations in PM2.5 during the study periods in 2023 and 2024. Panels (a,b) show the concentrations of NH4+, Na+, NO3−, and SO42−; panel (c) displays the concentrations of NH3 and HNO3* gases; panel (d) shows OC and EC concentrations in PM2.5. The shaded gray areas indicate periods with notable peaks in NO3− concentrations, during which case studies were conducted.
In contrast, the diurnal variations in the concurrently observed HNO3*gas were consistently clear, with peaks around noon and before sunset, and troughs before sunrise (Figure 2c). Similarly, NH3gas also showed a consistent diurnal pattern, with peaks shortly after sunrise and around midnight, and minima before and after sunset. The comparison with ion variations in PM2.5 suggests that diurnal meteorological factors (such as T, RH, wind speed, wind direction, sunlight, and planetary boundary layer height) may significantly influence the concentration variations of each component. The sources of ions in PM2.5 appeared more variable than HNO3*gas and NH3gas.
Furthermore, during the one-month observation period, atmospheric NH3gas concentrations fluctuated around 8.2 ± 3.3 μg m−3, with a maximum of 23 μg m−3 and a minimum of 2.5 μg m−3. In contrast, HNO3*gas concentrations remained much lower, fluctuating around 0.1 ± 0.04 μg m−3, with the maximum of 0.3 μg m−3. Despite the fact that the formation of particulate [NO3−]PM2.5 is governed by the product of NH3 and HNO3 concentrations [13], the markedly lower levels of HNO3*gas suggest that it was a more significant limiting factor for [NO3−]PM2.5 formation in this environment. The carbonaceous components in PM2.5, particularly OC, significantly exceeded the concentrations of inorganic ions, with concentrations ranging from 4.7 to 12 μg m−3 C (6.7 ± 1.3 μg m−3 C). The corresponding EC concentrations ranged from 0.2 to 1.5 μg m−3 C (0.4 ± 0.1 μg m−3 C), which were slightly lower than [NO3−]PM2.5. The high OC and OC/EC ratios might be related to nearby cooking emissions and/or transported biomass burning, as suggested by the concurrently low SO42− and NO3− concentrations [61].
Consistent with the November-December 2023 data, [NO3−]PM2.5 in June 2024 remained low at 0.2 ± 0.1 μg m−3, except on June 16. The highest value during the period, excluding June 16, was 0.7 μg m−3. However, on June 16, [NO3−]PM2.5 spiked to 1.8 μg m−3, markedly exceeding concentrations before and after that day. During the two-week observation period, [NO3−]PM2.5 exhibited clear diurnal variation, though the timing and width of the daily peaks were inconsistent, suggesting the complexity of its influencing factors. A weak correlation was observed between [NO3−]PM2.5 and the corresponding SO42− and NH4+ concentrations (R2 = 0.46 and 0.51, respectively; p-value < 0.01), whereas SO42− and NH4+ were strongly correlated (R2 = 0.88, p-value < 0.01). These results suggest that NO3− in PM2.5 partly existed as NH4NO3, while SO42− primarily formed NH4+ salts. A significant correlation was found between NO3− and Na+ in PM2.5 (R2 = 0.64, p-value < 0.01), indicating that aged sea salts, such as NaNO3, may have contributed to nitrate formation.
The diurnal variation in the concurrently observed NH3gas concentrations exhibited strong fluctuations, but peak timing and shape varied considerably. During the period, NH3 ranged from 0.5 to 13 μg m−3. Concentrations below 1 μg m−3 predominantly occurred between midnight and sunrise. The diurnal variation in HNO3*gas generally showed an inverse pattern to NH3gas, except on 16 June. HNO3*gas concentrations fluctuated around 0.06 ± 0.06 μg m−3, with the maximum of 0.6 μg m−3. However, nighttime concentrations remained below 0.1 μg m−3. On 16 June, between 06:00 and 12:00, HNO3*gas concentrations exceeded 2 μg m−3 during four separate intervals. The impact of high concentrations of HNO3*gas on [NO3−]PM2.5 is discussed later. The carbonaceous components in PM2.5 exhibited relatively low concentrations. Specifically, OC ranged from 0.5 to 2.7 μg m−3 C (1.1 ± 0.4 μg m−3 C), while EC ranged from 0.01 to 0.4 μg m−3 C (0.1 ± 0.1 μg m−3 C). These values ranked among the lowest compared to recent U.S. measurements [62]. The low OC and EC levels were likely due to the southwest monsoon, which transported clean oceanic air masses.
3.2. Thermodynamic Equilibrium Simulations for the Four Cases
To understand the causes for NO3− peaks in PM2.5, thermodynamic equilibrium simulations were conducted to examine the gas–aerosol partitioning states. Figure 3 shows a comparison between the thermodynamic equilibrium simulations and the observations for HNO3gas, NH3gas, and HClgas. During 27–29 November 2023, simulated HNO3gas concentrations deviated from the 1:1 line in over 90% of the time, indicating that NO3− in PM2.5 had not reached equilibrium with HNO3gas and was undergoing volatilization into the gas phase. The degree of deviation was independent of [NO3−]PM2.5 levels, as shown by the color scale in Figure 3. However, the simulation did not include K+, which may bind with a fraction of NO3−. K+ had an appreciable contribution in PM2.5, as analyzed in Section 3.3, Section 3.4, Section 3.5 and Section 3.6. This omission could partially explain the positive bias of the simulated HNO3gas. Nevertheless, due to the elevated atmospheric NH3 levels during this period, the impact of this omission is likely minimal. Moreover, on 27 and 29 November, approximately 10% of the data points aligned with the 1:1 line, suggesting that NO3− in PM2.5 and gaseous HNO3 reached equilibrium during these periods. In contrast, no negative deviations from the 1:1 line were observed, providing strong evidence against nitrate formation. It should be noted that observed HNO3* includes not only gaseous HNO3 but also N2O5, organic nitrate, and minor hydrolyzed NO2. This may introduce a positive bias in the observed HNO3gas, which could theoretically result in a negative deviation in the simulation. This effect is likely more pronounced at night, when N2O5 concentrations may exceed those of HNO3. However, no such negative deviations were observed. Additionally, excluding NaCl from the model led to a more pronounced overestimation of HNO3gas on 28 and 29 November, especially under high [NO3−]PM2.5 conditions (Figure S1). This suggests that some HNO3gas may undergo heterogeneous reactions with NaCl to form particulate NaNO3. However, the difference was negligible on 27 November.
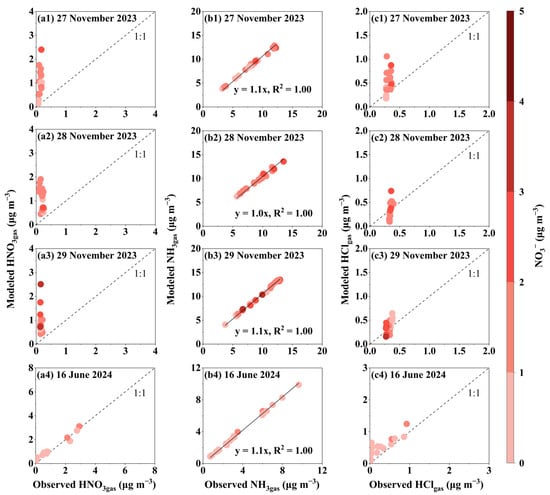
Figure 3.
Comparison of modeled and observed gas concentrations for 27–29 November 2023 and 16 June 2024. (a) Modeled HNO3gas vs. Observed HNO 3*gas. (b) Modeled NH3gas vs. Observed NH3gas. (c) Modeled HClgas vs. Observed HClgas. The color bar indicates NO3− concentration in µg m−3.
On 16 June 2024, the modeled HNO3gas concentrations closely aligned with the 1:1 line for case with higher-[NO3−]PM2.5 and were positively deviated from the 1:1 line to some extent for other cases. Again, excluding NaCl resulted in greater overestimation of HNO3gas, even in some high-[NO3−]PM2.5 cases. Thus, it can be inferred that 1) NO3− associated with NH4+ in PM2.5 was undergoing volatilization to HNO3gas; 2) NO3− associated with Na+ had reached gas–aerosol equilibrium on that day.
The simulated equilibrium NH3gas concentration slightly exceeded the observed values, primarily because the observed NH3gas concentration was sufficiently high, minimizing the impact of gas–particle equilibrium. The simulated HClgas concentration showed both positive and negative deviations from the 1:1 line. These inconsistencies may stem from sea salt and ammonium salts in externally mixed forms, which are treated as internally mixed in the thermodynamic simulation. Fresh sea salt tends to produce a positive deviation, whereas aged sea salt may lead to a negative one. Additionally, the observed HCl*gas includes contributions not only from pure HClgas but also from Cl2gas and ClNO2gas [63], potentially introducing a positive measurement bias that could account for negative deviations in the simulated HClgas concentrations.
From a theoretical perspective, the elevated atmospheric T typical of tropical regions facilitates the attainment of gas–particle equilibrium for NH4NO3, with timescales on the order of minutes [64,65]. The simulation results for 16 June also corroborated this behavior. However, in particles produced by fresh combustion, NH4NO3 may be encapsulated by organic material [66,67,68], significantly prolonging the time required to reach equilibrium.
3.3. Case 1: Synergistic Effects of Primary Emissions and Meteorological Conditions on the Rapid In-Plume Formation and Subsequent Volatilization of Fresh Ammonium Nitrate
The case analysis was further conducted to characterize the NO3− peaks. Case 1 is based on the observations obtained on 27 November 2023. Figure 4a–e display the concentrations of NO3−, NH4+, and Na+ in PM2.5, along with the concurrent atmospheric NH3gas concentrations, particle number size distributions, and PM2.5 mass concentrations at three national control sites in Sanya. They also included the correlation between the normalized [NO3−]PM2.5 and the sum of the particle number concentrations larger than 100 nm (N>100) (as defined in the caption of Figure 4), as well as 24 h air mass back trajectories. Figure S2a,b illustrate the correlations between NH4+ and NO3−, and between NH4+ and the equivalent concentrations of (NO3− + SO42−) in PM2.5. Figure 4a shows a bimodal distribution of [NO3−]PM2.5, with a lower peak at 09:00 and a higher peak at 20:00. The PM2.5 mass concentrations at the three national control sites also exhibited a similar bimodal distribution, except for a trough observed at the Junyue Sea-Beach station, likely related to localized showers. This suggested that the increase in [NO3−]PM2.5 may have been a widespread phenomenon. However, the air mass back trajectories indicated that (1) the sampling site was neither downwind nor upwind of the national control sites, and (2) the trajectories nearly overlapped during both the peak and the non-peak periods (Figure 4e). Therefore, it can be inferred that the atypical diurnal variations observed on that day were more likely due to local atmospheric processes rather than regional pollutant transport.
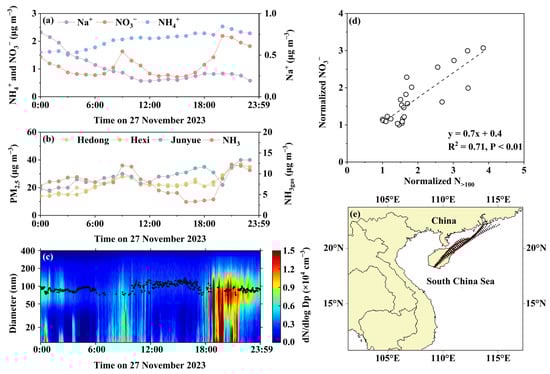
Figure 4.
Observational and calculated data on 27 November 2023. (a) Daily variations in NO3−, Na+, and NH4+ concentrations in PM2.5; (b) daily variations in PM2.5 mass concentrations at three national monitoring sites; (c) contour plotting of particle number size distributions; (d) correlation between normalized NO3− concentration and N>100, with the normalized values calculated by dividing all NO3− concentrations by the minimum NO3− concentration and all particle counts by the minimum particle count; (e) 24 h air mass back trajectories (red trajectories correspond to NO3− peaks).
The concentrations of NH4+ and Na+ in PM2.5 exhibited unidirectional increases and decreases in their diurnal variations, respectively, and neither correlated significantly with NO3− (Figures S2 and S3a). This indicates that sea salt and atmospheric NH3gas were not the dominant factors driving the [NO3−]PM2.5 increase. However, atmospheric NH3gas also displayed a bimodal distribution and was weakly correlated with NO3− (R2 = 0.32, p-value < 0.01). A more detailed analysis revealed that NH3gas concentrations lagged behind changes in [NO3−]PM2.5 (Figure 4a,b). Additionally, the strong correlation between the equivalent concentration of NH4+ and that of (NO3− + SO42−) (Figure S2) suggested that NH4+ in PM2.5 predominantly existed as inorganic ammonium salts. Thus, the delayed peaks of atmospheric NH3gas are more likely to be attributable to the volatilization of NH4NO3 [8,23,56], as supported by the thermodynamic equilibrium stimulation in Section 3.2. In this specific case, atmospheric NH3gas likely played a role in restricting its volatilization as gaseous (HNO3 + NH3).
Figure 4c shows that during the [NO3−]PM2.5 peak period, the median accumulation mode particle diameter (0.1 μm–1 μm) was notably smaller than during the lower [NO3−]PM2.5. Additionally, the normalized [NO3−]PM2.5 exhibited a strong positive correlation with the normalized N>100, with a regression slope of 0.7. Theoretically, when an increase in particle number concentration is observed without a corresponding increase in median mode diameter, this suggests that particulate matter mainly originates from primary emissions, rather than particle growth through secondary formation. Thus, the observed NH4NO3 at the moment should primarily originate from primary sources [23,54,63,64]. The slope below unity further supports that NH4NO3 was undergoing volatilization (Figure 4d). Furthermore, the number concentration spectra fluctuated dramatically during the NO3− peak periods (Figure 4c); this a typical feature that is indicative of the influence of nearby pollution sources.
3.4. Case 2: Biomass Burning-Derived Potassium Salts and Cloud Processing of KNO₃ and NH4NO3 by Mixing with Additional Anthropocentric Sources, Followed by NH4NO3 Volatilization
The second case occurred on 28 November 2023, with a diurnal [NO3−]PM2.5 pattern distinct from that observed on 27 November (Figure 4 and Figure 5). Between 00:00 and 20:00, [NO3−]PM2.5 remained relatively stable at 1.3 ± 0.2 µg m−3 (Figure 4a), followed by a statistically significant increase to 1.5–3.0 µg m−3 (p < 0.05). Notably, no corresponding increase in PM2.5 mass concentration was recorded at the three national control sites (Figure 5b). This suggested that the increase in [NO3−]PM2.5 was a localized phenomenon rather than a regional event. Simultaneous particle number size distributions revealed that, during the [NO3−]PM2.5 increase, the median diameter of the accumulation mode particles decreased rather than increased (Figure 5c). Furthermore, a strong positive correlation was identified between the normalized [NO3−]PM2.5 and the normalized N>100 (Figure 5d), with the regression slope of 2.2, which significantly exceeded unity. These results suggested that while primary sources contributed to the NO3− increase, they cannot fully explain the observed pattern.
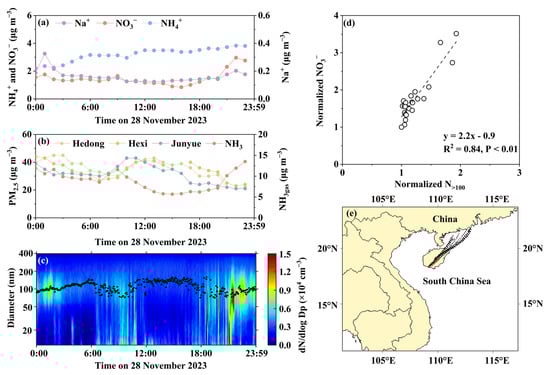
Figure 5.
Same as Figure 4, except on 28 November 2023.
On 28 November, the NH4+ and Na+ concentrations in PM2.5 exhibited diurnal variations similar to those observed on 27 November, but with larger fluctuations. Although no statistically significant correlation was identified between the NO3− and NH4+ concentrations in PM2.5 (p-value > 0.05, Figure S2c), NH4+ showed a strong correlation with the equivalent concentrations of (NO3− + SO42−), with a regression slope close to unity. Based on this, using 20:00–23:00 as the analysis window (t0, t1, t2, t3), the net increases in NH4+ concentrations at t1–t3 relative to t0 can be calculated by the difference. Assuming NH4+ was fully associated with (NO3− + SO42−) at a 1:1 equivalent concentration ratio, the net increase in NO3− from NH4NO3 at t1-t3 was 0.02 µg m−3, 0.04 µg m−3, and 0.05 µg m−3, accounting for 3.0%, 2.4%, and 4.2% of the total [NO3−]PM2.5 increase, respectively. Recall that thermodynamic equilibrium stimulation analysis indicated the volatilization of NH4NO3 into a gas phase. The significant increase in [NO3−]PM2.5 between 21:00 and 23:00 was likely related to the formation of other nitrates, such as KNO3 and NaNO3. However, the minimal increase in Na+ concentration in PM2.5 during this period (Figure 5a) suggested that NaNO3 may have accounted for only a small fraction. In contrast, a marked increase in K⁺ concentration was observed in PM2.5 between 21:00 and 23:00 (Figure S4), indicating that biomass burning emissions may be a major contributor [69,70]. Concurrently, atmospheric NH3 also increased (Figure 5b), probably from biomass burning emissions [33], while other anthropogenic or natural nighttime NH3 sources were considered unlikely [18,33,71]. It is noteworthy that, compared with 27 November, the nucleation mode in the particle number size spectrum nearly disappeared during the NO3− increase, implying that the biomass burning aerosols may have undergone atmospheric processing, such as cloud modification under non-precipitating conditions [60]. Therefore, the significant increase in [NO3−]PM2.5 during 21:00–23:00 was more likely driven by secondary formation processes within non-precipitating clouds, rather than direct primary emissions. Interestingly, a secondary increase in K+ also occurred between 01:00 and 03:00 on the same day (Figure S4), accompanied by a pronounced rise in particle number concentration within the accumulation mode (Figure 5c). Surprisingly, the NO3− in PM2.5 and the atmospheric NH3gas concentration showed almost no change during this period. Therefore, primary biomass burning aerosols and non-precipitation modification alone cannot fully explain the increase in [NO3−]PM2.5 between 21:00 and 23:00, leaving additional anthropogenic sources as co-contributors. Importantly, no significant shift was observed in the air mass back trajectories before and after the [NO3−]PM2.5 increase (Figure 5e).
3.5. Case 3: Transition from Regional Transport to Local Combustion Sources Induces Strong Phase Instability and NH₄NO₃ Volatilization
On 29 November 2023, [NO3−]PM2.5 exhibited two distinct periods: from 00:00 to 18:00 and after 18:00. During the first period, the variations in NO3− and NH4+ concentrations were consistent with the PM2.5 trends at the national monitoring stations (Figure 6a,b), suggesting a common regional source. In contrast, after 18:00, [NO3−]PM2.5 rapidly increased from 1.4 µg m−3 to 3.9 µg m−3, without a corresponding rise in PM2.5 concentrations at the national stations. Furthermore, the correlation between the NO3− and NH4+ concentrations in PM2.5 over the full day (R2 = 0.34) was significantly weaker than that during the first period (R2 = 0.92) (Figure S2e). These results support the hypothesis that the increase in [NO3−]PM2.5 after 18:00 was primarily attributable to local sources. Moreover, air mass trajectories during the period of elevated [NO3−]PM2.5 lay between two slightly divergent paths observed before 18:00 (Figure 6e).
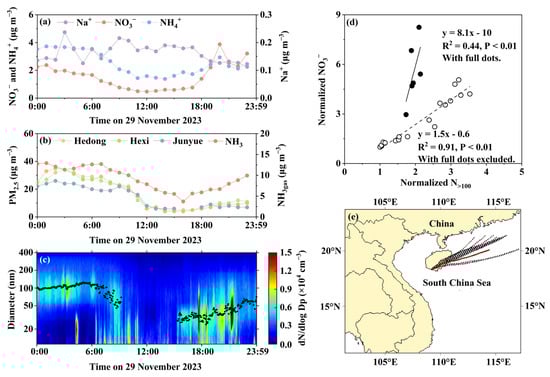
Figure 6.
Same as Figure 4, except on 29 November 2023.
However, whether the equivalent concentrations were calculated using data from 00:00 to 23:00 or from 00:00 to 18:00, the results consistently showed that [NH4+] = 0.9 × ([SO42−] + [NO3−]) + 0.02 (R2 = 0.99, p-value < 0.01) (Figure S1f). This suggested that NO3− in PM2.5 both before and after 18:00 primarily existed as NH4NO3. Consequently, the observed decrease in [NO3−]PM2.5 between 00:00 and 18:00, along with the reduced NH4NO3 fraction among ammonium salts, may be attributed to the volatilization of NH4NO3, which is consistent with previous thermodynamic simulations. However, the NH3gas released through this process was much smaller than the total reduction in ambient NH3gas concentrations. The concurrent decline in atmospheric NH3gas levels may have further promoted NH4NO3 volatilization (Figure 6b).
Additionally, the diurnal variations in Na+ and NO3− in PM2.5 were nearly opposite (Figure S3c), indicating that NO3− associated with NaNO3 in PM2.5 was likely negligible. After 18:00, the particle number size distributions showed that the smaller Aitken mode dominated the total concentration (Figure 6c). The median Aitken mode diameters fluctuated significantly on a minute scale and exhibited an overall increasing trend, although it remained much smaller than the accumulation mode diameter dominant before 06:00. According to particle emission fingerprints from different sources reported in the literature [72], the particles observed after 18:00 were most likely emitted from combustion sources rather than ambient nucleation processes [73].
Further analysis of the normalized [NO3−]PM2.5 and N>100 revealed a strong correlation from 00:00 to 18:00, with a regression slope of 1.5. By forcing the intercept to be zero, the slope decreased to 1.2 with the R2 values slightly down to 0.88. The slope was close to the unity, implying that primary emissions dominated and accounted for the observed [NO3−]PM2.5 with a minor fraction from secondary NO3− formation. However, it is likely that secondary NO3− formation occurred earlier during air mass transport to the observation site, as NH4NO3 appeared to have been predominantly volatilized from the particle phase; this finding is supported by the preceding thermodynamic analysis. In contrast, after 18:00, the correlation between normalized [NO3−]PM2.5 and N>100 weakened significantly, and the regression slope increased to 8.1. The slope value alone implied that the NO3− in PM2.5 was mainly derived from secondary sources, despite the fact that the observed HNO3*gas concentration remained relatively low (0.13–0.21 µg m−3). Therefore, the pathway of large-scale N2O5 production, which could promote NH4NO3 formation, is ruled out. On the contrary, NH4NO3 may have formed rapidly during the cooling of combustion plumes, followed by dilution and NH3-limited volatilization [23,54].
3.6. Case 4: Primary Emissions and Marine Aerosol Interactions Drive Diurnal Sea Salt-Restricted Nitrate Formation Under Southeast Monsoon Influence
Figure 7a–h show a unique case observed under the influence of the southeast monsoon. During this period, the nearby natural gas-fired power plant was intermittently located directly upwind of the sampling site. On 16 June 2024, the concentrations of NO3−, Na+, and NH4+ in PM2.5 exhibited distinct temporal patterns before and after 12:00 (Figure 7a). After 12:00, [NO3−]PM2.5 exhibited a bell-shaped temporal pattern closely resembling that of Na+ in PM2.5. The strong correlation between [NO3−]PM2.5 and Na+ in PM2.5 supported the heterogeneous formation of NaNO3 through the reaction between HNO3gas and sea salt aerosols [74]. In contrast, the low concentrations of HNO3gas and the results from thermodynamic simulations did not support the formation of NH4NO3 during the moments. Note that the diurnal variation in Na+ concentrations in PM2.5 was reasonably consistent with the tide height (Figure S5).
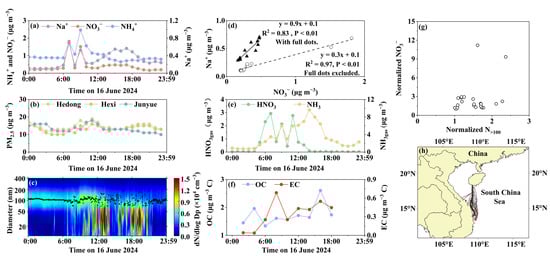
Figure 7.
Observations and calculations on 16 June 2024. (a) Daily variations in Na+, NO3−, and NH4+ concentrations in PM2.5; (b) daily variations in PM2.5 mass concentrations at three national monitoring sites; (c) contour plotting of particle number size distributions; (d) correlation between Na+ and NO3− concentrations in PM2.5 (empty and full symbols represent the values before and after 12:00); (e) daily variations in HNO3* and NH3 concentrations; (f) daily variations in OC and EC concentrations in PM2.5; (g) correlation between normalized [NO3−]PM2.5 and N>100; (h) 24 h air mass back trajectories (red trajectories correspond to peak periods).
Before 12:00, the concentrations of NO3−, Na+, and NH4+ all increased synchronously, exhibiting a bimodal distribution with peaks at 07:00 and 09:00. Three peaks of HNO3*gas were observed before 12:00 (2.1–2.9 µg m−3) and were approximately one order of magnitude higher than the other values recorded throughout the study. However, low concentrations of OC were recorded at only 1.3–1.6 µg m−3 during the peak periods. Although the concentration of EC increased to 0.7 μg m−3 between 08:00 and 10:00, the ratio of OC/EC was only 2.1, a typical value for primary particulate carbonaceous emissions [75]. Moreover, the PM2.5 levels at the three national sites did not increase proportionally during the peaks, indicating no large-scale influx of air pollutants. Therefore, the large sawtooth-pattern increases in [HNO3*gas] and [NO3−]PM2.5 were more likely associated with primary emissions and chemical conversion in fresh plumes from the nearby natural gas-fired power plant, rather than the secondary formation of HNO3*gas in low-concentration ambient air, followed by the heterogeneous reaction with sea salt aerosols [74]. In this case, the amount of sea salt aerosols appeared to be a controlling factor for [NO3−]PM2.5, as no corresponding peak in [NO3−]PM2.5 occurred concurrently with the third peak of HNO3*gas in the absence of a [Na+]PM2.5 peak. The [Na+]PM2.5 trough at 08:00 was likely caused by wet scavenging as low clouds passed over the hill (Figure S5).
Unlike the patterns observed on 27–29 November 2023, no significant correlation (p-value > 0.05) was found between normalized [NO3−]PM2.5 and N>100 on 16 June. The particle number size distributions showed an increase in the concentrations of accumulation mode particles after 08:00, which coincided with the increase in EC and NH4+ in PM2.5. These findings indicate that the power plant’s strongest emissions likely occurred between 08:00 and 12:00 and were consistent with the elevated HNO3*gas levels.
3.7. Source Apportionment of NO3− in PM2.5 During the Four Cases
The analysis of the observation cases from 2023 and 2024 highlights the critical role of both primary and secondary sources in partitioning the gas–particle distribution of nitrate. Therefore, this study quantitatively evaluated the contributions of aerosols from various sources to nitrate using the PMF model (Figure 8). In November, NO3− in PM2.5 was predominantly attributed to Factor 2 and Factor 5 only. Factor 5 contributed between 52% and 73%, while Factor 2 contributed between 26% and 46%. By contrast, on 16 June, Factor 1 made a limited contribution (4.6%), whereas the contribution from Factor 5 increased to 79%, and Factor 2 decreased to 16%.
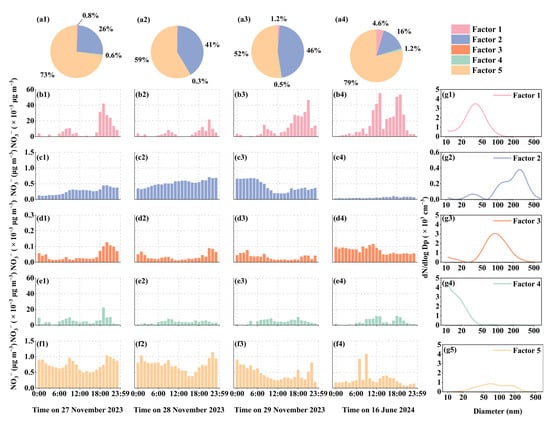
Figure 8.
Source apportionment and daily variation in NO3− in PM2.5. (a) Contribution of five factors to NO3−. (b–f) Daily variation in the contribution of each factor to NO3−. (g) The particle number size distribution profile of each factor.
Factor 1 exhibited a unimodal particle size distribution, with a median diameter centered at approximately 40 nm. This source factor displayed distinct peaks during both morning and evening rush hours, suggesting a potential association with non-electric vehicular emissions [72,73,76,77]. The relatively weaker morning peak may be attributed to the widespread use of electric motorcycles for commuting in tropical regions. In contrast, Factor 2 presented a complex trimodal size distribution, with the dominant mode characterized by a median particle diameter exceeding 200 nm. Despite this, its total number concentration was the lowest among all five factors, approximately an order of magnitude lower than those of Factors 1, 3, and 4, indicating that it likely represents a regional background source, particularly of marine origin [72,78]. Factor 3 demonstrated a bimodal distribution, with prominent peaks at approximately 70 nm and a minor mode below 20 nm. This factor was likely attributable to emissions from Chinese-style cooking, where high-temperature oil use leads to substantial particle generation, particularly between 18:00 and 20:00. However, its contribution to NO3− in PM2.5 was found to be negligible. Factor 4 was dominated by nucleation-mode particles, indicative of short atmospheric nucleation times. Its occurrence was more frequent during nighttime, implying that these events were likely influenced by transient coastal atmospheric conditions [78,79]. Correspondingly, this factor also exhibited a minimal contribution to NO3− levels in PM2.5. Lastly, Factor 5 displayed a bimodal particle size distribution and was primarily associated with emissions from a nearby natural gas-fired power plant (~1 km distance), with additional influence from regional background sources. Factor 5 exhibited a distinct trough in the particle size distribution of around 100 nm, a feature resembling the Hoppel effect modified distribution under an environmental supersaturation of 0.2%. This suggests that the gas-fired power plant plume, when emitted into an environment with a substantial temperature contrast, may promote the formation of microdroplets, thereby leading to an aerosol size distribution akin to that observed in non-precipitating cloud processing. Consequently, it is anticipated that Factor 5 will contribute a higher mass concentration of nitrate in winter compared to summer (Figure 8).
4. Conclusions
This study systematically investigates the dual regulatory effects of atmospheric NH3 on the formation and evaporation of NH4NO3 at a clean tropical coastal site. By integrating high-resolution field measurements, E-AIM modeling, and PMF source apportionment analysis, we demonstrate that NH3 plays a role in suppressing the volatilization of NH4NO3 under varying atmospheric conditions rather than acting solely as a precursor promoting its formation.
Multiple case studies revealed that the NH4NO3 in PM2.5 originated from both primary emissions—particularly from local combustion plumes and in-cloud processing of KNO3 and/or NH4NO3, especially under the influence of the northeast monsoon. However, this newly formed NH4NO3 is often thermodynamically unstable and undergoes rapid volatilization as plumes age and disperse. In contrast, during the southeast monsoon, the formation of particulate NO3− was primarily driven by heterogeneous reactions with sea salt aerosols, while NH4NO3 formation was suppressed due to limited HNO3gas availability and unfavorable thermodynamic conditions. The analysis showed that under regional accumulation scenarios, elevated NH3 concentrations significantly inhibited the volatilization of NH4NO3, enhancing the stability and persistence of particulate nitrate in PM2.5. E-AIM modeling consistently indicated persistent gas–particle partitioning disequilibrium. Even under NH3-rich conditions, particulate nitrate was often thermodynamically driven toward volatilization. Moreover, interactions with sea salt aerosols further diverted NO3− partitioning toward NaNO3 formation, particularly during marine air mass intrusion. PMF analysis identified five source factors, with regional background transport and emissions from a nearby natural gas power plant being the dominant contributors to nitrate in PM2.5. The nitrate associated with power plant emissions showed greater instability and higher susceptibility to volatilization, while marine background sources contributed more stable nitrate, especially under southeast monsoon conditions. This seasonal shift highlights how the interaction between source profiles and meteorological regimes shapes nitrate aerosol behavior.
These findings challenge the conventional understanding of nitrate formation as purely precursor-limited, highlighting the importance of simultaneously accounting for formation and volatilization dynamics. This study refines the understanding of NH4NO3 behavior in ammonia-rich marine boundary layers and has important implications for optimizing future nitrate control strategies in coastal and urban environments.
Supplementary Materials
The following supporting information can be downloaded at https://www.mdpi.com/article/10.3390/atmos16060685/s1, Figure S1: Comparison of modeled and observed gas concentrations for 27–29 November 2023 and 16 June 2024 using the E-AIM with only three components, including SO42−, NH4+, and NO3− as inputs. (a) Modeled HNO3 vs. Observed HNO3*. (b) Modeled NH3 vs. Observed NH3. The color bar indicates NO3− concentration in μg m−3. Figure S2: Correlations between NH4+ and NO3−, and NH4+ with the equivalent concentrations of (NO3− + SO42−) in PM2.5 from 27 to 29 November 2023 and 16 June 2024 (empty and full symbols represent the data before and after 18:00 in (c) and represent the data before and after 12:00 in (g,h)). Figure S3: Correlations between NO3− and Na+ in PM2.5 from 27 to 29 November 2023. Figure S4: (a,b) Correlations between NH3 and NO3− on 27–28 November 2023. (c) K⁺ Concentration from 24 November to 3 December 2023; Figure S5: (a) Sky picture taken on 16 June 2024. (b) Tidal height on 16 June 2024. Figure S6: PMF simulation closure validation results. (a,b) Closure of total particle size concentration before and after combination of particle size spectrum and [NO3−]PM2.5; (c) closure of the channel with the largest particle size in the particle size spectrum; (d) closure of [NO3−]PM2.5 (empty and full symbols represent the modeled values within 15% difference from the observations and beyond the 15% margins, respectively. Figure S7: Comparison of factor modes before and after replacing nitrate ion concentration in the last particle size channel.
Author Contributions
Methodology, X.Y., Y.G. (Yang Gao), and H.G.; formal analysis, X.Y., Y.G. (Yang Gao), and H.G.; data curation, L.S.; writing—original draft, H.H. and Y.G. (Yating Gao); writing—review and editing, H.H., Y.G. (Yating Gao), and X.Y. All authors have read and agreed to the published version of the manuscript.
Funding
This research was funded by the Natural Science Foundation of China, grant number 42276036 and the Hainan Provincial Natural Science Foundation of China, grant number 422MS098.
Institutional Review Board Statement
Not applicable.
Informed Consent Statement
Not applicable.
Data Availability Statement
The original data presented in the study are openly available at https://data.mendeley.com.
Acknowledgments
This work was supported by the Natural Science Foundation of China (grant no. 42276036) and the Hainan Provincial Natural Science Foundation of China (grant no. 422MS098).
Conflicts of Interest
The authors declare no conflicts of interest.
Abbreviations
AIM-IC, Aerosol Ion Monitor-Ion Chromatography; SMPS, Scanning Mobility Particle Sizer; E-AIM, Extended AIM Aerosol Thermodynamics Model; RH, relative humidity; T, temperature; N + 2*S, the sum of the molar concentration of nitrate and twice the molar concentration of sulfate; PM2.5, particulate matter with the aerodynamic diameter below 2.5 μm collected by AIM-IC.
References
- Barthelmie, R.J.; Pryor, S.C. Implications of ammonia emissions for fine aerosol formation and visibility impairment: A case study from the Lower Fraser Valley, British Columbia. Atmos. Environ. 1998, 32, 345–352. [Google Scholar] [CrossRef]
- Pathak, R.K.; Wu, W.S.; Wang, T. Summertime PM2.5 ionic species in four major cities of China: Nitrate formation in an ammonia-deficient atmosphere. Atmos. Chem. Phys. 2009, 9, 1711–1722. [Google Scholar] [CrossRef]
- Wang, X.; Ding, X.; Fu, X.; He, Q.; Wang, S.; Bernard, F.; Zhao, X.; Wu, D. Aerosol scattering coefficients and major chemical compositions of fine particles observed at a rural site in the Central Pearl River Delta, South China. J. Environ. Sci. 2012, 24, 72–77. [Google Scholar] [CrossRef] [PubMed]
- Park, R.S.; Lee, S.; Shin, S.-K.; Song, C.H. Contribution of ammonium nitrate to aerosol optical depth and direct radiative forcing by aerosols over East Asia. Atmos. Chem. Phys. 2014, 14, 2185–2201. [Google Scholar] [CrossRef]
- Zhang, R.; Wang, G.; Guo, S.; Zamora, M.L.; Ying, Q.; Lin, Y.; Wang, W.; Hu, M.; Wang, Y. Formation of urban fine particulate matter. Chem. Rev. 2015, 115, 3803–3855. [Google Scholar] [CrossRef]
- Höpfner, M.; Ungermann, J.; Borrmann, S.; Wagner, R.; Spang, R.; Riese, M.; Stiller, G.; Appel, O.; Batenburg, A.M.; Bucci, S.; et al. Ammonium nitrate particles formed in upper troposphere from ground ammonia sources during Asian monsoons. Nat. Geosci. 2019, 12, 608–612. [Google Scholar] [CrossRef]
- An, Z.; Huang, R.-J.; Zhang, R.; Tie, X.; Li, G.; Cao, J.; Zhou, W.; Shi, Z.; Han, Y.; Gu, Z.; et al. Severe haze in northern China: A synergy of anthropogenic emissions and atmospheric processes. Proc. Natl. Acad. Sci. USA 2019, 116, 8657–8666. [Google Scholar] [CrossRef]
- Sun, P.; Wang, J.; Liu, Y.; Nie, W.; Chi, X.; Xu, Z.; Ge, D.; Ren, C.; Zhu, C.; Huang, X.; et al. Enhanced particulate nitrate formation in residual layer exacerbates near-surface pollution: Insights from tethered airship and long-term ground measurements. J. Geophys. Res. Atmos. 2025, 130, e2024JD042672. [Google Scholar] [CrossRef]
- Pitchford, M.L.; Poirot, R.L.; Schichtel, B.A.; Malm, W.C. Characterization of the winter Midwestern particulate nitrate bulge. J. Air Waste Manag. Assoc. 2009, 59, 1061–1069. [Google Scholar] [CrossRef]
- Shon, Z.-H.; Kim, K.-H.; Song, S.-K.; Jung, K.; Kim, N.-J.; Lee, J.-B. Relationship between water-soluble ions in PM2.5 and their precursor gases in Seoul megacity. Atmos. Environ. 2012, 59, 540–550. [Google Scholar] [CrossRef]
- Shah, V.; Jaeglé, L.; Thornton, J.A.; Lopez-Hilfiker, F.D.; Lee, B.H.; Schroder, J.C.; Campuzano-Jost, P.; Jimenez, J.L.; Guo, H.; Sullivan, A.P.; et al. Chemical feedbacks weaken the wintertime response of particulate sulfate and nitrate to emissions reductions over the eastern United States. Proc. Natl. Acad. Sci. USA 2018, 115, 8110–8115. [Google Scholar] [CrossRef] [PubMed]
- Guo, H.; Sullivan, A.P.; Campuzano-Jost, P.; Schroder, J.C.; Lopez-Hilfiker, F.D.; Dibb, J.E.; Jimenez, J.L.; Thornton, J.A.; Brown, S.S.; Nenes, A.; et al. Fine particle pH and the partitioning of nitric acid during winter in the northeastern United States. J. Geophys. Res. Atmos. 2016, 121, 10355–10376. [Google Scholar] [CrossRef]
- Seinfeld, J.H.; Pandis, S.N. Atmospheric Chemistry and Physics: From Air Pollution to Climate Change, 3rd ed.; John Wiley & Sons: Hoboken, NJ, USA, 2016; ISBN 978-1-119-22116-6. [Google Scholar]
- Li, Y.; Schwandner, F.M.; Sewell, H.J.; Zivkovich, A.; Tigges, M.; Raja, S.; Holcomb, S.; Molenar, J.V.; Sherman, L.; Archuleta, C.; et al. Observations of ammonia, nitric acid, and fine particles in a rural gas production region. Atmos. Environ. 2014, 83, 80–89. [Google Scholar] [CrossRef]
- Wang, Q.; Zhang, Q.; Ma, Z.; Ge, B.; Xie, C.; Zhou, W.; Zhao, J.; Xu, W.; Du, W.; Fu, P.; et al. Temporal characteristics and vertical distribution of atmospheric ammonia and ammonium in winter in Beijing. Sci. Total Environ. 2019, 681, 226–234. [Google Scholar] [CrossRef] [PubMed]
- Watson, J.G.; Chow, J.C.; Lurmann, F.W.; Musarra, S.P. Ammonium nitrate, nitric acid, and ammonia equilibrium in wintertime Phoenix, Arizona. Air Waste Manag. Assoc. 1994, 44, 405–412. [Google Scholar] [CrossRef]
- Sharma, M.; Kishore, S.; Tripathi, S.N.; Behera, S.N. Role of atmospheric ammonia in the formation of inorganic secondary particulate matter: A study at Kanpur, India. J. Atmos. Chem. 2007, 58, 1–17. [Google Scholar] [CrossRef]
- Chen, D.; Yao, X.; Chan, C.K.; Tian, X.; Chu, Y.; Clegg, S.L.; Shen, Y.; Gao, Y.; Gao, H. Competitive uptake of dimethylamine and trimethylamine against ammonia on acidic particles in marine atmospheres. Environ. Sci. Technol. 2022, 56, 5430–5439. [Google Scholar] [CrossRef]
- Xu, Z.; Liu, M.; Zhang, M.; Song, Y.; Wang, S.; Zhang, L.; Xu, T.; Wang, T.; Yan, C.; Zhou, T.; et al. High efficiency of livestock ammonia emission controls in alleviating particulate nitrate during a severe winter haze episode in northern China. Atmos. Chem. Phys. 2019, 19, 5605–5613. [Google Scholar] [CrossRef]
- Saraswati; Sharma, S.K.; Saxena, M.; Mandal, T.K. Characteristics of gaseous and particulate ammonia and their role in the formation of secondary inorganic particulate matter at Delhi, India. Atmos. Res. 2019, 218, 34–49. [Google Scholar] [CrossRef]
- Franchin, A.; Fibiger, D.L.; Goldberger, L.; McDuffie, E.E.; Moravek, A.; Womack, C.C.; Crosman, E.T.; Docherty, K.S.; Dube, W.P.; Hoch, S.W.; et al. Airborne and ground-based observations of ammonium-nitrate-dominated aerosols in a shallow boundary layer during intense winter pollution episodes in northern Utah. Atmos. Chem. Phys. 2018, 18, 17259–17276. [Google Scholar] [CrossRef]
- Zhang, Z.; Guan, H.; Luo, L.; Zheng, N.; Xiao, H.; Liang, Y.; Xiao, H. Sources and transformation of nitrate aerosol in winter 2017-2018 of megacity Beijing: Insights from an alternative approach. Atmos. Environ. 2020, 241, 117842. [Google Scholar] [CrossRef]
- Shen, Y.; Meng, H.; Yao, X.; Peng, Z.; Sun, Y.; Zhang, J.; Gao, Y.; Feng, L.; Liu, X.; Gao, H. Does ambient secondary conversion or the prolonged fast conversion in combustion plumes cause severe PM2.5 air pollution in China? Atmosphere 2022, 13, 673. [Google Scholar] [CrossRef]
- Dang, R.; Jacob, D.J.; Zhai, S.; Yang, L.H.; Pendergrass, D.C.; Coheur, P.; Clarisse, L.; Van Damme, M.; Choi, J.; Park, J.; et al. A satellite-based indicator for diagnosing particulate nitrate sensitivity to precursor emissions: Application to East Asia, Europe, and North America. Environ. Sci. Technol. 2024, 58, 20101–20113. [Google Scholar] [CrossRef] [PubMed]
- Tsimpidi, A.P.; Karydis, V.A.; Pandis, S.N. Response of inorganic fine particulate matter to emission changes of sulfur dioxide and ammonia: The eastern United States as a case study. J. Air Waste Manag. Assoc. 2007, 57, 1489–1498. [Google Scholar] [CrossRef] [PubMed]
- Wen, L.; Xue, L.; Wang, X.; Xu, C.; Chen, T.; Yang, L.; Wang, T.; Zhang, Q.; Wang, W. Summertime fine particulate nitrate pollution in the North China Plain: Increasing trends, formation mechanisms and implications for control policy. Atmos. Chem. Phys. 2018, 18, 11261–11275. [Google Scholar] [CrossRef]
- Kim, N.K.; Kim, Y.P.; Ghim, Y.S.; Song, M.J.; Kim, C.H.; Jang, K.S.; Lee, K.Y.; Shin, H.J.; Jung, J.S.; Wu, Z.; et al. Spatial distribution of PM2.5 chemical components during winter at five sites in Northeast Asia: High temporal resolution measurement study. Atmos. Environ. 2022, 290, 119359. [Google Scholar] [CrossRef]
- Walker, J.T.; Whitall, D.R.; Robarge, W.; Paerl, H.W. Ambient ammonia and ammonium aerosol across a region of variable ammonia emission density. Atmos. Environ. 2004, 38, 1235–1246. [Google Scholar] [CrossRef]
- Ye, X.; Ma, Z.; Zhang, J.; Du, H.; Chen, J.; Chen, H.; Yang, X.; Gao, W.; Geng, F. Important role of ammonia on haze formation in Shanghai. Environ. Res. Lett. 2011, 6, 024019. [Google Scholar] [CrossRef]
- Weber, R.J.; Guo, H.; Russell, A.G.; Nenes, A. High aerosol acidity despite declining atmospheric sulfate concentrations over the past 15 years. Nat. Geosci. 2016, 9, 282–285. [Google Scholar] [CrossRef]
- Wang, H.; Lu, K.; Chen, X.; Zhu, Q.; Wu, Z.; Wu, Y.; Sun, K. Fast particulate nitrate formation via N2O5 uptake aloft in winter in Beijing. Atmos. Chem. Phys. 2018, 18, 10483–10495. [Google Scholar] [CrossRef]
- Jo, H.-Y.; Lee, H.-J.; Jo, Y.-J.; Lee, J.-J.; Ban, S.; Lee, J.-J.; Chang, L.-S.; Heo, G.; Kim, C.-H. Nocturnal fine particulate nitrate formation by N2O5 heterogeneous chemistry in Seoul metropolitan area, Korea. Atmos. Res. 2019, 225, 58–69. [Google Scholar] [CrossRef]
- Bertram, T.H.; Thornton, J.A.; Riedel, T.P.; Middlebrook, A.M.; Bahreini, R.; Bates, T.S.; Quinn, P.K.; Coffman, D.J. Direct observations of N2O5 reactivity on ambient aerosol particles. Geophys. Res. Lett. 2009, 36, 2009GL040248. [Google Scholar] [CrossRef]
- Zhou, M.; Nie, W.; Qiao, L.; Huang, D.D.; Zhu, S.; Lou, S.; Wang, H.; Wang, Q.; Tao, S.; Sun, P.; et al. Elevated formation of particulate nitrate from N2O5 hydrolysis in the Yangtze River Delta region from 2011 to 2019. Geophys. Res. Lett. 2022, 49, e2021GL097393. [Google Scholar] [CrossRef]
- Yan, C.; Tham, Y.J.; Nie, W.; Xia, M.; Wang, H.; Guo, Y.; Ma, W.; Zhan, J.; Hua, C.; Li, Y.; et al. Increasing contribution of nighttime nitrogen chemistry to wintertime haze formation in Beijing observed during COVID-19 lockdowns. Nat. Geosci. 2023, 16, 975–981. [Google Scholar] [CrossRef]
- Zhao, X.; Zhao, X.; Liu, P.; Chen, D.; Zhang, C.; Xue, C.; Liu, J.; Xu, J.; Mu, Y. Transport pathways of nitrate formed from nocturnal N2O5 hydrolysis aloft to the ground level in winter North China Plain. Environ. Sci. Technol. 2023, 57, 2715–2725. [Google Scholar] [CrossRef]
- Behera, S.N.; Sharma, M.; Aneja, V.P.; Balasubramanian, R. Ammonia in the atmosphere: A review on emission sources, atmospheric chemistry and deposition on terrestrial bodies. Environ. Sci. Pollut. Res. 2013, 20, 8092–8131. [Google Scholar] [CrossRef]
- Zhu, L.; Henze, D.K.; Bash, J.O.; Cady-Pereira, K.E.; Shephard, M.W.; Luo, M.; Capps, S.L. Sources and impacts of atmospheric NH3: Current understanding and frontiers for modeling, measurements, and remote sensing in North America. Curr. Pollut. Rep. 2015, 1, 95–116. [Google Scholar] [CrossRef]
- Dammers, E.; Shephard, M.W.; Palm, M.; Cady-Pereira, K.; Capps, S.; Lutsch, E.; Strong, K.; Hannigan, J.W.; Ortega, I.; Toon, G.C.; et al. Validation of the CrIS fast physical NH3 retrieval with ground-based FTIR. Atmos. Meas. Tech. 2017, 10, 2645–2667. [Google Scholar] [CrossRef]
- Wu, L.; Ren, H.; Wang, P.; Chen, J.; Fang, Y.; Hu, W.; Ren, L.; Deng, J.; Song, Y.; Li, J.; et al. Aerosol ammonium in the urban boundary layer in Beijing: Insights from nitrogen isotope ratios and simulations in summer 2015. Environ. Sci. Technol. Lett. 2019, 6, 389–395. [Google Scholar] [CrossRef]
- Cao, H.; Henze, D.K.; Shephard, M.W.; Dammers, E.; Cady-Pereira, K.; Alvarado, M.; Lonsdale, C.; Luo, G.; Yu, F.; Zhu, L.; et al. Inverse modeling of NH3 sources using CrIS remote sensing measurements. Environ. Res. Lett. 2020, 15, 104082. [Google Scholar] [CrossRef]
- Van Damme, M.; Clarisse, L.; Franco, B.; Sutton, M.A.; Erisman, J.W.; Wichink Kruit, R.; Van Zanten, M.; Whitburn, S.; Hadji-Lazaro, J.; Hurtmans, D.; et al. Global, regional and national trends of atmospheric ammonia derived from a decadal (2008–2018) satellite record. Environ. Res. Lett. 2021, 16, 055017. [Google Scholar] [CrossRef]
- Wyer, K.E.; Kelleghan, D.B.; Blanes-Vidal, V.; Schauberger, G.; Curran, T.P. Ammonia emissions from agriculture and their contribution to fine particulate matter: A review of implications for human health. J. Environ. Manag. 2022, 323, 116285. [Google Scholar] [CrossRef] [PubMed]
- Yang, T.; Li, H.; Xu, W.; Song, Y.; Xu, L.; Wang, H.; Wang, F.; Sun, Y.; Wang, Z.; Fu, P. Strong impacts of regional atmospheric transport on the vertical distribution of aerosol ammonium over Beijing. Environ. Sci. Technol. Lett. 2024, 11, 29–34. [Google Scholar] [CrossRef]
- Guo, H.; Otjes, R.; Schlag, P.; Kiendler-Scharr, A.; Nenes, A.; Weber, R.J. Effectiveness of ammonia reduction on control of fine particle nitrate. Atmos. Chem. Phys. 2018, 18, 12241–12256. [Google Scholar] [CrossRef]
- Roig Rodelas, R.; Perdrix, E.; Herbin, B.; Riffault, V. Characterization and variability of inorganic aerosols and their gaseous precursors at a suburban site in northern France over one year (2015–2016). Atmos. Environ. 2019, 200, 142–157. [Google Scholar] [CrossRef]
- Dang, R.; Jacob, D.J.; Zhai, S.; Coheur, P.; Clarisse, L.; Van Damme, M.; Pendergrass, D.C.; Choi, J.; Park, J.; Liu, Z.; et al. Diagnosing the sensitivity of particulate nitrate to precursor emissions using satellite observations of ammonia and nitrogen dioxide. Geophys. Res. Lett. 2023, 50, e2023GL105761. [Google Scholar] [CrossRef]
- Pinder, R.W.; Dennis, R.L.; Bhave, P.V. Observable indicators of the sensitivity of PM2.5 nitrate to emission reductions—Part I: Derivation of the adjusted gas ratio and applicability at regulatory-relevant time scales. Atmos. Environ. 2008, 42, 1275–1286. [Google Scholar] [CrossRef]
- Meng, Z.; Xu, X.; Lin, W.; Ge, B.; Xie, Y.; Song, B.; Jia, S.; Zhang, R.; Peng, W.; Wang, Y.; et al. Role of ambient ammonia in particulate ammonium formation at a rural site in the North China Plain. Atmos. Chem. Phys. 2018, 18, 167–184. [Google Scholar] [CrossRef]
- Ge, B.; Xu, X.; Ma, Z.; Pan, X.; Wang, Z.; Lin, W.; Ouyang, B.; Xu, D.; Lee, J.; Zheng, M.; et al. Role of ammonia on the feedback between AWC and inorganic aerosol formation during heavy pollution in the North China Plain. Earth Space Sci. 2019, 6, 1675–1693. [Google Scholar] [CrossRef]
- Lin, Y.-C.; Zhang, Y.-L.; Fan, M.-Y.; Bao, M. Heterogeneous formation of particulate nitrate under ammonium-rich regimes during the high-PM2.5 events in Nanjing, China. Atmos. Chem. Phys. 2020, 20, 3999–4011. [Google Scholar] [CrossRef]
- Huang, X.; Qiu, R.; Chan, C.K.; Ravi Kant, P. Evidence of high PM2.5 strong acidity in ammonia-rich atmosphere of Guangzhou, China: Transition in pathways of ambient ammonia to form aerosol ammonium at [NH4+]/[SO42−] = 1.5. Atmos. Res. 2011, 99, 488–495. [Google Scholar] [CrossRef]
- Schiferl, L.D.; Heald, C.L.; Nowak, J.B.; Holloway, J.S.; Neuman, J.A.; Bahreini, R.; Pollack, I.B.; Ryerson, T.B.; Wiedinmyer, C.; Murphy, J.G. An investigation of ammonia and inorganic particulate matter in California during the CalNex campaign: CALNEX ammonia and inorganic fine PM. J. Geophys. Res. Atmos. 2014, 119, 1883–1902. [Google Scholar] [CrossRef]
- Xiao, H.; Xiao, H.-W.; Xu, Y.; Zheng, N.-J.; Xiao, H.-Y. Combustion-driven inorganic nitrogen in PM2.5 from a city in central China has the potential to enhance the nitrogen load of North China. J. Hazard. Mater. 2025, 483, 136620. [Google Scholar] [CrossRef] [PubMed]
- Ianniello, A.; Spataro, F.; Esposito, G.; Allegrini, I.; Hu, M.; Zhu, T. Chemical characteristics of inorganic ammonium salts in PM2.5 in the atmosphere of Beijing (China). Atmos. Chem. Phys. 2011, 11, 10803–10822. [Google Scholar] [CrossRef]
- Peng, W.; Zhu, B.; Kang, H.; Chen, K.; Lu, W.; Lu, C.; Kang, N.; Hu, J.; Chen, H.; Liao, H. Inconsistent 3-D structures and sources of sulfate ammonium and nitrate ammonium aerosols during cold front episodes. J. Geophys. Res. Atmos. 2024, 129, e2023JD039958. [Google Scholar] [CrossRef]
- Chow, J.C.; Watson, J.G.; Lowenthal, D.H.; Magliano, K.L. Loss of PM2.5 nitrate from filter samples in central California. J. Air Waste Manag. Assoc. 2005, 55, 1158–1168. [Google Scholar] [CrossRef]
- Yan, L.; Gao, Y.; Chen, D.; Sun, L.; Gao, Y.; Gao, H.; Yao, X. Seasonally dependent daytime and nighttime formation of oxalic acid vapor and particulate oxalate in tropical coastal and marine atmospheres. Atmosphere 2025, 16, 98. [Google Scholar] [CrossRef]
- Chen, D.; Shen, Y.; Wang, J.; Gao, Y.; Gao, H.; Yao, X. Mapping gaseous dimethylamine, trimethylamine, ammonia, and their particulate counterparts in marine atmospheres of China’s marginal seas—Part 1: Differentiating marine emission from continental transport. Atmos. Chem. Phys. 2021, 21, 16413–16425. [Google Scholar] [CrossRef]
- Sun, L.; Cui, W.; Ma, N.; Hong, J.; Zhu, Y.; Gao, Y.; Gao, H.; Yao, X. Variations in cloud concentration nuclei related to continental air pollution control and maritime fuel regulation over the Northwest Pacific Ocean. Atmosphere 2024, 15, 972. [Google Scholar] [CrossRef]
- Pikmann, J.; Drewnick, F.; Fachinger, F.; Borrmann, S. Particulate emissions from cooking: Emission factors, emission dynamics, and mass spectrometric analysis for different cooking methods. Atmos. Chem. Phys. 2024, 24, 12295–12321. [Google Scholar] [CrossRef]
- Cheng, B.; Alapaty, K.; Arunachalam, S. Spatiotemporal trends in PM2.5 chemical composition in the conterminous U.S. during 2006–2020. Atmos. Environ. 2024, 316, 120188. [Google Scholar] [CrossRef]
- Peng, X.; Wang, T.; Wang, W.; Ravishankara, A.R.; George, C.; Xia, M.; Cai, M.; Li, Q.; Salvador, C.M.; Lau, C.; et al. Photodissociation of particulate nitrate as a source of daytime tropospheric Cl2. Nat. Commun. 2022, 13, 939. [Google Scholar] [CrossRef] [PubMed]
- Wexler, A.S.; Seinfeld, J.H. The distribution of ammonium salts among a size and composition dispersed aerosol. Atmos. Environ. Part A Gen. Top. 1990, 24, 1231–1246. [Google Scholar] [CrossRef]
- Shiraiwa, M.; Seinfeld, J.H. Equilibration timescale of atmospheric secondary organic aerosol partitioning. Geophys. Res. Lett. 2012, 39, 2012GL054008. [Google Scholar] [CrossRef]
- Cai, J.; Zheng, M.; Yan, C.-Q.; Fu, H.-Y.; Zhang, Y.-J.; Li, M.; Zhou, Z.; Zhang, Y.-H. Application and progress of single particle aerosol time-of-flight mass spectrometry in fine particulate matter research. Chin. J. Anal. Chem. 2015, 43, 765–774. [Google Scholar] [CrossRef]
- Gunsch, M.J.; Liu, J.; Moffett, C.E.; Sheesley, R.J.; Wang, N.; Zhang, Q.; Watson, T.B.; Pratt, K.A. Diesel soot and amine-containing organic sulfate aerosols in an Arctic oil field. Environ. Sci. Technol. 2020, 54, 92–101. [Google Scholar] [CrossRef]
- Silvern, R.F.; Jacob, D.J.; Kim, P.S.; Marais, E.A.; Turner, J.R.; Campuzano-Jost, P.; Jimenez, J.L. Inconsistency of ammonium-sulfate aerosol ratios with thermodynamic models in the eastern US: A possible role of organic aerosol. Atmos. Chem. Phys. 2017, 17, 5107–5118. [Google Scholar] [CrossRef]
- Hecobian, A.; Liu, Z.; Hennigan, C.J.; Huey, L.G.; Jimenez, J.L.; Cubison, M.J.; Vay, S.; Diskin, G.S.; Sachse, G.W.; Wisthaler, A.; et al. Comparison of chemical characteristics of biomass burning plumes intercepted by the NASADC-8 aircraft during the ARCTAS/CARB-2008 field campaign. Atmos. Chem. Phys. 2011, 11, 13325–13337. [Google Scholar] [CrossRef]
- Allen, A.G.; Miguel, A.H. Biomass burning in the Amazon: Characterization of the ionic component of aerosols generated from flaming and smoldering rainforest and savannah. Environ. Sci. Technol. 1995, 29, 486–493. [Google Scholar] [CrossRef]
- Teng, X.; Hu, Q.; Zhang, L.; Qi, J.; Shi, J.; Xie, H.; Gao, H.; Yao, X. Identification of major sources of atmospheric NH₃ in an urban environment in northern China during wintertime. Environ. Sci. Technol. 2017, 51, 6839–6848. [Google Scholar] [CrossRef]
- Vu, T.V.; Delgado-Saborit, J.M.; Harrison, R.M. Review: Particle number size distributions from seven major sources and implications for source apportionment studies. Atmos. Environ. 2015, 122, 114–132. [Google Scholar] [CrossRef]
- Hopke, P.K.; Feng, Y.; Dai, Q. Source apportionment of particle number concentrations: A global review. Sci. Total Environ. 2022, 819, 153104. [Google Scholar] [CrossRef] [PubMed]
- Yao, X.; Fang, M.; Chan, C.K. Experimental study of the sampling artifact of chloride depletion from collected sea salt aerosols. Environ. Sci. Technol. 2001, 35, 600–605. [Google Scholar] [CrossRef] [PubMed]
- Yu, S.; Dennis, R.L.; Bhave, P.V.; Eder, B.K. Primary and secondary organic aerosols over the United States: Estimates on the basis of observed organic carbon (OC) and elemental carbon (EC), and air quality modeled primary OC/EC ratios. Atmos. Environ. 2004, 38, 5257–5268. [Google Scholar] [CrossRef]
- Ridolfo, S.; Amato, F.; Querol, X. Particle number size distributions and concentrations in transportation environments: A review. Environ. Int. 2024, 187, 108696. [Google Scholar] [CrossRef]
- Zhu, Y.; Shen, Y.; Li, K.; Meng, H.; Sun, Y.; Yao, X.; Gao, H.; Xue, L.; Wang, W. Investigation of particle number concentrations and new particle formation with largely reduced air pollutant emissions at a coastal semi-urban site in northern China. J. Geophys. Res. Atmos. 2021, 126, e2021JD035419. [Google Scholar] [CrossRef]
- Ueda, S.; Miura, K.; Kawata, R.; Furutani, H.; Uematsu, M.; Omori, Y.; Tanimoto, H. Number-size distribution of aerosol particles and new particle formation events in tropical and subtropical Pacific Oceans. Atmos. Environ. 2016, 142, 324–339. [Google Scholar] [CrossRef]
- Shen, Y.; Wang, J.; Gao, Y.; Chan, C.K.; Zhu, Y.; Gao, H.; Petäjä, T.; Yao, X. Sources and formation of nucleation mode particles in remote tropical marine atmospheres over the South China Sea and the northwest Pacific Ocean. Sci. Total Environ. 2020, 735, 139302. [Google Scholar] [CrossRef]
Disclaimer/Publisher’s Note: The statements, opinions and data contained in all publications are solely those of the individual author(s) and contributor(s) and not of MDPI and/or the editor(s). MDPI and/or the editor(s) disclaim responsibility for any injury to people or property resulting from any ideas, methods, instructions or products referred to in the content. |
© 2025 by the authors. Licensee MDPI, Basel, Switzerland. This article is an open access article distributed under the terms and conditions of the Creative Commons Attribution (CC BY) license (https://creativecommons.org/licenses/by/4.0/).