1. Introduction
The Northwest Pacific stands out as one of the world’s most active regions for tropical cyclone development, typically generating over twenty typhoons each year [
1,
2]. A considerable number of these systems impact the coastal regions of China, resulting in significant socio-economic losses [
3,
4]. With rapid urbanization and increasing population density in coastal zones, typhoon-induced hazards—such as high winds, torrential rainfall, and storm surges—are becoming more destructive, leading to heightened exposure and economic vulnerability. As a result, enhancing the precision of typhoon trajectory and strength predictions has emerged as a central theme in contemporary atmospheric research. Achieving this goal critically depends on the integration of advanced numerical weather prediction (NWP) models and high-resolution observational data (Bian et al.) [
5].
Traditional observational networks, including surface stations and radiosondes, provide limited spatial coverage over oceanic regions and are often inadequate for resolving the complex three-dimensional circulation of tropical cyclones. In contrast, the expansion of ground-based Doppler radar networks in recent years has significantly enhanced the capability to observe mesoscale structures in typhoons (Tian et al.) [
6]. Radar radial velocity offers high temporal sampling and effectively captures the dynamic wind field within convective zones, such as the eyewall and inner rainbands of tropical cyclones.
Numerous studies have demonstrated that assimilating radar observations—especially radial velocity and reflectivity—can substantially improve the initialization of wind and thermodynamic fields, thereby enhancing forecasts of typhoon track, intensity, and precipitation. For example, Tian et al. [
6] highlighted the limitations of conventional observations in offshore and mountainous regions, while Xu et al. [
7] showed that radial wind assimilation significantly improved forecasts of Typhoon Hato. Bian et al. [
5] examined the sensitivity of storm structure to horizontal length scale settings during the assimilation of Typhoon Linfa, emphasizing the importance of appropriate scale factor configuration. Li et al. [
8] applied a hybrid EnVar scheme within the WRF model, yielding substantial improvements in the simulation of Typhoon Jangmi. Xiao et al. [
9] proposed a reflectivity assimilation method that enhanced quantitative precipitation forecasts (QPF) for Typhoon Rusa. Gu et al. [
10] assimilated GTS and AWS data using the WRF 3DVAR system, improving the track and rainfall forecasts of the same storm. Wu et al. [
11] utilized polarimetric radar data to examine the kinematic and microphysical features of convection in Typhoon Nida’s outer rainbands, highlighting the value of dual-polarization radar in capturing mesoscale convective processes. Similar microphysical insights from Z
DR and K
DP columns were provided by Kumjian [
12], and hydrometeor identification techniques were further refined by Dolan et al. [
13]. Houze [
14] and Didlake and Houze [
15,
16] offered comprehensive observational analyses of tropical cyclone rainbands and inner-core structures that support such radar-based diagnostics. Intermittently integrating radar data from both sides of the Taiwan Strait has been found to be effective in enhancing short-term typhoon prediction, as evidenced by Zhao et al. [
17] during the Meranti typhoon event, while Li et al. [
18] applied cycling assimilation for Typhoon Megi, resulting in better agreement with observations. Zhu et al. [
19] and Shen et al. [
20] confirmed the effectiveness of ensemble-based radar data assimilation in capturing storm intensity evolution. Xiao et al. [
9] applied a WRF–EnKF system to Typhoon Hato, showing that reflectivity assimilation significantly improved simulations of both precipitation and thermodynamic structures.
In parallel, recent advances in data assimilation techniques have been applied to a variety of high-resolution observations beyond radar data, reinforcing the importance of assimilation methodology in improving typhoon forecasts. Foundational work by Hamill and Snyder (2000) [
21], Lorenc (2003) [
22], and Buehner (2005) [
23] laid the theoretical groundwork for hybrid data assimilation systems that combine static and flow-dependent background error covariances, offering improved dynamical balance and error representation in mesoscale forecasting. Building on these concepts, recent studies have extended hybrid and ensemble-based techniques to assimilate diverse observational sources. For example, Zhang et al. [
24] incorporated lightning data assimilation to enhance the intensity prediction of Super Typhoon Haiyan. Chen et al. [
25] highlighted the improvement achieved by applying a hybrid WRFDA framework to incorporate radio occultation observations from FORMOSAT-7/COSMIC-2 in the simulation of Typhoon Haishen. Wang et al. [
26] showed that assimilating three-dimensional wind fields derived from FY-4A GIIRS observations led to significant improvements in both track and intensity forecasts. These studies reflect the increasing sophistication and flexibility of data assimilation strategies in modern operational forecasting.
Beyond East Asia, assimilation methods have also been effectively implemented in other regions. For example, Tiesi et al. (2021) [
27] assimilated Sentinel-1 SAR wind speed data into the WRF model to improve the simulation of Mediterranean cyclones, demonstrating the potential of satellite-derived wind fields for severe weather forecasting in subtropical environments.
In the Atlantic basin, Li and Xue (2012) [
8] applied a hybrid ensemble-3DVAR system to assimilate radar radial velocity observations during Hurricane Ike (2008). Their results showed that combining flow-dependent background error covariances with high-resolution radar data significantly improved the representation of the storm structure and its forecasted intensity. Such cross-basin applications confirm that the performance of assimilation systems is highly sensitive to regional dynamics, observational density, and model configuration. These findings support the need for careful parameter tuning—such as background error length scales—to ensure effective assimilation across diverse tropical cyclone regimes.
The persistent challenges in radar data assimilation, despite previous progress, have drawn attention to factors like background error covariance. Among these, the horizontal length scale stands out for its crucial impact on assimilating detailed radar data. By applying dual-Doppler radar data, Shen et al. [
28] found that modifying scale parameters in both horizontal and vertical dimensions could significantly refine the structure of mesoscale systems. Later, Xu et al. [
29] and Shen et al. [
30] found that a smaller horizontal scale configuration significantly enhanced the analysis quality, particularly in the simulation of Typhoon Saomai.
Although the importance of horizontal scale factor tuning has been widely recognized, its direct impact on forecast accuracy—particularly regarding typhoon track, intensity, and precipitation in the Northwest Pacific—has not yet been systematically investigated.
To investigate the influence of horizontal scale factor configurations on typhoon simulations, this study applies the WRF-3DVAR data assimilation framework to incorporate ground-based radar radial velocity observations. Three core research objectives are defined:
- (1)
to assess the differences in forecast performance of Typhoon Doksuri’s track, intensity, and precipitation under various horizontal length scale factor configurations;
- (2)
to evaluate the accuracy of simulating key structural features such as the typhoon eye and rainbands and to investigate the underlying physical mechanisms;
- (3)
to identify an optimal horizontal scale factor selection strategy, offering practical insights for operational typhoon forecasting and the future development of radar data assimilation systems.
The remainder of this paper is organized as follows:
Section 2 describes the numerical model and data assimilation methodology.
Section 3 presents an overview of Typhoon Doksuri and the experimental design.
Section 4 discusses the results, focusing on forecast accuracy and storm structure representation under different assimilation schemes.
Section 5 concludes the paper and provides recommendations for future work.
2. Methodologies
The Weather Research and Forecasting (WRF) Data Assimilation (WRFDA) system, developed by the National Center for Atmospheric Research (NCAR), provides three primary data assimilation approaches: three-dimensional variational (3DVAR), four-dimensional variational (4DVAR), and hybrid variational-ensemble methods. In this study, the 3DVAR method is employed for data assimilation. This approach constructs a cost function that represents the difference between the model state and observations and minimizes it using numerical iterative algorithms to obtain an analysis field that best approximates the true atmospheric state. In the 3DVAR framework, the cost function quantifies the discrepancy between model background and observations, typically expressed in the following mathematical form.
The cost function J in the 3DVAR system quantifies the total discrepancy between the model background state and the observations. In this formulation, represents the analysis state vector and is the background state. The observation vector is denoted by . The matrices and correspond to the background error covariance and observation error covariance, respectively. The operator maps the model state variables into the observation space, allowing for a weighted comparison. This structure enables the effective integration of observational information and background data based on their relative uncertainties.
The Weather Research and Forecasting Data Assimilation (WRFDA) system, developed by NCAR, supports a variety of assimilation strategies, including 3DVAR, 4DVAR, and hybrid ensemble-based approaches. In this study, we adopt the three-dimensional variational (3DVAR) method, which estimates the optimal atmospheric state by minimizing a cost function that balances the discrepancies between the background and observational data. This process involves two essential statistical components: the background error covariance matrix (), which quantifies uncertainty in the model background state, and the observation error covariance matrix (), which represents the estimated errors in the observations. To bridge the model and observational spaces, an observation operator is applied to project model variables into the space where observational data reside, thus enabling effective comparison and assimilation.
The background error covariance matrix (
) is calculated using the classical National Meteorological Center (NMC) method [
31], which derives error statistics based on forecast differences at various lead times but with the same verification time (e.g., comparing 12-h and 24-h forecasts valid at the same hour). In this study, WRF model forecasts from June 2023 are adopted as input data. Forecasts are produced every 12 h, each time generating both 12-h and 24-h forecasts valid at the same verification hour. The control variables in the assimilation process include the zonal (
) and meridional (
) wind components [
32,
33]. Using U and V wind components as control variables allows the assimilation system to better resolve the vortex structure consistent with the typhoon’s intrinsic dynamics. Although only radar radial velocity data were directly assimilated, adjustments to the horizontal wind can indirectly influence the temperature and humidity through the following mechanisms: Matrix B statistically links wind perturbations with temperature and humidity perturbations. Besides, wind adjustments may alter temperature gradients via geostrophic balance or thermal wind relations, thereby modifying the temperature analysis. Wind adjustments can indirectly alter humidity distribution by modifying moisture transport patterns. The best track data of Typhoon Doksuri used for forecast verification in this study were obtained from the Shanghai Typhoon Institute of the China Meteorological Administration (CMA) [
1,
2]. The dataset includes six-hourly information on the storm center location, maximum sustained wind speed, and minimum sea-level pressure.
3. Case and Experiments
3.1. Overview of Typhoon Doksuri (2305)
Doksuri originated over the northwestern Pacific, to the east of the Philippines, around 1200 UTC on 20 July 2023. Initially classified as a tropical storm, it moved generally in a northwesterly direction. By 1200 UTC on July 21, the system had strengthened into a severe tropical storm, exhibiting a minimum pressure of 998 hPa and peak winds of 18 m/s. Over the following two days, Doksuri continued to strengthen and reached typhoon status by 0000 UTC on July 23. Its intensity increased rapidly, and by 1800 UTC on July 24, it had developed into a Super Typhoon(superTY), with a minimum central pressure of 925 hPa and maximum wind speeds of 58 m/s.
Initially moving westward at a relatively slow speed, Doksuri’s forward speed increased significantly by July 24 at 0600 UTC while simultaneously veering northwestward and undergoing rapid intensification. At that time, its intensity peaked, characterized by a lowest central pressure measuring 915 hPa and sustained winds reaching up to 62 m/s. While skirting Luzon Island and entering the South China Sea, the typhoon experienced a sudden deceleration, and its track gradually shifted northward. During this period, it temporarily weakened from a super typhoon (SuperTY) to a severe typhoon (STY), but by 0900 UTC on July 27, it re-intensified into a super typhoon before making landfall in Jinjiang, Fujian Province. After landfall, Doksuri continued to move northwestward at a steady pace and rapidly weakened.
Typhoon Doksuri was characterized by extreme intensity, rapid and large fluctuations in strength, and highly variable movement speed. Its track and development were influenced by multiple synoptic-scale systems, including the subtropical high and associated troughs, resulting in a trajectory that alternated between westward and northward movement.
Furthermore, Doksuri ranked among the most intense and hazardous cyclones to strike China in 2023. It was recognized as one of the year’s most severe natural catastrophes, impacting nearly 2.95 million individuals and resulting in direct economic damage valued at approximately 14.95 billion RMB.
3.2. Quality Control of Radar Data
The radar radial velocity (Vr) data used in this study were obtained from China’s next-generation weather radar station, with a radar elevation angle of 1.5° and an observation time of 1759 UTC on 27 July 2023, as shown in
Figure 1. The raw Vr data are often affected by ground clutter, non-meteorological target echoes, and velocity aliasing and thus require strict quality control procedures before assimilation.
To enhance the reliability of the observations, this study adopted the same quality control procedure as Shen et al. (2022) [
33]. The raw radar observations were first formatted using 88d2arps within the ARPS framework, followed by preliminary quality checks. Next, the SOLO--II(Software for Editing and Display of Radar Data) software, developed by NCAR, was used for manual or automated editing to remove ground clutter, speckle noise, and echoes from non-meteorological targets. Furthermore, radar velocity aliasing was corrected using an idealized algorithm to ensure the continuity and physical consistency of the wind field.
The comparison between the quality-controlled and raw Vr data at the 1.5° elevation angle is shown in
Figure 1. It is evident that the quality-controlled data significantly reduces clutter interference, resulting in a clearer and more coherent wind field structure, which reflects the typical radial wind features of a tropical cyclone system. This provides higher-quality input data for subsequent data assimilation and model initialization. The quality control method has been widely applied in the study of tropical cyclones and other convective systems and has been proven to be stable and effective in several cases [
33,
34,
35].
3.3. Model and Experimental Setup
In this research, simulations were conducted using the Advanced Research WRF (ARW) model, version 4.1, coupled with the WRF-3DVAR assimilation system [
36]. The boundary and initial conditions were provided by the Final Analysis (FNL) product of the Global Data Assimilation System (GDAS) [
37], initialized at a resolution of 0.25° × 0.25°.
Figure 2 outlines the study area near 119.353° E and 26.724° N. A single domain setup without nesting was employed, comprising 601 × 601 horizontal grid points at 5 km spacing. The vertical structure consisted of 41 levels, with the model top defined at 10 hPa.
Regarding physics configuration, the simulation incorporated the WRF Single-Moment 6-class microphysics [
38], Kain–Fritsch convection scheme [
39], RRTM longwave [
40] and Dudhia shortwave radiation schemes [
41]. For planetary boundary layer and surface flux representation, the Yonsei University (YSU) scheme [
42] and the Noah land surface model [
43] were adopted, respectively. Additional settings included enabling cloud fraction physics, applying 21 land-use categories, and disabling the urban canopy scheme. Physics modules were refreshed every 5 min, while the PBL scheme was updated at each timestep.
The selection of these physical parameterization schemes was informed by previous WRF-3DVAR studies on typhoon forecasting, including Li et al. (2012) [
8] and Hsiao et al. (2012) [
44], which successfully employed similar configurations in radar data assimilation contexts. Future work will include sensitivity experiments to further investigate the impact of different physical parameterizations.
This study investigates how different configurations of background error length scales influence typhoon simulation performance through the design and execution of three numerical experiments. The experimental setup is schematically illustrated in
Figure 3, and detailed configuration parameters are presented in
Table 1.
The control experiment (CTRL) began at 0600 UTC on 27 July 2023 and ran through 1800 UTC on 28 July, covering a total simulation time of 36 h. Both assimilation experiments were launched at the same starting point, after a 6-h spin-up, to prepare the background field. Ground-based radar radial velocity data were assimilated hourly between 1200 and 1800 UTC on 27 July using the WRF-3DVAR system. The predictive results examined in this work cover the 24-h window starting at 1800 UTC on 27 July and ending at the same time on 28 July.
To evaluate the effectiveness of radar data assimilation under different configurations, this study conducted two sensitivity experiments focusing on distinct horizontal length scale factors (1.0 and 0.25) applied in the background error covariance matrix. Specifically, the experiment using a length scale factor of 1.0 is referred to as 3DVAR_a, while the one using 0.25 is denoted 3DVAR_b. Thus, 3DVAR_a represents the broader assimilation influence, whereas 3DVAR_b emphasizes more localized increments. A control experiment (CTRL), without any data assimilation, was also included for comparison. For clarity and conciseness, the following sections concentrate on analyzing the differences among these three representative cases.
The assimilation was performed using the CV7 control variable configuration, and the horizontal length scale factor (len_scaling) was applied uniformly across all control variables. This approach is consistent with the methodology described by Li et al. (2016) [
45], who demonstrated that tuning horizontal decorrelation length scales could effectively improve the assimilation of mesoscale storm features.
4. Analysis and Results
4.1. Analysis of the Circulation Situation
Figure 4 illustrates circulation features at the mid-tropospheric level (500 hPa) for 1200 and 1800 UTC on 27 July 2023. At 1200 UTC, Typhoon Doksuri was located over the northern sector of the South China Sea, moving in a northwesterly direction influenced by a southeasterly flow stemming from the southwestern flank of the subtropical ridge.
During this period, Doksuri maintained a well-organized and symmetric circulation structure, with a closed low evident in the 500 hPa geopotential height field. The upper-level divergence, particularly in the southeastern quadrant, remained favorable for sustaining convection and supporting intensity maintenance. Additionally, no significant vertical wind shear or mid-latitude disturbances were observed, providing a stable synoptic environment for typhoon development.
Notably, a developing tropical disturbance was identified to the southeast of Doksuri (approximately 10–15° N, 140–150° E), indicated by a weak cyclonic pattern in the height and wind fields. Although this system did not yet exert a direct influence, its potential future development may alter the configuration of the subtropical high or compete for upper-level outflow, thereby indirectly affecting the intensity and track of Doksuri. Thus, this disturbance should be considered as a potential environmental factor in subsequent analysis.
4.2. Analysis of the Wind Increments
Figure 5 shows the 700 hPa wind fields from the CTRL, 3DVAR_a, and 3DVAR_b experiments at 1200, 1500, and 1800 UTC on 27 July 2023. Across all time periods, the simulations depict cyclonic circulations with varying degrees of symmetry and intensity. Compared to CTRL, both assimilation experiments exhibit relatively tighter circulation patterns and stronger wind cores.
Figure 6 displays the wind speed differences between the assimilation runs and CTRL, providing a clearer view of the spatial structure modifications associated with different background error length scales.
At 1200 UTC, the CTRL simulation produces a relatively weak and loose wind field, with a maximum wind speed of 49.91 , lower than the best track reference (55 ). Strong winds are mainly located on the southern side, and the eye structure appears broad. In contrast, 3DVAR_a and 3DVAR_b show more concentrated wind bands around the center, with peak wind speeds reaching 63.89 and 59.76 , respectively. The circulation appears more organized in both assimilation runs, though some over-intensification may be noted.
By 1500 UTC, the typhoon moves closer to the southeastern coast of China, and the wind field becomes stronger in all experiments. CTRL reaches a peak of 52.63 , with a more contracted vortex. Both 3DVAR_a and 3DVAR_b simulations yield slightly higher values (61.54 and 61.31 , respectively). Wind speed enhancements are evident in the northern, southwestern, and eastern sectors, with notable asymmetries in both assimilation experiments. The enhancement zones appear more coherent and localized, particularly in 3DVAR_b.
At 1800 UTC, the typhoon intensifies further and nears landfall. CTRL simulates a peak of 58.63 , with the high wind region extending outward. Higher than both CTRL and best track value, 3DVAR_b reaches 67.05 . The structure shows more symmetric high-wind bands wrapping around the center. With compact features still present, 3DVAR_a records a relatively stable wind peak of 60.50 . The wind fields from both assimilation runs exhibit a smoother transition from the core to the outer bands, suggesting a more organized vortex structure.
The wind speed difference fields (
Figure 6) indicate that the spatial distribution of enhancements varies by experiment and time. Broader and more intense enhancement regions in multiple quadrants are shown by 3DVAR_b, especially to the north and southeast. In comparison, 3DVAR_a exhibits concentrated increases primarily on the northern and western flanks. These differences may be related to the varying sensitivity of assimilation configurations to local mesoscale features, which will be examined in subsequent sections.
4.3. Qualitative Analysis of Radial Velocity Errors
In order to assess the effectiveness of different data assimilation setups, the RMSE (root mean square error) corresponding to radial wind velocity was computed by comparing the analysis fields with radar measurements at each assimilation interval.
Figure 7 illustrates the RMSE evolution across seven assimilation cycles for the 3DVAR_a and 3DVAR_b experiments. These two experiments differ solely in their background error horizontal length scale settings.
In both experiments, RMSE values drop sharply immediately following each assimilation cycle, indicating that the integration of radial velocity observations from radar significantly enhances the depiction of near-surface wind structures. These reductions suggest that the assimilation process successfully corrects discrepancies between the background field and observations. The rapid rebound of RMSE following assimilation may result from several interacting factors, including dynamical and thermodynamical imbalances introduced during the assimilation process, inherent biases or unresolved small-scale features in initial conditions, and rapid adjustments associated with model physics parameterizations. These imbalances can trigger transient gravity wave activities and rapid model adjustments, contributing to quick error growth in the short-term forecast. Nonetheless, the gradual decreasing trend of RMSE observed over successive assimilation cycles demonstrates the overall benefit of radial velocity assimilation. Future efforts could focus on techniques such as incremental analysis updates, improved assimilation balance constraints, and refined model physics parameterizations to further reduce rapid error growth.
A comparison of the two configurations shows that 3DVAR_b consistently produces lower RMSE values than 3DVAR_a throughout all cycles. This indicates that the shorter horizontal length scale used in 3DVAR_b is more effective in constraining the wind field and preserving fine-scale observational features. The more compact and accurate analysis in 3DVAR_b suggests improved retention of mesoscale structures, particularly in the inner-core region of the typhoon.
These findings underscore the importance of tuning background error covariance parameters—especially horizontal length scale factors—in variational data assimilation. Selecting an appropriate scale can significantly enhance the quality of the initial analysis and improve short-term forecasting accuracy in high-impact tropical cyclone scenarios.
4.4. Analysis of the Typhoon Structure
To assess the impact of different assimilation strategies on the simulated structure of Typhoon Doksuri,
Figure 8 illustrates the near-surface wind speed at 10 m height, surface pressure (SLP), and associated wind direction fields, captured at 1800 UTC on 28 July 2023, for the CTRL, 3DVAR_a, and 3DVAR_b experiments. In the CTRL experiment (
Figure 8a), while the general cyclonic circulation is captured, the structure appears loose and disorganized. The eye is broad and lacks compactness, isobars near the center are widely spaced, and maximum wind speeds remain relatively low, indicating an underestimation of storm intensity. In contrast, 3DVAR_a (
Figure 8b) shows evident improvements in both wind intensity and pressure gradients. The eye contracts and peripheral wind bands become clearer, although asymmetries persist and the wind field still exhibits some elongation. Additionally, 3DVAR_b (
Figure 8c) yields the most coherent simulation, reproducing a concentric ring of strong winds encircling the eye. The isobars are densely packed, and the wind vectors form a symmetric cyclonic structure, reflecting a tighter and more organized vortex. These differences suggest that 3DVAR_b better assimilates inner-core observational information and more effectively reconstructs the typhoon’s compact structure.
The observed differences in structural compactness among the experiments can be attributed to the varying spatial influence imposed by different background error length scale settings. In the 3DVAR_b experiment, the smaller horizontal length scale (0.25) allows for more localized assimilation increments, preserving the fine-scale inner-core features captured by radar observations. This promotes a tighter, more symmetric wind field and sharper pressure gradients near the typhoon center. Conversely, the larger length scale in 3DVAR_a (1.0) disperses the observational influence over a broader area, which tends to smooth out sharp gradients and dilutes the vortex’s compactness. Additionally, because temperature and moisture fields were not directly assimilated, the assimilation impact primarily manifests in the dynamic (wind) field, making the tuning of the length scale particularly critical for structural realism. These results highlight that horizontal length scale tuning governs how efficiently radar-derived wind information is retained and translated into coherent vortex structures during initialization.
To build upon the horizontal diagnostics, this study further analyzes the vertical characteristics of Typhoon Doksuri. As shown in
Figure 9, the plotted cross-sections reveal the distribution of tangential wind and potential temperature (PT) across the storm’s central axis. The eyewall boundary is unclear, and the thermal gradient is not well developed. Additionally, 3DVAR_a (
Figure 9b) shows enhanced wind speeds, with peak values above 50
, but these winds extend unrealistically into the mid-to-upper levels, suggesting vertical over-propagation of assimilated signals. In contrast, 3DVAR_b (
Figure 9c) concentrates high winds within 1–3
and exhibits a more upright, vertically coherent vortex. The PT contours show a well-defined warm core near the center, with symmetric isentropic patterns and sharper gradients near the eye wall. These features indicate a more physically consistent thermodynamic structure in the 3DVAR_b simulation.
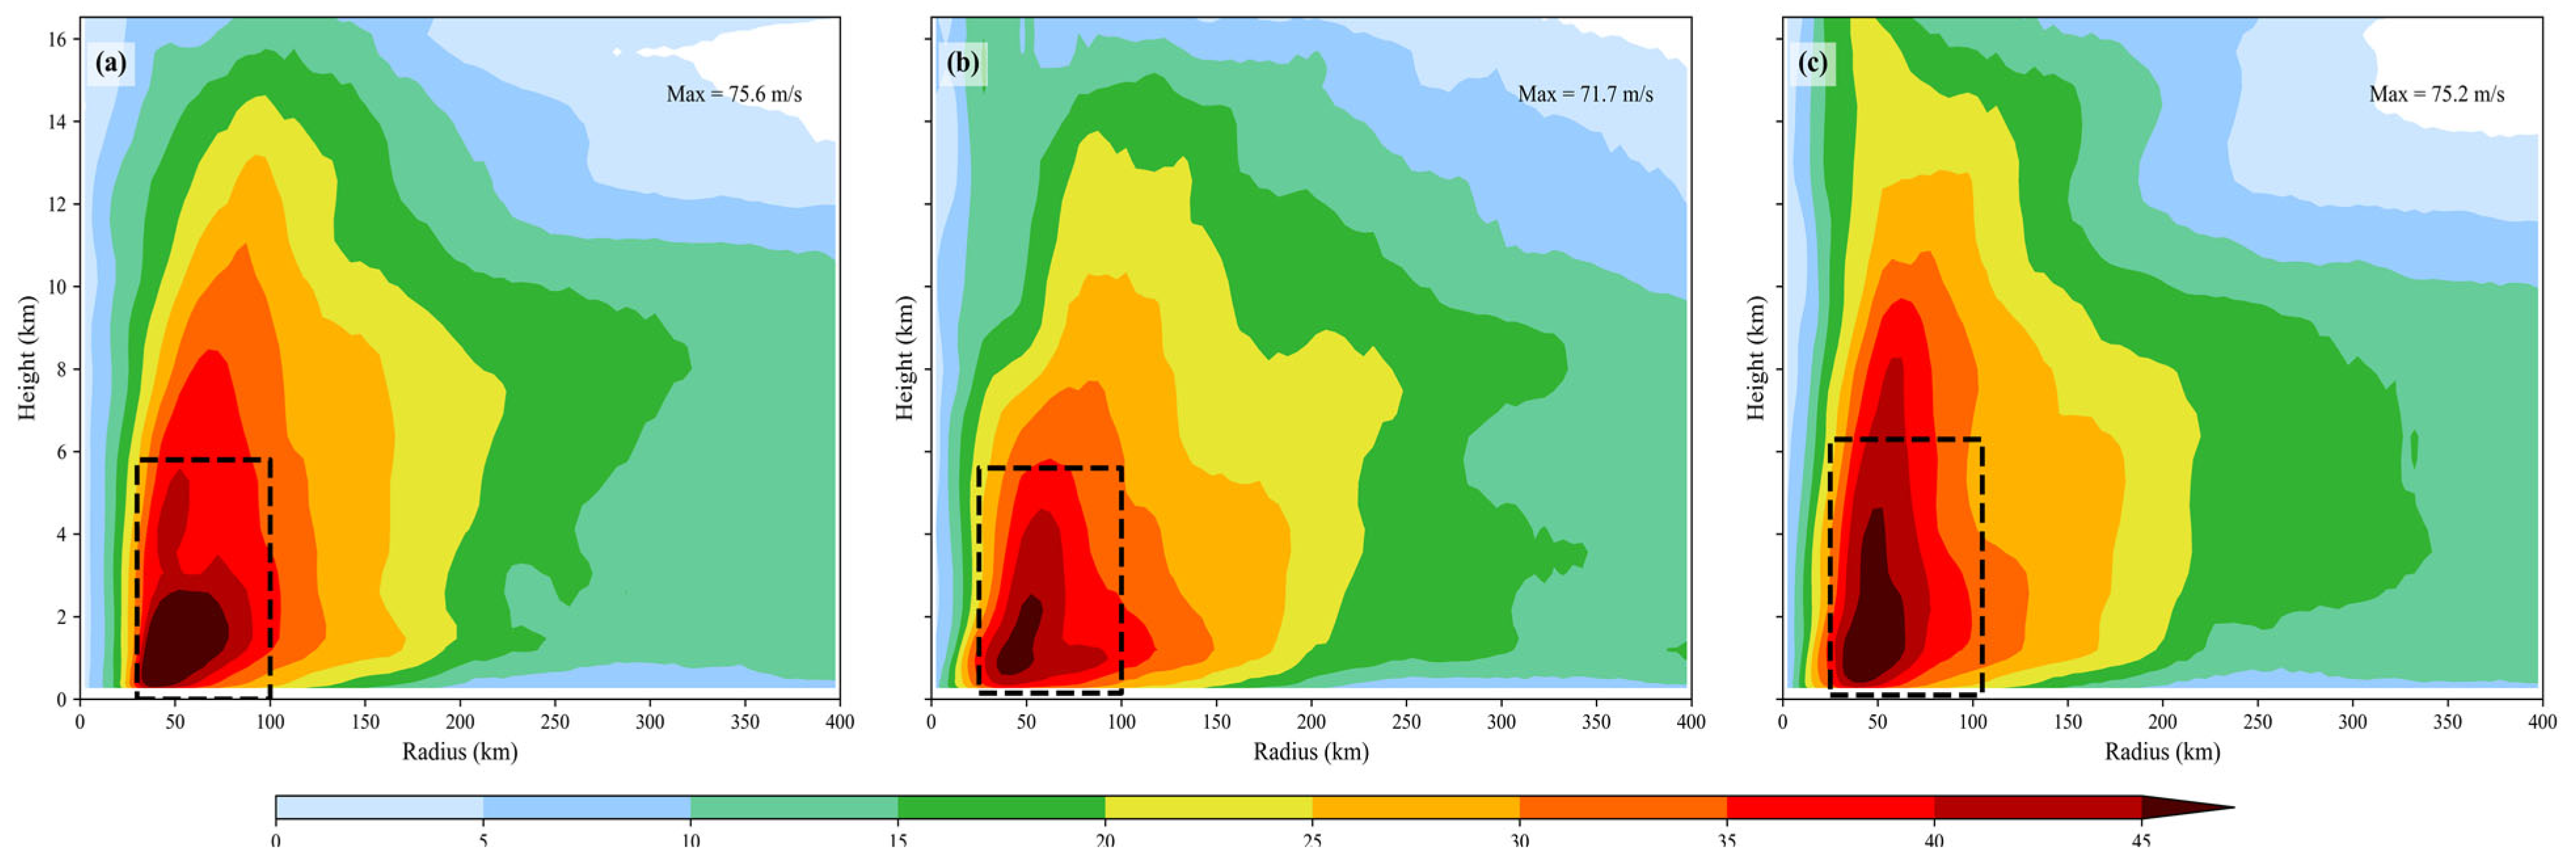
To further explore the three-dimensional vortex features,
Figure 10 presents azimuthally averaged cross-sections of tangential wind. In the CTRL run (
Figure 10a), the maximum tangential wind speed is below 50
, with a broad radius of maximum wind (RMW) and a weak radial gradient, reflecting a diffuse primary circulation. The 3DVAR_a case (
Figure 10b) increases wind intensity, but the strong wind zone remains broad and lacks sharp gradients. The 3DVAR_b experiment (
Figure 10c) shows the strongest and most compact tangential wind profile. The peak wind exceeds 54
and is confined within a 50
radius from the typhoon center. Vertically, the wind core extends from the surface to approximately 5
in height, showing both radial concentration and vertical alignment.
The above results suggest a progressive improvement in structural realism from CTRL to 3DVAR_a to 3DVAR_b. The tighter core, stronger wind gradients, and more symmetric thermal structure observed in 3DVAR_b underscore how the choice of horizontal scale in background error specification shapes the overall assimilation performance. While a larger horizontal length scale, as used in 3DVAR_a, helps spread observational influence more broadly, it may also dilute core signals and lead to a less accurate representation of the vortex. In contrast, the reduced length scale employed in 3DVAR_b enables better retention of mesoscale features from radar radial wind observations, thereby supporting a more balanced and compact vortex initialization. These findings indicate that the 3DVAR_b configuration provides a more reliable structural foundation for subsequent forecasts of track and intensity. Further diagnostic analysis of the assimilation impact mechanisms will be presented in the following sections.
To further assess the realism and theoretical consistency of the simulated typhoon structures, the azimuthally averaged tangential wind profiles were compared with conceptual models and observational composites. According to the axisymmetric theory proposed by Emanuel (1986) [
46], a mature tropical cyclone should exhibit an angular momentum-conserving structure with a compact eyewall, vertically aligned tangential wind maximum, and an outward-sloping radius of maximum wind (RMW). Similarly, Stern and Nolan (2009) [
47] analyzed Doppler wind retrievals from 17 real storms and confirmed that RMW generally slopes outward with height and closely follows absolute angular momentum surfaces.
In our simulations (
Figure 9 and
Figure 10), the 3DVAR_b experiment (panel c) most closely resembles these theoretical characteristics. It exhibits a distinct RMW that tilts outward with height, a vertically coherent wind core, and a strong gradient near the eyewall. The CTRL case (panel a) also shows a realistic RMW slope but lacks inner-core compactness, while 3DVAR_a (panel b) presents a shallow vortex with weaker upper-level winds and limited outward tilt. These comparisons confirm that the 3DVAR_b configuration is most effective in reproducing the canonical vertical structure of a mature typhoon.
4.5. Analysis of the Forecasting Results
To examine the impact of different horizontal scale settings on forecast skill—particularly regarding typhoon track and intensity—a 24-h deterministic run was conducted and evaluated against CMA’s official best-track dataset.
According to
Figure 11, notable differences in track forecast accuracy are observed across the three experimental setups. The 3DVAR_a experiment consistently exhibits the largest track errors throughout the forecast period. Its simulated typhoon center shows a persistent westward bias, especially after 12 h, resulting in a noticeable northward deviation at landfall. In contrast, 3DVAR_b performs relatively well during the early forecast stage, with track errors remaining small before 12 h, indicating a more effective initial position correction. However, its performance deteriorates rapidly in the later period, with track errors increasing sharply and exceeding 100
at 24 h. This degradation may stem from excessive smoothing or internal energy imbalance introduced by the overly short length scale.
Interestingly, although CTRL does not assimilate any radar radial wind data, it performs comparably well in terms of track forecasting, particularly after 12 h. Its track errors remain close to those of 3DVAR_a, suggesting that the forecast may benefit from some cancellation of initial condition errors. This highlights a critical point: while radar data assimilation can effectively correct the initial storm position, inappropriate parameter choices—such as the horizontal length scale setting—can introduce new forecast errors.
Figure 12 illustrates the evolution of storm intensity indicators, including central pressure (MSLP) and maximum winds near the surface (MSW), over the course of the forecast. The CTRL run maintains a more consistent intensity evolution and shows increasing similarity to CMA’s official track records with time.
Overall, the comparison underscores a key trade-off in radar data assimilation: while 3DVAR_b offers clear initial advantages in track accuracy and intensity representation, it suffers from instability in the later forecast stages. CTRL, despite lacking any assimilation, maintains forecast reliability—possibly due to a more balanced initial state. These results suggest that assimilation settings—particularly the horizontal length scale—must be carefully tuned to avoid introducing imbalances that degrade long-term forecast quality.
5. Conclusions and Discussion
This research explores the effect of assimilating radar radial velocity observations under varying horizontal length scale settings within the WRF-3DVAR assimilation framework. Focusing on Typhoon Doksuri (2023), two assimilation scenarios with horizontal length scale values of 1.0 and 0.25 are compared to assess their influence on storm structure, track accuracy, intensity estimation, and precipitation distribution.
Findings reveal that the selected length scale parameter significantly influences the efficiency of radar data assimilation. A smaller length scale (e.g., 0.25) leads to enhanced localization of observational influence, improving the representation of mesoscale features such as the typhoon eye and core circulation. The 3DVAR_b setup produced more realistic vortex structures with stronger gradients and symmetry compared to both CTRL and 3DVAR_a. From a forecasting perspective, incorporating radial wind data refines the initial state and improves short-term intensity and structure predictions. However, in longer forecast periods, excessive localization in 3DVAR_b introduces imbalances that degrade accuracy, while 3DVAR_a, though broader in observational spread, fails to resolve fine-scale inner-core details and results in larger track errors.
In terms of forecast performance, the assimilation of radial wind data improves the accuracy of initial conditions and enhances short-term predictions of typhoon intensity and structure. However, long-term benefits are sensitive to the choice of length scale. While 3DVAR_b aligns more closely with observed intensity and structure during the early stages, its performance deteriorates in the latter half of the forecast, likely due to imbalances introduced by excessive localization. In contrast, 3DVAR_a, despite spreading observational influence more broadly, fails to capture detailed inner-core structures and exhibits larger track errors.
The comparative analysis highlights a trade-off between the resolution of fine-scale features and the stability of forecast performance. An optimal length scale should balance the retention of mesoscale observational information with the maintenance of dynamical consistency within the model. Among the tested configurations, 3DVAR_b proves most effective in reconstructing the typhoon’s core structure, although further tuning may be necessary to mitigate late-stage forecast degradation.
Overall, this study emphasizes the importance of horizontal length scale configuration in radar data assimilation and offers practical insights for improving the forecasting accuracy of strong tropical cyclones. Future research should explore adaptive or flow-dependent covariance strategies—such as hybrid ensemble-variational approaches—to further enhance assimilation effectiveness. Additionally, incorporating multi-source observations and applying more advanced quality control procedures could yield further improvements in forecast reliability. These findings contribute to the ongoing refinement of data assimilation techniques for operational typhoon prediction systems, especially in regions frequently impacted by high-impact weather events.


