Article

El Niño Magnitude and Western Pacific Warm Pool Displacement. Part I: Historical Insights from CMIP6 Models

1
Department of Atmospheric and Oceanic Sciences, Fudan University, Shanghai 200438, China
2
Nanjing-Helsinki Institute in Atmospheric and Earth System Sciences, Nanjing University-Suzhou Campus, Suzhou 215163, China
*
Author to whom correspondence should be addressed.
Atmosphere 2025, 16(6), 680; https://doi.org/10.3390/atmos16060680
Submission received: 15 April 2025 / Revised: 29 May 2025 / Accepted: 2 June 2025 / Published: 4 June 2025
(This article belongs to the Section Climatology)

Abstract

Observations indicate a robust relationship between the magnitude of El Niño events and the longitudinal displacement of the eastern edge of the Western Pacific Warm Pool (WPWP). Are the state-of-the-art coupled models also capturing this strong relationship? Here, we address this question by analyzing the Coupled Model Intercomparison Project Phase 6 (CMIP6) models. The results show that 31 out of 33 models replicate the observed strong correlation between El Niño magnitude and WPWP displacement. However, the models overestimate both El Niño strength and the extent of eastward WPWP movement, while underrepresenting the inter-event variability. These findings support the notion that El Niño may be largely regarded as an eastward extension of the WPWP, while also highlighting some model–observation discrepancies that may warrant particular attention.

1. Introduction

El Niño is a significant factor in climate variability [1,2,3,4,5,6,7], exerting widespread regional and global impacts through atmospheric and oceanic teleconnections [8]. The effects of El Niño on global weather and climate are largely contingent upon its magnitude [9,10,11,12]. Recent studies have shown that the projected response of extreme El Niño events to global warming varies across different methodological approaches [13]. Therefore, accurately understanding and simulating the magnitude of El Niño events in climate models is essential for improving future climate projections and evaluating associated climate risks [14].
The most sophisticated instruments for the investigation of El Niño phenomena are the fully coupled climate models [15,16,17,18]. However, significant biases persist in their simulation of the El Niño–Southern Oscillation (ENSO). A significant concern is the underrepresentation of ENSO asymmetry [19,20,21,22,23], which not only affects the realism of current simulations but also reduces confidence in future projections of ENSO characteristics and associated teleconnections. Furthermore, the majority of studies do not explicitly differentiate between the magnitudes of El Niño and La Niña events, opting instead to utilize the standard deviation of the Niño3 or Niño3.4 index as a proxy for ENSO amplitude. Despite this methodological simplification, systematic biases continue to be evident in the simulated ENSO amplitude across various generations of models, ranging from Coupled Model Intercomparison Project Phase 3–6 (CMIP3-CMIP6) [19,20,21,23]. For example, most CMIP3 models overestimated the variability of Niño3 SST relative to observations [19]. During the overlapping simulation period of CMIP5 and CMIP6 (1950–1999), 12 out of 14 CMIP5 models underestimated Niño3 SST variability [20], while only 6 out of 19 CMIP6 models showed weaker variability than observed [23]. Although CMIP6 models exhibit enhancements in comparison to their CMIP3 and CMIP5 predecessors, significant uncertainties remain. In the assessment of CMIP6 models, Zhao and Sun [23] suggested that these models generally simulate a stronger ENSO amplitude. This phenomenon is attributed to a substantial overestimation of La Niña magnitude, while the overestimation of El Niño magnitude appears to be less pronounced. In addition to tropical dynamics, recent studies have highlighted the role of extratropical forcings—such as the Arctic Oscillation and Arctic Sea ice variability—in modulating ENSO amplitude [24,25,26]. The diversity among models in capturing these extratropical influences may also contribute to the biases in ENSO amplitude. Given these persistent discrepancies and the complex interplay of tropical and extratropical processes, a dedicated assessment of El Niño magnitude and its variability is necessary. This also has important implications for understanding ENSO’s response to global warming.
The Western Pacific Warm Pool (WPWP) is widely recognized as a significant heat source within the climate system [27] and plays an important role in the dynamics of El Niño events [28,29,30]. Observational data typically delineate the boundary of the WPWP by the 28 °C isotherm, which expands in response to increases in sea surface temperature (SST) [31]. In contrast to observational results, climate models often depict an excessively extended cold tongue to the west. Previous studies primarily focused on the time-mean state of the warm pool or cold tongue, while largely neglecting the variability of the WPWP boundary. Mechoso et al. [32] were the first to identify that numerous models exhibit a common bias of excessive cold tongue extension. They revealed that this may result from the models’ tendency to overly constrain the WPWP to the Western Pacific region. Kiehl [33] further corroborated the prevalence of this bias through the use of the Community Climate System Model Version 1 (CCSM1). Subsequent analyses utilizing models from the CMIP3, CMIP5, and CMIP6 have consistently indicated that this cold tongue bias persists in the time-mean state [19,21,23]. Given that the eastward expansion of the WPWP is closely associated with anomalous zonal currents and significantly contributes to SST anomalies in the eastern Pacific [34], accurately assessing its variability is essential for enhancing the dynamical simulation of the ENSO and improving the predictive capabilities related to climate change.
Numerous studies indicate that minor variations in SST and the longitudinal displacement of the WPWP significantly impact the characteristics of El Niño events [28,35,36,37]. The eastward expansion of the WPWP is closely associated with the frequency and intensity of westerly wind bursts (WWBs) in the tropical Pacific, which are widely acknowledged as critical precursors to the onset of El Niño [38]. Furthermore, the eastward displacement of the WPWP correlates with anomalous eastward currents, thereby creating conditions conducive to extreme El Niño events [34]. Recent research has also underscored the implications of WPWP variability for the diversity of ENSO [39,40]. However, a more comprehensive understanding of WPWP dynamics is necessary to accurately characterize its role in ENSO variability.
The CMIP6 models, representing the most recent generation of coupled general circulation models, integrate more complex climate processes compared to their predecessors from CMIP5. Many studies indicated significant enhancements in the simulations produced by CMIP6, particularly in accurately representing tropical rainfall patterns, SST distributions, and variability in the tropical Pacific region [41,42,43,44,45]. These developments establish a robust framework for exploring the relationship between the displacement of the WPWP boundary and the magnitude of El Niño events within CMIP6 models.
This study conducts a comprehensive analysis of the CMIP6 models in their simulation of El Niño magnitude and the displacement of the eastern edge of the WPWP. By evaluating historical simulations, this study aims to achieve two primary objectives: (1) to identify systematic biases in the representation of El Niño magnitude and WPWP displacement and (2) to assess the ability of CMIP6 models to accurately capture the observed relationship between El Niño and the WPWP.

2. Materials and Methods

In this study, observational SST data were sourced from the Hadley Centre Sea Ice and Sea Surface Temperature dataset (HadISST1) [46] for the period spanning 1929 to 2014, utilizing a grid resolution of 1° × 1°. Monthly anomalies were calculated by subtracting the monthly mean over the entire period and applying a quadratic detrending method to eliminate long-term trends. Quadratic detrending was used to account for slow baseline variations with nonlinear characteristics. This method was preferred over linear detrending due to its ability to capture curvature in the underlying trend, and over more complex filtering techniques because it reduces the risk of overfitting while preserving the integrity of the signal of interest.
Outputs from 42 models participating in CMIP6 are utilized, covering the period from 1929 to 2014, during which monthly SST data are available for the entire duration. Monthly anomalies were calculated by subtracting model-specific monthly climatologies, defined over 1929–2014, from the corresponding monthly data. A quadratic detrending, consistent with that applied to the observations, was then performed.
Prior to analysis, the outputs from each model are interpolated to a resolution of 1° × 1°, which is consistent with observational datasets. Based on previous studies [47,48], only one experiment per model is used, following a model democracy approach to ensure equal representation across models. This methodology mitigates the risk of overrepresenting models that have multiple experiments, thereby ensuring that each model contributes equitably to the evaluation of model agreement and the changes observed in the multi-model ensemble (MME) mean. The models employed, along with the selected realizations, are outlined in Table 1.
Recent studies suggest that ENSO exhibits inherent nonlinearity [49,50,51,52]. Skewness serves as one indicator of system nonlinearity [53,54]. For model selection, a key criterion is the presence of positive asymmetry in SST anomalies over the eastern equatorial Pacific, as positive SST skewness in this region is primarily governed by the nonlinear Bjerknes feedback. However, many models tend to underestimate this feature. A model that cannot adequately reproduce these fundamental features is unlikely—let alone able—to represent the relationship between El Niño magnitude and WPWP displacement. Among the 42 models analyzed, 33 demonstrate a positive skewness in the eastern equatorial Pacific SST anomaly over the period from 1929 to 2014 (Figure 1), with MME mean of 0.27. A more precise representation of ENSO skewness is associated with an improved characterization of ENSO dynamics [20,22,23]. Therefore, the 33 models exhibiting positive skewness have been selected for further analysis.
El Niño is characterized as the SST anomaly in the eastern equatorial Pacific region (5° S–5° N, 155° W–70° W) that exceeds 0.5 °C when averaged over the boreal winter months of November, December, and January (NDJ). The magnitude of El Niño is quantified by the SST anomaly in the eastern equatorial Pacific during the months of NDJ.
The WPWP is delineated by the 28 °C isotherm, with its eastern boundary defined by the longitudinal position of the 28 °C isotherm at the equator. The displacement of the eastern boundary of the WPWP is quantified as the deviation of the 28 °C isotherm from its climatological mean, where positive values signify an eastward shift.
The variability in the magnitude of El Niño events is quantified through the calculation of its standard deviation and range, which is defined as the difference between the most intense and the least intense El Niño occurrences. Similarly, the variability in the displacement of the eastern edge of the WPWP is assessed using both standard deviation and range, where the range is determined by the difference between the easternmost and westernmost positions of the WPWP’s eastern edge.
This study first assesses the performance of CMIP6 models in simulating the magnitude of El Niño and the displacement of the eastern edge of WPWP, with emphasis on both mean values and variability. The relationship between these two variables is then examined.

3. Results

3.1. Magnitude of El Niño Events in Historical Climate Simulations

The traditional metric for assessing the magnitude of El Niño events is the intensity of SST anomalies in the eastern equatorial Pacific. In this context, the CMIP6 models generally simulate stronger El Niño events than those recorded in observational data (Figure 2). Among the 33 models evaluated, 19 demonstrate a greater El Niño magnitude than what has been observed. Notably, the CMCC-ESM2 and MIROC-ES2L models simulate El Niño magnitudes of 1.78 °C and 1.94 °C, respectively, which significantly surpass the observed value of 1.16 °C. The MME for El Niño magnitude is calculated to be 1.24 °C, which is marginally higher than the observed 1.16 °C, indicating a generally reasonable level of agreement. Furthermore, the models EC-Earth3-Veg, FIO-ESM-2-0, MRI-ESM2-0, GFDL-ESM4, and KIOST-ESM exhibit El Niño magnitudes that are comparable to the observed values.
Figure 3 illustrates the distribution of SST anomalies during El Niño events, as observed and modeled by individual CMIP6 models. It corroborates the results in Figure 2, further indicating that CMIP6 models generally simulate more intense El Niño events when assessed through the lens of SST anomalies in the eastern equatorial Pacific. Notably, the CMCC-ESM2 and MIROC-ES2L models demonstrate significantly elevated SST anomalies in this region, which is consistent with the results in Figure 2. However, in comparison to observational data, the majority of models exhibit a tendency to simulate a warm anomaly that extends further westward, with the anomaly center shifting considerably to the west. For example, the CAS-ESM2-0 model shows warm anomalies that encompass nearly the entire equatorial Pacific, whereas the MCM-UA-1-0 model presents a warm anomaly center that reaches into the western equatorial Pacific.
Biases in simulating the magnitude of El Niño may affect the modeled sensitivity of El Niño strength to global warming. For example, models such as GISS-E2-2-G and NorESM2-LM, which produce stronger-than-observed El Niño events during the historical period, tend to project an increase in El Niño intensity under various warming scenarios [55]. As a result, such biases may lead to overestimated projections of associated hydroclimatic extremes, including heavy rainfall and drought.
The CMIP6 models generally exhibit an underestimation of the diversity in the magnitude of El Niño events (Figure 4). When assessed using the standard deviation of El Niño magnitude, 21 out of 33 models demonstrate a lower diversity than what is observed (Figure 4a). Notably, the GISS-E2-1-H model is the only model that reproduces a diversity level comparable to the observed data, and it is also recognized as one of the most effective models in simulating the amplitude of the ENSO [23]. The MME standard deviation is calculated to be 0.59 °C, which is slightly lower than the observed value of 0.65 °C. When diversity is quantified by the range of El Niño magnitudes, the underestimation becomes even more pronounced (Figure 4b). In this context, 23 out of 33 models simulate a diversity that is weaker than that observed. The models FIO-ESM-2-0, CMCC-CM2-SR5, and FGOALS-f3-L demonstrate the closest alignment with observed values. Furthermore, the MME mean range is also lower than the observed range (2.17 °C compared to 2.54 °C). Despite the differences in these two metrics of diversity, the results remain consistent—models that exhibit weaker diversity based on standard deviation also tend to show reduced diversity when measured by range, which is defined as the difference between the maximum and minimum values of magnitude.

3.2. WPWP in Historical Climate Simulations

The CMIP6 models generally depict a pronounced cold tongue that extends significantly to the west in the time-mean state. Additionally, these models tend to overestimate the eastward displacement of the eastern edge of the WPWP during El Niño events (Figure 5). Specifically, Figure 5a presents the 28 °C isotherms for the time-mean state, while Figure 5b depicts the 28 °C isotherms for composite El Niño events. Figure 5c,d illustrates the time-mean position of the eastern edge of the WPWP and the eastward displacement of this edge during El Niño events, respectively. In the time-mean state, the models typically simulate a cold tongue that extends excessively westward. The MME mean positions the eastern edge of the WPWP at 174°E, which is approximately 15° west of the observed location at 169°W. Among the 33 models assessed, 31 exhibit a cold tongue that extends further west than what is observed. This cold tongue bias has been consistently documented in prior evaluations of coupled climate models [19,20,21,23,56,57,58]. Notably, models such as GISS-E2-2-G and CAS-ESM2-0 demonstrate particularly pronounced westward extensions of the cold tongue. During El Niño events, the eastern edge of the WPWP in the MME mean remains biased towards the west when compared to observations (Figure 5b). Figure 5d quantifies these displacements, revealing that the eastward shift in the eastern edge of the WPWP in the MME is slightly greater than what is observed (22° vs. 20°). Despite these biases, certain models, including NorESM2-MM and KIOST-ESM, accurately replicate both the time-mean position of the WPWP and its displacement during El Niño events.
Overall, the CMIP6 climate models demonstrate a tendency to underestimate the variability in the displacement of the eastern edge of the WPWP during El Niño events (Figure 6). The MME for the standard deviation of the eastern edge position (Figure 6a) is 14.71°, which is significantly lower than the observed value of 17.94°. Among the 33 models evaluated, 24 exhibit an underestimation of this variability. This discrepancy becomes even more pronounced when assessing the displacement range (i.e., the difference between the easternmost and westernmost positions of the WPWP boundary) as the metric (Figure 6b). The MME for this range is 60.85°, which is considerably less than the observed value of 82.35°. Regardless of the metric employed, three models (INM-CM4-8, MCM-UA-1-0, and MPI-ESM1-2-HR) demonstrate notably lower displacement variability during El Niño events. Notably, these models also reveal significant differences in the time-mean position of the 28 °C isotherm; INM-CM4-8 exhibits a markedly westward-shifted eastern boundary of the WPWP, MCM-UA-1-0 positions it significantly farther east, while MPI-ESM1-2-HR aligns closely with observational data. This suggests that an accurate representation of the mean-state WPWP does not necessarily guarantee a realistic simulation of ENSO-related processes.

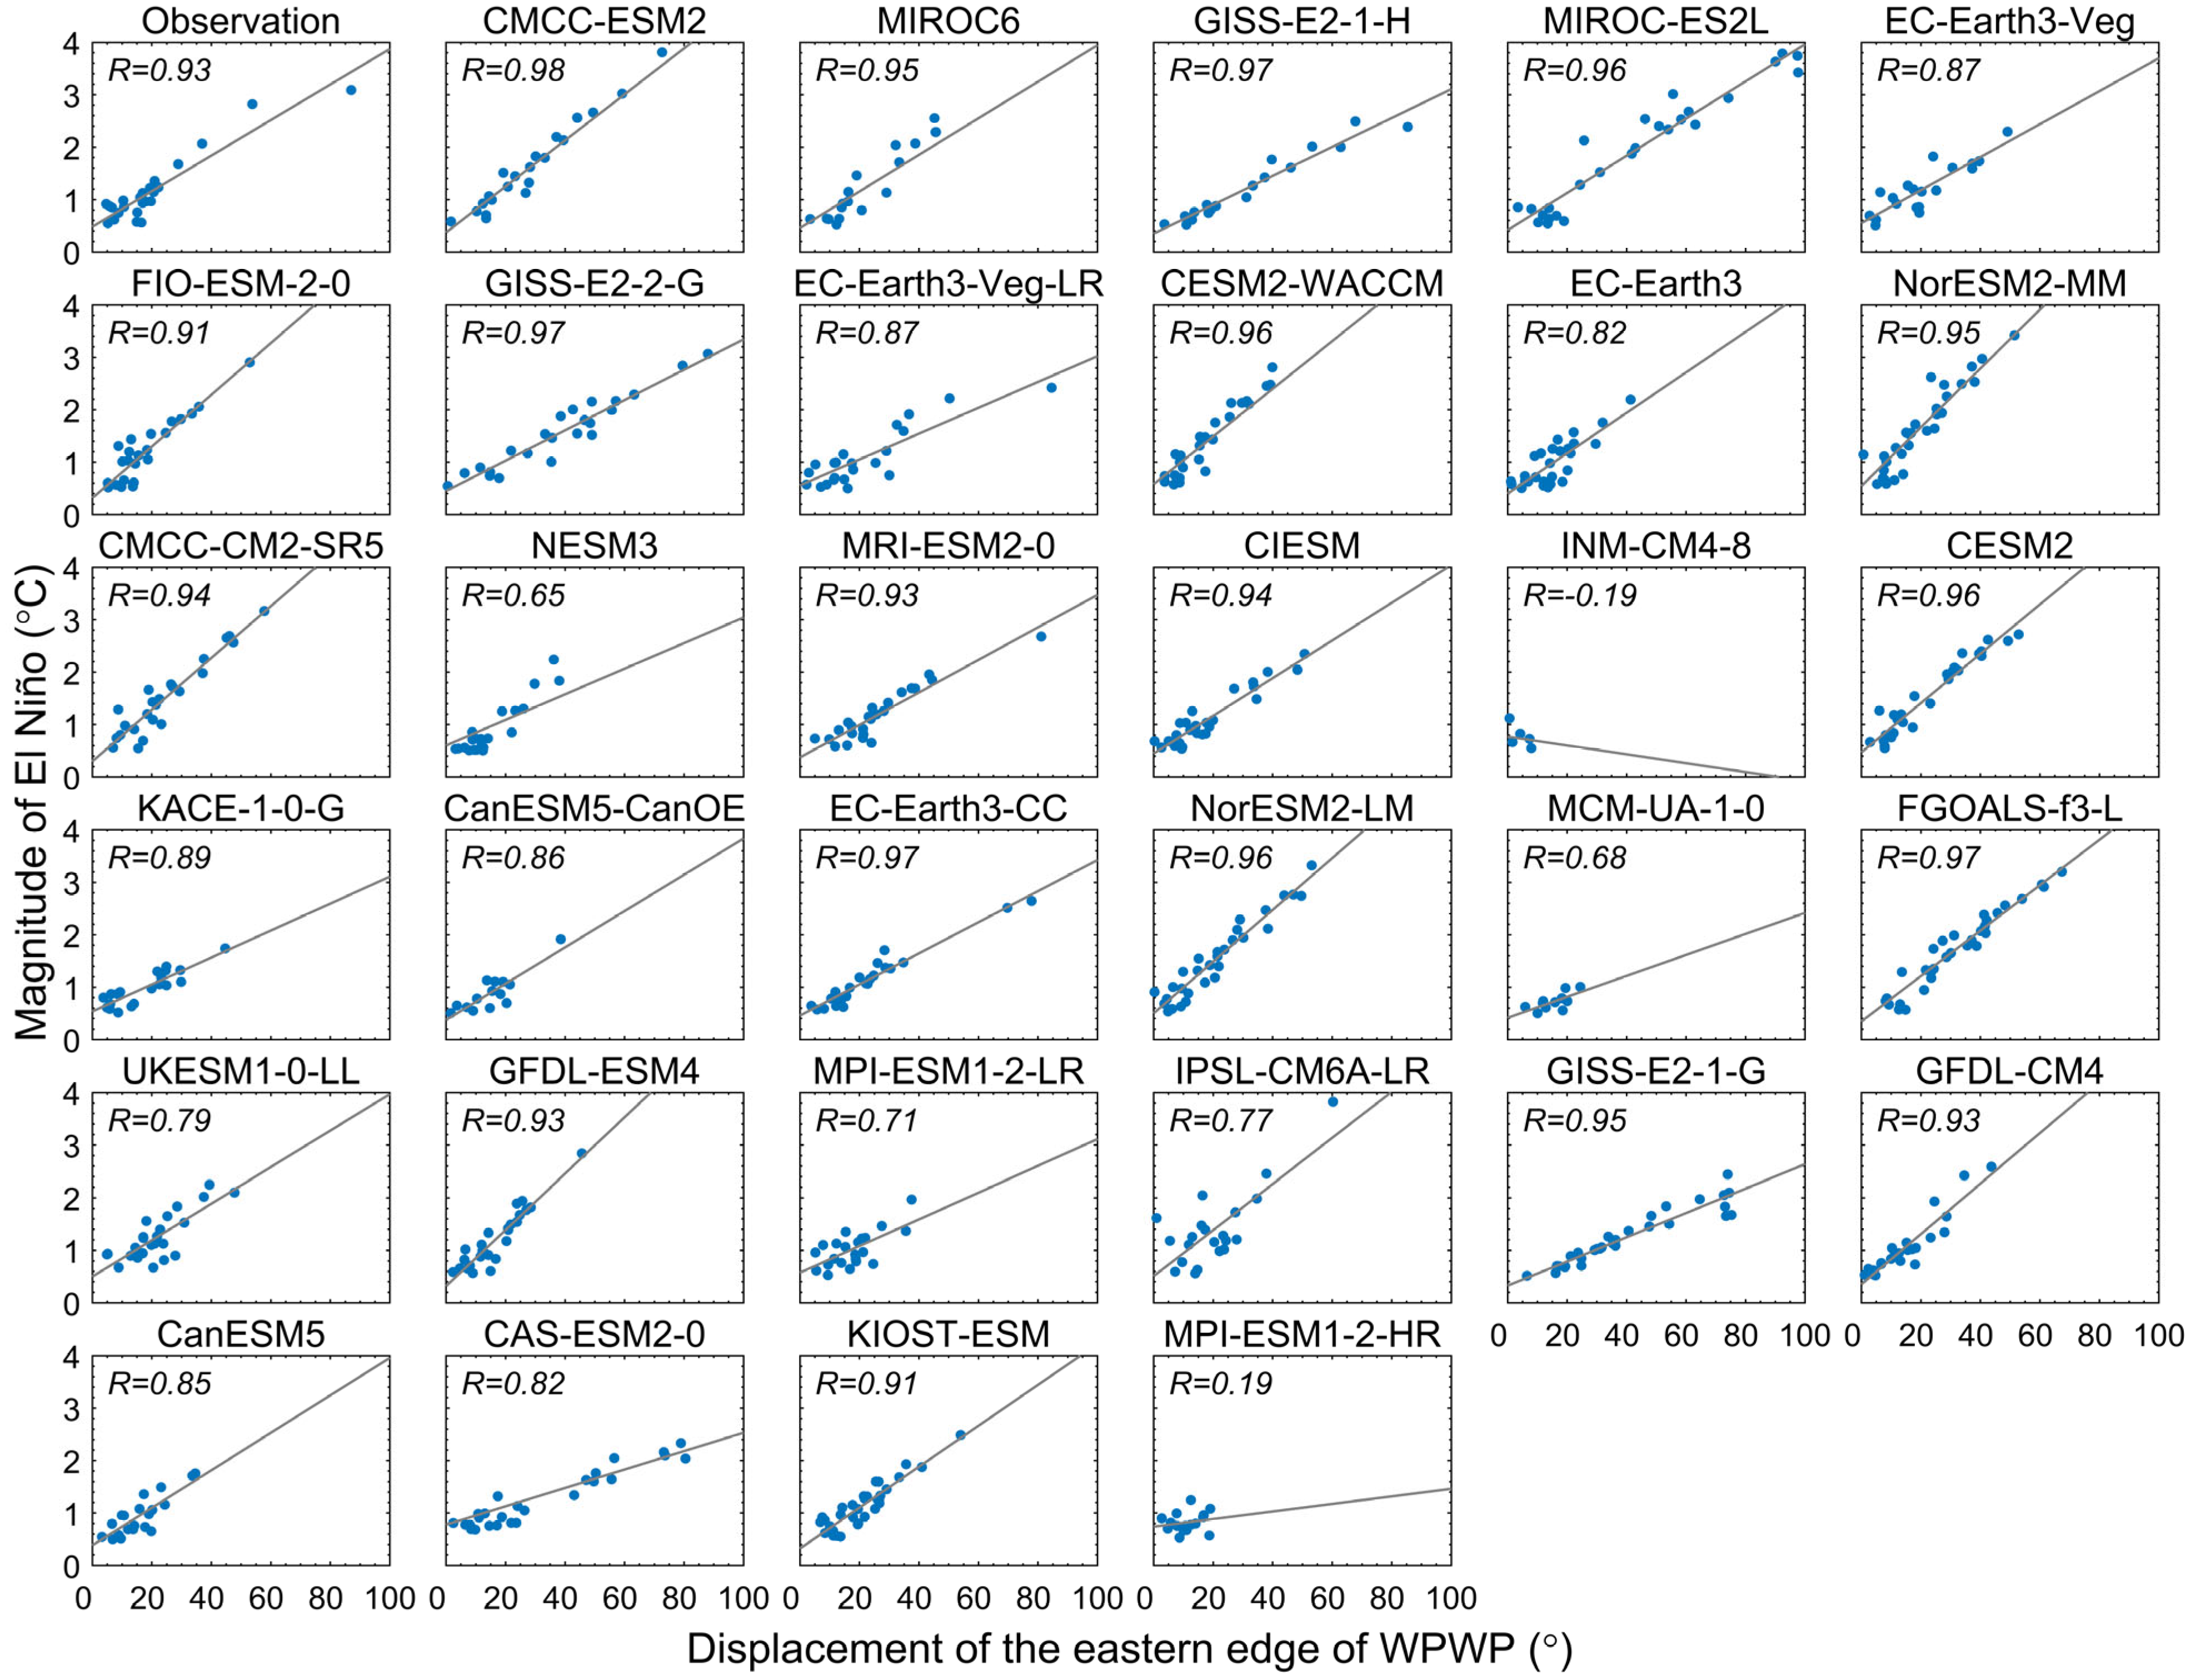
3.3. Relationship Between El Niño Magnitude and Displacement of the WPWP

The magnitude of El Niño demonstrates a strong correlation with the displacement of the eastern edge of the WPWP across various models. Figure 7 illustrates this relationship, revealing a linear trend identified through least-squares fitting. The correlation coefficient between the displacement of the eastern edge and the magnitude of El Niño is calculated to be 0.74, which is significant at the 99.9% confidence level. This result indicates that a greater displacement of the WPWP’s eastern edge is generally associated with more intense El Niño events. Notably, the MIROC-ES2L model, which simulates exceptionally strong El Niño events—approximately twice the observed magnitude—also demonstrates a significant eastward shift in the WPWP boundary. This alignment further substantiates the robustness of the identified relationship; if certain models were capable of generating intense El Niño events without a corresponding substantial displacement of the WPWP’s eastern edge, it would raise concerns regarding the realism of their underlying mechanisms. However, the relationship is not strictly one-to-one. For instance, the NorESM2-MM model simulates a WPWP displacement that is comparable to observations but produces an El Niño magnitude that is significantly larger.
An analysis of individual El Niño events indicates that over 90% of the CMIP6 models are capable of simulating a significant displacement of the WPWP boundary along the equator, which is associated with an intensified SST anomaly in the eastern equatorial Pacific. Figure 8 further depicts the relationship between this longitudinal displacement and the magnitude of El Niño events, as observed in both observations and individual CMIP6 models. Observational data reveal a strong correlation between the eastward shift in the WPWP boundary and the magnitude of El Niño, with a correlation coefficient of 0.93. The majority of CMIP6 models (31 out of 33) replicate this relationship. However, two models (e.g., INM-CM4-8 and MPI-ESM1-2-HR) do not capture this correlation, thereby highlighting potential deficiencies in their representation of the underlying physical mechanisms.
As expected, a significant relationship exists between the diversity of El Niño magnitude and the variability in the displacement of the eastern edge of the WPWP (Figure 9). When diversity is assessed using the standard deviation, the correlation coefficient between the variability of El Niño magnitude and the displacement of the eastern edge of the WPWP is 0.76, with a significance level of 99.9% (Figure 9a). Similarly, when diversity is quantified by the range between the maximum and minimum values, the correlation coefficient of 0.75 is comparable to that derived from the standard deviation and also demonstrates significance at the 99.9% confidence level (Figure 9b). The majority of CMIP6 models show limited diversity in the displacement of the WPWP’s eastern edge, which correlates with a reduced diversity in El Niño magnitude. This consistency further reinforces the robustness of the identified relationship, underscoring the effect of WPWP dynamics on the intensity of El Niño events.

4. Discussion and Conclusions

Observations indicate a significant correlation between the magnitude of El Niño events and the displacement of the eastern boundary of the WPWP. Super El Niño events are typically accompanied by a marked eastward expansion of the WPWP’s eastern edge. Numerous theoretical studies have posited that El Niño can be conceptualized as the eastward extension of the WPWP [35,36,59]. Despite the prevalent utilization of fully coupled climate models as primary instruments for investigating ENSO dynamics, a comprehensive assessment of their capability to accurately represent this relationship is currently absent. To address this deficiency, this study evaluates the performance of the latest generation of coupled models (CMIP6 models) emphasizing their efficacy in simulating both the magnitude of El Niño events and the displacement of the eastern edge of the WPWP.
All models, with the exception of the INM-CM4-8 and MPI-ESM1-2-HR models, effectively capture the observed strong correlation between the magnitude of El Niño and the displacement of the WPWP in historical simulations. Consistent with observations, the model shows a significant eastward extension of the WPWP during strong El Niño events. However, systematic biases remain evident: the majority of models tend to overestimate both the magnitude of El Niño and the eastward displacement of the WPWP, while simultaneously underestimating the inter-event variability in these two dimensions. Among all models examined, INM-CM4-8 and MPI-ESM1-2-HR show the most pronounced underestimation of the inter-event diversity in both El Niño magnitude and WPWP displacement. This deficiency limits their ability to represent the full spectrum of ENSO-related warm pool dynamics.
Across the CMIP6 models, a significant inter-model correlation is observed: models that simulate more intense El Niño events are also likely to demonstrate greater displacement of the WPWP, and conversely. Furthermore, the variability among models regarding the magnitude of El Niño events is closely associated with the variability in WPWP displacement. This finding is consistent with previous studies based on CMIP5 models. For instance, Brown et al. [60] used a strong salinity gradient to define the WPWP and found a strong relationship between the strength of eastern equatorial Pacific SST variability in a model and the amplitude of WPWP fluctuations. This consistency across CMIP generations suggests that the connection between El Niño and WPWP dynamics is a robust feature in climate models, although differences remain in the magnitude and spatial patterns of these relationships, pointing to persistent model biases that warrant further investigation. These results underscore the importance of WPWP temporal variability—beyond its time-mean position—in shaping ENSO characteristics [60].
Many conceptual models of ENSO dynamics incorporate the role of the WPWP. Accordingly, how a model represents the eastern edge of the WPWP can influence its simulation of ENSO behavior—although this is only one component of a highly complex system. Within the framework of the delayed oscillator theory, Clarke et al. [61] argued that reflection from the western boundary plays a more critical role in ENSO dynamics than reflection from the eastern boundary. In this context, the position of the eastern boundary of the WPWP becomes a key factor, as a westward-shifted boundary can severely limit the potential for El Niño events to grow. This may help explain why models with excessively westward WPWP boundaries tend to simulate weaker El Niño events. The advective–reflective oscillator theory [59] extends the delayed oscillator framework by conceptualizing El Niño as a process involving the eastward movement and expansion of the WPWP. This perspective is consistent with our finding of a strong inter-model correlation between the intensity of El Niño events and the eastward displacement of the WPWP boundary in CMIP6 models.
In summary, the research results support the notion that El Niño may be largely regarded as an eastward extension of the WPWP, as a strong relationship between the two exists in both observations and CMIP6 models. While CMIP6 models generally capture this linkage, they also exhibit notable biases in simulating the WPWP’s mean state and variability, both of which are closely tied to El Niño characteristics. These biases manifest as systematic errors in the spatial structure and temporal evolution of SST associated with ENSO, reflecting persistent limitations in model physics and parameterizations. Addressing them is essential for improving the simulation of ENSO dynamics. Future work will focus on identifying the physical sources of these biases, with the goal of enhancing model fidelity and increasing the robustness of El Niño projections under climate change.

Author Contributions

Conceptualization, Z.G.; data curation, Z.G.; formal analysis, Z.G.; investigation, Z.G.; methodology, Z.G.; supervision, D.-Z.S.; validation, Z.G.; visualization, Z.G.; writing—original draft, Z.G.; writing—review and editing, D.-Z.S. All authors have read and agreed to the published version of the manuscript.

Funding

This research received no external funding.

Institutional Review Board Statement

Not applicable.

Informed Consent Statement

Not applicable.

Data Availability Statement

The data from CMIP6 coupled models can be downloaded online: https://aims2.llnl.gov/search/cmip6/ (accessed on 30 March 2024). The HadISST data are available at https://www.metoffice.gov.uk/hadobs/hadisst/data/download.html (accessed on 30 March 2024).

Acknowledgments

The authors thank WCRP for providing the simulations by CMIP6 models, and the Hadley Centre for the SST data.

Conflicts of Interest

The authors declare no conflicts of interest.

References

  1. Ropelewski, C.F.; Halpert, M.S. Global and regional scale precipitation patterns associated with the El Niño/Southern Oscillation. Mon. Weather Rev. 1987, 115, 1606–1626. [Google Scholar] [CrossRef]
  2. Ronghui, H.; Yifang, W. The influence of ENSO on the summer climate change in China and its mechanism. Adv. Atmos. Sci. 1989, 6, 21–32. [Google Scholar] [CrossRef]
  3. Zhang, R.; Sumi, A.; Kimoto, M. Impact of El Niño on the East Asian monsoon a diagnostic study of the ’86/87 and ’91/92 events. J. Meteorol. Soc. Japan. Ser. II 1996, 74, 49–62. [Google Scholar] [CrossRef]
  4. Wang, B.; Wu, R.; Fu, X. Pacific–East Asian teleconnection: How does ENSO affect East Asian climate? J. Clim. 2000, 13, 1517–1536. [Google Scholar] [CrossRef]
  5. Neelin, J.; Chou, C.; Su, H. Tropical drought regions in global warming and El Niño teleconnections. Geophys. Res. Lett. 2003, 30, 2273. [Google Scholar] [CrossRef]
  6. Chiodi, A.M.; Harrison, D.E. El Niño impacts on seasonal US atmospheric circulation, temperature, and precipitation anomalies: The OLR-event perspective. J. Clim. 2013, 26, 822–837. [Google Scholar] [CrossRef]
  7. Lu, B.; Li, H.; Wu, J.; Zhang, T.; Liu, J.; Liu, B.; Chen, Y.; Baishan, J. Impact of El Niño and Southern Oscillation on the summer precipitation over Northwest China. Atmos. Sci. Lett. 2019, 20, e928. [Google Scholar] [CrossRef]
  8. Alizadeh, O. A review of ENSO teleconnections at present and under future global warming. Wiley Interdiscip. Rev. Clim. Change 2024, 15, e861. [Google Scholar] [CrossRef]
  9. McPhaden, M.J.; Zebiak, S.E.; Glantz, M.H. ENSO as an integrating concept in earth science. Science 2006, 314, 1740–1745. [Google Scholar] [CrossRef]
  10. Cai, W.; McPhaden, M.J.; Grimm, A.M.; Rodrigues, R.R.; Taschetto, A.S.; Garreaud, R.D.; Dewitte, B.; Poveda, G.; Ham, Y.-G.; Santoso, A. Climate impacts of the El Niño–southern oscillation on South America. Nat. Rev. Earth Environ. Health 2020, 1, 215–231. [Google Scholar] [CrossRef]
  11. Goddard, L.; Gershunov, A. Impact of El Niño on weather and climate extremes. In El Niño Southern Oscillation in a Changing Climate; Wiley: Hoboken, NJ, USA, 2020; pp. 361–375. [Google Scholar]
  12. Liu, Y.; Cai, W.; Lin, X.; Li, Z.; Zhang, Y. Nonlinear El Niño impacts on the global economy under climate change. Nat. Commun. 2023, 14, 5887. [Google Scholar] [CrossRef] [PubMed]
  13. Marjani, S.; Alizadeh-Choobari, O.; Irannejad, P. Frequency of extreme El Niño and La Niña events under global warming. Clim. Dyn. 2019, 53, 5799–5813. [Google Scholar] [CrossRef]
  14. Alizadeh, O. A review of the El Niño-Southern Oscillation in future. Earth Sci. Rev. 2022, 235, 104246. [Google Scholar] [CrossRef]
  15. Deser, C.; Phillips, A.S.; Tomas, R.A.; Okumura, Y.M.; Alexander, M.A.; Capotondi, A.; Scott, J.D.; Kwon, Y.-O.; Ohba, M. ENSO and Pacific decadal variability in the Community Climate System Model version 4. J. Clim. 2012, 25, 2622–2651. [Google Scholar] [CrossRef]
  16. Eyring, V.; Bony, S.; Meehl, G.A.; Senior, C.A.; Stevens, B.; Stouffer, R.J.; Taylor, K.E. Overview of the Coupled Model Intercomparison Project Phase 6 (CMIP6) experimental design and organization. Geosci. Model Dev. 2016, 9, 1937–1958. [Google Scholar] [CrossRef]
  17. Capotondi, A.; Deser, C.; Phillips, A.; Okumura, Y.; Larson, S. ENSO and Pacific decadal variability in the Community Earth System Model version 2. J. Adv. Model. Earth Syst. 2020, 12, e2019MS002022. [Google Scholar] [CrossRef]
  18. Fredriksen, H.B.; Berner, J.; Subramanian, A.C.; Capotondi, A. How does El Niño–Southern Oscillation change under global warming—A first look at CMIP6. Geophys. Res. Lett. 2020, 47, e2020GL090640. [Google Scholar] [CrossRef]
  19. Sun, Y.; Sun, D.-Z.; Wu, L.; Wang, F. Western Pacific warm pool and ENSO asymmetry in CMIP3 models. Adv. Atmos. Sci. 2013, 30, 940–953. [Google Scholar] [CrossRef]
  20. Zhang, T.; Sun, D.-Z. ENSO asymmetry in CMIP5 models. J. Clim. 2014, 27, 4070–4093. [Google Scholar] [CrossRef]
  21. Sun, Y.; Wang, F.; Sun, D.-Z. Weak ENSO asymmetry due to weak nonlinear air–sea interaction in CMIP5 climate models. Adv. Atmos. Sci. 2016, 33, 352–364. [Google Scholar] [CrossRef]
  22. Hayashi, M.; Jin, F.-F.; Stuecker, M.F. Dynamics for El Niño-La Niña asymmetry constrain equatorial-Pacific warming pattern. Nat. Commun. 2020, 11, 4330. [Google Scholar] [CrossRef] [PubMed]
  23. Zhao, Y.; Sun, D.-Z. ENSO asymmetry in CMIP6 models. J. Clim. 2022, 35, 5555–5572. [Google Scholar] [CrossRef]
  24. Chen, S.; Yu, B.; Chen, W. An analysis on the physical process of the influence of AO on ENSO. Clim. Dyn. 2014, 42, 973–989. [Google Scholar] [CrossRef]
  25. Chen, S.; Chen, W.; Zhou, W.; Wu, R.; Ding, S.; Chen, L.; He, Z.; Yang, R. Interdecadal variation in the impact of Arctic sea ice on El Niño–southern oscillation: The role of atmospheric mean flow. J. Clim. 2024, 37, 5483–5506. [Google Scholar] [CrossRef]
  26. Chen, S.; Chen, W.; Wu, R.; Yu, B.; Graf, H.-F.; Cai, Q.; Ying, J.; Xing, W. Atlantic multidecadal variability controls Arctic-ENSO connection. NPJ Clim. Atmos. Sci. Lett. 2025, 8, 44. [Google Scholar] [CrossRef]
  27. Pierrehumbert, R.T. Thermostats, Radiator Fins, and the Local Runaway Greenhouse. J. Atmos. Sci. 1995, 52, 1784–1806. [Google Scholar] [CrossRef]
  28. Sun, D.-Z. A possible effect of an increase in the warm-pool SST on the magnitude of El Niño warming. J. Clim. 2003, 16, 185–205. [Google Scholar] [CrossRef]
  29. Chen, H.; Shi, J.; Jin, Y.; Geng, T.; Li, C.; Zhang, X. Warm and cold episodes in western Pacific warm pool and their linkage with ENSO asymmetry and diversity. J. Geophys. Res. Oceans 2021, 126, e2021JC017287. [Google Scholar] [CrossRef]
  30. Fu, S.; Hu, S.; Zheng, X.-T. Collaborative role of warm pool edge and ocean heat content in El Niño development: Implications for the 1982/83 extreme El Niño. Clim. Dyn. 2024, 62, 7701–7716. [Google Scholar] [CrossRef]
  31. Hoyos, C.D.; Webster, P.J. Evolution and modulation of tropical heating from the last glacial maximum through the twenty-first century. Clim. Dyn. 2012, 38, 1501–1519. [Google Scholar] [CrossRef]
  32. Mechoso, C.R.; Robertson, A.W.; Barth, N.; Davey, M.K.; Delecluse, P.; Gent, P.R.; Ineson, S.; Kirtman, B.; Latif, M.; Treut, H.L.; et al. The Seasonal Cycle over the Tropical Pacific in Coupled Ocean–Atmosphere General Circulation Models. Mon. Weather Rev. 1995, 123, 2825–2838. [Google Scholar] [CrossRef]
  33. Kiehl, J.T. Simulation of the Tropical Pacific Warm Pool with the NCAR Climate System Model. J. Clim. 1998, 11, 1342–1355. [Google Scholar] [CrossRef]
  34. Kim, W.; Cai, W. The importance of the eastward zonal current for generating extreme El Niño. Clim. Dyn. 2014, 42, 3005–3014. [Google Scholar] [CrossRef]
  35. Wyrtki, K. Water displacements in the Pacific and the genesis of El Niño cycles. J. Geophys. Res. Oceans 1985, 90, 7129–7132. [Google Scholar] [CrossRef]
  36. Picaut, J.; Ioualalen, M.; Menkès, C.; Delcroix, T.; Mcphaden, M.J. Mechanism of the zonal displacements of the Pacific warm pool: Implications for ENSO. Science 1996, 274, 1486–1489. [Google Scholar] [CrossRef]
  37. Hu, S.; Hu, D. Heat center of the western Pacific warm pool. Chin. J. Oceanol. Limnol. Oceanogr. Bull. 2012, 30, 169–176. [Google Scholar] [CrossRef]
  38. Eisenman, I.; Yu, L.; Tziperman, E. Westerly wind bursts: ENSO’s tail rather than the dog? J. Clim. 2005, 18, 5224–5238. [Google Scholar] [CrossRef]
  39. Williams, I.N.; Patricola, C.M. Diversity of ENSO events unified by convective threshold sea surface temperature: A nonlinear ENSO index. Geophys. Res. Lett. 2018, 45, 9236–9244. [Google Scholar] [CrossRef]
  40. Okumura, Y.M. ENSO diversity from an atmospheric perspective. Curr. Clim. Change Rep. 2019, 5, 245–257. [Google Scholar] [CrossRef]
  41. Brown, J.R.; Brierley, C.M.; An, S.-I.; Guarino, M.-V.; Stevenson, S.; Williams, C.J.; Zhang, Q.; Zhao, A.; Abe-Ouchi, A.; Braconnot, P. Comparison of past and future simulations of ENSO in CMIP5/PMIP3 and CMIP6/PMIP4 models. Clim. Past 2020, 16, 1777–1805. [Google Scholar] [CrossRef]
  42. Grose, M.R.; Narsey, S.; Delage, F.; Dowdy, A.J.; Bador, M.; Boschat, G.; Chung, C.; Kajtar, J.; Rauniyar, S.; Freund, M. Insights from CMIP6 for Australia’s future climate. Earth’s Future 2020, 8, e2019EF001469. [Google Scholar] [CrossRef]
  43. Tian, B.; Dong, X. The double—ITCZ bias in CMIP3, CMIP5, and CMIP6 models based on annual mean precipitation. Geophys. Res. Lett. 2020, 47, e2020GL087232. [Google Scholar] [CrossRef]
  44. Lee, J.; Planton, Y.Y.; Gleckler, P.J.; Sperber, K.R.; Guilyardi, E.; Wittenberg, A.T.; McPhaden, M.J.; Pallotta, G.J.G.R.L. Robust evaluation of ENSO in climate models: How many ensemble members are needed? Geophys. Res. Lett. 2021, 48, e2021GL095041. [Google Scholar] [CrossRef]
  45. Planton, Y.Y.; Guilyardi, E.; Wittenberg, A.T.; Lee, J.; Gleckler, P.J.; Bayr, T.; McGregor, S.; McPhaden, M.J.; Power, S.; Roehrig, R. Evaluating climate models with the CLIVAR 2020 ENSO metrics package. Bull. Am. Meteorol. Soc. 2021, 102, E193–E217. [Google Scholar] [CrossRef]
  46. Rayner, N.; Parker, D.E.; Horton, E.; Folland, C.K.; Alexander, L.V.; Rowell, D.; Kent, E.C.; Kaplan, A. Global analyses of sea surface temperature, sea ice, and night marine air temperature since the late nineteenth century. J. Geophys. Res. Atmos. 2003, 108, 4407. [Google Scholar] [CrossRef]
  47. Cai, W.; Wang, G.; Dewitte, B.; Wu, L.; Santoso, A.; Takahashi, K.; Yang, Y.; Carréric, A.; McPhaden, M.J. Increased variability of eastern Pacific El Niño under greenhouse warming. Nature 2018, 564, 201–206. [Google Scholar] [CrossRef]
  48. Geng, T.; Jia, F.; Cai, W.; Wu, L.; Gan, B.; Jing, Z.; Li, S.; McPhaden, M.J. Increased occurrences of consecutive La Niña events under global warming. Nature 2023, 619, 774–781. [Google Scholar] [CrossRef]
  49. Sun, D.-Z.; Zhang, T. A regulatory effect of ENSO on the time-mean thermal stratification of the equatorial upper ocean. Geophys. Res. Lett. 2006, 33, L07710. [Google Scholar] [CrossRef]
  50. Sun, D.-Z. The Role of El Niño—Southern Oscillation in Regulating its Background State. In Nonlinear Dynamics in Geosciences; Springer: Berlin/Heidelberg, Germany, 2007; pp. 537–555. [Google Scholar]
  51. Liang, J.; Yang, X.-Q.; Sun, D.-Z. The effect of ENSO events on the tropical Pacific mean climate: Insights from an analytical model. J. Clim. 2012, 25, 7590–7606. [Google Scholar] [CrossRef]
  52. Sun, D.-Z.; Zhang, T.; Sun, Y.; Yu, Y. Rectification of El Niño–Southern Oscillation into climate anomalies of decadal and longer time scales: Results from forced ocean GCM experiments. J. Clim. 2014, 27, 2545–2561. [Google Scholar] [CrossRef]
  53. Burgers, G.; Stephenson, D.B. The “Normality” of El Niño. Geophys. Res. Lett. 1999, 26, 1027–1030. [Google Scholar] [CrossRef]
  54. Liang, J.; Yang, X.-Q.; Sun, D.-Z. Factors determining the asymmetry of ENSO. J. Clim. 2017, 30, 6097–6106. [Google Scholar] [CrossRef]
  55. Gu, Z.; Sun, D.-Z. El Niño Magnitude and Western Pacific Warm Pool Displacement. Part II: Future Changes Under Global Warming. Climate 2025, 13, 97. [Google Scholar] [CrossRef]
  56. Sun, D.-Z.; Fasullo, J.; Zhang, T.; Roubicek, A. On the radiative and dynamical feedbacks over the equatorial Pacific cold tongue. J. Clim. 2003, 16, 2425–2432. [Google Scholar] [CrossRef]
  57. Sun, D.-Z.; Zhang, T.; Covey, C.; Klein, S.; Collins, W.; Hack, J.; Kiehl, J.; Meehl, G.; Held, I.; Suarez, M. Radiative and dynamical feedbacks over the equatorial cold tongue: Results from nine atmospheric GCMs. J. Clim. 2006, 19, 4059–4074. [Google Scholar] [CrossRef]
  58. Jiang, W.; Huang, P.; Huang, G.; Ying, J. Origins of the excessive westward extension of ENSO SST simulated in CMIP5 and CMIP6 models. J. Clim. 2021, 34, 2839–2851. [Google Scholar] [CrossRef]
  59. Picaut, J.; Masia, F.; Du Penhoat, Y. An advective-reflective conceptual model for the oscillatory nature of the ENSO. Science 1997, 277, 663–666. [Google Scholar] [CrossRef]
  60. Brown, J.N.; Langlais, C.; Maes, C. Zonal structure and variability of the Western Pacific dynamic warm pool edge in CMIP5. Clim. Dyn. 2014, 42, 3061–3076. [Google Scholar] [CrossRef]
  61. Clarke, A.J.; Wang, J.; Van Gorder, S. A simple warm-pool displacement ENSO model. J. Phys. Oceanogr. 2000, 30, 1679–1691. [Google Scholar] [CrossRef]
Figure 1. Skewness of SST anomalies in the eastern equatorial Pacific in observations and CMIP6 model simulations. The black bar denotes the observed skewness value (0.84). Red and blue bars represent models with positive and negative skewness, respectively, divided by the vertical gray line for clarity. Error bars indicate the standard deviation of skewness within each group (positive or negative), highlighting inter-model variability.
Atmosphere 16 00680 g001
Figure 2. Magnitude of El Niño based on SST anomalies in the eastern equatorial Pacific (5° S–5 °N, 155° W–70° W). The black bar and dashed line denote the observed value, while colored bars represent simulation results from individual CMIP6 models. The MME mean is shown as a gray bar. The error bar, represented by a black symbol above the gray bar, reflects the standard deviation of El Niño magnitude across all models.
Atmosphere 16 00680 g002
Figure 3. Composite SST anomalies during El Niño events in observations and CMIP6 models. The contour interval is 0.5 °C.
Atmosphere 16 00680 g003
Figure 4. Diversity in the magnitude of El Niño in observations and CMIP6 model simulations. The black bar and dashed line represent the observed values, while colored bars show results from individual models. The MME mean is depicted by the gray bar, with the error bar above it indicating the standard deviation of diversity across models. Diversity is quantified using two metrics: (a) standard deviation and (b) range (i.e., the difference between the strongest and weakest El Niño events).
Atmosphere 16 00680 g004
Figure 5. The 28 °C isotherm in time-mean state and during El Niño events in observations and CMIP6 models: (a,b) the 28 °C isotherms for time-mean state and composite El Niño events; (c,d) climatological mean position of 28 °C isotherm and its eastward displacement during El Niño events. Contours and bars of the same color correspond to the same model.
Atmosphere 16 00680 g005
Figure 6. Diversity in WPWP’s eastern edge displacement during El Niño events. The black bar and dashed line indicate the observed value, while the gray bar represents the MME mean. The error bar above the gray bar, shown as a black symbol, denotes the standard deviation among models. Colored bars reflect results from individual models. Diversity is quantified using two metrics: (a) standard deviation and (b) range (i.e., the difference between the easternmost and westernmost positions of the WPWP boundary).
Atmosphere 16 00680 g006
Figure 7. Relationship between WPWP’s eastern edge displacement and El Niño magnitude across CMIP6 models. The black pentagram marks the observational data point, while the gray pentagram represents the MME mean. Colored dots denote results from individual models. The gray line shows the least squares regression fit. The correlation coefficient (R) quantifies the relationship and the significance level (p) is derived using a standard F test.
Atmosphere 16 00680 g007
Figure 8. Scatter plot of WPWP’s eastern edge displacement versus El Niño magnitude in observations and CMIP6 models. The gray line indicates the least squares regression fit. The correlation coefficient (R) quantifies the strength of the linear relationship.
Atmosphere 16 00680 g008
Figure 9. Relationship between diversity in WPWP’s eastern edge displacement and El Niño magnitude across CMIP6 models. Diversity is measured using two metrics: (a) standard deviation and (b) range. The black pentagram represents the observed value, while the gray pentagram represents the MME mean. Colored dots represent individual model outputs. The gray line shows the least squares regression fit. The correlation coefficient (R) measures the strength of the relationship and the significance level (p) is determined using a standard F test.
Atmosphere 16 00680 g009
Table 1. Overview of 42 CMIP6 models included in analysis. The first column lists the model names and the second column specifies the selected realizations used for each model. The third column presents the calculated skewness of SST anomalies in the eastern equatorial Pacific for the period 1929–2014. Positive skewness values are shown in bold. The observed skewness value is 0.84. Only models exhibiting positive skewness were retained for subsequent analysis.
Model NameRealizationSkewness of the Eastern Equatorial Pacific SSTSelected or Not
ACCESS-CM2r1i1p1f1−0.15N
ACCESS-ESM1-5r1i1p1f1−0.36N
BCC-CSM2-MRr1i1p1f1−0.25N
CanESM5r1i1p1f10.05Y
CanESM5-CanOEr1i1p2f10.15Y
CAS-ESM2-0r1i1p1f10.04Y
CESM2r4i1p1f10.19Y
CESM2-WACCMr1i1p1f10.42Y
CIESMr1i1p1f10.24Y
CMCC-CM2-SR5r1i1p1f10.38Y
CMCC-ESM2r1i1p1f10.80Y
CNRM-CM6-1r1i1p1f2−0.28N
CNRM-CM6-1-HRr1i1p1f2−0.06N
CNRM-ESM2-1r1i1p1f2−0.27N
EC-Earth3r1i1p1f10.39Y
EC-Earth3-CCr1i1p1f10.15Y
EC-Earth3-Vegr1i1p1f10.58Y
EC-Earth3-Veg-LRr1i1p1f10.43Y
FGOALS-f3-Lr1i1p1f10.11Y
FGOALS-g3r1i1p1f1−0.19N
FIO-ESM-2-0r1i1p1f10.50Y
GFDL-CM4r1i1p1f10.05Y
GFDL-ESM4r1i1p1f10.07Y
GISS-E2-1-Gr1i1p1f20.05Y
GISS-E2-1-Hr1i1p1f20.70Y
GISS-E2-2-Gr1i1p3f10.49Y
HadGEM3-GC31-LLr1i1p1f3−0.10N
INM-CM4-8r1i1p1f10.22Y
INM-CM5-0r1i1p1f1−0.06N
IPSL-CM6A-LRr1i1p1f10.06Y
KACE-1-0-Gr1i1p1f10.17Y
KIOST-ESMr1i1p1f10.02Y
MCM-UA-1-0r1i1p1f20.12Y
MIROC6r1i1p1f10.72Y
MIROC-ES2Lr1i1p1f20.60Y
MPI-ESM1-2-HRr1i1p1f10.01Y
MPI-ESM1-2-LRr1i1p1f10.06Y
MRI-ESM2-0r1i1p1f10.24Y
NESM3r1i1p1f10.27Y
NorESM2-LMr1i1p1f10.13Y
NorESM2-MMr1i1p1f10.38Y
UKESM1-0-LLr1i1p1f20.08Y
Disclaimer/Publisher’s Note: The statements, opinions and data contained in all publications are solely those of the individual author(s) and contributor(s) and not of MDPI and/or the editor(s). MDPI and/or the editor(s) disclaim responsibility for any injury to people or property resulting from any ideas, methods, instructions or products referred to in the content.

