Abstract
Numerical models were employed to simulate the effects of urban infrastructure on the city-scale precipitation distribution during multiple closely occurring convective squall line events over Chicago. Two high-resolution simulations were inter-compared, one using standard land use databases to initialize the WRF-ARW numerical model and the other using a high-resolution urban canopy formulation and detailed land use databases to initialize the WRF-UCM numerical model. Two squall lines organized and propagated over Chicago during an eight-hour period. The (1 km) spatio-temporal evolution of the first squall line was more accurately simulated by the WRF-UCM than that simulated by the WRF-ARW. The WRF-UCM captures more realistic urban heat island-induced buoyancy forcing when validated against multiple airport meteograms and Doppler radar-derived reflectivity and precipitation. The WRF-UCM increases surface heating, substantially strengthening the surface-based convective available potential energy (SBCAPE) and subsequent cold downdrafts. Additionally, the increased surface heating acts to strengthen and bifurcate the upper-level divergence and energize three low-level jets that converge upon the city and shape the convective organization. While the effect of this additional buoyancy on the first squall line was critical, the second line’s dissipation was not substantially different in the two simulations because of diminishing tropospheric forcing.
1. Introduction
Numerous simulation studies, complemented by observational studies, have been widely employed to investigate how urban cities influence precipitation systems. A range of numerical modeling efforts (e.g., [,,,,,,,,]) and a set of comprehensive review studies (e.g., [,,,,,,,]) have explored how urban morphology impacts convective precipitation processes. Like the numerous observational studies referenced in Part I [], they indicate that cities can modify precipitation via three physical mechanisms: (1) the urban heat island (UHI) thermal forcing signal, (2) mechanical blocking in flow diverted by buildings, and (3) changes in condensation due to nucleation effects by condensation nuclei and freezing nuclei in urban aerosols.
There is often a great deal of ambiguity in these studies in terms of the relative role of large-scale environmental variability versus urban forcing by one or multiple mechanisms that control the impact on precipitation. Aerosol effects, in particular, are not explained in [,] in terms of a more general understanding of their impacts, particularly their diurnal effects. In a city like Chicago, the influence of the Lake Michigan breeze can dramatically modulate aerosols diurnally by removing urban aerosol plumes in the afternoon after early morning accumulations. Of course, this also varies substantially as a function of seasonality, as wintertime precipitation is normally a stable stratiform, and summertime is very convective with huge differences in seasonal temperatures and clouds and inversion structures. The modeling studies of [,], on the other hand, strongly suggest that the downwind in Indianapolis, Indiana, has a profound and generally consistent impact on, for example, the UHI, which is extremely dependent on the time of year, the wind direction, and the level of city growth over the years. This appears to far overwhelm aerosol effects on condensation and freezing nuclei. Chicago is several times the size of Indianapolis. However, the larger-scale meteorology, aside from Lake Michigan’s impact, is not very different.
In recent years, there has been a notable increase in simulation-based studies examining urban impacts on precipitation across urbanized Asian cities. These studies, e.g., [,,,,,,,,,,], dominate the literature and generally outline the positive impacts of the UHI on enhancing heavy precipitation, whether for individual case studies or in a climatological context. For example, using simulation studies and focusing on the urban area of Beijing, China, ref. [] found that convection often bifurcates along the windward periphery of an urban area, resulting in increased rainfall on either side of the city. This is attributed to UHI-induced convergence zones that intensify peripheral precipitation. Ref. [], through combined observational climatology and numerical simulations, identified precipitation maxima over central Beijing and its downwind region, with the strong storm splitting occurring around the city being evident only in the most intense convective systems. Similarly, ref. [] reported a tendency toward rainfall maxima on the downwind side of Nanjing city, although this spatial pattern of rainfall varies substantially according to the prevailing synoptic-scale conditions, with high dependency on the environmental circulation. Despite these findings, consensus remains elusive. In a broader literature review of simulated urban forcing, ref. [] emphasized that considerable disagreement still exists regarding the direction and magnitude of urban impacts on precipitation. Ref. [] examined long-term observational data and simulations to explore urbanization-induced summer rainfall changes in the Yangtze River Delta, China. They conducted several sensitivity experiments using three historical land use and land cover datasets (1990, 2000, and 2010) to examine the evolving impact of urban expansion on rainfall. The urban river island (URI) effect, demonstrated in observation-based analyses, was well reproduced by the numerical simulations and revealed that urban growth from 1990 to 2010 increased rainfall over urbanized areas by an average of ~52 mm during summer months. However, the URI effect weakened during the later stage of urbanization (2000–2010) relative to the earlier period (1990–2000), as precipitation-inhibiting processes appeared to offset the precipitation-enhancing mechanisms. This suggests that the relationship between urban expansion and rainfall enhancement is not strictly linear and may evolve depending on the stage of urban development.
Some ambiguity does arise again concerning the role of blocking versus the UHI. Chicago is a prime example of how difficult separating drag effects from urban heating can be since there is such a drastic difference between the airflow and energy budgets over Lake Michigan and massive metroplex particularly during summer when very large amounts of atmospheric moisture and convective instability often are both present and the lake breeze is very actively modulating convergence over and surrounding the metroplex. Although cities like Beijing and Nanjing do rival Chicago in size and urban impact, Chicago may represent one of the most difficult urban impact modeling challenges because of the huge size and seasonal variability in the surface temperature of Lake Michigan. Most studies of Chicago’s impact on the environment have focused on the direct impacts of the lake breeze, not on precipitation processes resulting from UHI and lake breeze interactions.
As was found in Part I [], two sequential quasi-linear convective systems (QLCS #1 and QLCS #2) developed and propagated over the Chicago metroplex during an eight-hour period. The first squall line (QLCS #1) intensified as it propagated northeastward over Chicago, where the second (QLCS #2) moved southeastward and weakened as it passed over Chicago in association with a polar cold front. The weak upper-level divergence associated with a diffluent flow pattern poleward of a large ridge built over and strengthened a low-level trough and confluence zone, which subsequently triggered QLCS #1. Convective downdrafts from QLCS #1 produced a cold pool that interact with multiple confluent low-level jets surrounding and converging towards the metroplex UHI, advecting the convection poleward over the metroplex. The heaviest precipitation during this period was observed just south–southeast of Midway Airport. Subsequently, the progression of the polar cold front into the metroplex provided the necessary lifting mechanism, which triggered QLCS #2, although its strength diminished rapidly as it passed over the city.
In Part II of this study, we focus on diagnosing urban influences on these two convective systems (QLCS #1 and QLCS #2) using numerical simulations. The primary aim is to diagnose urban impacts as revealed through high-resolution model simulations. Using the Weather Research and Forecasting–Advanced Research Weather (WRF-ARW) model with and without the single-layer WRF Urban Canopy Model (WRF-UCM), we examine how urban surface characteristics influence convection structure, propagation, and rainfall distribution over Chicago and its adjacent cities. By isolating the effects of urban morphology through a comparison between ARW and UCM, we assess the sensitivity of convective system evolution to urban forcing. The focal point of this study is given to differences in storm timing, intensity, spatial organization, and precipitation patterns. In Section 2, we will describe the observations employed to verify the numerical model simulation experiments as well as a detailed representation of those experiments. Section 3 will focus on directly validating the WRF-ARW and WRF-UCM against the observational surface meteograms and Doppler radar datasets. Section 4 will involve an in-depth inter-comparison of the two simulations’ fields from the perspective of how they differ in their organization of the convective environment and the upscale modification of that environment by the convection. Section 5 will involve a detailed discussion section, and Section 6 will be a conclusion.
2. Data and Methodology
2.1. Observational Data
Observational data presented in Part I [] will be utilized to validate the numerical models. Specifically, we will employ surface meteograms and supporting surface analyses from the Plymouth State Weather Center (Plymouth SWC) surface data archives [] and Doppler radar reflectivity and precipitation estimates from the NOAA Next Generation Doppler Weather Radar (NOAA NEXRAD) archive []. These datasets serve as the observational baseline for qualitative comparison with the WRF-ARW and WRF-UCM simulations, particularly in assessing storm timing, intensity, spatial organization, and precipitation patterns.
2.2. Numerical Experimental Design
The numerical simulation experiments intercompared two simulations: the first (control simulation) from the WRF-ARW (Version 4.4) [] and the second (urban sensitivity experiment) from the WRF-UCM (Version 4.4.2) with a single-layer urban canopy []. Most of the components of these two simulations are identical except for the addition of the single-layer urban canopy and, for land use, the 40-category National Land Cover Database (NLCD 2011) [] in the WRF-UCM simulation instead of the MODIS IGBP 21-category dataset in the WRF-ARW simulation. The region of integration and one-way nested configurations are identical, covering the regions in Figure 1 with domain d01 (16 km resolution), d02 (4 km resolution), and d03 (1 km resolution). The initial and largest domain lateral boundary conditions employed the European Centre for Medium-Range Weather Forecasts Reanalysis 5 dataset (ERA5) []. The d01 ran from 7/5/0000 UTC–7/6/0600 UTC, 2018, while the d02 ran from 7/5/0600 UTC–7/6/0600 UTC, 2018, and the d03 ran from 7/5/1200 UTC–7/6/0600 UTC, 2018 (hereafter following the format: 12007/5). The grid projection is Lambert conformal; 50 vertical layers were employed, and the model top was 50 hPa. Parametrizations include the Thompson microphysics scheme []; the Mellor–Yamada–Janjic PBL scheme []; longwave and shortwave radiation (RRTMG) []; the Eta similarity scheme for the surface layer []; land surface (Unified NOAH Land Surface Model) []; cumulus parameterization [] for the outermost domain (d01 grid) only, since this scheme is scale-sensitive; and urban physics (single-layer UCM) []. Figure 2 depicts the urban categories and their distribution over Chicago for the WRF-UCM simulation. For the analysis, we focus only on the d03-simulated fields, particularly focusing more closely on the Chicago metroplex, where urban impacts are more dominant. The domain configuration of the WRF model, physics parameterization schemes, and dynamics employed for this study are summarized in Table 1.
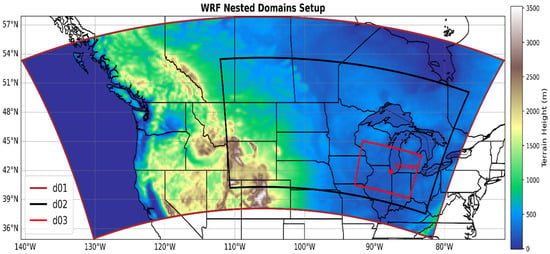
Figure 1.
Domain configurations for both WRF-ARW (control) and WRF-UCM simulations. Star indicates the location of Chicago, IL, USA, centered on the Chicago “Loop” location in the middle of the city.
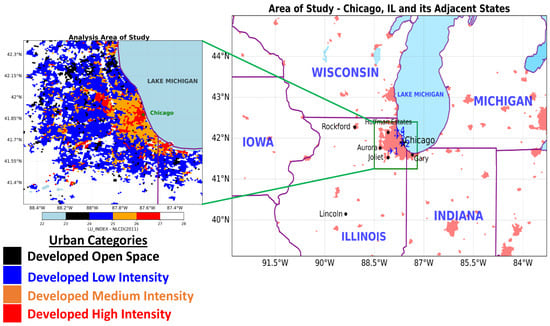
Figure 2.
The area of study focuses on Chicago, IL, USA, and its adjacent states. ✈1 indicates the airport location of KLOT (Romeoville, Chicago). ✈2 indicates the airport location of KMDW (Midway, Chicago). ✈3 indicates the airport location of KORD (O’Hare, Chicago). ✈4 indicates the airport location of KPWK (Wheeling, Chicago). For analysis, the focus is mainly on the Chicago metropolitan region, outlined by a green rectangle box. Urban land use categories for the WRF-UCM simulation are specified by four different colors. Star indicates the location of Chicago, IL, USA.

Table 1.
Summary of the WRF-ARW and WRF-UCM model configuration.
3. Simulations’ Intercomparison
UCM and ARW Validation
In this subsection, we qualitatively compare both simulations’ surface meteograms to the observed surface meteograms in Figure 3 and Figure 4 at the three Chicago metropolitan airports and the NWS Romeoville Forecast Office, whose locations are depicted in Figure 2 in this manuscript as well as in Figure 2 in Part I []. We will also subjectively compare NOAA NEXRAD composite reflectivity and hourly precipitation to both simulations’ composite reflectivity and hourly precipitation. We do so to establish which simulation best replicates the observations, although both simulations have errors.
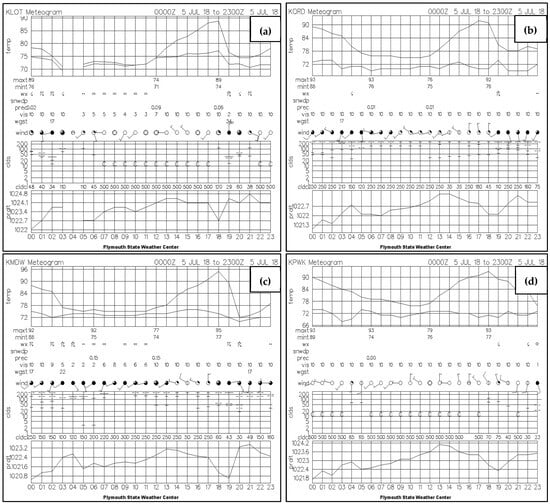
Figure 3.
Observed surface meteograms from the Plymouth State Weather Center for four stations in the Chicago metropolitan area: (a) Romeoville, IL (KLOT); (b) O’Hare International Airport (KORD); (c) Midway Airport (KMDW); and (d) Wheeling, IL (KPWK), during the 0000–2300 UTC period on 5 July 2018. Panels show the time evolution of surface temperature (T2), height of cloud ceiling, pressure (millibars), and wind speed/direction at each location.
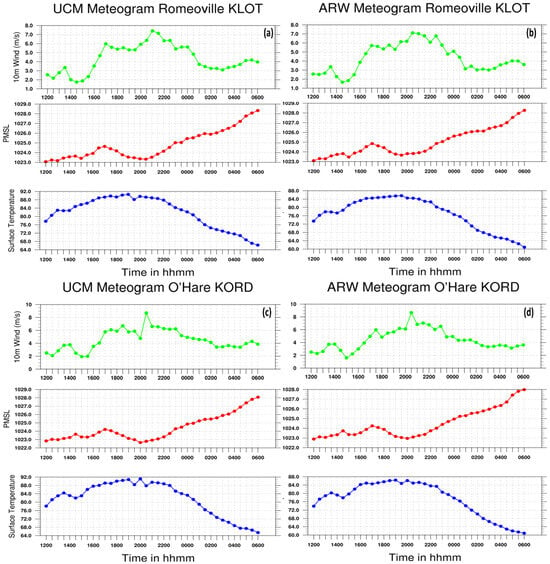
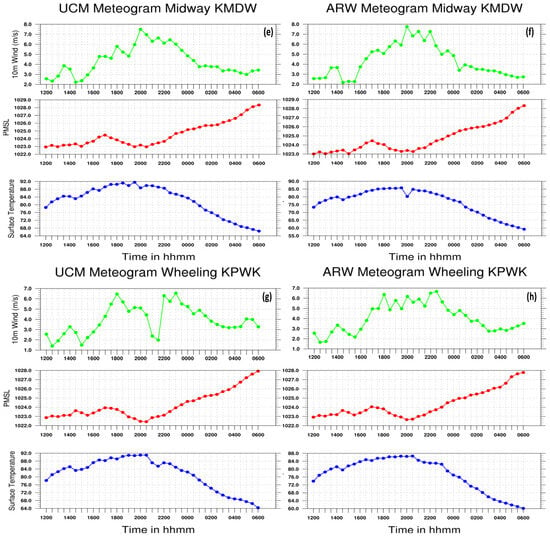
Figure 4.
Same as Figure 3 but for simulated WRF-UCM (left) and WRF-ARW (right) at (a,b) Romeoville, Illinois (KLOT); (c,d) O’Hare Airport (KORD); (e,f) Midway Airport (KMDW); and (g,h) Wheeling, Illinois (KPWK) for the 5–6 July 2018 period.
Three variables clearly differentiate the surface evolution in the UCM and ARW, with the UCM more closely approximating the observations in the meteograms (Figure 3 and Figure 4). First, the ARW has a cold bias in the diurnal heating signal, particularly at the warmest location, KMDW. In general, the ARW is 2–3 °C (~4–5 °F) too cold just prior to the arrival of convection at 18007/5. Second, and consistent with the first signal, the ARW does not capture the intensity of mean sea level pressure falls nor their onset timing, as well as the compensating pressure rise magnitude with the subsequent convective cold pool accompanying the meso-high as it lags the UCM by ~1 h. Third, the lag in the mass adjustments in the ARW also creates a lag in the shift in the surface winds to south–southeast from the northwest or west–southwest, which is better captured in the UCM. The heating errors coupled with the lag in convective initiation in the ARW allow the UCM surface simulation to generate slightly more accurate surface variables. Although the UCM simulation is biased early in terms of convective initiation. Both simulation meteograms have discrepancies in the period of pressure falls and rises as well as cooling with the meso-high development. The periods of mesoscale falls and rises are far too long in both, nearly doubling the airports’ meteograms. This error reflects the microphysics scheme sensitivity or is due to resolution constraints that limit the accurate simulation of small-scale pressure in both simulations.
We performed a quantitative comparison of 2 m temperature and 10 m wind speed using analysis domain-averaged bias and RMSE metrics, as shown in Figure 5 and Figure 6. The 2 m temperature comparison between the WRF-UCM and WRF-ARW simulations reveals the positive values of bias across nearly all time steps, especially during the afternoon and early evening hours (1400–1900 UTC), with median values close to zero and relatively low RMSE across the domain (Figure 5). This confirms that the UCM consistently produces higher temperatures than the baseline ARW simulation, which is consistent with the expected urbanization effect, where enhanced surface heating and reduced evaporative cooling in urban environments contribute to higher near-surface temperatures. Overall, the UCM simulation captures the expected thermal impact of urban morphology, with relatively modest errors compared to the non-urbanized ARW baseline simulation.

Figure 5.
Analysis domain-averaged bias and an RMSE of 2 m temperature between WRF-UCM and WRF-ARW simulations during the 12 h convective period from 12007/5 to 00007/6, 2018.
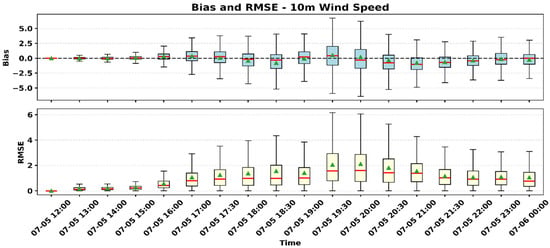
Figure 6.
Same as for Figure 5 but with 10 m wind speed.
Figure 6 shows the analysis domain-averaged bias and RMSE of 10 m wind speed between WRF-UCM and WRF-ARW. Bias values are near zero in the early hours but shift toward slightly negative during the afternoon and evening, indicating that UCM generally produces weaker near-surface winds. This is consistent with the effects of increased surface roughness and drag from urban features. RMSE remains low before 1500 UTC but rises sharply during peak mixing hours (1700–2000 UTC), suggesting greater divergence between the simulations when convective activity and urban effects are strongest. These results highlight the UCM’s impact on low-level wind structure, particularly under fully developed urban boundary layer conditions.
This ARW surface temperature error has significant implications for the evolution of moist convection, as illustrated in Figure 7 through the comparison between observed and simulated reflectivities. This becomes further evident when the hourly precipitation is heuristically compared to the NEXRAD Doppler-derived 60 min distribution (Figure 8). During the 18007/5–19007/5 period, observations show the precipitation building northeastwards (QLCS#1) and surrounding the metroplex while the UCM does so between 16307/5 and 17307/5, thus arriving roughly 60 min early. By comparison, the ARW does not generate any precipitation over the metroplex until nearly 19007/5, and furthermore, generates most of the precipitation well equatorward of the city through 19007/5. This ARW precipitation south of the city occurs long before that region, including the Indiana border ~50–100 km south of the lakefront, receives any precipitation in the observations, which is not until after 20007/5. The rapid eastward development towards the lakefront over Chicago is much more accurately simulated in the UCM, with even the time approaching 20007/5, indicating that the maximum of ARW is southwest of where it is observed and is simulated with the UCM somewhat more consistently in comparison with the reflectivities shown in Figure 7. The UCM much more closely replicates the true location of the maximum in the observations near KMDW. During the 19007/5–21007/5 period, the UCM expands the precipitation slightly north and west of the city relative to both the observations and the ARW. The observations show this expansion and increased precipitation to some extent. Finally, after 22007/5, the observations show that the maximum increase in magnitude and areal coverage is located well equatorward of the city and along the lakefront near KGYY, while both simulations significantly under-simulate the MCS evolution in this region. However, immediately after this period, i.e., after 23007/5, a new line (QLCS#2) is observed and simulated by both the UCM and ARW from the lakefront just poleward of the city to just east of DeKalb, IL, which is closely aligned with the polar cold front. An isolated maximum observed along the lakefront in this line is better simulated in the ARW, although after 00007/6, this line is observed to dissipate rapidly, and both simulations capture this trend, as will be shown later in this section.
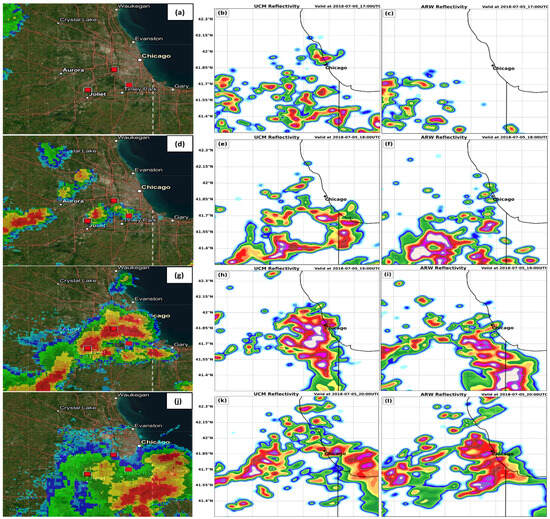
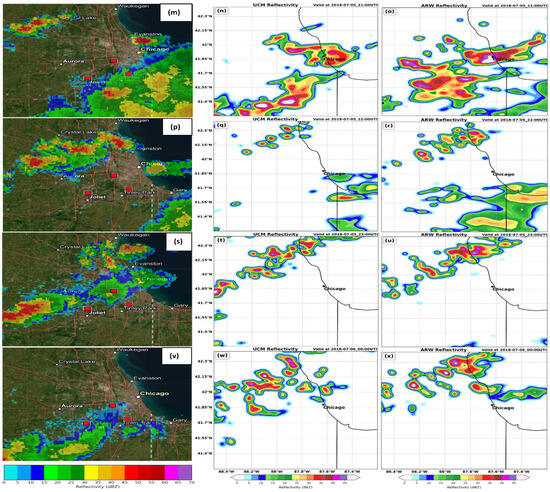
Figure 7.
NOAA NEXRAD Doppler composite reflectivity (dBz) (left), WRF-UCM (center), and WRF-ARW (right) simulated composite radar reflectivity (fill-in dBz) valid at (a–c) 1700 UTC, (d–f) 1800 UTC, (g–i) 1900 UTC, (j–l) 2000 UTC, (m–o) 2100 UTC, (p–r) 2200 UTC, and (s–u) 2300 UTC, 5 July 2018, as well as (v–x) 0000 UTC 6 July 2018. Star indicates the location of Chicago, IL, USA.
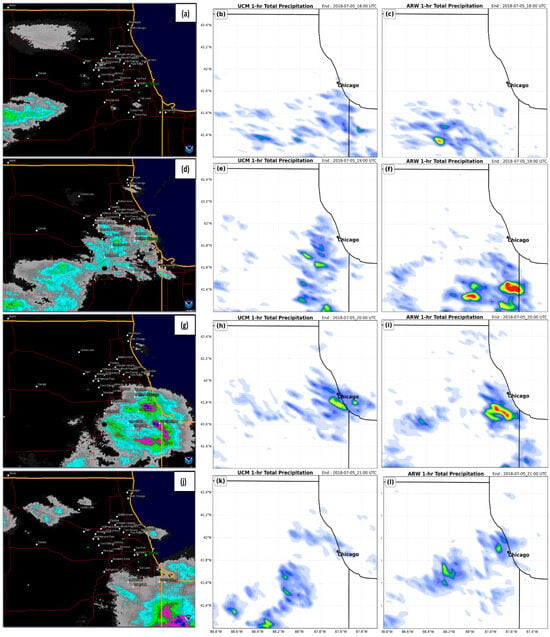

Figure 8.
NWS Chicago/Romeoville (KLOT) 60 min Doppler-derived rainfall totals (in) (left), WRF-UCM (center), and WRF-ARW (right) simulated hourly precipitation (mm) valid at approximately (a–c) 18007/5, (d–f) 19007/5, (g–i) 20007/5, (j–l) 21007/5, (m–o) 22007/5, (p–r) 23007/5, and (s–u) 00007/6. Star indicates the location of the center of Chicago, IL, USA.
In the following period, QLCS#1 begins to propagate away from the city, i.e., 22007/5–00007/6, QLCS#2 rapidly develops in both simulations but quickly dissipates as it moves over the city. The 6th July airport and NWS Office meteograms indicate that the response to the post-QLCS#1 surface heating is overestimated in the ARW simply because it underestimates the surface cooling, with the UCM temperatures being 2–3 °C cooler after 22007/5, which better verifies the UCM than the ARW. All observed meteograms on 6 July depict an equatorward movement of the polar front from KPWK to KLOT during the 03007/6–05007/6 period based on wind shifts to the north, pressure increases, and dewpoint decreases. As will be shown in the next subsection, the ARW is generally 1–2 h too early in simulating cold frontal passage (COLD FROPA) across the city, with the UCM timing being more accurate based on those same simulated COLD FROPA indicators. Thus, the UCM simulates the larger-scale frontal passage more accurately, indicating a real possibility that Chicago’s urban heating does modify circulation at scales of motion larger than the city.
In summary, the UCM is much faster and farther east in its simulation of precipitation, with the ARW lagging significantly in reality. This likely reflects the much more accurate surface heating cycle that the UCM simulates, particularly in the area roughly centered on KMDW, which allows the UCM to produce more robust near-surface convergence in response to increased surface heating, stronger low-level pressure falls, stronger low-level jet convergence, and upper-level divergence; these are outlined in the subsection on the simulations’ inter-comparison. A comparison of the 1 km grid’s total precipitation in both simulations in Figure 9 indicates that the UCM produces more precipitation in the downwind part of the city (rectangle box area), which is in accordance with many published simulation studies described in the introduction and with observational studies in Part I [], in which downwind of the city the precipitation is enhanced by the UHI. Quantitative analysis also confirms this spatial pattern in Figure 9, with WRF-UCM producing 42.6% more accumulated precipitation than WRF-ARW in the defined downwind region (Figure 10). This result reinforces the role of urban land surface processes in enhancing localized convective rainfall. Although the short period of pressure falls and rises, it is not accurately replicated in both simulations, being far too long and far too flat in both.
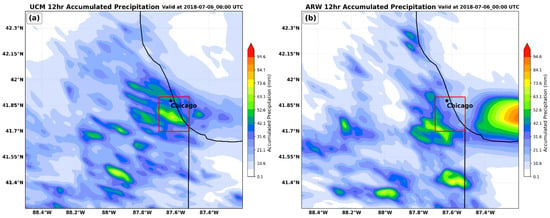
Figure 9.
The 12 hr accumulated precipitation (mm) from 12007/5 to 00007/6 for (a) WRF-UCM (left) and (b) WRF-ARW (right). Star indicates the location of the center of Chicago, IL, USA, and the red rectangle denotes the downwind analysis region used for quantitative comparison.
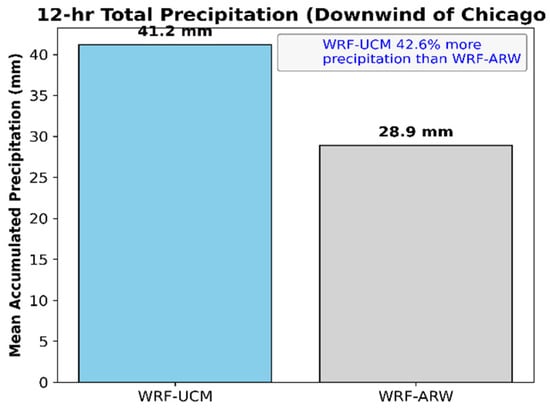
Figure 10.
Bar chart of mean 12 h accumulated precipitation in the downwind region of Chicago in WRF-UCM and WRF-ARW simulations.
4. WRF-UCM/ARW Intercomparisons of a Simulated Convective Environment
4.1. WRF-UCM/ARW Intercomparison for QLCS#1
The differences described in the previous subsection regarding the early morning heating in the boundary layer at KMDW between the control and the experiment, i.e., WRF-ARW and WRF-UCM, respectively, is evident during the 14007/5–16007/5 period in Figure 11. The ~2 °C warmer surface temperatures in the UCM have a profound effect on the structure of the boundary layer airflow and surface-based convective available potential energy (SBCAPE), particularly in a narrow strip ~5–10 km inland along the lakefront south of the Loop. That region is generally aligned with the UCM’s earlier and stronger onshore lake breeze, which responds to the inland heating. Thus, it is a region of focused moisture convergence as well as larger surface heating in the UCM. During this period, i.e., 14007/5–16307/5, the added heat in the UCM is first confined to the western and southwestern periphery of the city but eventually builds over the city and towards the lakefront. By 16007/5, a narrow ~10 km wide strip of SBCAPE > 2400 J kg−1 extends from the Loop down to the southern Lake Michigan shoreline in the UCM, which is not evident in the ARW in Figure 12. This maximum is > 200 J kg−1 larger than the SBCAPE just west of this location. Also, the UCM SBCAPE builds along the western flank of the city, becoming larger than the ARW. This large maximum strip of SBCAPE along the lakefront exists only in the UCM, and it is important to note that in the moister low-level air away from the lake well southwest of the city and close to the Indiana border the ARW has higher SBCAPE because of more moisture, which is a result of the temperatures being lower at 15007/5 than in the UCM across the region. But despite the region of higher SBCAPE due to higher moisture southwest of the city, the UCM triggers convection ~2 h earlier than the ARW, likely reflecting both more surface heating and the heating-induced meso-low. Its inflow is accompanied by multiple low-level jets that are stronger and earlier in the UCM, as can be seen in Figure 12 and Figure 13.
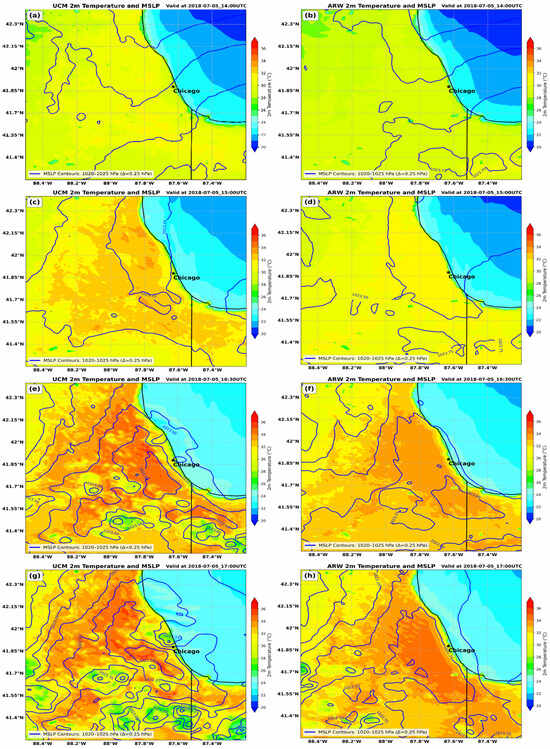
Figure 11.
WRF-UCM (left) and WRF-ARW (right) simulated the 2 m temperature (fill in °C) and mean sea level pressure (MSLP, solid in hPa) valid at (a,b) 14007/5, (c,d) 15007/5, (e,f) 16307/5, and (g,h) 17007/5. Star indicates the location of the center of Chicago, IL, USA.
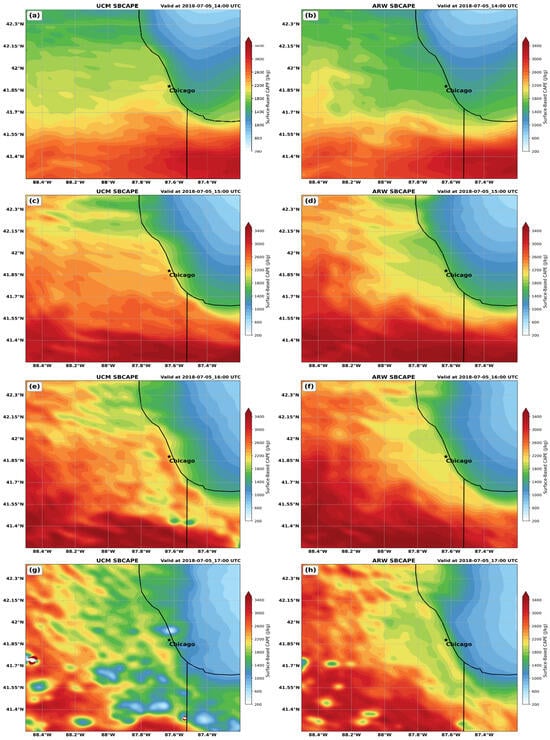
Figure 12.
WRF-UCM (left) and WRF-ARW (right) simulated SBCAPE (fill in J kg−1) valid at (a,b) 14007/5, (c,d) 15007/5, (e,f) 16007/5, and (g,h) 17007/5. Star indicates the location of the center of Chicago, IL, USA.
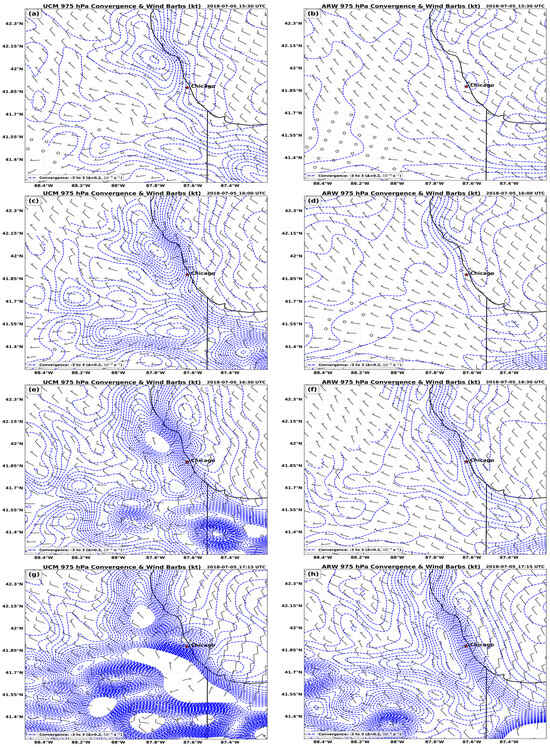
Figure 13.
WRF-UCM (left) and WRF-ARW (right) simulated 975 hPa convergence (blue dashed in 10−4 s−1) and wind barbs (kt) valid at (a,b) 15307/5, (c,d) 16007/5, (e,f) 16307/5, and (g,h) 17157/5. Star indicates the location of the center of Chicago, IL, USA.
Consistent with this increased surface heating and SBCAPE is the weak northwest–southeast-oriented mean sea level pressure meso-low that develops between 15007/5 and 16307/5 along the western edge of the SBCAPE maximum strip and is centered near or just southeast of KMDW in the UCM and ARW. This meso-low much more rapidly strengthens in the UCM (Figure 11e–h) after initiating the first moist convection around 16307/5 just southeast of the city near the Indiana border. This meso-low becomes much more predominant and develops more rapidly in the UCM during and after 16307/5 in Figure 11e,g, and likely develops earlier in UCM because of warmer surface temperatures, consequently resulting in earlier and stronger convergence from the three low-level surrounding jets before the ARW (Figure 13).
In response to this low-level mass adjustment associated with the meso-low, during 16007/5–17157/5 period, three near-surface wind maxima became organized in the UCM while still largely missing or weaker in the ARW, as can be seen at 15307/5–16307/5 in Figure 13c,e,g. Most notable is the penetration of the lake breeze onshore into the strip of higher SBCAPE (Figure 12e) along the lakefront, but also evident is the strengthening of the north–northwesterly jet on the west side of the metroplex and the west–southwesterly jet on the southwestern and southern sides of the metroplex. The much more rapidly developing and stronger signals of these jets in the UCM, particularly the inland penetration of the lake breeze several kilometers more than the ARW just south of the Loop, near the center of the city, and directed at KMDW 1–2 h earlier, are a response to urban heating-induced mean sea level pressure decreases (meso-low genesis) and PBL wind accelerations centered near this hottest airport location, i.e., KMDW, as seen in Figure 11g,h and Figure 13g,h. Also, in Figure 13e,g, the evolution of 975 hPa convergence aligning nicely with maxima approaching or exceeding 10−4 s−1 in roughly a triangular pattern, generally surrounding KMDW to the south, west, and north, i.e., from northwest of the city to north–northeast of the city, thus narrowing southeast of the city towards the northern Illinois–Indiana border near the lakefront. It is important to reiterate that such a pattern is representative of the early developing radar echoes, as depicted in Figure 7h at 1900 UTC. This triangular pattern is evident in the 975 hPa convergence in both simulations but is much earlier and better defined in the UCM as it tapers to a point north of the Illinois–Indiana border and is widest roughly west of the Loop, possibly reflecting the more rapid meso-low genesis in the UCM. Figure 11g highlights the meso-low/-high couplet roughly centered on this triangular convergence pattern with the 1022 hPa low and 1024 hPa high within ~20 km of each other in the UCM but at least an hour or more ahead of the ARW. As can be seen in Figure 11g,h, Figure 12g,h and Figure 13e, the UCM can develop a triangular set of convergence maxima nearly one order of magnitude larger than the ARW, shifting the convective triggering to an earlier time and expanding its coverage eastwards.
Figure 14, Figure 15 and Figure 16 indicate how the enhanced SBCAPE and stronger low-level convergence trigger convection within the triangular zone in the UCM, while in the ARW, convection develops more than one hour later and is limited to the region on the southwestern flank of this triangle early on. The lower troposphere, most notably the convective PBL, is clearly energized by 16007/5 in the UCM well before the ARW. Cells develop in the 700 hPa relative humidity field in this region in Figure 15 by 1600 UTC in proximity to much more PBL and TKE, as well as very well-defined and long wavelength PBL “rolls” evident in the PBL height simulation shown in Figure 14 when the UCM and ARW are compared. The stronger TKE and PBL height perturbations in the UCM indicate a much more turbulent PBL across the entire metroplex, with convective initiation first at 16307/5 along the southwestern–southeastern part of the triangle, spreading throughout the metroplex in the UCM by 17007/5. While the ~60–90 min early aspect in the stronger reflectivities will be discussed below, the UCM convection encompasses the observed trigger zones described previously, where the ARW convection timing is much slower, but the convection develops first exclusively on the southwestern side of town in the ARW, not in the multiple locations observed in Figure 7 and simulated by the UCM. Figure 16 clearly shows how the KLOT and KMDW soundings in the UCM are much more favorably primed for early convective triggering than in the ARW. At 1400 UTC, all CAPE values are higher in the UCM, but the more rapid convective triggering in the UCM depletes the CAPE faster in the UCM as well. Note the layer located approximately between 850 hPa and 750 hPa in the later four soundings. At both locations and times, there is a deeper adiabatic layer in the UCM reflecting the cooler mid-layer—850 hPa temperatures, the saturated lower part of the 850–750 hPa layer in the UCM, the slightly warmer surface temperature in the UCM, and more active kinetic energy, as indicated by the stronger PBL winds in the UCM. Thus, a much more favorable environment for long-lived deep moist convection in the UCM develops earlier than in the ARW.
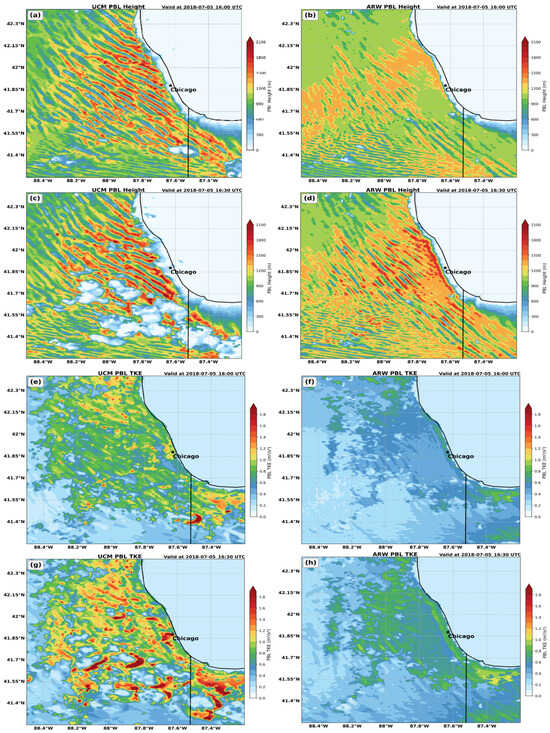
Figure 14.
WRF-UCM (left) and WRF-ARW (right) simulated PBL height (fill-in m) valid at (a,b) 16007/5 and (c,d) 16307/5, and the PBL Turbulent Kinetic Energy (TKE; fill-in m2s−2) valid at (e,f) 16007/5 and (g,h) 16307/5. Star indicates the location of Chicago, IL, USA.
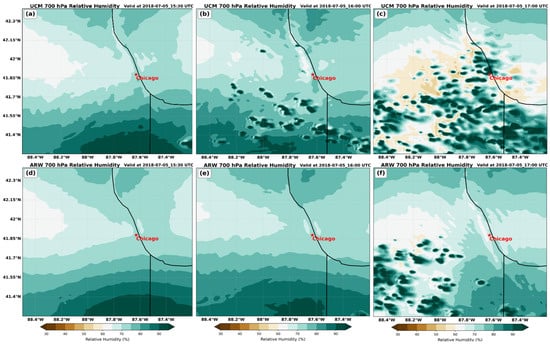
Figure 15.
WRF-UCM (top) and WRF-ARW (bottom) simulated 700 hPa relative humidity (fill in %) valid at (a,d) 15307/5, (b,e) 16007/5, and (c,f) 17007/5. Star indicates the location of Chicago, IL, USA.
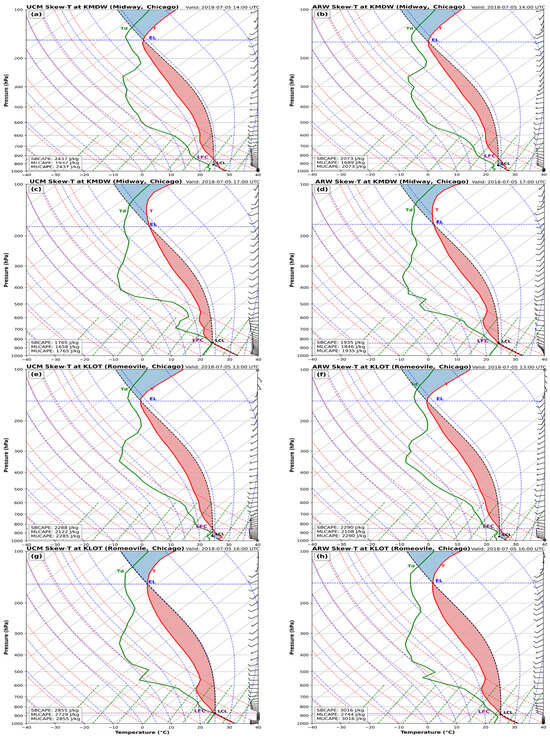
Figure 16.
WRF-UCM (left) and WRF-ARW (right) Skew-T diagrams for and valid at (a,b) KMDW 14007/5, (c,d) KMDW 17007/5, (e,f) KLOT 13007/5, and (g,h) KLOT 16007/5.
Figure 7 depicts the evolution of the simulated echoes after initial triggering, first in the UCM and then later in the ARW. The development of echoes > 50 dBz earlier in the UCM, with the strong shifting of the echo signal towards the lakefront, is evident, allowing simulated intense cells some residence time over and just east–southeast of KMDW. This evolution between 17007/5 and 19007/5 in the UCM is marked by a more rapidly developing and stronger convection farther poleward across the city and closer to the lakefront. The synergistic interaction among moist convection, cold pool/meso-high genesis, and lower tropospheric convergence/upper-tropospheric divergence is much earlier and stronger in the UCM than in the ARW. Figure 17, Figure 18 and Figure 19 depict the evolving surface temperature and mean sea level pressure, 250 hPa wind flow and divergence, and 975 hPa wind flow and convergence during this pivotal period of intensifying heavy precipitation over the metroplex, i.e., the 17307/5–20307/5 period. Note the greater rate of intensification and poleward growth of the divergence aloft, surface cold pool, and meso-high, as well as poleward-directed 975 hPa wind barbs along the lakefront, extending inland up to and northwest of KMDW in the UCM compared to the ARW. Observations of surface pressure tendency and streamline flow presented in Part I [] support the strong meso-high and poleward flow, as can be inferred from the meteograms as well as the radar imagery in Figure 4 and Figure 7. The UCM more rapidly generates the outflow aloft in the upper-level divergence fields in Figure 18, which increases the lifting in the environment, and the stronger lifting realizes the larger SBCAPE, resulting in more intense UCM-simulated convective updrafts and downdrafts. As noted in the validation section, this allows the much more rapid development of convective precipitation over the metroplex, as depicted in Figure 7 and Figure 8, and its growth is both eastward along the lakefront and poleward/westward of the city in the UCM. Both simulations indicate that the meso-high propagates poleward through the metroplex. However, the UCM more distinctly indicates a splitting of the meso-high with a lobe of high-pressure drifting westwards around the southwestern part of the metroplex. Both simulations have this feature, but it is stronger in the UCM, as seen in Figure 17 after 19307/5. Strong southerly–southeasterly surface flow, as observed in Part I [], propagates across the metroplex in both simulations, with the UCM low-level flow accelerating sooner and farther poleward than the ARW. Aloft, the UCM airflow more rapidly develops anticyclonic surges of air across the city that support the divergence and the more rapid poleward propagation of the convection, as seen in Figure 18.
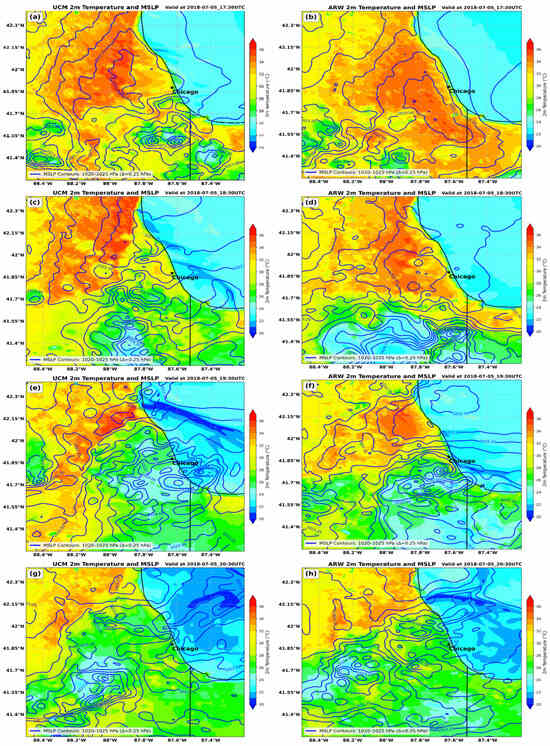
Figure 17.
Same as Figure 11 but valid at (a,b) 17307/5, (c,d) 18307/5, (e,f) 19307/5, and (g,h) 20307/5.
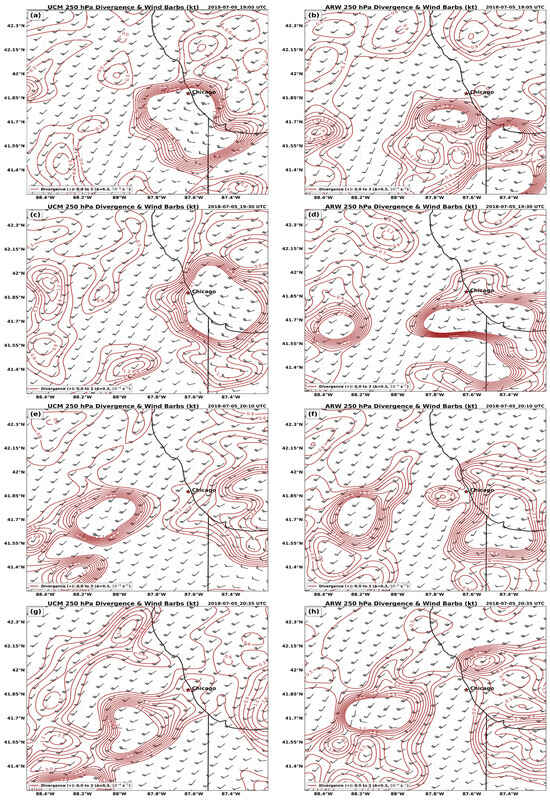
Figure 18.
WRF-UCM (left) and WRF-ARW (right) simulated 250 hPa divergence (solid brown 10−4 −1) and wind barbs (kt) valid at (a,b) 19057/5, (c,d) 19307/5, (e,f) 20107/5, and (g,h) 20357/5.
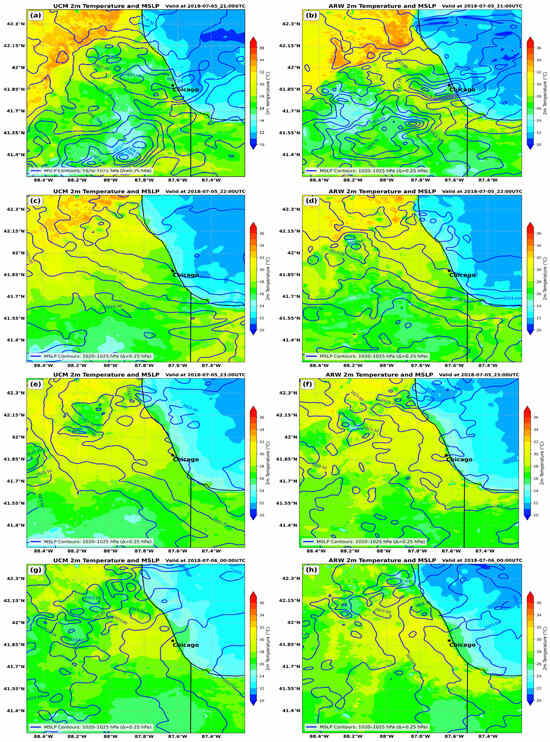
Figure 19.
Same as Figure 11 but valid at (a,b) 21007/5, (c,d) 22007/5, (e,f) 23007/5, and (g,h) 00007/6.
4.2. WRF-UCM/ARW Intercomparison for QLCS#2
During the period from 22007/5 to 00007/6, QLCS#2 develops along a northeast–southwest axis and propagates southeastwards through the metroplex, weakening rapidly as it moves. By 03007/6, for all intents and purposes, it dissipates entirely southeast of the city, as can be seen in Figure 7, Figure 8 and Figure 9. Figure 7 indicates the remarkable similarity in the simulated echoes between the UCM and ARW at this later time. QLCS#2 forms in the convergence zone between the south–southeasterly surface flow and northwesterly surface flow ahead of and with the cold front in the UCM, and the south–southwesterly surface flow and the northwesterly surface flow ahead of and with the cold front in the ARW. The stronger surface southerly flow and its slightly more poleward location in the UCM force the development of QLCS#2 slightly more poleward; however, in time, the larger scale environment controls the dissipation of this system in both simulations. Just as was true for QLCS#1, the larger scale environment plays a key role in facilitating or dissipating the convection, and if that environment is favorable, the city-scale forcing can be very effective in modifying the convective precipitation, but if not favorable, the city forcing seems to be relatively insignificant. There are multiple reasons for the dissipation but clearly, the more significant evaporational cooling in the UCM resulting from more vigorous convection over and poleward of the metropolitan region is one reason for the diminished surface temperatures and diminished SBCAPE when directly compared to ARW in Figure 20b–d. Cooler surface temperatures are evident in Figure 19’s UCM simulation after QLCS#1 begins to leave the city, and these cooler temperatures more closely reflect meteograms on July 6. Both simulations, however, rapidly weaken this QLCS#2 in response to larger scale drying aloft, as noted in the observational analyses in Part I [], as sinking motion aloft occurs above and ahead of the polar cold front. This drying is reflected in the SBCAPE comparison after 00007/6, with the ARW losing all SBCAPE on the poleward side of the city 1–2 h in both the observed meteograms, which indicate surface drying, as shown in Figure 3, and the 925 hPa analysis in Part I, which indicates rapid drying over the city. Hence, the UCM slowdown of that drying better reflects the observed cold frontal motion across the city with the slow passage from north to south during 03007/6–05007/6. Also, interestingly, despite the colder surface temperatures in the UCM, SBCAPE values in the earlier periods depicted in Figure 20 are slightly higher in the UCM as a stronger southeasterly as opposed to southwesterly flow in the ARW transports more low-level moisture across the city and greater lifting creates slightly colder air aloft in the UCM, as seen in simulated soundings late on 5 July.
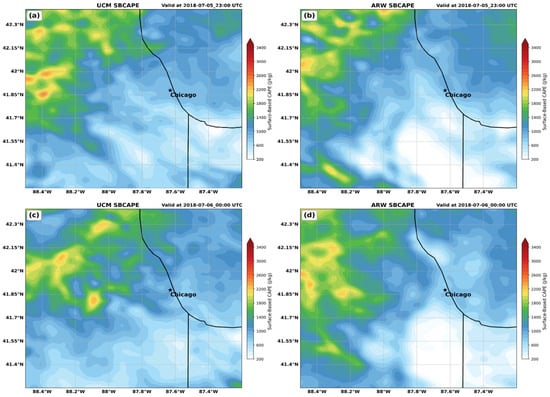
Figure 20.
WRF-UCM (left) and WRF-ARW (right) simulated SBCAPE (fill in J kg−1) valid at (a,b) 23007/5 and (c,d) 00007/6.
Figure 7, Figure 8 and Figure 9 depict the differences in precipitation between the simulations and echo evolution during the dissipation of QLCS#2, with the rainfall and echo patterns both rapidly dying as the line propagates through the city. Virtually no simulated precipitation occurs in both the UCM and ARW after 00007/6, consistent with the Doppler observations in Figure 7, Figure 8 and Figure 9. Figure 20 clearly indicates that the ARW moves the cold front through the city, as can be seen in the much faster elimination of SBCAPE as the warmer surface temperatures in the ARW increase the low-level equatorward-directed pressure gradient with the cold front. This results in the removal of SBCAPE, at a faster rate in the ARW relative to the UCM, and an unrealistically early cold frontal passage is present in the ARW. In Figure 9, a comparison of the 12-hoursimulated (1 km grid) total precipitation indicates that the UCM produces a more accurate positioning of the maximum over the city near KMDW, as seen as well in the Doppler total in Figure 8 at 19007/5 with the ARW maximum south and west of the city. Like many published studies referenced in the introduction, the UCM total precipitation is larger poleward and west of the city, demonstrating that simulation’s more detailed and realistic depiction of the UHI’s energizing effects on convective development and evolution.
5. Discussion
As described in detail in Part I, a multi-scale observational analysis indicates that a massive ridge of high pressure aloft extends across much of the central U.S., with a zone of weak diffluence situated over the Chicago metro area along the ridge’s northwestern flank. This synoptic-scale setup supports strong low-level moisture transport around the ridge, in combination with a slow-moving surface trough, establishes a favorable environment for the convection at the meso-α/β scale east and equatorward of the city, generating substantial SBCAPE values. The upper-tropospheric divergence within the diffluent portion of the ridge is further strengthened by the outflow from early moist convection occurring to the south and east, which gradually builds poleward and westward, propagating over the weak surface trough. A line of convection forms within the trough and builds northeastwards through the city, with cells triggering on the southwest, northwest, and southeastern flanks, roughly centered on Midway Airport and its surrounding urban areas.
The WRF-ARW and WRF-UCM simulations reveal substantially different urban forcing signals, particularly in terms of surface energy fluxes and their influence on the city-scale mass field. Quantitative differences between the simulations include the following: (1) WRF-UCM simulates surface temperatures that are approximately 2–3 °C warmer than WRF-ARW across the city; (2) WRF-UCM generates ~800–1000 J kg−1 more SBCAPE than WRF-ARW; (3) near-surface (975 hPa) convergence is roughly three times greater in WRF-UCM and propagates poleward more rapidly than WRF-ARW; (4) WRF-UCM produces a boundary layer height that is ~400 m higher and a TKE roughly that is twice as large as those in WRF-ARW; (5) the WRF-UCM 700 hPa relative humidity achieves saturation ~90 min sooner than that of WRF-ARW, as does convective initiation over the city; (6) the poleward-propagating meso-high in WRF-UCM advances at nearly twice the speed of its ARW counterpart; (7) upper-level divergence at 250 hPa is slightly stronger and faster-propagating than in WRF-UCM; and (8) the WRF-UCM total precipitation regions of > 12.8 mm and > 25.6 mm both cover nearly twice the area, develop faster, and are shifted downstream, i.e., northwest of the city by nearly 20 km in WRF-UCM compared to WRF-ARW, even though the absolute maxima of total precipitation are similar to the observations in both simulations.
These results highlight that the more rapid and substantial urban-induced low-level heating in the UCM generates an elongated strip of warmer near-surface air early over the western side of the city, which then intensifies and encompasses most of the city, including the lakefront. The simulated and observed hot-spot is roughly centered near Midway Airport after converging warm air and moisture into that location. This warming, which is quicker and 2–3 °C larger at KMDW in the UCM relative to the ARW simulation, in turn, creates a faster developing and more significant mesoscale low-pressure region that enhances three low-level jets: (1) a north–northwesterly jet on the west side of the metroplex, (2) a southwesterly–southerly jet on the south and southeast side of the metroplex, and (3) a lake breeze jet which penetrates farthest inland between the Loop and Midway Airport. These jets are stronger, and the convergence is much more substantial in the UCM simulation. Convection building northeastwards in the meso-α/β-scale surface trough, within which Chicago is embedded, is then triggered and surrounds the city in the low-level jet convergence maxima. These meso-β/γ-scale complexes of convection are focused within the strongest convergence zones established by these three jets as well as the broader scale upper-level divergence propagating poleward and westward from northern Indiana. As this convection strengthens, cold downdrafts and a poleward propagating gust fronts and meso-highs dominate the city-scale circulation in the UCM with a weaker and westward-shifted convective complex in the ARW. The surface outflow from the meso-high in the UCM propagates poleward through the city at a faster velocity relative to the ARW, thus enhancing precipitation throughout the city earlier in the UCM simulation.
Consistent with the observations, this first QLCS, #1 propagates southeastwards into northern Indiana after producing heavy precipitation near KMDW, while the second QLCS, #2, develops roughly in the zone between the poleward-moving outflow from the QLCS#1 meso-high and an approaching polar cold front. The cold pool from QLCS#1 is being more accurately simulated and is more substantial in the UCM. This UCM cold pool then combines with dryer air aloft in the cold front and jet circulation to inhibit convection in the QLCS#2 in a manner not substantially dissimilar from the ARW. While both simulations rapidly dissipate the QLCS#2 as it moves over the city, the cold front moves unrealistically quickly in the ARW. The UCM’s stronger surface meso-high and -low resulting from the convective circulations act to produce a stronger opposing flow that slows the front, and therefore, the UCM produces a more accurately timed cold frontal passage across the city. A comparison of the 1 km grid’s total precipitation in both simulations in Figure 9 indicates that the UCM produces more precipitation poleward and northwest of the city, reflecting many published studies described in the introduction and in Part I, in which the precipitation is enhanced by the UHI downwind of the city.
6. Conclusions
This manuscript describes the complex interactions among multiple QLCSs and the urban-induced circulations over the Chicago metropolitan region. It perhaps epitomizes the potential for urban impacts on city-scale circulations, in that this case study is a weakly forced synoptic scale system yet produces substantial convective precipitation due to large SBCAPE and precipitable water. Despite the weak larger-scale forcing, there are numerous complexities in the environmental evolution independent of the city, which add substantially to the detail in the ongoing physical processes. WRF-ARW and single-layer WRF-UCM simulations produce a significantly different early convective circulation (QLCS#1), with the UCM more closely reflecting the general evolution of radar echoes and surface conditions, as observed at local airports and the NWS Forecast Office, because of its improved surface representation of the UHI. Note that while single-layer WRF-UCM captures key aspects of bulk urban effects such as thermal forcing and surface roughness, it lacks the ability to resolve detailed features like street canyon flows, building shading, and urban vegetation interactions. These limitations can be avoided by incorporating WUDAPT-based WRF, which offers the enhanced characterization of urban morphology by using a multi-layer urban canopy parameterization scheme.
Like numerous other urban-scale simulations mentioned in the introduction, this study clearly indicates that the urban heat island can substantially modify the rate of development, location, intensity, and magnitude of precipitation. Perhaps more so than most studies, however, this (two-part) study analyzes the details of urban forcing and evolving larger-scale meteorological circulations and their implications for the varying city-scale precipitation. The main finding of this research is the fact that the larger scale environment plays a key role in facilitating or dissipating the convection, and if that environment is favorable, the city-scale forcing can be very effective in modifying the convective precipitation. However, if it is not favorable, the city forcing seems to be relatively insignificant. Future studies should continue this approach to analyzing urban forcing effects on precipitation with heavier rain events, such as the extreme precipitation event in Chicago on 2–3 July 2023, and lake effect snow events, as well as stronger synoptic forcing events. We will also test the sensitivity of urban forcing at much finer, large eddy simulation scales of motion of ~100 m, which may be able to better resolve the urban canyon phenomenon, as well as employing the WRF-BEP/BEM multi-layer urban canopy model.
Author Contributions
Conceptualization, M.L.K. and S.M.S.K.; methodology, M.L.K. and S.M.S.K.; software: S.M.S.K.; validation, M.L.K. and S.M.S.K.; formal analysis, M.L.K. and S.M.S.K.; investigation, M.L.K. and S.M.S.K., resources, M.L.K. and Y.-L.L.; data curation, M.L.K. and S.M.S.K.; writing—original draft presentation, M.L.K. and S.M.S.K.; writing—review and editing, M.L.K., S.M.S.K. and Y.-L.L.; visualization, S.M.S.K.; supervision, M.L.K. and Y.-L.L.; project administration, M.L.K. and Y.-L.L.; and funding acquisition, M.L.K., and Y.-L.L. All authors have read and agreed to the published version of the manuscript.
Funding
This research was funded by the Department of Energy under contract #DE-SC0023240.
Institutional Review Board Statement
Not applicable.
Informed Consent Statement
Not applicable.
Data Availability Statement
The datasets generated and/or analyzed that support the findings of this study are available from the corresponding author upon reasonable request. Due to privacy reasons, these datasets are not openly accessible.
Acknowledgments
Computational resources were provided by the NCAR Computational and Information Systems Laboratory (CISL) through allocations to the Cheyenne and Derecho supercomputers (project nos. UNCT0001, UNCT0005, and UHAM0002). The authors also thank the three anonymous reviewers for their constructive feedback, which enhanced the overall quality of this manuscript.
Conflicts of Interest
The authors declare that there are no conflicts of interest. Funding agencies did not participate in the design, data handling, analysis, or publication decisions related to this study.
Abbreviations
The following abbreviations are used in this manuscript:
| QLCS | Quasi-linear convective systems |
| UHI | Urban heat island |
| URI | Urban river island |
| WRF-ARW | Weather Research and Forecasting-Advanced Research Weather Model |
| WRF-UCM | WRF urban canopy model |
| NEXRAD | Next generation Doppler weather radar |
| NLCD | National Land Cover Database |
| ERA5 | European Centre for Medium-Range Weather Forecasts Reanalysis 5 |
| MSLP | Mean sea level pressure |
| SBCAPE | Surface-based convective available potential energy |
| PBL | Planetary boundary layer |
| TKE | Turbulent kinetic energy |
| KMDW | Midway Airport, Chicago |
| KORD | O’Hare Airport, Chicago |
| KPWK | Wheeling Airport, Chicago |
| KLOT | Lewis University Airport, Chicago/Romeoville |
| KDPA | DuPage Airport |
| KGYY | Gary, Indiana |
References
- Han, J.-Y.; Baik, J.-J. A Theoretical and Numerical Study of Urban Heat Island–Induced Circulation and Convection. J. Atmos. Sci. 2008, 65, 1859–1877. [Google Scholar] [CrossRef]
- Han, J.-Y.; Baik, J.-J.; Lee, H. Urban impacts on precipitation. Asia-Pac. J. Atmos. Sci. 2014, 50, 17–30. [Google Scholar] [CrossRef]
- Han, L.; Wang, L.; Chen, H.; Xu, Y.; Sun, F.; Reed, K.; Deng, X.; Li, W. Impacts of Long-Term Urbanization on Summer Rainfall Climatology in Yangtze River Delta Agglomeration of China. Geophys. Res. Lett. 2022, 49, e2021GL097546. [Google Scholar] [CrossRef]
- Hosannah, N.; Gonzalez, J.E. Impacts of Aerosol Particle Size Distribution and Land Cover Land Use on Precipitation in a Coastal Urban Environment Using a Cloud-Resolving Mesoscale Model. Adv. Meteorol. 2014, 2014, 904571. [Google Scholar] [CrossRef]
- Miao, S.; Chen, F.; LeMone, M.A.; Tewari, M.; Li, Q.; Wang, Y. An Observational and Modeling Study of Characteristics of Urban Heat Island and Boundary Layer Structures in Beijing. J. Appl. Meteorol. Clim. 2009, 48, 484–501. [Google Scholar] [CrossRef]
- Miao, S.; Chen, F.; Li, Q.; Fan, S. Impacts of Urban Processes and Urbanization on Summer Precipitation: A Case Study of Heavy Rainfall in Beijing on 1 August 2006. J. Appl. Meteorol. Clim. 2011, 50, 806–825. [Google Scholar] [CrossRef]
- Niyogi, D.; Pyle, P.; Lei, M.; Arya, S.P.; Kishtawal, C.M.; Shepherd, M.; Chen, F.; Wolfe, B. Urban Modification of Thunderstorms: An Observational Storm Climatology and Model Case Study for the Indianapolis Urban Region. J. Appl. Meteorol. Clim. 2011, 50, 1129–1144. [Google Scholar] [CrossRef]
- Niyogi, D.; Lei, M.; Kishtawal, C.; Schmid, P.; Shepherd, M. Urbanization Impacts on the Summer Heavy Rainfall Climatology over the Eastern United States. Earth Interact. 2017, 21, 1–17. [Google Scholar] [CrossRef]
- Qian, Y.; Chakraborty, T.C.; Li, J.; Li, D.; He, C.; Sarangi, C.; Chen, F.; Yang, X.; Leung, L.R. Urbanization Impact on Regional Climate and Extreme Weather: Current Understanding, Uncertainties, and Future Research Directions. Adv. Atmos. Sci. 2022, 39, 819–860. [Google Scholar] [CrossRef]
- Rosenfeld, D.; Lohmann, U.; Raga, G.B.; O’Dowd, C.D.; Kulmala, M.; Fuzzi, S.; Reissell, A.; Andreae, M.O. Flood or Drought: How Do Aerosols Affect Precipitation? Science 2008, 321, 1309–1313. [Google Scholar] [CrossRef]
- Shen, Y.; Yang, L. Divergent Urban Signatures in Rainfall Anomalies Explained by Pre-Storm Environment Contrast. Geophys. Res. Lett. 2023, 50, e2022GL101658. [Google Scholar] [CrossRef]
- Steensen, B.M.; Marelle, L.; Hodnebrog, Ø.; Myhre, G. Future urban heat island influence on precipitation. Clim. Dyn. 2022, 58, 3393–3403. [Google Scholar] [CrossRef]
- Sun, X.; Luo, Y.; Gao, X.; Wu, M.; Li, M.; Huang, L.; Zhang, D.-L.; Xu, H. On the Localized Extreme Rainfall over the Great Bay Area in South China with Complex Topography and Strong UHI Effects. Mon. Weather. Rev. 2021, 149, 2777–2801. [Google Scholar] [CrossRef]
- Yang, L.; Li, Q.; Yuan, H.; Niu, Z.; Wang, L. Impacts of Urban Canopy on Two Convective Storms With Contrasting Synoptic Conditions Over Nanjing, China. J. Geophys. Res. Atmos. 2021, 126, e2020JD034509. [Google Scholar] [CrossRef]
- Zhang, Y.; Smith, J.A.; Luo, L.; Wang, Z.; Baeck, M.L. Urbanization and Rainfall Variability in the Beijing Metropolitan Region. J. Hydrometeorol. 2014, 15, 2219–2235. [Google Scholar] [CrossRef]
- Zhang, X.; Yang, Y.; Chen, B.; Huang, W. Operational Precipitation Forecast Over China Using the Weather Research and Forecasting (WRF) Model at a Gray-Zone Resolution: Impact of Convection Parameterization. Weather. Forecast. 2021, 36, 915–928. [Google Scholar] [CrossRef]
- Zhong, S.; Qian, Y.; Zhao, C.; Leung, R.; Yang, X.-Q. A case study of urbanization impact on summer precipitation in the Greater Beijing Metropolitan Area: Urban heat island versus aerosol effects. J. Geophys. Res. Atmos. 2015, 120, 10903–10914. [Google Scholar] [CrossRef]
- Kaplan, M.L.; Karim, S.M.S.; Lin, Y.-L. Urban Impacts on Convective Squall Lines over Chicago in the Warm Season—Part I: Observations of Multi-Scale Convective Evolution. Atmosphere 2025, 16, 306. [Google Scholar] [CrossRef]
- Plymouth SWC: Plymouth State Weather Center Data Archive. Available online: https://vortex.plymouth.edu/myowxp/sfc/statlog-a.html (accessed on 5 April 2024).
- NOAA NEXRAD: NOAA National Weather Service (NWS) Radar Operations Center (1992): NOAA Next Generation Radar (NEXRAD) Level 3 Products. [Precipitation]. NOAA National Centers for Environmental Information. NCEI DSI 7000. Available online: https://www.ncei.noaa.gov/maps/radar/ (accessed on 5 April 2024).
- Skamarock, W.C.; Klemp, J.B.; Dudhia, J.; Gill, D.O.; Liu, Z.; Berner, J.; Wang, W.; Powers, J.G.; Duda, M.G.; Barker, D.; et al. A Description of the Advanced Research WRF Model Version 4.3; National Center for Atmospheric Research: Boulder, CO, USA, 2021; p. 550. [Google Scholar]
- Barlage, M.; Miao, S.; Chen, F. Impact of physics parameterizations on high-resolution weather prediction over two Chinese megacities. J. Geophys. Res. Atmos. 2016, 121, 4487–4498. [Google Scholar] [CrossRef]
- Dewitz, J. National Land Cover Database (NLCD) 2011 Land Cover Conterminous United States [Data set]; U.S. Geological Survey data release; U.S. Geological Survey: Reston, VA, USA, 2020. [CrossRef]
- Hersbach, H.; Bell, B.; Berrisford, P.; Hirahara, S.; Horányi, A.; Muñoz-Sabater, J.; Nicolas, J.; Peubey, C.; Radu, R.; Schepers, D.; et al. The ERA5 global reanalysis. Q. J. R. Meteorol. Soc. 2020, 146, 1999–2049. [Google Scholar] [CrossRef]
- Thompson, G.; Field, P.R.; Rasmussen, R.M.; Hall, W.D. Explicit Forecasts of Winter Precipitation Using an Improved Bulk Microphysics Scheme. Part II: Implementation of a New Snow Parameterization. Mon. Weather Rev. 2008, 136, 5095–5115. [Google Scholar] [CrossRef]
- Janić, Z.I. Nonsingular Implementation of the Mellor-Yamada Level 2.5 Scheme in the NCEP Meso Model; National Centers for Environmental Prediction: College Park, MD, USA, 2001.
- Mlawer, E.J.; Taubman, S.J.; Brown, P.D.; Iacono, M.J.; Clough, S.A. Radiative transfer for inhomogeneous atmospheres: RRTM, a validated correlated-k model for the longwave. J. Geophys. Res. Atmos. 1997, 102, 16663–16682. [Google Scholar] [CrossRef]
- Monin, A.S.; Obukhov, A.M. Basic laws of turbulent mixing in the surface layer of the atmosphere. Contrib. Geophys. Inst. Acad. Sci. USSR 1954, 24, 163–187. [Google Scholar]
- Chen, F.; Dudhia, J. Coupling an Advanced Land Surface–Hydrology Model with the Penn State–NCAR MM5 Modeling System. Part I: Model Implementation and Sensitivity. Mon. Weather Rev. 2001, 129, 569–585. [Google Scholar] [CrossRef]
- Kain, J.S.; Fritsch, J.M. A One-Dimensional Entraining/Detraining Plume Model and Its Application in Convective Parameterization. J. Atmos. Sci. 1990, 47, 2784–2802. [Google Scholar] [CrossRef]
- Chen, F.; Kusaka, H.; Bornstein, R.; Ching, J.; Grimmond, S.; Grossman-Clarke, S.; Loridan, T.; Manning, K.W.; Martilli, A.; Miao, S.; et al. The integrated WRF/urban modelling system: Development, evaluation, and applications to urban environmental problems. Int. J. Clim. 2011, 31, 273–288. [Google Scholar] [CrossRef]
Disclaimer/Publisher’s Note: The statements, opinions and data contained in all publications are solely those of the individual author(s) and contributor(s) and not of MDPI and/or the editor(s). MDPI and/or the editor(s) disclaim responsibility for any injury to people or property resulting from any ideas, methods, instructions or products referred to in the content. |
© 2025 by the authors. Licensee MDPI, Basel, Switzerland. This article is an open access article distributed under the terms and conditions of the Creative Commons Attribution (CC BY) license (https://creativecommons.org/licenses/by/4.0/).