Article

The Geogenic Radon Potential in the Eastern Part of the Poiana Ruscă Mountains (Southern Carpathians, Romania)

“Constantin Cosma” Radon Laboratory—LiRaCC, Faculty of Environmental Science and Engineering, Babes-Bolyai University of Cluj-Napoca, 400294 Cluj-Napoca, Romania
*
Author to whom correspondence should be addressed.
Atmosphere 2025, 16(5), 596; https://doi.org/10.3390/atmos16050596
Submission received: 21 April 2025 / Revised: 6 May 2025 / Accepted: 9 May 2025 / Published: 15 May 2025
(This article belongs to the Topic The Effect of Air Pollution on Human Health)

Abstract

Detailed soil radon measurements were conducted in the eastern Poiana Ruscă Mountains, motivated by the area’s complex geology, varied topography, and previously reported high indoor radon levels that pose a health risk to local residents. A total of 110 locations were investigated by conducting 330 measurements over a 480 km2 area, using the Radon Monitor-2 (RM-2) and Radon-Jok devices, for assessing the radon activity concentration in soil and soil permeability in correlation with local geological formations. The Neznal method was used to derive the GRP, which was categorized into low (<10), medium (10–35), and high (≥35) risk categories. The arithmetic mean radon concentration was 37.5 kBq/m3, with values ranging from 5.1 to 163 kBq/m3. Soil permeability ranged widely across geological formations, from 6.9 × 10⁻¹⁴ to 2.7 × 10⁻¹¹ m2. The highest radon concentrations and geogenic radon potential (GRP) values were associated with micaceous schists interlayered with amphibolites and sericitic quartzite schists. The results, comparable to those from previous studies, indicate a medium to high geogenic radon potential in the eastern Poiana Ruscă Mountains, which exposes the inhabitants of Lunca Cernii de Sus and, to a lesser extent, those of Lunca Cernii de Jos to an increased radon risk.

1. Introduction

Radon is a naturally occurring radioactive gas, colorless and odorless, and it is the second leading cause of lung cancer after smoking [1]. The main source of indoor radon is the soil beneath buildings.
In general terms, geogenic radon refers to the naturally occurring radon that originates from the Earth’s crust, representing the natural potential of the ground to release radon gas into the environment [2]. One of the main factors influencing the potential of radon sources is the geological nature of the bedrock [3,4,5]. Geogenic radon potential depends on the radionuclide content in the soil and its permeability, and it is not influenced by anthropogenic factors [2].
As part of the RAMARO 73/2012 project, which aimed to develop a comprehensive radon map (residential, geogenic, and radon in water) for the central, western, and northwestern regions of Romania, elevated radon activity concentrations were identified in Hunedoara County, both indoor and in soil. Notably, the Vadu Dobrii area recorded the highest soil radon concentration, reaching 169 kBq/m3. Additionally, in Rusca Montană, which is about 15 km away, the highest natural radon level in the soil of Caraș-Severin County was found to be 179.0 kBq/m3, based on a study by Burghele et al. [6]. Given these significant values, which indicate an increased risk of radon exposure for the local population, along with the area’s geological diversity, different ages, and varied topography, a detailed investigation of geogenic radon concentrations was initiated in this part of the Poiana Ruscă Mountains.
The geogenic radon potential in soil was investigated by different authors in various geological contexts, as illustrated by the examples below. In Germany, Kemski et al. [4,7] determined the geogenic radon potential using an empirical method, measuring radon concentration in the soil at a depth of 1 m with Lucas cells. The highest concentrations were measured in areas with granites. Kuske et al. [8] used the AlphaGuard device to determine radon concentration through the active method (Hessen region). In the Czech Republic, Mikšová and Barnet [9] conducted measurements within the National Radon Program, using instruments such as the Scintrex RDA 200 and Lucas cells. Neznal et al. [10] developed the Neznal method, which involves measuring radon concentrations at 15 points distributed over an area of up to 800 m2, while Barnet et al. [11,12] applied this method to geological formations of the Czech Republic. The highest radon concentrations were detected in the Permian bituminous sediments in the Rudník area, near Vrchlabí.
Planinić et al. [13] measured radon concentrations in Osijek, Croatia, using LR-115 detectors. In Poland, Chalupnik and Wysocka [14] determined the radon exhalation flux using Lucas cells. The highest radon concentrations in soil were measured in clayey soils, ranging from 15.9 to 37.1 kBq/m3. Swakoń et al. [15] used an AlphaGuard PQ2000 PRO instrument to measure soil radon concentrations in the Kraków area, especially near local tectonic fault zones. Petersell et al. [16,17] determined radon concentrations in Estonia using MARKUS-10 and gamma spectrometry. The concentrations ranged from 1 to 2112 kBq/m3, with a geometric mean of 27 kBq/m3. Gruber et al. [18] and Friedmann et al. [19] applied the Neznal method in Austria. Radon measurements were conducted in various geological formations, including migmatite, granitoid, orthogneiss, mica schist, paragneiss, carbonate rocks, and quaternary alluvial deposits. In France, Ielsch et al. [20] correlated geogenic radon potential with the uranium content in soil. Radon potential mapping in the Bourgogne region was based on various geological formations, including peraluminous granitoids, granodiorites, orthogneisses, microgranites, rhyodacites, migmatites, paragneisses, amphibolites, and sedimentary rocks such as limestones, marls, sandstones, and dolomites. In Italy, Buttafuoco et al. [21,22] measured radon concentrations using Lucas cells and RAD7; radon measurements were conducted in the northern Crati Valley (Calabria, Italy), covering Palaeozoic crystalline-metamorphic rocks such as gneiss, granites, and granodiorites, as well as Miocene and Pliocene–Holocene sedimentary deposits, while Giustini et al. [23,24] applied advanced statistical methods, such as Empirical Bayesian Kriging Regression. Radon measurements in Celleno were conducted across volcanic rocks from the Vulsini district [23], and geogenic radon potential was assessed in volcanic complexes of the Lazio region, including the Vicano (Caprarola), Vulsini (Celleno), and Alban Hills (Ciampino), where pyroclastic rocks, leucitites, phonolites, and tuffs outcrop over Miocene–Quaternary sedimentary and Mesozoic carbonate formations [24]. In the Salerno province (Campania, Italy), the geogenic radon potential has been assessed by direct measurements of radon in soil gas using alpha spectrometry (RAD7 with AMS and E-PERM probe), with concentrations up to 50,000 Bq/m3 in areas of high permeability and tectonic activity [25].
In Romania, Cosma and Baciu [26] studied radon concentration in soil in relation to the distance from the Măguri-Răcătău granite massif, using LUK3A, where the highest radon concentration in soil (122.2 kBq/m3) was determined on a crystalline bedrock at about 13 km distance from the massif. Niță et al. [27] conducted measurements at 36 locations along the Someș River using the LUK3C device, obtaining an average of 55.8 kBq/m3 in Quaternary alluvial deposits.
Papp et al. [28] investigated radon and thoron concentrations near the mofettes of Harghita Băi, which is part of the Neogene volcanic range in the Eastern Carpathians, where hydrothermally altered pyroxene-andesites with amphibole dominate the local geology. Cosma et al. [29] assessed the radon potential in the Băița-Ștei area of the Bihor Mountains (Romania), known for its uranium-rich geological formations and history of uranium mining activities.
Moldovan et al. [30] measured soil radon concentrations at 128 locations in the Buzău region, employing both the LUK3C and Radon-Jok devices. The study area includes Cretaceous and Paleogene flysch formations composed of sandstones, marls, clays, and conglomerates, folded and faulted within the Subcarpathian Nappe, as well as Badenian tuffs, molasse sediments, and evaporitic horizons containing salt and gypsum. Lupulescu et al. [31] analyzed seasonal variations in radon concentrations, identifying an inverse correlation with atmospheric pressure and soil permeability. Finally, Burghele et al. [6] compiled data collected between 2012 and 2018. The investigated area includes a wide range of geological formations such as metamorphic and magmatic rocks from the Apuseni, Eastern, and Southern Carpathians, as well as Tertiary sedimentary deposits in the Transylvanian and Pannonian basins, and Quaternary alluvial deposits along the main rivers.
These studies highlight the diversity of methods used for radon determination, including active and passive techniques, statistical modeling, and advanced geological correlations. Their findings contribute significantly to the assessment of risks associated with radon exposure, facilitating the development of effective strategies to reduce its impact on public health.
The present study aims to determine the geogenic radon potential based on the geological characteristics of the study area. To achieve this goal, the following objectives have been established: measuring the radon concentration correlated to soil permeability, calculating the geogenic radon potential, and creating predictive maps of geogenic radon potential in correlation with local geology.

2. Materials and Methods
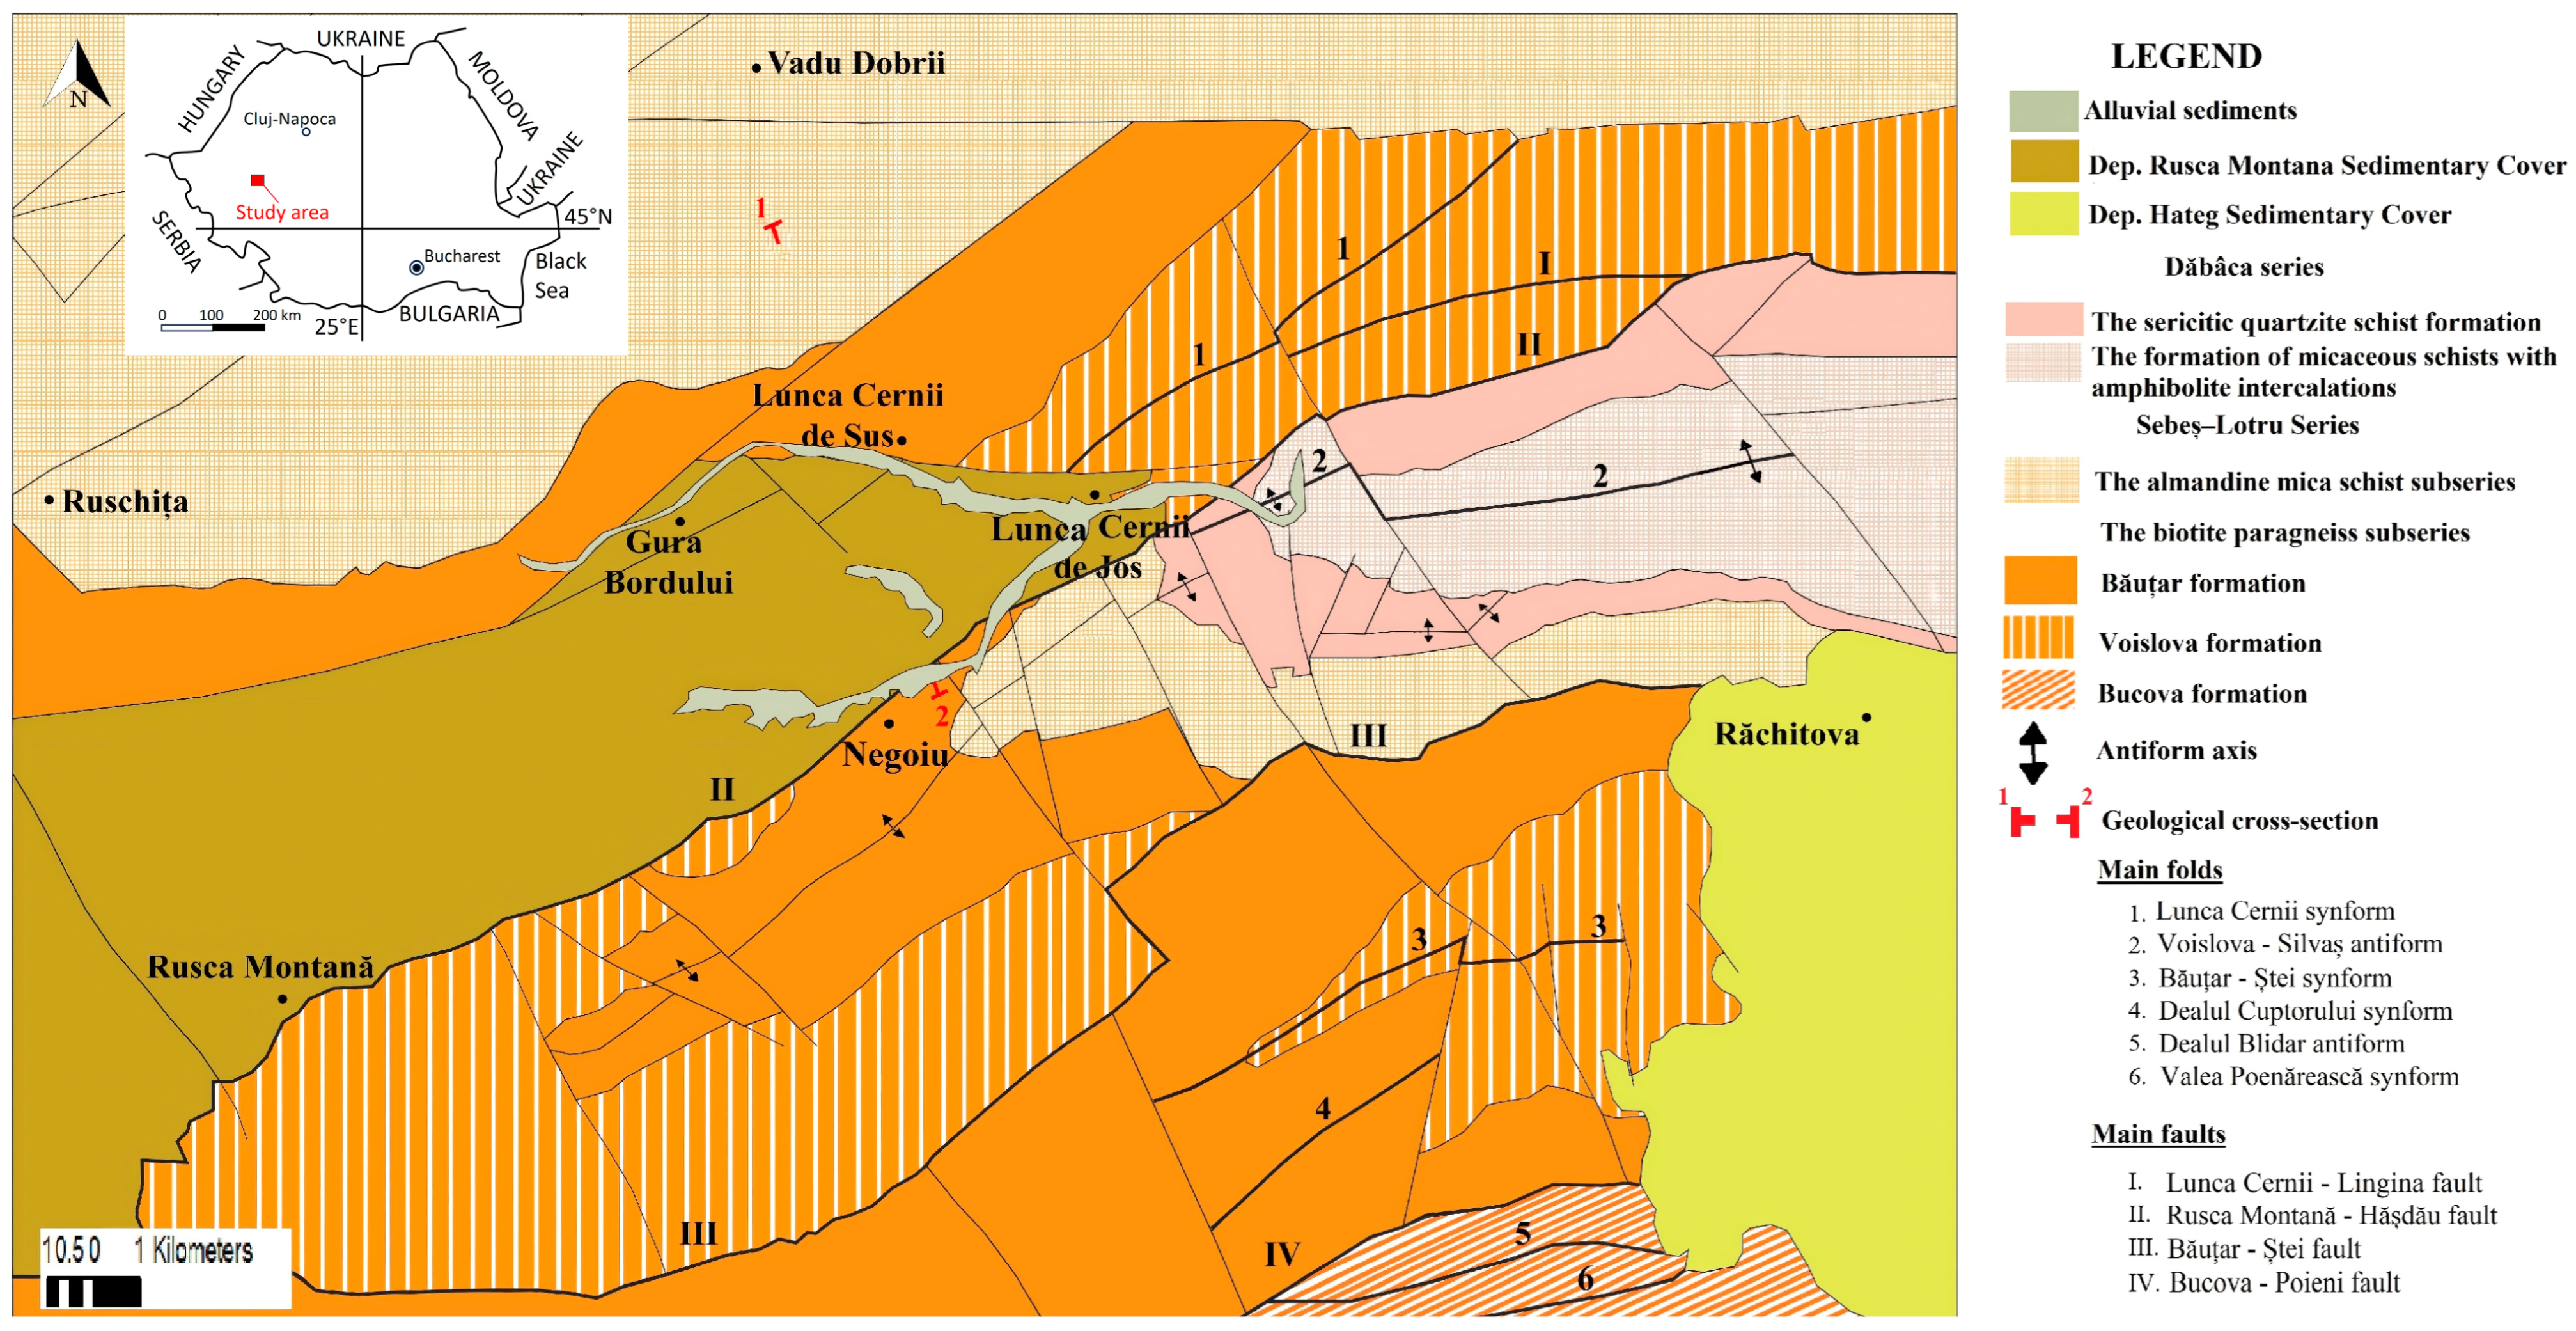
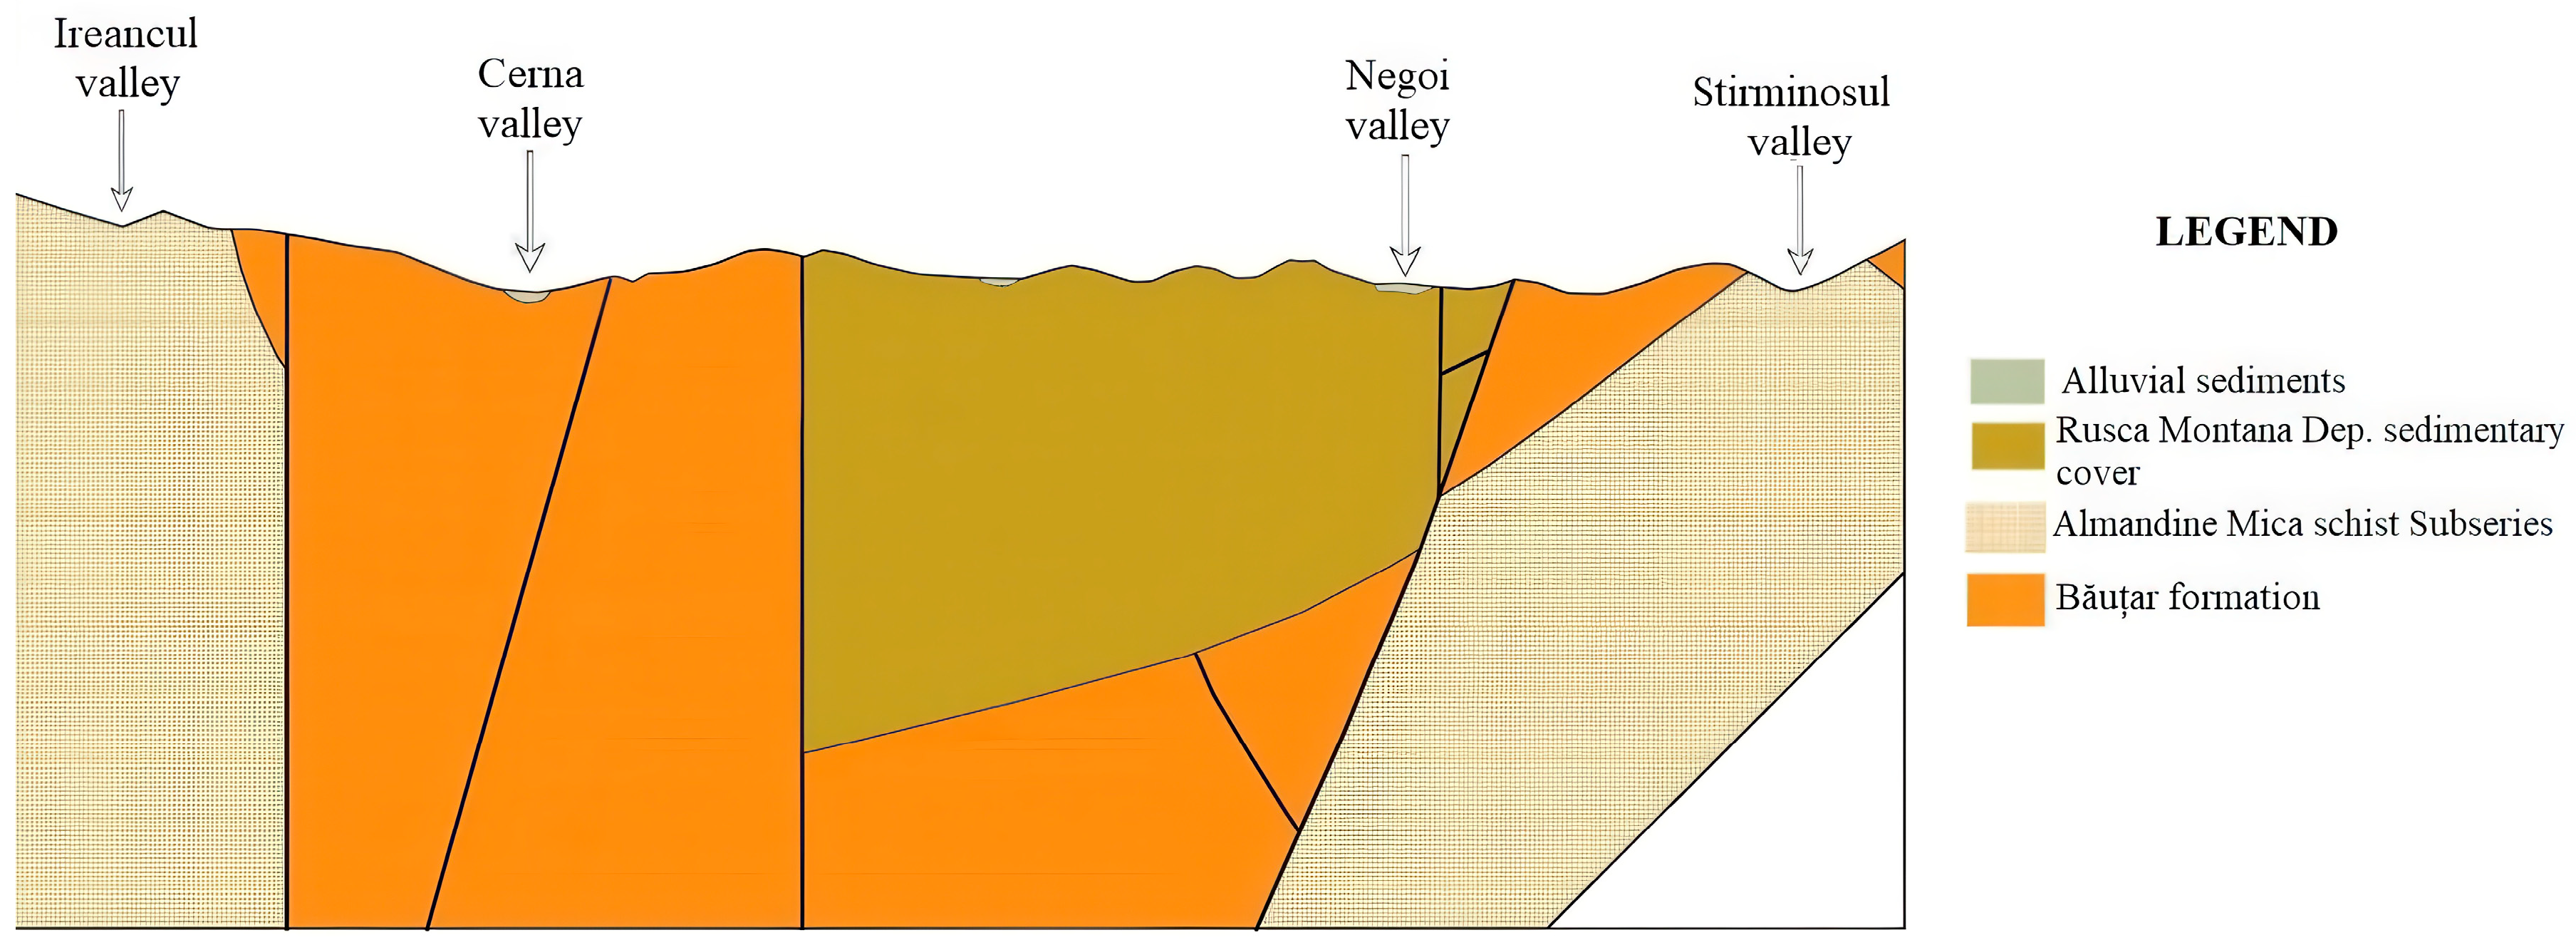
2.1. Study Area

The study area is located in the Poiana Ruscă Mountains, representing the north-western extremity of the Southern Carpathians. The investigated area covers 480 km2 and is positioned at the border between Hunedoara, Caraș-Severin, and Timiș counties. Geomorphologically, it represents an intramontane depression, with elevations ranging between 304 m and 1355 m.
The eastern part of the Rusca Montană sedimentary basin is a SW–NE-orientated syncline filled with Cretaceous deposits overlying a crystalline basement of Upper Proterozoic–Lower Paleozoic age [32]. To the north and south, the Sebeș–Lotru metamorphic series outcrops, consisting of biotite paragneiss and mica schist with almandine [33,34]. Minor magnetite lenses were historically mined for iron. The Dăbâca Series is composed mainly of muscovite/sericite schists, amphibolites, and crystalline limestones, also dated to the Upper Proterozoic–Lower Paleozoic. These metamorphic rocks are highly folded and fractured. Structurally, the Lunca Cernii synform and the Voislova–Silvaș antiform are parallel, as are the major faults: Lunca Cernii–Lingina and Rusca Montană–Hașdău [32]. Cretaceous sediments (Barremian–Maastrichtian), predominantly detrital with some carbonates, overlie the basement. Maastrichtian layers include volcano-sedimentary sequences with andesite and breccia. Above these lie Paleogene or Lower Miocene deposits [34,35]. Quaternary coarse sediments occur along major rivers, and a longitudinal fault cuts through the syncline [32] (Figure 1). All geological formations, where measurements were made, have been coded to simplify the statistical process, as shown in Table 1. Figure 2 represents a geological cross-section in the study area, marked on the map with points 1–2 in red color.

2.2. Determination of Geogenic Radon Potential
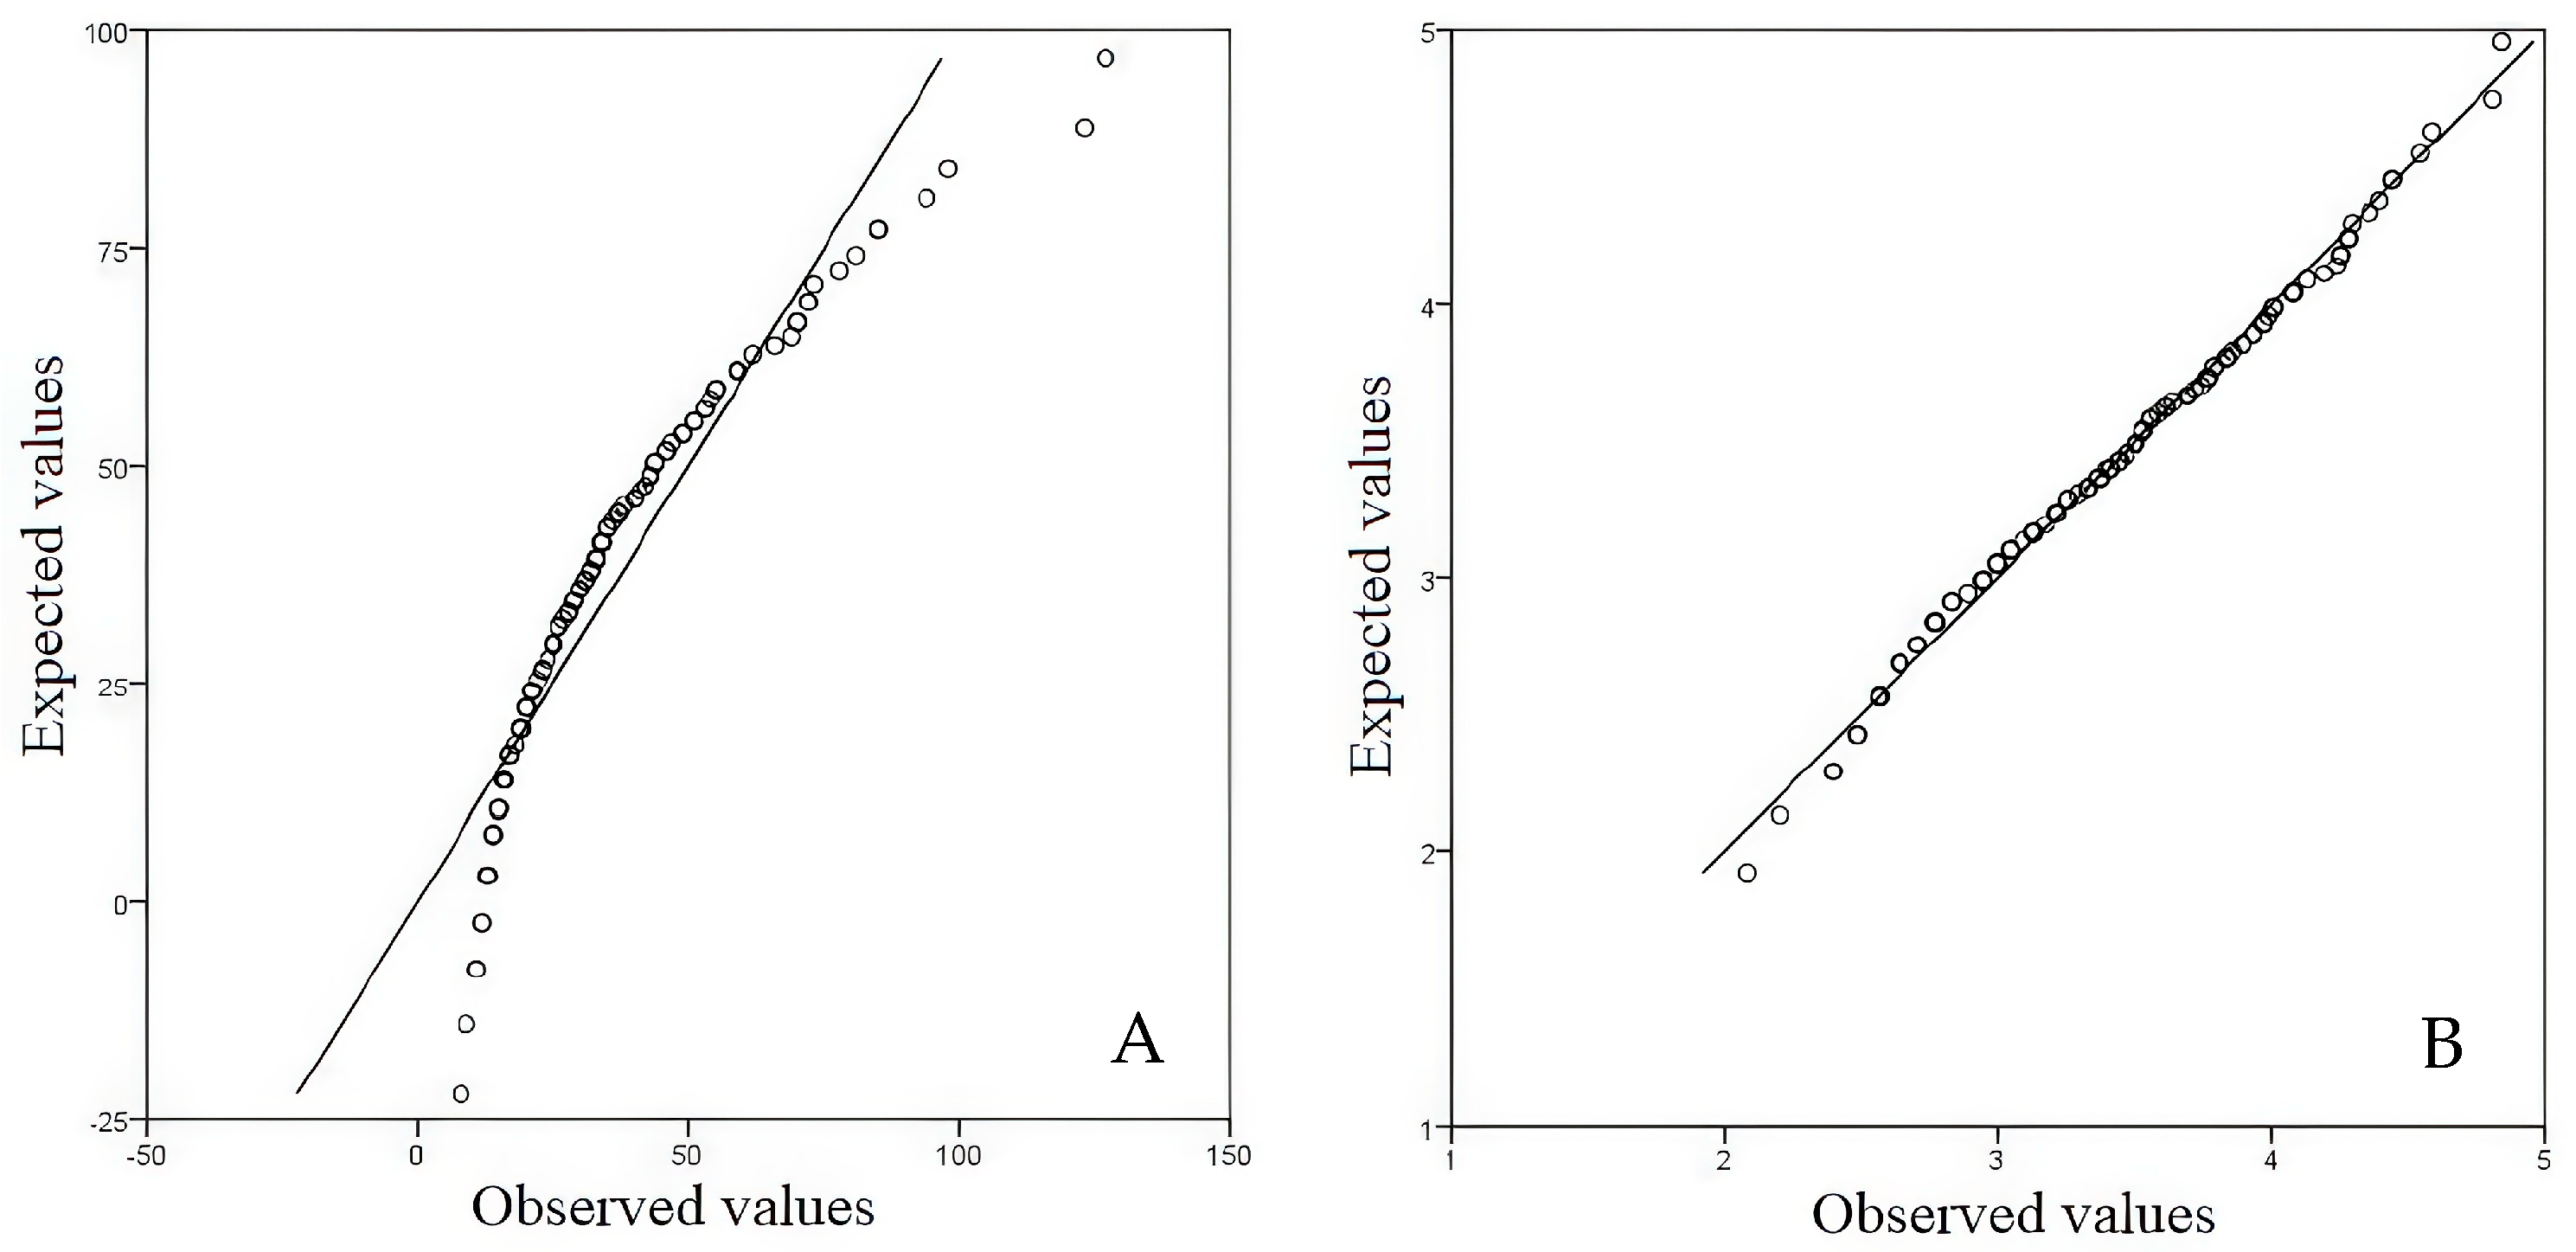
The measurements were conducted using a Radon Monitor-2 (RM-2) detector (Dr. Fronka Nuclear Technology, distributed by Radon v.o.s., Libeň, Czech Republic) for determining radon activity concentration in soil and a Radon-Jok device (Radon v.o.s., Czech Republic) for measuring soil permeability. The period during which the measurements were carried out was between 2020 and 2021. The geogenic radon potential was determined by conducting measurements at three points arranged in an isosceles triangle, having the base and height of 5 m. Samples were collected at a depth of 80 cm, and soil permeability was measured at the same depth. A total of 110 measurement locations (330 points of measurement—see Supplementary Material) were assessed in an area covering 480 km2. The distribution of measuring points depended on accessibility, the intention to sample all the representative geological units, and the thickness and structure of soil, influencing the possibility of taking correct measurements.
To ensure the quality and reliability of soil radon measurements, in September 2021, the used instruments were tested, measuring both radon concentration and soil permeability, during the International Comparison Measurement of Radon in Soil Gas at the reference sites Cetyne and Buk in the Czech Republic. The results obtained were compared across 23 laboratories from 11 countries. The resulting data fulfilled the established testing criteria, and the performance of the instruments used for measuring radon in soil was considered suitable for applications in radon risk mapping.
The geogenic radon potential was calculated using the “Neznal method”. The applied formula includes a correction for soil heterogeneity with a 3rd quartile for radon activity concentration and soil permeability. Based on the obtained values, the geogenic radon potential (GRP) was classified into three categories: low (GRP < 10), medium (10 ≤ GRP < 35), and high (GRP ≥ 35).

2.3. Data Analysis

The data were processed using Microsoft Excel and statistically analyzed with SPSS 20 (SPSS Inc., Chicago, IL, USA). Anderson–Darling and Kolmogorov–Smirnov tests were applied to verify the normality of the data distribution. Non-parametric tests were employed when the assumption of normality was not met, with a Kruskal–Wallis test used for comparisons involving more than two groups. A Chi-square test was applied to evaluate whether there was a statistically significant association between two categorical variables by comparing the observed distribution with the expected one under the assumption that the variables are independent. The significance level was chosen at α = 0.05. ArcMap 10.6.1 (ESRI, Inc., Redlands, CA, USA) was used to spatially represent soil radon activity concentration, soil permeability, and GRP, applying the natural neighbor interpolation method. The natural neighbor method estimates unknown values at a point based on a weighted average of neighboring point values, determined by the intersection of Voronoi cells, ensuring a smooth and locally influenced interpolation. Although the natural neighbor interpolation method provides high local accuracy, it is constrained by its inability to perform extrapolation beyond the data coverage area, its sensitivity to the spatial distribution of input points, the absence of global trend modeling, and the lack of a direct uncertainty estimation.

3. Results and Discussion

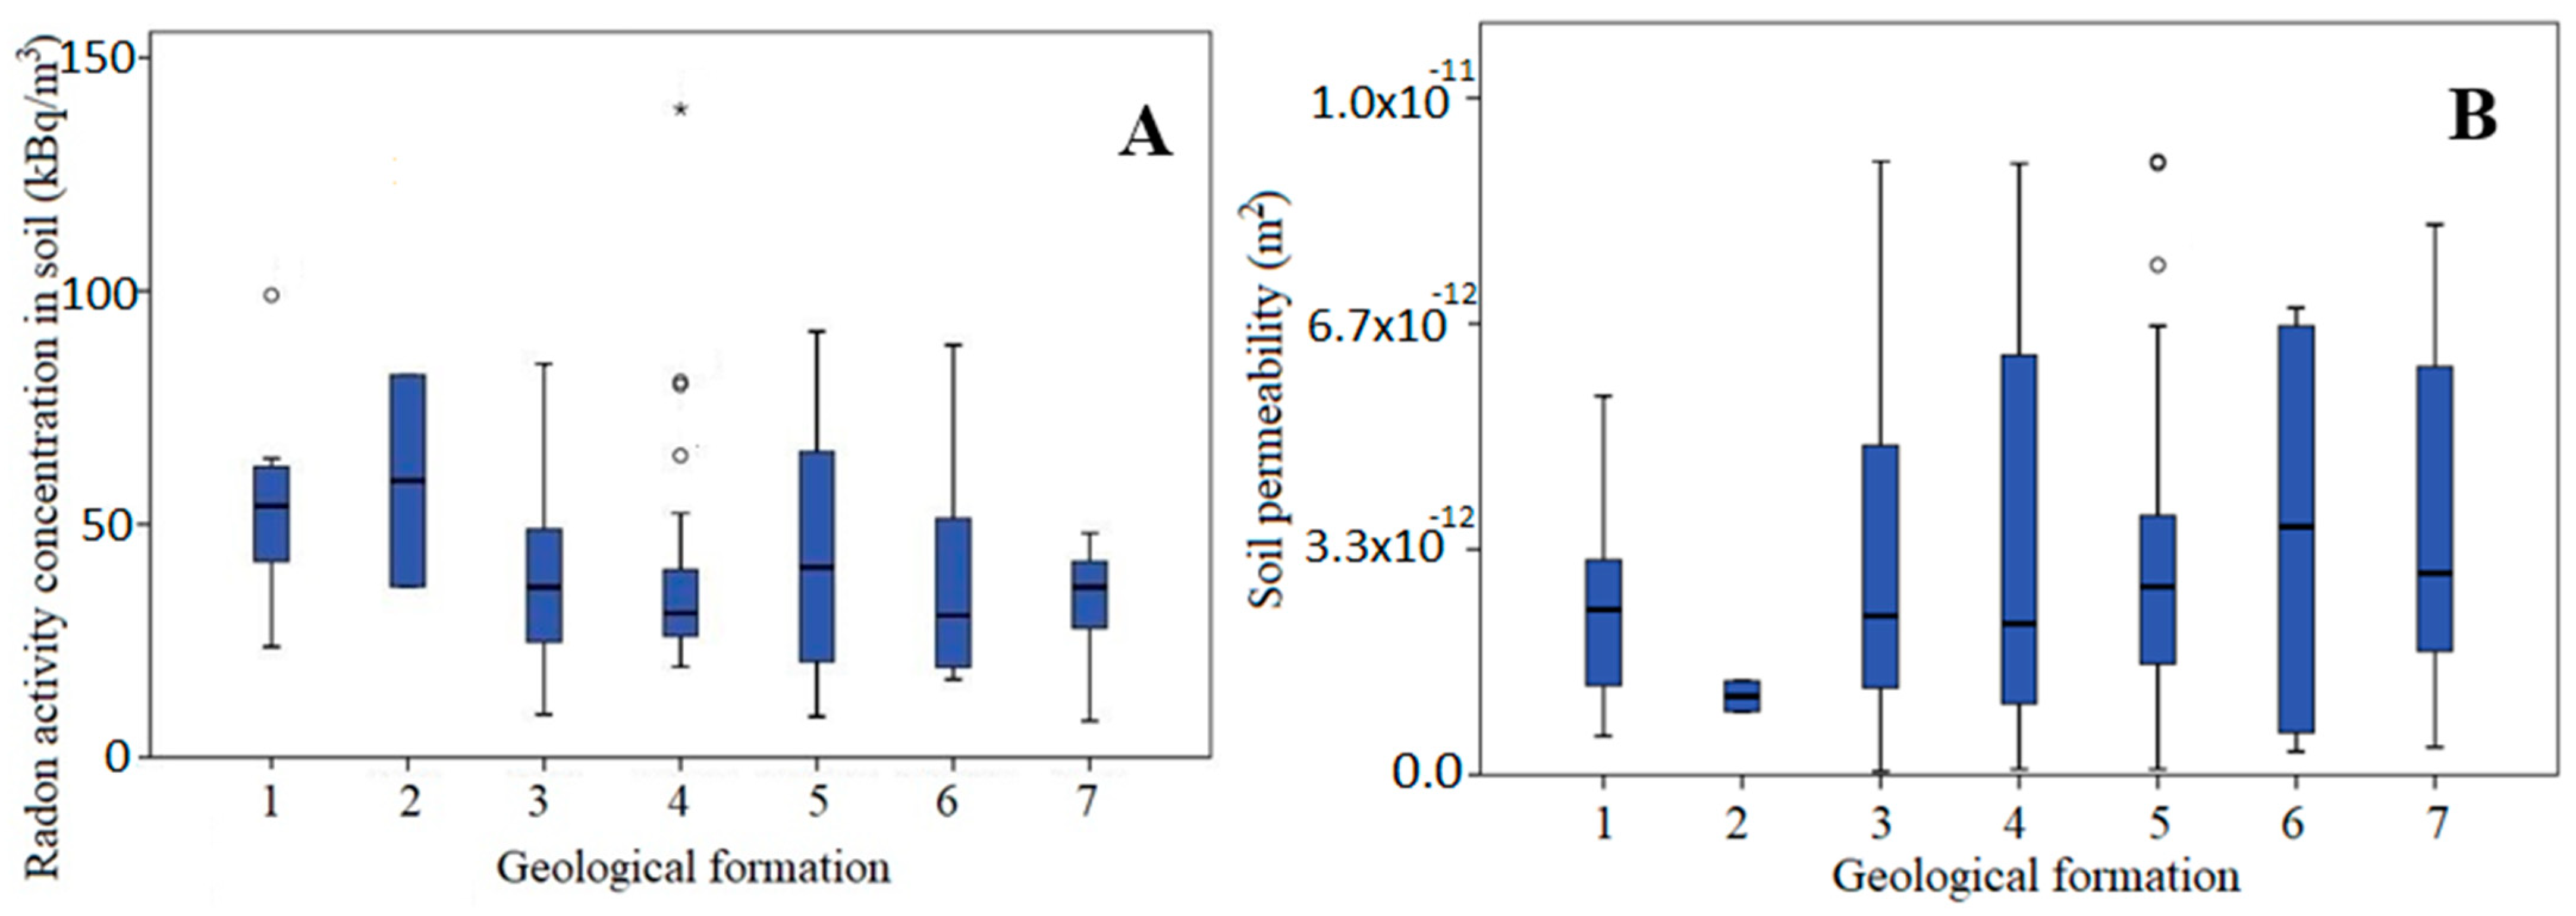
3.1. Radon Activity Concentration in Soil and Soil Permeability

The arithmetic mean of radon activity concentration in soil was 37.5 kBq/m3, with a standard deviation of 22.1 kBq/m3. The geometric mean was 31.6 kBq/m3, with a minimum of 5.1 kBq/m3 and a maximum of 163 kBq/m3.
Soil permeability ranged from 6.9 × 10⁻¹⁴ to 2.7 × 10⁻¹¹ m2, with an arithmetic mean of 8.1 × 10⁻¹² m2 and a standard deviation of 8.2 × 10⁻¹² m2.
Based on the Anderson–Darling and Kolmogorov–Smirnov tests, the log-transformed data showed a normal distribution for both soil radon concentration and permeability.
From the perspective of the median of radon concentrations in soil (Figure 3), the Mica Schist Formation with amphibolite intercalations (Code 2) exhibits the highest median value, at 59.3 kBq/m3. This is followed by the Sericitic Quartzite Schist Formation from the same Dăbâca Series (Code 1), with a median of 53.9 kBq/m3. A median of 40.8 kBq/m3 was calculated for the Băuțar Formation (Code 5), and a median of 36.5 kBq/m3 was determined for the Almandine Mica Schist Subseries (Code 3) and Alluvial sediments (Code 7). The lowest soil radon concentrations were recorded in the sedimentary cover of the Rusca Montană Basin (Code 4), with a median value of 30.9 kBq/m3, and in the Voislova Formation (Code 6), with a median of 30.4 kBq/m3. When analyzing the median of soil permeability for each geological formation, the Voislova Formation exhibits the highest soil permeability, with a median value of 1.1 × 10⁻¹¹ m2. It is followed by the soils on Alluvial sediments with a value of 8.9 × 10⁻¹² m2, the Băuțar Formation with a value of 8.3 × 10⁻¹², and the Sericitic Quartzite Schist Formation with an average of 7.3 × 10⁻¹² m2. Lower permeability values were recorded in the Almandine Mica Schist Subseries (7.0 × 10⁻¹² m2), the Rusca Montană Basin sedimentary cover (6.7 × 10⁻¹² m2), and the Mica Schist Formation with amphibolite intercalations, which has a soil permeability value of 3.5 × 10⁻¹² m2.
The Kruskal–Wallis test revealed no statistically significant differences in the median soil radon concentrations (p = 0.50) or soil permeability values (p = 0.87) across the different geological units.
Figure 4 shows the natural neighbor interpolation of soil radon activity concentration in relation to the geological map. Higher soil radon concentrations are predicted in the northeastern areas of Lunca Cernii de Sus and Lunca Cernii de Jos, as well as between the localities of Negoiu and Rusca Montană, continuing with two locations along the northwest axis toward Vârful Rusca, where elevated concentrations are also identified. Additionally, to the east of Negoiu, there is another area showing high predicted soil radon concentrations.
Figure 5 shows that soil permeability is higher in the western, northeastern, and southeastern areas of the study region, as well as in the northwestern part of the locality of Negoiu.
The average radon concentration in this study falls within the range of concentrations reported by other authors. Lower radon concentrations than those found in this study have been observed by Alonso et al. [36], which ranged from 0.1 to 150 kBq/m3 across the Eastern Canary Islands, with the highest values observed in Gran Canaria (mean 16.9 kBq/m3), moderate values in Fuerteventura (median 6.3 kBq/m3), and the lowest levels in Lanzarote (median 2.9 kBq/m3), reflecting the geological differences among the islands. Other studies with lower averages include Planinić et al. [13], with an arithmetic mean of 26.3 kBq/m3 in the central part of Osijek city; Petersell et al. [16], with a geometric mean of 27 kBq/m3 and a range between 1 and 2112 kBq/m3 in northern areas, where uranium-rich graptolite argillite and phosphorite deposits are present; and Kunovska et al. [37], whose radon activity concentrations ranged from 3 to 97.3 kBq/m3, with an overall arithmetic mean of 26 kBq/m3; the highest values were found in areas with granite and gneiss, as well as in sandy and humus-rich soils due to higher radium content and soil permeability. Swakoń et al. [15] reported a comparable average of 39 kBq/m3 in local disjunctive tectonic zones. Similar concentration ranges were observed in the studies by Buttafuoco et al. [22], where radon concentrations in soil gas ranged from 1.08 to 68.19 kBq/m3, with higher values generally associated with granitic and metamorphic formations, and Kikaj et al. [38], who reported radon activity in soil ranging from 0.30 to 32 kBq/m3, with average values of 7 kBq/m3 in metamorphic rocks, 8 kBq/m3 in limestone, and 8 kBq/m3 in lake and river sediments. In the study of Dogjani et al. [39], the radon activity in soil ranged from 0.9 to 130.0 kBq/m3, with the highest values (up to 130.0 kBq/m3) recorded in inorganic clays and silt color from the second terrace of the Tirana River, while Elío et al. [40] reported radon concentrations ranging from 3.5 to 112 kBq/m3, with the highest values recorded over Tertiary granite, Carboniferous limestone, and minor volcanic rocks, and the lowest over Silurian metasediments.
Higher concentrations were reported by Giustini et al. [24] in Caprarola (157.9 kBq/m3), followed by Celleno (60.0 kBq/m3) and Ciampino (56.2 kBq/m3), reflecting the differences in lithology and radionuclide content of the volcanic rocks; Cinelli et al. [41] reported 7 to 176 kBq/m3, with an arithmetic mean of 56.2 kBq/m3, and higher values were consistently associated with volcanic formations (67 kBq/m3) compared to the lower values found in alluvial soils (42 kBq/m3). Ciotoli et al. [3] report radon activity in soil ranging from 0.37 to 828 kBq/m3, with the highest arithmetic means observed in the Vico Volcanics (84.8 kBq/m3), Volsini Volcanics (54.9 kBq/m3), and Alban Hills Volcanics (43.0 kBq/m3), reflecting the elevated uranium and radium content of these volcanic rocks.
At the national level, comparable values were found by Niță et al. [27]—2.1–55.84 kBq/m3 in Quaternary alluvial deposits; Papp et al. [28]—1.2–30.6 kBq/m3 in Harghita Băi, with the highest values recorded near the mofettes and interpreted as being associated with fault zones acting as pathways for ascending gases; and Lupulescu et al. [31]—with a minimum value of 10 kBq/m3 and a maximum value of 52.2 kBq/m3.
Concentrations similar to the average found in this study were also reported by Cosma et al. [42]—average value of 37.3 kBq/m3 in Quaternary alluvial deposits, Cluj-Napoca; Moldovan et al. [30] in the Buzău region, with a minimum value of 12.4 kBq/m3 and a maximum of 101.6 kBq/m3, with an average value of 34.9 kBq/m3 while the overall radon potential indicated predominantly low risk levels, except for localized hotspots such as Aluniș and Lopătari, where medium risk values were observed; and Burghele et al. [6]—arithmetic mean of 29.3 kBq/m3, ranging from 0.2 to 179 kBq/m3, and higher values were generally associated with crystalline and granitic regions of the Carpathians.

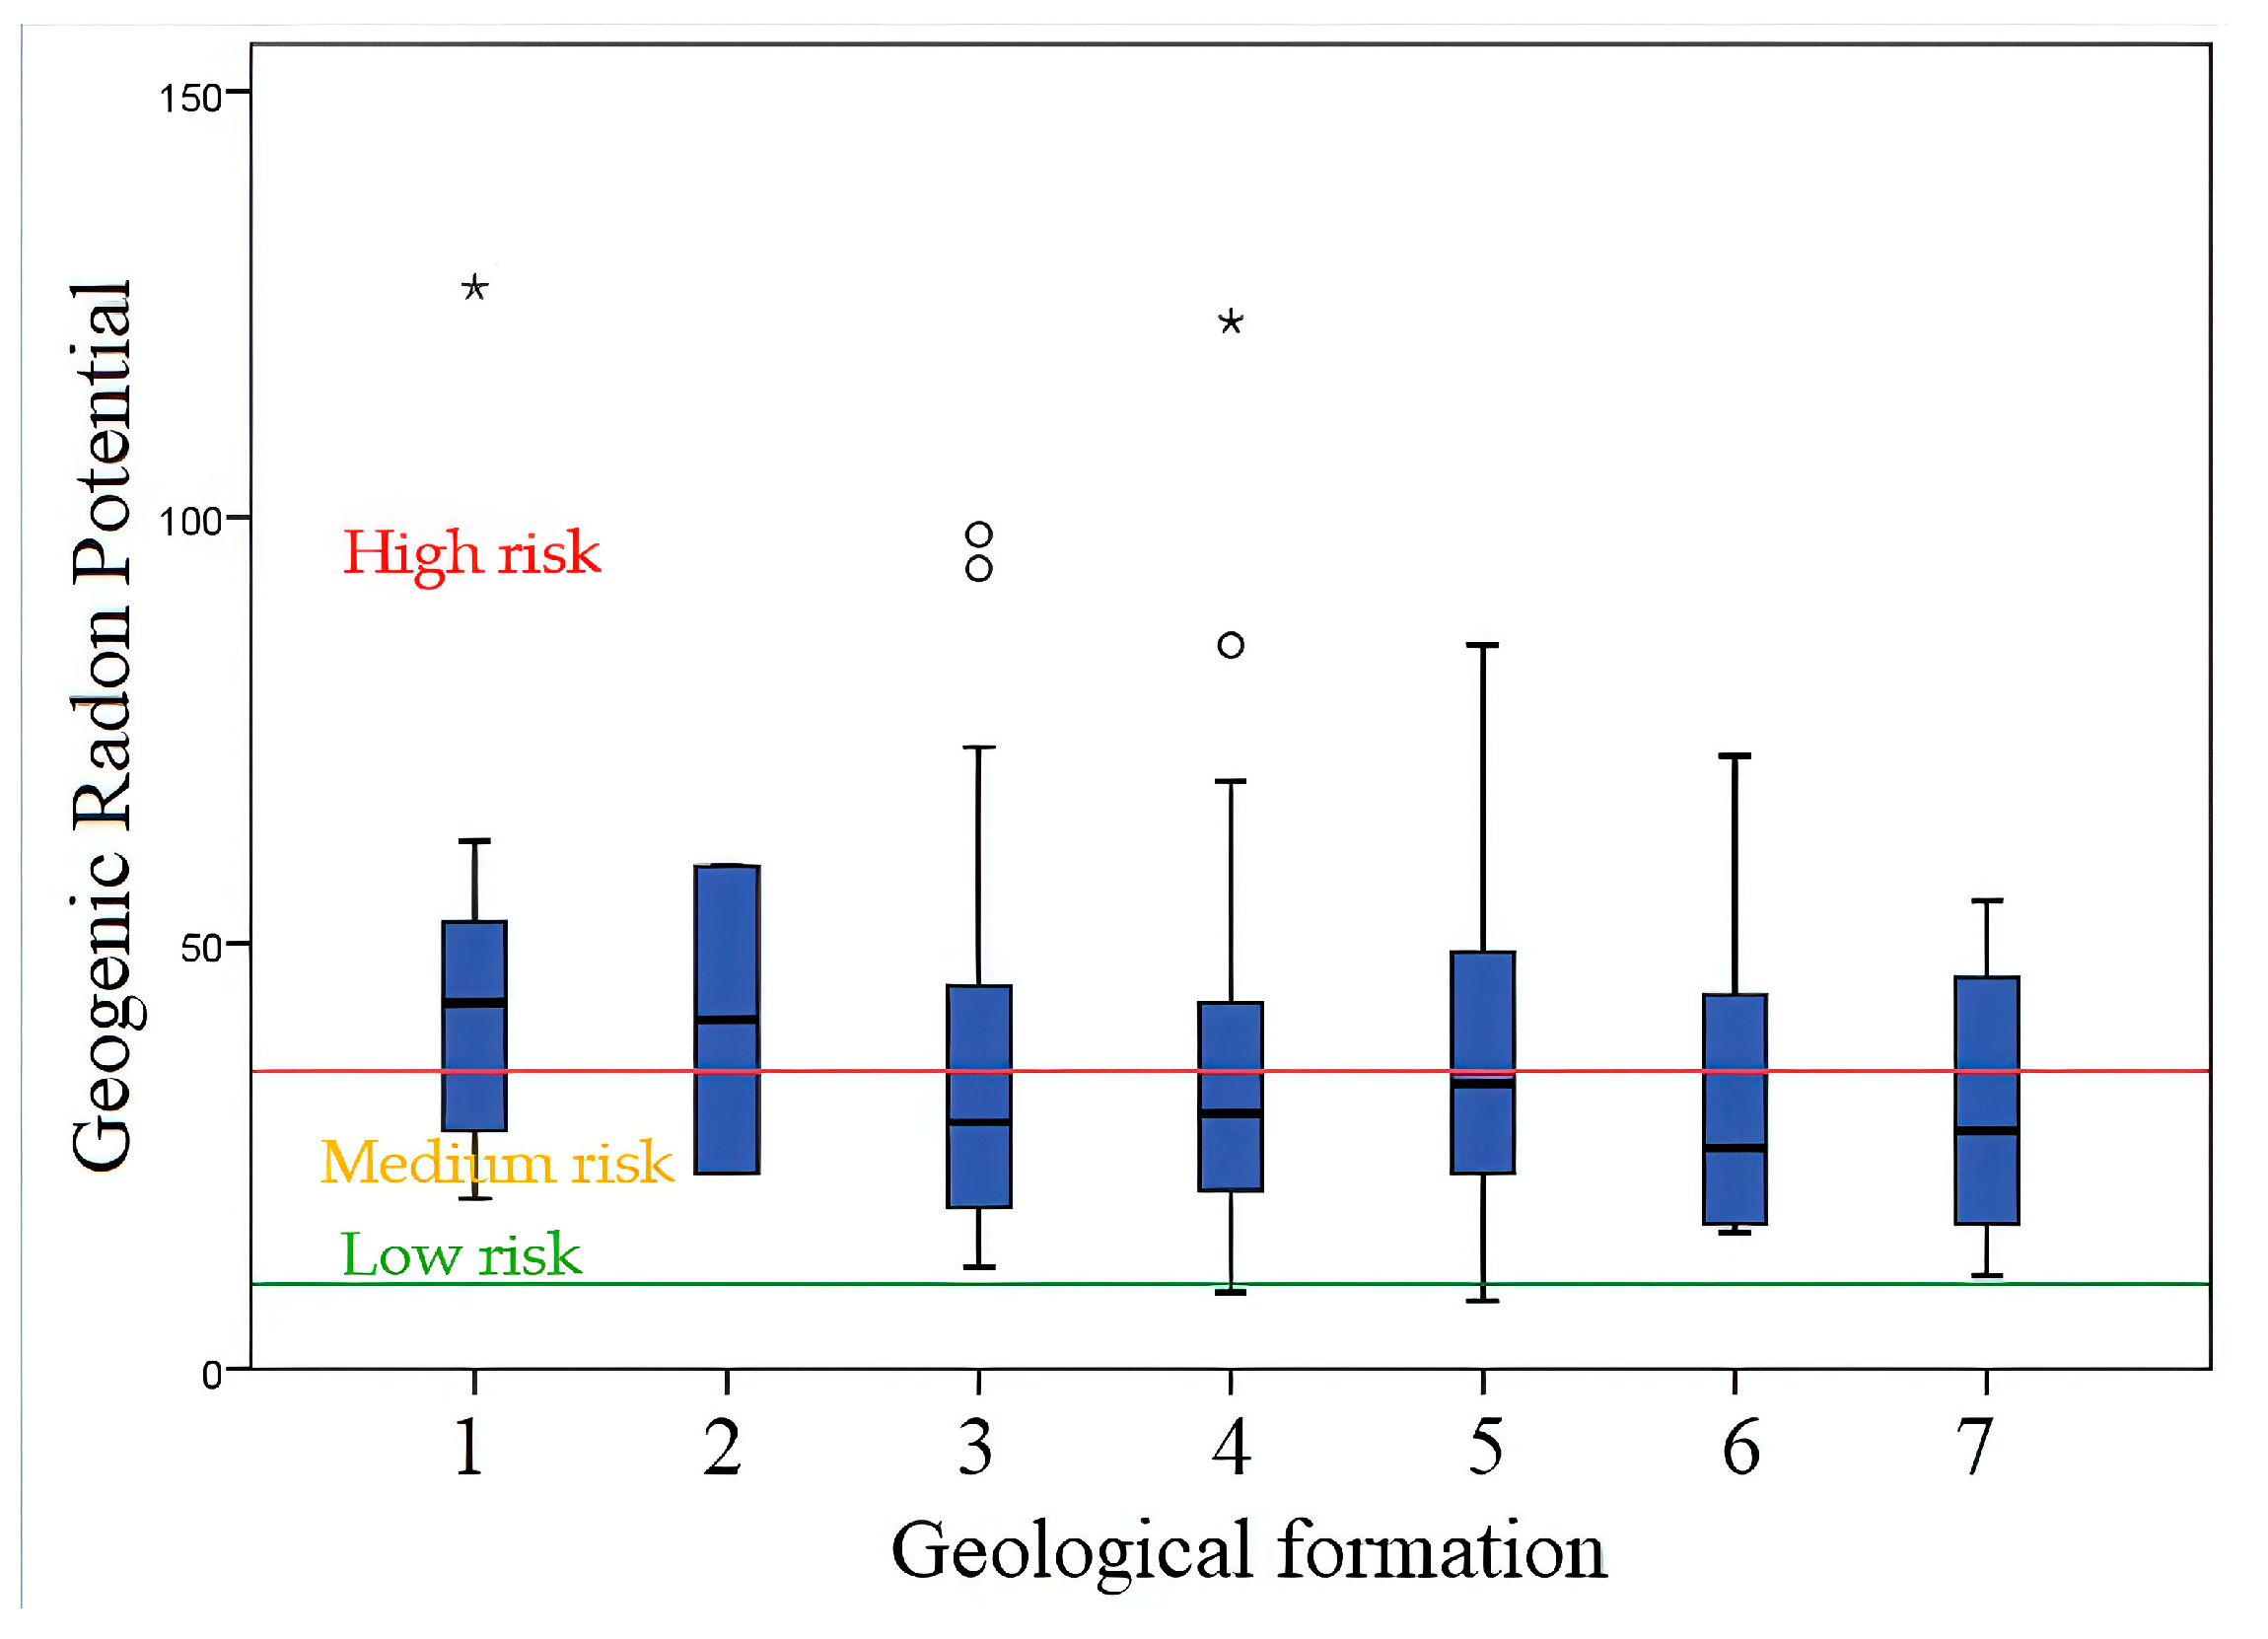
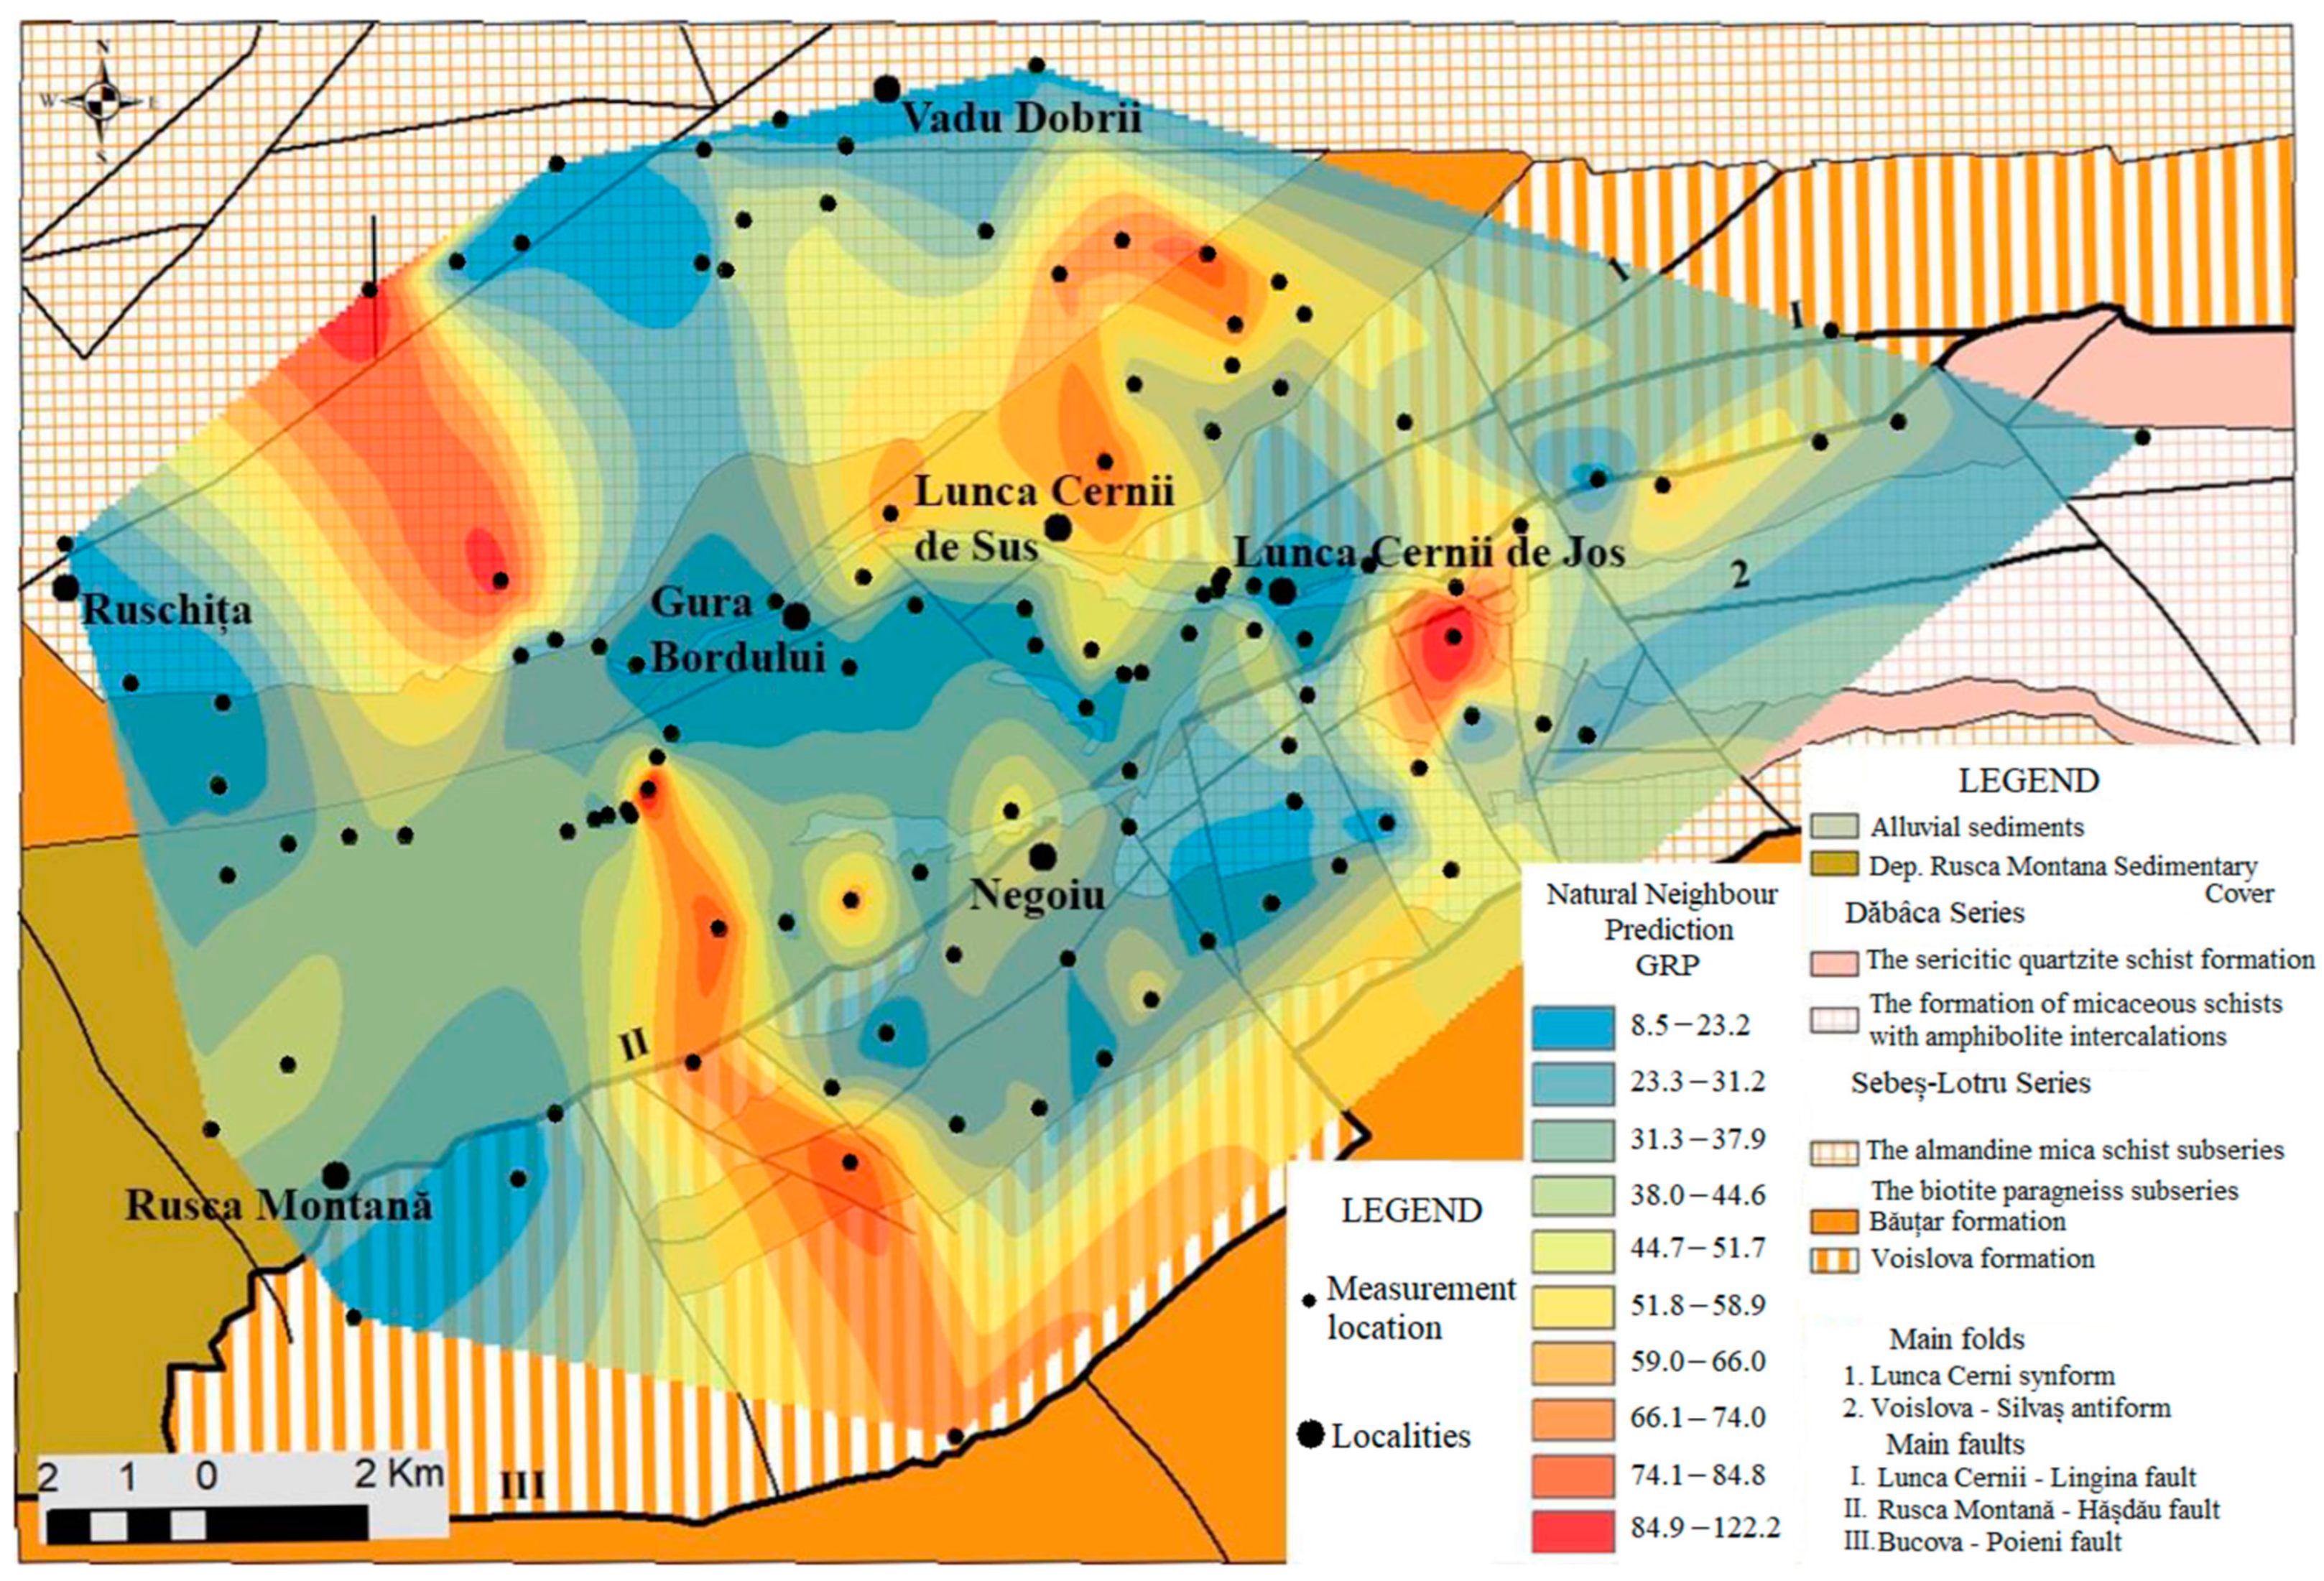
3.2. Geogenic Radon Potential

The average geogenic radon potential (GRP) was 37, with values ranging from 8 to 127, with a standard deviation of 24 and a coefficient of variation of 64%. The geometric mean was 31. The skewness value of 1.441 ± 0.230 and the kurtosis value of 2.362 ± 0.457 indicate that the distribution deviates from normality; however, the log-transformed geogenic radon potential values follow a normal distribution (Figure 6).
As illustrated in Figure 7, the highest median values of geogenic radon potential are found in the Sericitic Quartzite Schist Formation (Code 1), with a value of 43, and in the Mica Schist Formation with amphibolite intercalations (Code 2), with a value of 41. These are followed by the Băuțar Formation (Code 5), with a median of radon potential of 33, and the Rusca Montană Basin sedimentary cover (Code 4), with a value of 30. In the Almandine Mica Schist Subseries (Code 3) from the Sebeș–Lotru Series, the median of GRP was 29, and in the Alluvial sediments (Code 7), the median of the GRP value was 28. The median of GRP in the Voislova Formation (Code 6) was 26. Only the medians of two geological formations (Sericitic Quartzite Schist Formation and Mica Schist Formation with amphibolite intercalations) exceed the threshold of 35 (High risk). The other five are in the medium-risk zone regarding the radon index, according to Neznal et al. [10]. The Kruskal–Wallis test revealed no statistically significant differences in the median geogenic radon potential (GRP) across the investigated geological formations (p = 0.90). Similarly, the Chi-square test indicated no significant association between the radon index and the geological units included in the study (p = 0.95).
Figure 8 presents the prediction of geogenic radon potential obtained through the natural neighbor interpolation. The points used for determining the geogenic radon potential are shown, classified into six categories: very Low (radon potential [R.P.] < 10), low (10 ≤ R.P. < 30), moderate (30 ≤ R.P. < 50), high (50 ≤ R.P. < 70), very high (70 ≤ R.P. < 100), and extremely high (R.P. ≥ 100). Higher predicted concentrations are associated with the Băuțar Formation, particularly the biotite paragneiss subseries in the northeastern part of the study area, as well as the eastern part, near Lunca Cernii de Jos, within the Sericitic Quartzite Schist Formation of the Dăbâca Series. Elevated radon potential predictions were also made in the western area of the almandine mica-schist subseries of the Sebeș–Lotru Series, a mountainous region with altitudes reaching up to 1355 m at Vârful Rusca. In the eastern area of Vârful Rusca, in the valley linking the localities of Gura Bordului and Vadu Dobrii, low geogenic radon potential values were determined, leading to predictions of low radon potential. Alluvial and sedimentary areas, such as those around the localities of Gura Bordului, Negoiu, and the southern part of Lunca Cernii de Sus, are also identified as areas with low geogenic radon potential.
Friedmann et al. [19] reported higher geogenic radon potentials: 209 for granitoids and 177 for migmatites, compared to the average value of 37 found in this study. In the study conducted by Cosma et al. [29], the geogenic radon potential ranged from 11 in Lunca-Ștei to 1607 in Băița-Plai, near a former uranium mine. Florică et al. [43] reported a variation in geogenic radon potential between 5 and 133, with a mean value of 33 and a median of 29; these values are close to those found in the present study (median of 32). Pásztor et al. [44] observed GRP values ranging from 1.0 to 44, with a mean of 10.8, while estimated values across the study area varied from 0.2 to 75, highlighting high GRP zones particularly in hilly regions underlain by acid igneous and pyroclastic rocks. In the study by Szabó et al. [45], GRP values ranged from 0.9 to 74.2, with an average of 12.0, and the highest values were found in hilly areas composed of fluvial sediments, proluvial–deluvial deposits, and eroded volcanic or carbonate rocks.

4. Conclusions

A total of 110 locations have been investigated across the study area, with three measuring points each. In 44 locations (40%), a high geogenic radon potential was identified; 64 locations (58.2%) indicated a medium potential, and only two locations (1.8%) showed a low potential.
The highest radon concentrations were found in the Mica Schist Formation with amphibolite intercalations and in the Sericitic Quartzite Schist Formation (Dăbâca Series). The lowest soil radon concentrations were measured in the Voislova Formation, as well as in the Rusca Montană Basin sedimentary cover.
The Dăbâca Series, with the Sericitic Quartzite Schist Formation and the Mica Schist Formation with amphibolite intercalations, indicates the highest potential within the study area. The lowest values of geogenic radon potential were determined in the Alluvial sediments and Voislova Formation.
The results obtained in this study are comparable to those reported in the aforementioned studies, in terms of radon activity concentration in soil and geogenic radon potential.
The eastern part of the Poiana Ruscă Mountains has a medium to high geogenic radon potential, which exposes the inhabitants of Lunca Cernii de Sus and, to some extent, those of Lunca Cernii de Jos to an increased risk of radon exposure. For this reason, additional ground measurements are necessary for newly built houses, while for existing ones, measurements of indoor radon concentration are required.

Supplementary Materials

The following supporting information can be downloaded at: https://www.mdpi.com/article/10.3390/atmos16050596/s1.

Author Contributions

A.L.—conceptualization, methodology, investigation; C.B.—geology, conceptualization, review and editing; T.D.—software, conceptualization, statistics, review and editing; Ș.F.—review and editing; A.C.—review and editing. All authors have read and agreed to the published version of the manuscript.

Funding

The present work has received financial support through the project Entrepreneurship for innovation through doctoral and postdoctoral research, POCU/380/6/13/123886, co-financed by the European Social Fund, through the Operational Program for Human Capital 2014–2020, by a grant of the Ministry of Research, Innovation, and Digitization, CNCS—UEFISCDI, project number PNIII-P1-1.1-TE-2021-0249, within PNCDI III.

Institutional Review Board Statement

Not applicable.

Informed Consent Statement

Not applicable.

Data Availability Statement

The original contributions presented in this study are included in the article/Supplementary Material. Further inquiries can be directed to the corresponding author(s).

Conflicts of Interest

The authors declare no conflicts of interest.

References

  1. World Health Organization (WHO). Handbook on Indoor Radon: A Public Health Perspective; World Health Organization: Geneva, Switzerland, 2009; ISBN 9789241547673. [Google Scholar]
  2. Gruber, V.; Bossew, P.; De Cort, M.; Tollefsen, T. The European map of the geogen radon potential. J. Radiol. Prot. 2013, 33, 51–60. [Google Scholar] [CrossRef] [PubMed]
  3. Ciotoli, G.; Voltaggio, M.; Tuccimei, P.; Soligo, M.; Pasculli, A.; Beaubien, S.E.; Bigi, S. Geographically Weighted 298 Regression and Geostatistical Techniques to Construct the Geogenic Radon Potential Map of the Lazio Region: 299 A Methodological Proposal for the European Atlas of Natural Radiation. J. Environ. Radioact. 2017, 166, 355–375. [Google Scholar] [CrossRef]
  4. Kemski, J.; Siehl, A.; Stegemann, R.; Valdivia-Manchego, B.A.; Kemski, M.; Veerhoff, K. Mapping the Geogenic 293 Radon Potential in Germany. Sci. Total Environ. 2001, 272, 217–230. [Google Scholar] [CrossRef] [PubMed]
  5. Kemski, J.; Klingel, R.; Siehl, A.; Stegemann, R. Radon Transfer from Ground to Houses and Prediction of Indoor 295 Radon in Germany Based on Geological Information. Radioact. Environ. 2005, 7, 820–832. [Google Scholar] [CrossRef]
  6. Burghele, B.; Ţenter, A.; Cucoş, A.; Dicu, T.; Moldovan, M.; Papp, B.; Szacsvai, K.; Neda, T.; Suciu, L.; Lupulescu, A.; et al. The FIRST large-scale mapping of radon concentration in soil gas and water in Romania. Sci. Total Environ. 2019, 669, 887–892. [Google Scholar] [CrossRef]
  7. Kemski, J.; Klingel, R.; Siehl, A. Classification and mapping of radon-affected areas in Germany. Environ. Int. 1996, 22, 789–798. [Google Scholar] [CrossRef]
  8. Kuske, T.; Kerker, S.; Breckow, J.; Lehné, R.; Laupenmühlen, T.; Jedmowski, L. Radon soil-gas measurement campaign in Hessen: An approach to identifying areas with enhanced geogen radon. Nukleonika 2020, 65, 139–144. [Google Scholar] [CrossRef]
  9. Mikšová, J.; Barnet, I. Geological support to the national radon programme (Czech Republic). Bull. Czech Geol. Surv. 2002, 77, 13–22. [Google Scholar]
  10. Neznal, M.; Neznal, M.; Matolin, M.; Barnet, I.; Miksova, J. The New Method for Assessing the Radon Risk of Building 307 Sites; Czech Geological Survey: Praga, Czech Republic, 2004. [Google Scholar]
  11. Barnet, I.; Pacherova, P.; Neznal, M.; Neznal, M. Radon in Geological Environment—Czech Experiences; Special Papers No. 19; Czech Geological Survey: Praga, Czech Republic, 2008. [Google Scholar]
  12. Barnet, I.; Pacherová, P.; Preusse, W.; Stec, B. Cross-border radon index map 1:100 000 Lausitz—Jizera—Karkonosze—Region (northern part of the Bohemian Massif). J. Environ. Radioact. 2010, 101, 809–812. [Google Scholar] [CrossRef]
  13. Planinić, J.; Vuković, B.; Radolić, V.; Stanić, D. Radon in soil and homes of Osijek. In Proceedings of the European IRPA Congress, Florence, Italy, 14–15 October 2002; p. 37, ISBN 88-88648-09-7. [Google Scholar]
  14. Chalupnik, S.; Wysocka, M. Measurement of Radon Exhalation from Soil—Development of the Method and Preliminary Results. J. Min. Sci. 2003, 39, 191–198. [Google Scholar] [CrossRef]
  15. Swakoń, J.; Kozak, K.; Paszkowski, M.; Gradziński, R.; Łoskiewicz, J.; Mazur, J.; Janik, M.; Bogacz, J.; Horwacik, T.; Olko, P. Radon concentration in soil gas around local disjunctive tectonic zones in the Krakow area. J. Environ. Radioact. 2005, 78, 137–149. [Google Scholar] [CrossRef] [PubMed]
  16. Petersell, V.; Åkerblom, G.; Ek, B.M.; Enel, M.; Mõttus, V.; Täht, K. Radon Risk Map of Estonia; Geological Surveys of Estonia and Sweden, Swedish Radiation Protection Authority: Stockholm, Sweden, 2005. [Google Scholar]
  17. Petersell, V.; Täht-Kok, K.; Karimov, M.; Milvek, H.; Nirgi, S.; Raha, M.; Saarik, K. Radon in the soil air of Estonia. J. Environ. Radioact. 2017, 166, 235–241. [Google Scholar] [CrossRef]
  18. Gruber, V.; Baumgartner, A.; Seidel, C.; Maringer, F.J. Radon risk in Alpine regions in Austria: Risk assessment as a settlement planning strategy. Radiat. Prot. Dosim. 2008, 130, 88–91. [Google Scholar] [CrossRef] [PubMed]
  19. Friedmann, H.; Baumgartner, A.; Bernreiter, M.; Gräser, J.; Gruber, V.; Kabrt, F.; Kaineder, H.; Maringer, F.J.; Ringer, W.; Seidel, C.; et al. Indoor radon, geogen radon surrogates and geology—Investigations on their correlation. J. Environ. Radioact. 2017, 166, 382–389. [Google Scholar] [CrossRef]
  20. Ielsch, G.; Cushing, M.E.; Combes, P.; Cuney, M. Mapping of the geogenic radon potential in France to improve radon risk management: Methodology and first application to region Bourgogne. J. Environ. Radioact. 2010, 101, 813–820. [Google Scholar] [CrossRef] [PubMed]
  21. Buttafuoco, G.; Tallarico, A.; Falcone, G. Mapping soil gas radon concentration: A comparative study of geostatistical methods. Environ. Monit. Assess. 2007, 131, 135–151. [Google Scholar] [CrossRef]
  22. Buttafuoco, G.; Tallarico, A.; Falcone, G.; Guagliardi, I. A geostatistical approach for mapping and uncertainty assessment of geogenic radon gas in soil in an area of southern Italy. Environ. Earth Sci. 2010, 61, 491–505. [Google Scholar] [CrossRef]
  23. Giustini, F.; Ciotoli, G.; Rinaldini, A.; Ruggiero, L.; Voltaggio, M. Mapping the geogenic radon potential and radon risk by using Empirical Bayesian Kriging regression: A case study from a volcanic area of central Italy. Sci. Total Environ. 2019, 661, 449–464. [Google Scholar] [CrossRef]
  24. Giustini, F.; Ruggiero, L.; Sciarra, A.; Beaubien, S.E.; Graziani, S.; Galli, G.; Pizzino, L.; Tartarello, M.C.; Lucchetti, C.; Sirianni, P.; et al. Radon Hazard in Central Italy: Comparison among Areas with Different Geogenic Radon Potential. Int. J. Environ. Res. Public Health 2022, 19, 666. [Google Scholar] [CrossRef]
  25. Guida, D.; Cuomo, V.; Peluso, F.; Roca, V.; Tranfaglia, G. A Multiscale and Adaptive Methodology for the Geogenic Radon Potential Mapping: The Case Study of the Campania Region (Southern Italy). Geosciences 2013, 3, 566–591. [Google Scholar]
  26. Cosma, C.; Baciu, C. Radon dynamics. In The Municipality of Cluj-Napoca and Peri-Urban Area—Environmental Studies; Editura Accent: Cluj-Napoca, Romania, 2002. [Google Scholar]
  27. Niță, D.; Cosma, C.; Papp, B.; Moldovan, M. Soil radon measurements in Cluj-Napoca (Romania). Stud. Univ. Babeș-Bolyai Phys. LIV 2009, 1, 100–106. [Google Scholar]
  28. Papp, B.; Szakacs, A.; Neda, T.; Papp, S.Z.; Cosma, C. Soil radon and thoron studies near the mofettes at Harghita Bai (Romania) and their relation to the field location of fault zones. Geofluids 2010, 10, 586–593. [Google Scholar] [CrossRef]
  29. Cosma, C.; Cucoş-Dinu, A.; Papp, B.; Begy, R.; Sainz, C. Soil and building material as main sources of indoor radon in Băiţa-Ștei radon prone area (Romania). J. Environ. Radioact. 2013, 116, 174–179. [Google Scholar] [CrossRef]
  30. Moldovan, M.C.; Burghele, B.D.; Roba, C.A.; Sferle, T.L.; Buterez, C.; Mitrofan, H. The geogenic radon potential map of the aspiring “Buzău Land” Geopark. Radiat. Prot. Dosim. 2017, 177, 173–175. [Google Scholar] [CrossRef] [PubMed]
  31. Lupulescu, A.; Dicu, T.; Papp, B.; Cucos, A. Determination of the Monthly Variation of Radon Activity Concentration in Soil. Stud. Univ. Babeș-Bolyai Ambient. 2018, 63, 49–59. [Google Scholar] [CrossRef]
  32. Balintoni, I.; Iancu, V. Probleme de Metamorfism, Litostratigrafie Si Structura Ale Cristalinului Din Masivul Poiana Rusca (Problems of Metamorphism, Lithostratigraphy and Crystalline Structure from the Poiana Rusca Massif). Stud. Si Cercet. De Geol. Geofiz. Geogr. Ser. De Geol. 1986, 31, 51–67. [Google Scholar]
  33. Maier, O.; Solomon, I.; Zimmermann, P.; Zimmermann, V. Studiul Geologic Și Petrografic al Cristalinului Din Partea Sudică a Munților Poiana Ruscă (The Geological and Petrographic study of the Crystalline from the Southern Side of the Poiana Rusca Mountains). Anu. Institutului Geol. și Geofiz. 1975, XLIII, 65–189. [Google Scholar]
  34. Maier, O.; Lupu, M. Harta geologică Republica Socialistă România, Scara 1:50.000, Foaia 105a, Băuțar (Geological Map of the Socialist Republic of Romania, Scale 1:50000, Sheet 105a, Bautar); Institutul de Geologie și Geofizică: București, Romania, 1979. [Google Scholar]
  35. Codarcea, A.; Dimitrescu, R.; Gherasi, N.; Mureșan, M.; Mureșan, G.; Krautner, H.; Krautner, F.; Lupu, M.; Marinescu, F.; Savu, H.; et al. Harta Geologică a Republicii Socialiste România, Scara 1:200.000, L-34-XXIII 25, Deva (Geological Map of the Socialist Republic of Romania, Scale 1:200,000, Deva); Comitetul de Stat pentru Geologie. Institutul Geologic: București, Romania, 1968. [Google Scholar]
  36. Alonso, H.; Rubiano, J.G.; Guerra, J.G.; Arnedo, M.A.; Tejera, A.; Martel, P. Assessment of radon risk areas in the Eastern Canary Islands using soil radon gas concentration and gas permeability of soils. Sci. Total Environ. 2019, 664, 449–460. [Google Scholar] [CrossRef]
  37. Kunovska, B.; Ivanova, K.; Stojanovska, Z.; Vuchkov, D.; Zaneva, N. Measurements of radon concentration in soil gas of urban areas, Bulgaria. Rom. J. Phys. 2013, 58, 172–179. [Google Scholar]
  38. Kikaj, D.; Jeran, Z.; Bahtijari, M.; Stegnar, P. Radon in soil gas in Kosovo. J. Environ. Radioact. 2016, 164, 245–252. [Google Scholar] [CrossRef]
  39. Dogjani, S.; Muceku, Y.; Lazo, P. Evaluation of Radon Concentration in the Urban Area Foundation of Tirana, Albania. Period. Polytech. Chem. Eng. 2017, 62, 236. [Google Scholar] [CrossRef]
  40. Elío, J.; Crowley, Q.; Scanlon, R.; Hodgson, J.; Long, S. Rapid radon potential classification using soil-gas radon measurements in the Cooley Peninsula, County Louth, Ireland. Environ. Earth Sci. 2019, 78, 359. [Google Scholar] [CrossRef]
  41. Cinelli, G.; Tositti, L.; Capaccioni, B.; Brattich, E.; Mostacci, D. Soil gas radon assessment and development of a radon risk map in Bolsena, Central Italy. Environ. Geochem. Health 2015, 37, 305–319. [Google Scholar] [CrossRef] [PubMed]
  42. Cosma, C.; Papp, B.; Moldovan, M.; Cosma, V.; Cindea, C.; Suciu, L.; Apostu, A. Measurement of radon potential from soil using a special method of sampling. Acta Geophys. 2010, 58, 947–956. [Google Scholar] [CrossRef]
  43. Florică, Ş.; Burghele, B.D.; Bican-Brişan, N.; Begy, R.; Codrea, V.; Cucoş, A.; Catalina, T.; Dicu, T.; Dobrei, G.; Istrate, A.; et al. The path from geology to indoor radon. Environ. Geochem. Health 2020, 42, 2655–2665. [Google Scholar] [CrossRef]
  44. Pásztor, L.; Szabó, K.Z.; Szatmári, G.; Laborczi, A.; Horváth, Á. Mapping geogen radon potential by regression kriging. Sci. Total Environ. 2016, 544, 883–891. [Google Scholar] [CrossRef]
  45. Szabó, K.Z.; Jordan, G.; Horváth, Á.; Szabó, C. Mapping the geogen radon potential: Methodology and spatial analysis for central Hungary. J. Environ. Radioact. 2014, 129, 107–120. [Google Scholar] [CrossRef]
Figure 1. Geological–structural map of the study area (based on the Geological Map of Romania at a 1:200,000 scale, Deva sheet [35], and the Geological Map of Romania at a 1:50,000 scale, Băuțar sheet [34], with adaptations).
Atmosphere 16 00596 g001
Figure 2. Geological profile for the study area—extract from the Geological Map of Romania at a 1:50,000 scale, Băuțar sheet [34].
Atmosphere 16 00596 g002
Figure 3. Radon activity concentration in the soil (A) and soil permeability (B) of different geological formations. Note: *, °, °—excessive values (The coded geological formations are presented in Table 1).
Atmosphere 16 00596 g003
Figure 4. Natural neighbor interpolation for soil radon activity concentration based on the geological map.
Atmosphere 16 00596 g004
Figure 5. Natural neighbor interpolation of soil permeability in relation to the geological map.
Atmosphere 16 00596 g005
Figure 6. Q-Q plots illustrating the distribution of geogenic radon potential: (A) for untransformed (raw) values and (B) for log-transformed data, highlighting the normality distribution after logarithmic transformation.
Atmosphere 16 00596 g006
Figure 7. Geogenic radon potential of different geological formations. Note: *, °—excessive values.
Atmosphere 16 00596 g007
Figure 8. Natural neighbor interpolation of geogenic radon potential in relation to the geological map.
Atmosphere 16 00596 g008
Table 1. Coded geological formations.
CodeGeological Formations
1Dăbâca Series—Sericite Quartzite Schist Formation
2Dăbâca Series—Micaceous Schist Formation with amphibolite Intercalations
3Sebes–Lotru Series—Almandine Mica Schist Subseries
4Rusca Montana Dep. sedimentary cover
5Băuțar Formation
6Voislova Formation
7Alluvial sediments
Disclaimer/Publisher’s Note: The statements, opinions and data contained in all publications are solely those of the individual author(s) and contributor(s) and not of MDPI and/or the editor(s). MDPI and/or the editor(s) disclaim responsibility for any injury to people or property resulting from any ideas, methods, instructions or products referred to in the content.

