Article

Climate Change Impacts on Maximum Aviation Payloads of Chinese Airports

1
College of Aviation Meteorology, Civil Aviation Flight University of China, Guanghan 618307, China
2
Sichuan Airlines Co., Ltd., Chengdu 610202, China
*
Authors to whom correspondence should be addressed.
Atmosphere 2025, 16(5), 597; https://doi.org/10.3390/atmos16050597
Submission received: 6 April 2025 / Revised: 5 May 2025 / Accepted: 12 May 2025 / Published: 15 May 2025
(This article belongs to the Special Issue Aviation Meteorology: Developments and Latest Achievements)

Abstract

:
This research investigates climate change impacts on the maximum aviation payload capacity across China’s airport network. Through analysis of projections from 30 Coupled Model Intercomparison Project Phase 6 (CMIP6) models under the Shared Socioeconomic Pathway 5-8.5 (SSP5-8.5) scenario, we quantify the temperature and the pressure effects on maximum take-off weight (MTOW) at 184 Chinese airports. The results reveal that all airports experience MTOW reductions by 2081–2100, with high-plateau airports (>2438 m) facing more moderate decreases (−1.25%) than plain airports (<1500 m) (−1.72%). This counterintuitive pattern stems from elevation-dependent pressure compensation: high-altitude regions benefit from significant pressure increases (4.6 hPa) that partially offset temperature-induced density reductions, while lowland areas receive minimal pressure compensation (0.9 hPa). For commercial aircraft, these changes translate to 1.3–2.9 tons of payload reduction for narrow-body aircraft at plain airports. Our findings demonstrate how topography modulates climate impacts on aviation operations, highlighting the need for regionally tailored adaptation strategies with a focus on economically vital lowland hubs.

1. Introduction

Air transportation plays a critical role in global connectivity and economic development, serving as an efficient means for transporting passengers and cargo across vast distances. The aviation industry, however, operates at the intersection of technological capabilities and environmental constraints, with aircraft performance being significantly influenced by atmospheric conditions [1,2,3]. This environmental sensitivity directly affects the economic fundamentals of air transport through its impact on maximum aviation payload—the total weight of passengers, cargo, and fuel that an aircraft can carry [4]. This payload capacity is of paramount importance for both economic viability and operational efficiency of commercial flights, with research showing that a mere 1% reduction in payload capacity can diminish route profitability by 3–5%, directly affecting airlines’ operational decisions and long-term sustainability.
This maximum payload is directly constrained by an aircraft’s MTOW, which represents the heaviest weight at which the aircraft is certified to take off safely. MTOW is fundamentally limited by the aircraft’s ability to generate sufficient lift during take-off, which depends on air density conditions at the runway [5]. Irrespective of aircraft design—whether fixed-wing or helicopters, jets or propellers—MTOW is directly proportional to near-surface air density (SAD). This critical relationship underscores the vulnerability of aviation operations to changes in atmospheric parameters, particularly air density, which is determined by both near-surface air temperature (SAT) and near-surface air pressure (SAP).
Recent research has documented climate change impacts already manifesting in aviation operations [6,7,8,9,10]. For instance, Coffel et al. [11] developed a comprehensive model projecting that as temperatures rise, 10–30% of annual flights departing during daily maximum temperatures may require weight restrictions, with reductions ranging from 0.5 to 4% of total payload and fuel capacity by mid-to-late century. Their research highlighted that airports with short runways, high temperatures, or high elevations would face the most significant operational challenges [11]. Similarly, Coffel and Horton quantified these impacts more specifically, projecting that weight-restriction days between May and September will increase by 50–200% at four major U.S. airports by 2050-70 under the RCP8.5 concentration scenario [12]. However, existing research on climate change impacts on aviation has predominantly focused on how rising temperatures affect take-off performance, overlooking the important role of air pressure in determining air density [13,14,15]. While temperature effects are well-documented, the current literature lacks depth in analyzing potential compensatory effects from pressure changes under climate scenarios, leaving a significant gap in our understanding of comprehensive climate impacts on maximum payloads.
This critical gap in understanding the interplay between temperature and pressure variations becomes particularly significant in regions with diverse topographical features like China. The existing literature’s focus on temperature alone creates an incomplete picture of climate change impacts on aviation, as pressure effects may partially offset or amplify temperature-induced changes in air density, especially across varied elevations [9,10]. Most prior investigations have either focused exclusively on temperature effects or examined isolated airport case studies in similar geographical settings, failing to capture the complex interactions between climate variables across heterogeneous landscapes [3,16,17]. This methodological limitation is especially problematic when evaluating regions with substantial elevation gradients, where both temperature and pressure responses to climate change may vary significantly with altitude, creating regionally differentiated impacts on aviation operations that current models cannot adequately predict.
China presents a particularly compelling case study due to three key factors. First, its vast geographical expanse encompasses remarkably varied terrain—from high-altitude plateaus exceeding 4000 m to coastal plains near sea level—creating a natural laboratory for examining topographically differentiated climate responses. Second, China has developed the world’s second-largest aviation market with one of the fastest growth rates globally, making its operational resilience economically significant. Third, with 184 major city transport airports distributed across different climatic zones and elevations, Chinese aviation infrastructure presents a comprehensive dataset for systematic investigation of climate–topography interactions in aviation contexts. Understanding how climate change differentially affects the maximum payload capacity across this diverse landscape is essential for long-term aviation planning and infrastructure development.
This study aims to address these research gaps through three specific objectives:
(1)
Quantify the impacts of climate change on maximum aviation payloads across Chinese airports by comprehensively analyzing both temperature and pressure changes under the high-concentration SSP5-8.5 scenario.
(2)
Analyze how topographical context modulates these impacts by comparing three distinct elevation categories—high-plateau, plateau, and plain airports—thereby revealing the spatial heterogeneity of climate change vulnerabilities across China’s aviation network.
(3)
Evaluate the mechanisms through which temperature and pressure changes interact to produce elevation-dependent outcomes for aviation payload capacities, providing insights for targeted adaptation strategies.
Through this investigation, we provide the first comprehensive assessment of how the complex interplay between projected temperature and pressure changes affects aviation operations across topographically diverse regions, thereby addressing a critical knowledge gap in climate change adaptation for the aviation sector.

2. Data and Methodology

2.1. Data

This study utilizes three primary data sources to investigate climate change impacts on aviation operations across China’s topographically diverse landscape:
(1)
Climate Projections: We employ SAT and SAP data from 29 Coupled Model Intercomparison Project Phase 6 (CMIP6) models (Table 1) [18]. These fully coupled global climate models have typical horizontal resolutions ranging from approximately 0.5° to 1.5° (~50–150 km) and temporal output frequencies from three-hourly to daily. They represent state-of-the-art climate simulations with enhanced capabilities and climate sensitivity compared to their CMIP5 predecessors [19,20]. The CMIP6 multi-model ensemble mean exhibits cold biases over most regions of China, particularly in the Tibetan Plateau [21,22], but these temperature biases are generally within ±1 °C for most regions and do not significantly affect our air-density dependent analyses. The multi-model ensemble approach effectively reduces individual model uncertainties. We analyze projections under both historical and high-concentration SSP5-8.5 scenarios, focusing on two time periods: 1995–2014 (current climate) and 2081–2100 (late 21st-century climate).
(2)
Topographical Data: Terrain elevation information is derived from the ETOPO1 dataset, which provides 1 arc-minute resolution global relief data [23]. This high-resolution topographical information enables detailed mapping of elevation-dependent climate impacts across China’s complex terrain.
(3)
Airport Information: Locations and operational data for 184 major city transport airports across China, categorized according to Civil Aviation Administration of China (CAAC) regulations into high-plateau (elevation >2438 m), plateau (1500–2438 m), and plain airports (<1500 m).

2.2. Methodology

Our methodology establishes a quantitative pathway from climate model projections to aviation payload capacity across China’s topographically diverse landscape. The framework is built upon the fundamental aerodynamic relationship between aircraft lift generation and atmospheric conditions.
To address the spatial resolution mismatch between CMIP6 model outputs and the location-specific airport data, we implemented the following data processing approach: (1) bilinear interpolation of multi-model climate outputs to a uniform 1° × 1° resolution grid covering China; (2) extraction of climate variables at airport locations through bilinear interpolation from the 1° × 1° grid to specific geographic coordinates; (3) calculation of time-averaged SAT and SAP for each model during both time periods at each airport location; (4) derivation of multi-model ensemble means for each airport location to minimize individual model biases.
While this approach introduces some interpolation errors, particularly in regions with complex topography, these errors are acceptable for our climate-scale analysis, which focuses on relative changes in air density rather than absolute values at individual locations. The high-concentration SSP5-8.5 scenario was selected to maximize the signal-to-noise ratio in climate change responses, providing clearer visualization of the spatial patterns of impacts. This approach is justified by the relatively linear scaling of temperature and pressure responses with global warming, allowing straightforward adjustment of our results to less intense warming scenarios through proportional scaling.
Aircraft are sustained by aerodynamic lift, and the MTOW can be expressed through the equation [5]:
M T O W = M ρ a | V 0 | 2
where M encompasses the aircraft’s mechanical properties including wing span area, attack angle, and fuselage–wing interaction; ρ a represents air density; and | V 0 | denotes the aircraft’s take-off speed (defined as the velocity attained immediately prior to turnover for the initial climbing phase). For a specific aircraft type operating on a given route, M remains constant as it is determined by the fixed design parameters of the aircraft. Similarly, | V 0 | is also considered constant for standard operating procedures, as commercial aircraft typically adhere to specific take-off speeds prescribed in their flight manuals. Under these operational conditions where both M and | V 0 | remain fixed, air density ( ρ a ) emerges as the sole environmental determinant directly proportional to MTOW. The complete derivation process is available in the work by Diandong Ren [5].
Air density is derived from atmospheric state variables using the equation [24,25]:
ρ a = P / ( R d T 1 + 0.000608 q )
where P represents SAP (Pa), R d is the specific gas constant for dry air (approximately 287 J/kg/K), T denotes SAT (K), and q is specific humidity (g/kg).
While specific humidity contributes to air density calculations, quantitative analysis shows that its influence is substantially smaller compared to temperature and pressure effects. The typical contribution of the humidity term (0.000608q) is approximately 1–2% of total air density under normal atmospheric conditions. More importantly, climate change-induced humidity variations yield density changes that are two orders of magnitude smaller than those caused by projected SAP and SAT changes. Our analysis, therefore, focuses on these two dominant parameters when calculating near-surface air density changes under climate change scenarios.
To isolate the individual contributions of temperature and pressure to overall MTOW changes, we employ a factor separation approach:
(1)
Temperature-only effect: Calculate air density using projected future temperatures combined with historical baseline pressures.
(2)
Pressure-only effect: Calculate air density using projected future pressures combined with historical baseline temperatures.
(3)
Combined effect: Calculate air density using both projected future temperatures and pressures.
For each approach, percentage changes in MTOW are calculated as:
ρ a p r o j e c t e d ρ a h i s t o r i c a l ρ a h i s t o r i c a l × 100 %
This methodology allows us to decompose the net climate change impact into its temperature and pressure components, revealing how these factors interact differently across China’s varied topography to produce spatially heterogeneous outcomes for aviation operations.
A critical assumption in our analysis is that the unavoidable load (empty weight) of existing aircraft remains constant throughout the 21st century, irrespective of potential technological advancements in aircraft design. This conservative approach ensures that our results represent the direct climate change effect on payload capacity independent of potential technological adaptation measures.

3. Results

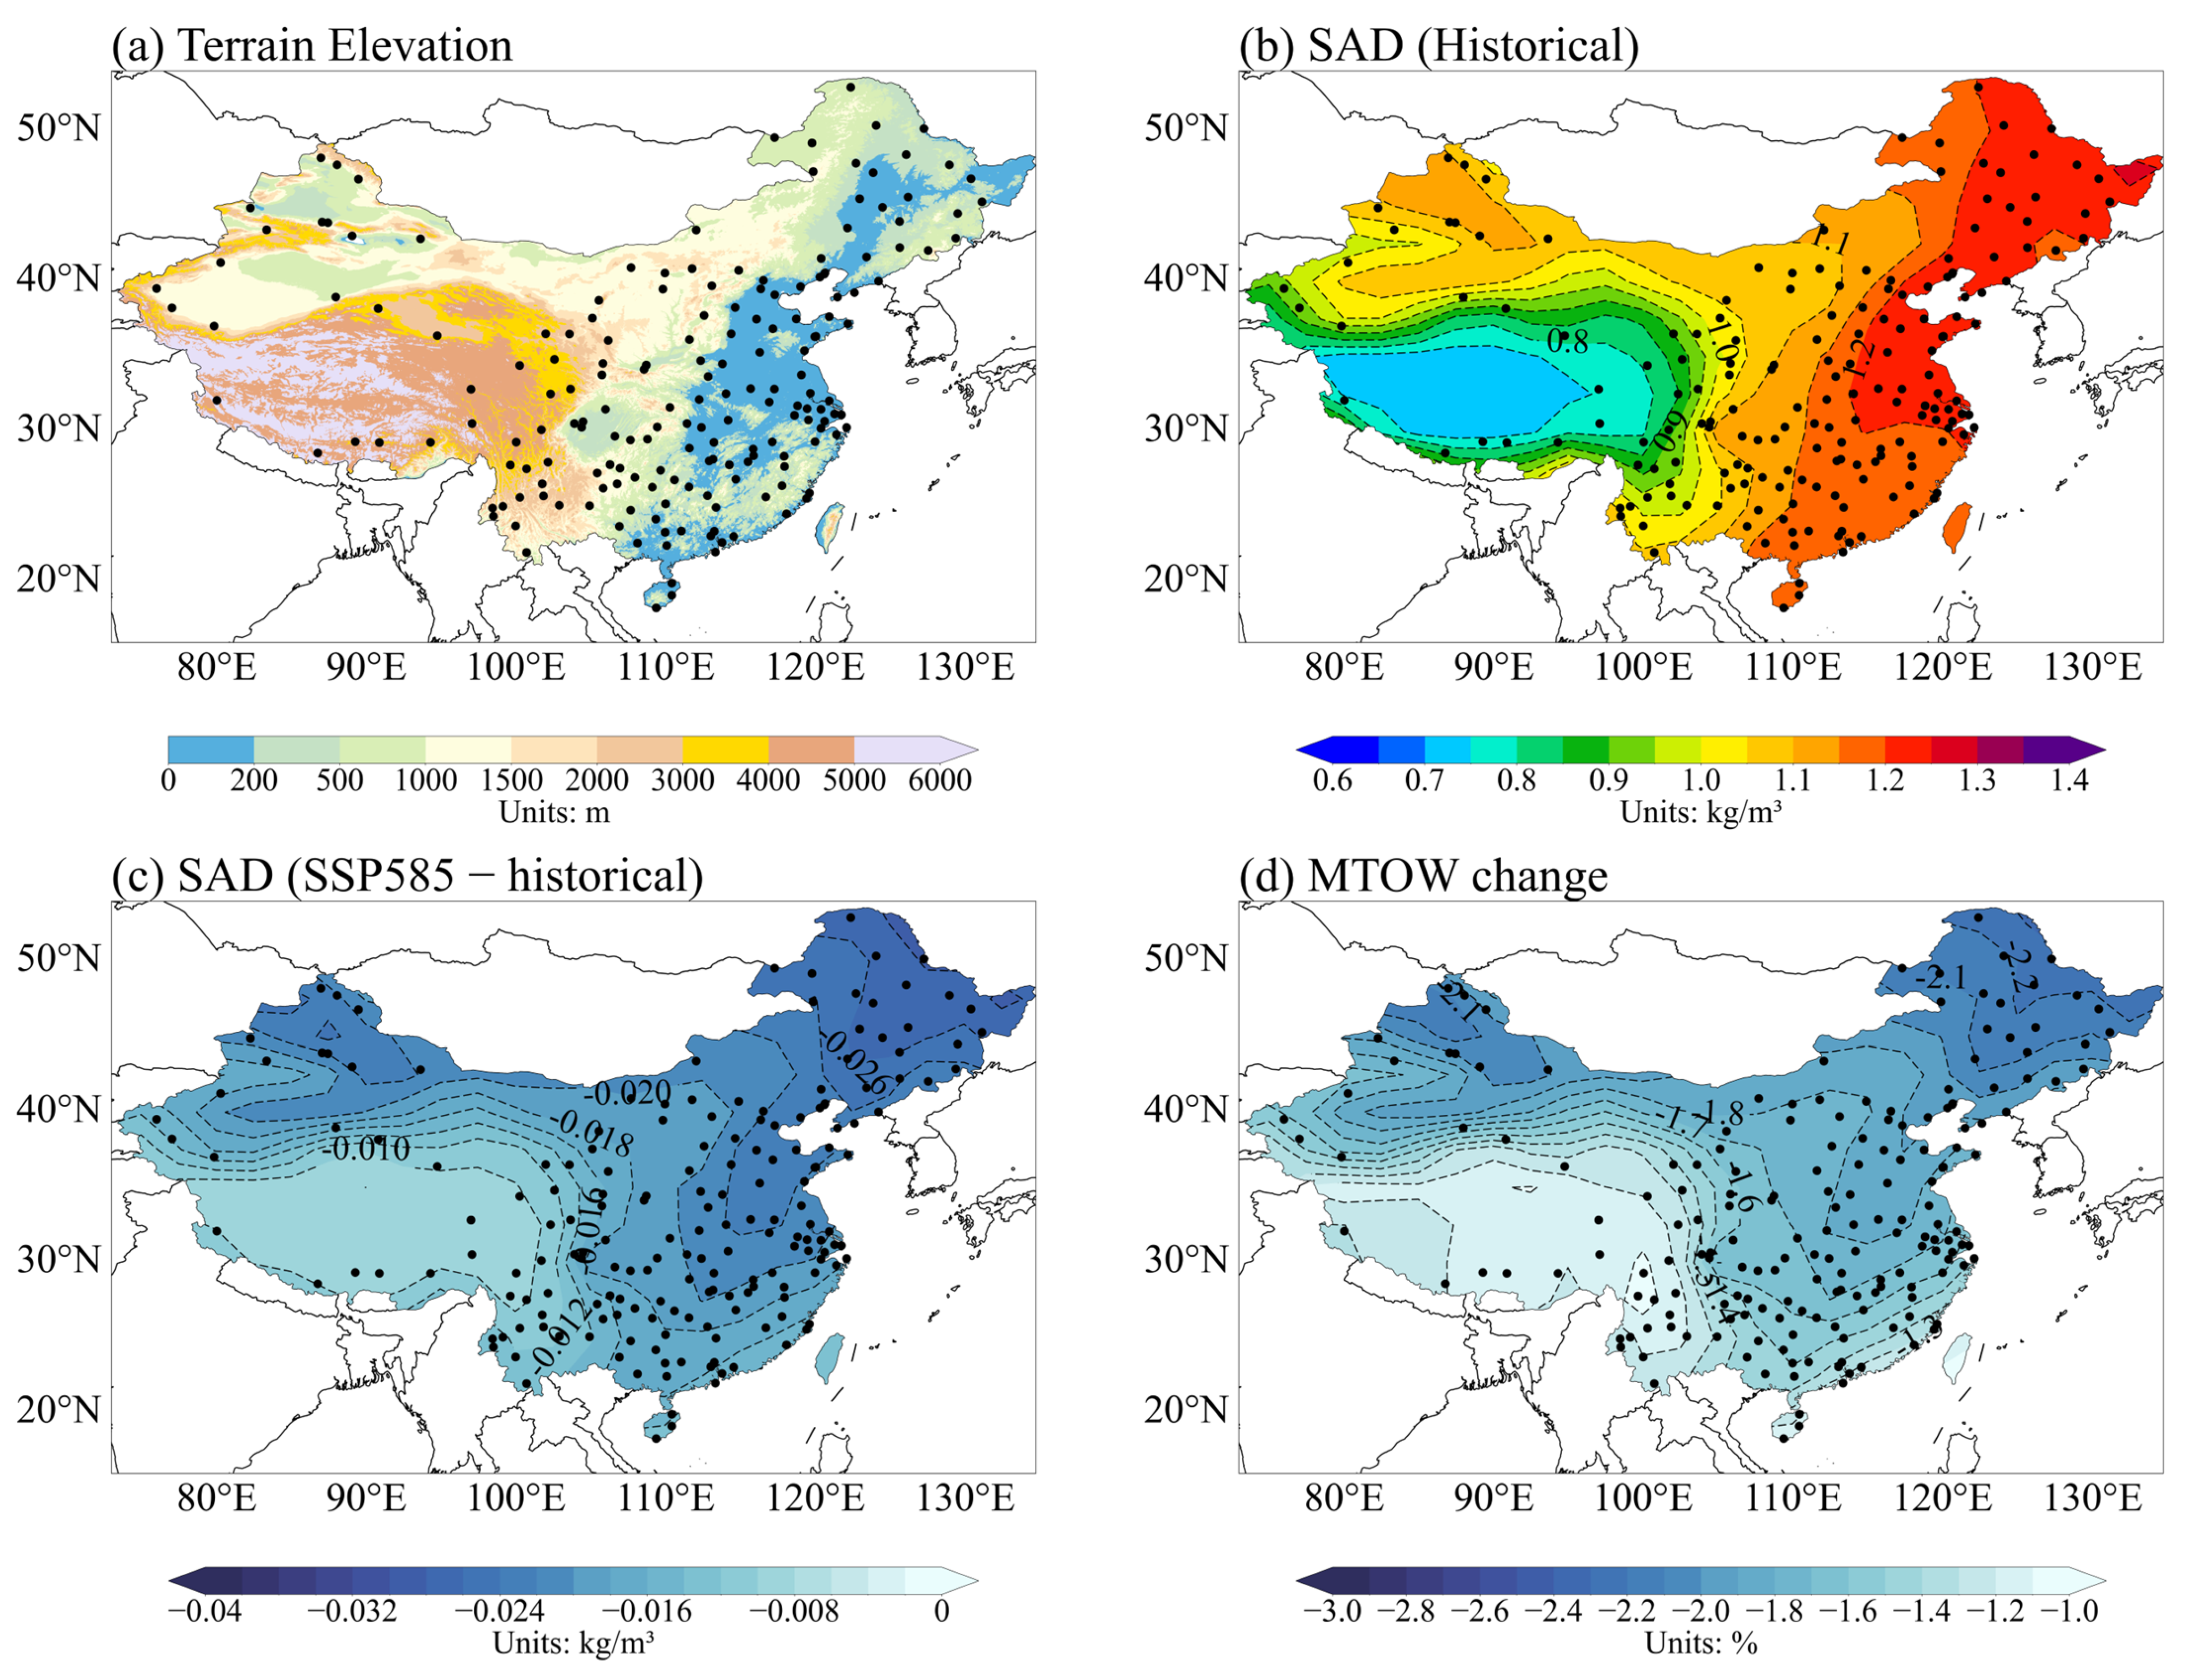
3.1. Spatial Patterns of MTOW Change Under Climate Change

Figure 1 illustrates the spatial heterogeneity of topography, surface air density (SAD), and projected climate change impacts across China’s diverse landscape. This comprehensive visualization reveals the complex interplay between geographical features and climate responses that collectively shape the future operating environment for China’s aviation network.
The pronounced topographical variation depicted in Figure 1a highlights China’s complex terrain, characterized by the imposing Tibetan Plateau in the southwest (elevations exceeding 4000 m), transitioning to moderate-elevation plateaus in central regions (1500–2500 m), and culminating in extensive lowland plains along the eastern seaboard (generally below 500 m). This topographical diversity creates dramatically different baseline operating conditions for airports across the country, with immediate implications for their climate change vulnerability.
The baseline distribution of SAD (Figure 1b) exhibits a clear inverse relationship with elevation, following fundamental atmospheric physics principles. The Tibetan Plateau shows substantially lower SAD values (approximately 0.8–0.9 kg/m3) compared to the eastern plains (typically 1.1–1.2 kg/m3), representing a 25–30% difference in baseline air density. This substantial gradient directly translates to proportional differences in aircraft lift generation capacity and maximum payload under current climate conditions, with high-plateau airports already operating under significant density–altitude constraints compared to their lowland counterparts.
The projected changes in SAD under the SSP5-8.5 scenario (Figure 1c) reveal a critical finding: all regions experience decreases in SAD (and consequently MTOW), but with spatially heterogeneous patterns that cannot be explained by elevation alone. Universally, every region exhibits deteriorating air density conditions, with SAD decreases ranging from −0.01 to −0.03 kg/m3, though the magnitude varies significantly across different topographical contexts. Notably, high-elevation regions like portions of the Tibetan Plateau show comparatively smaller reductions (−0.01 to −0.02 kg/m3) despite experiencing more pronounced warming, while eastern plain areas generally face larger decreases (−0.02 to −0.03 kg/m3) despite more moderate temperature increases. This counter-intuitive pattern suggests that complex interactions between temperature and pressure changes under climate warming produce regionally differentiated outcomes that defy simple elevation-based predictions but ultimately result in reduced aviation payload capacity across all of China’s airports. The resultant spatial distribution of percentage changes in MTOW (Figure 1d) directly mirrors the pattern of SAD changes, reflecting the proportional relationship between air density and MTOW established in our methodology. Eastern plain regions, which host China’s busiest aviation hubs serving its most economically active regions, face the most substantial reductions in MTOW (generally −1.5% to −2.5%). In contrast, high-plateau areas experience more moderate decreases (ranging from −1.0% to −1.5%). While model variations yield different absolute values, this spatial distribution pattern remains remarkably consistent across different models (Figure S1), reinforcing the robustness of our key finding that traditional aviation geography may be reshuffled by climate change. This spatial differentiation in MTOW changes carries significant implications for China’s aviation infrastructure planning, as it indicates that climatologically advantaged lowland airports may paradoxically face more severe operational constraints under future climate conditions than their high-elevation counterparts, which have traditionally operated under more challenging atmospheric circumstances.

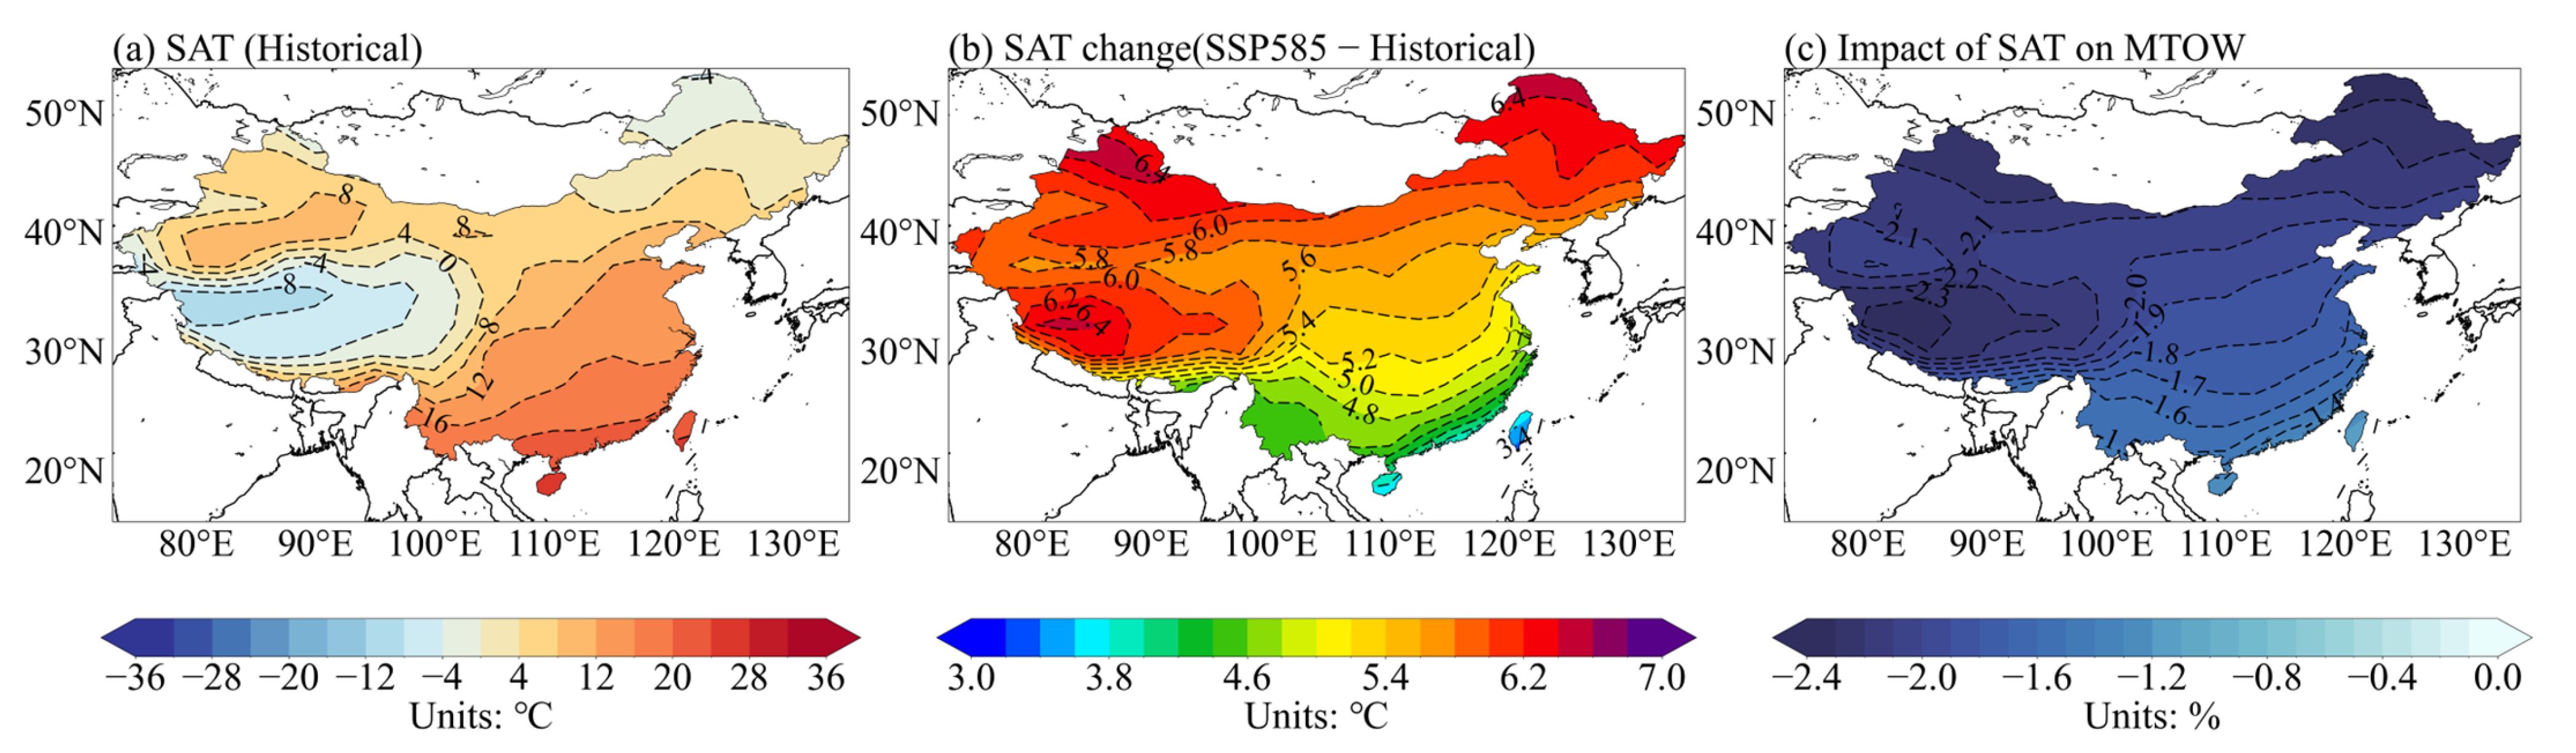
3.2. Thermal Effects on Aviation Payload Capacity

To provide a deeper understanding of the mechanisms driving the spatial heterogeneity in MTOW changes, we decomposed the net climate change impact into its temperature and pressure components. Figure 2 illustrates the thermal effects on aviation payload capacity, revealing how temperature increases modify air density patterns across China’s diverse topography.
The historical baseline distribution of SAT (Figure 2a) exhibits a pronounced latitudinal gradient across China, with warmer temperatures in southern regions (typically 15–25 °C) and cooler conditions in northern and high-elevation areas (generally −5 to 15 °C). This temperature distribution fundamentally influences baseline air density patterns and, consequently, the reference MTOW capabilities across China’s airport network. The clear temperature gradient creates a corresponding inverse gradient in air density, contributing to the pattern observed in Figure 1b.
Under the SSP5-8.5 scenario, the projected SAT changes (Figure 2b) demonstrate substantial warming throughout China, with temperature increases ranging from approximately 4 °C to 6 °C by the late 21st century. This warming is not uniform but displays significant spatial heterogeneity across China’s diverse topography. High-elevation regions, particularly across the Tibetan Plateau, exhibit pronounced warming (5–6 °C), consistent with the elevation-dependent warming phenomenon documented in mountainous regions worldwide. Northwestern arid regions also show stronger warming signals (5–6 °C), while southeastern coastal areas experience comparatively moderate temperature increases (4–5 °C). This spatially differentiated warming pattern creates corresponding variations in thermal expansion effects on air density.
The isolated temperature contribution to MTOW changes (Figure 2c) reveals consistently negative values across all regions, ranging from approximately −1.5% to −2.5%. This pattern confirms that projected temperature increases universally reduce air density through thermal expansion of air, diminishing MTOW capabilities across China’s entire airport network. The spatial pattern of temperature-induced MTOW changes broadly corresponds to the warming pattern, with regions experiencing greater warming generally showing more pronounced MTOW reductions. However, this correspondence is not perfect, as the percentage impact on MTOW depends on the ratio between the density change and the baseline density, which varies with elevation. Although inter-model differences affect the absolute magnitude of these temperature impacts, the underlying relationship between warming patterns and MTOW reductions remains remarkably robust across different climate projections (Figure S2), strengthening our confidence in the widespread nature of these aviation operational challenges.
The consistently negative temperature effect across all regions demonstrates that warming-induced thermal expansion represents a universal challenge for aviation operations under climate change, requiring adaptation strategies regardless of geographical context. This finding aligns with previous research focused on temperature impacts but, as we demonstrate in the following section, tells only part of the story regarding climate change effects on aviation operations.

3.3. Baric Effects on Aviation Payload Capacity

Complementing our analysis of temperature effects, we examined the influence of projected pressure changes on aviation payload capacity through a parallel analytical framework. Figure 3 illustrates the spatial patterns of SAP and its specific contribution to MTOW variations across China’s diverse landscape, revealing a critical compensatory mechanism that modulates the overall climate impact on aviation operations.
The historical baseline distribution of SAP (Figure 3a) exhibits a distinct topographically controlled pattern, with pronounced low-pressure conditions over the Tibetan Plateau (approximately 600–700 hPa) gradually transitioning to higher pressure regimes along the eastern plains (generally 950–1020 hPa). This pressure gradient directly reflects the exponential decrease in atmospheric pressure with elevation according to the barometric formula. The substantial pressure differences across China’s varied terrain directly translate to proportional differences in air density, explaining much of the pattern observed in Figure 1b.
The projected changes in SAP under the SSP5-8.5 scenario (Figure 3b) reveal a spatially differentiated pattern strongly correlated with topography. High-elevation regions, particularly across the Tibetan Plateau, exhibit substantial pressure increases (3–5 hPa), while eastern plain areas show minimal changes (0–1 hPa). This elevation-dependent pressure response emerges from the fundamental physical processes governing climate change effects on atmospheric circulation. As the atmosphere warms, it expands vertically, leading to a redistribution of atmospheric mass that increases surface pressure preferentially at higher elevations. This effect is most pronounced in high-plateau regions where baseline pressure is lower, creating a compensatory mechanism that partially offsets the temperature-induced density reductions in these areas.
The isolated pressure contribution to MTOW changes (Figure 3c) reveals consistently positive values across all regions, though with substantial magnitude variations ranging from negligible effects in eastern plains (approximately 0–0.2%) to significant enhancements in high-plateau regions (0.5–0.8%). This pattern demonstrates that projected pressure increases partially counteract the adverse effects of warming on air density and MTOW capabilities, particularly in high-elevation regions. The compensatory effect operates through a straightforward physical mechanism: higher pressure compresses air, increasing its density and enhancing aircraft lift generation capacity. Despite model uncertainties in pressure projections, the spatial pattern of this compensatory effect consistently shows greater benefits for high-altitude airports across different climate simulations (Figure S3), supporting the fundamental physics-driven relationship between pressure changes and elevation-dependent aviation benefits.
The differentiated pressure response across China’s topographical gradient explains the seemingly counter-intuitive pattern of net MTOW changes observed in Figure 1d. Despite experiencing slightly higher warming (5.5 °C compared to 5.3 °C at plain airports), high-plateau airports benefit from substantial pressure compensation, resulting in more moderate net MTOW reductions compared to lowland airports. This finding highlights the critical importance of considering both temperature and pressure variations in comprehensive assessments of climate change impacts on aviation operations, especially in regions with complex topographical characteristics.

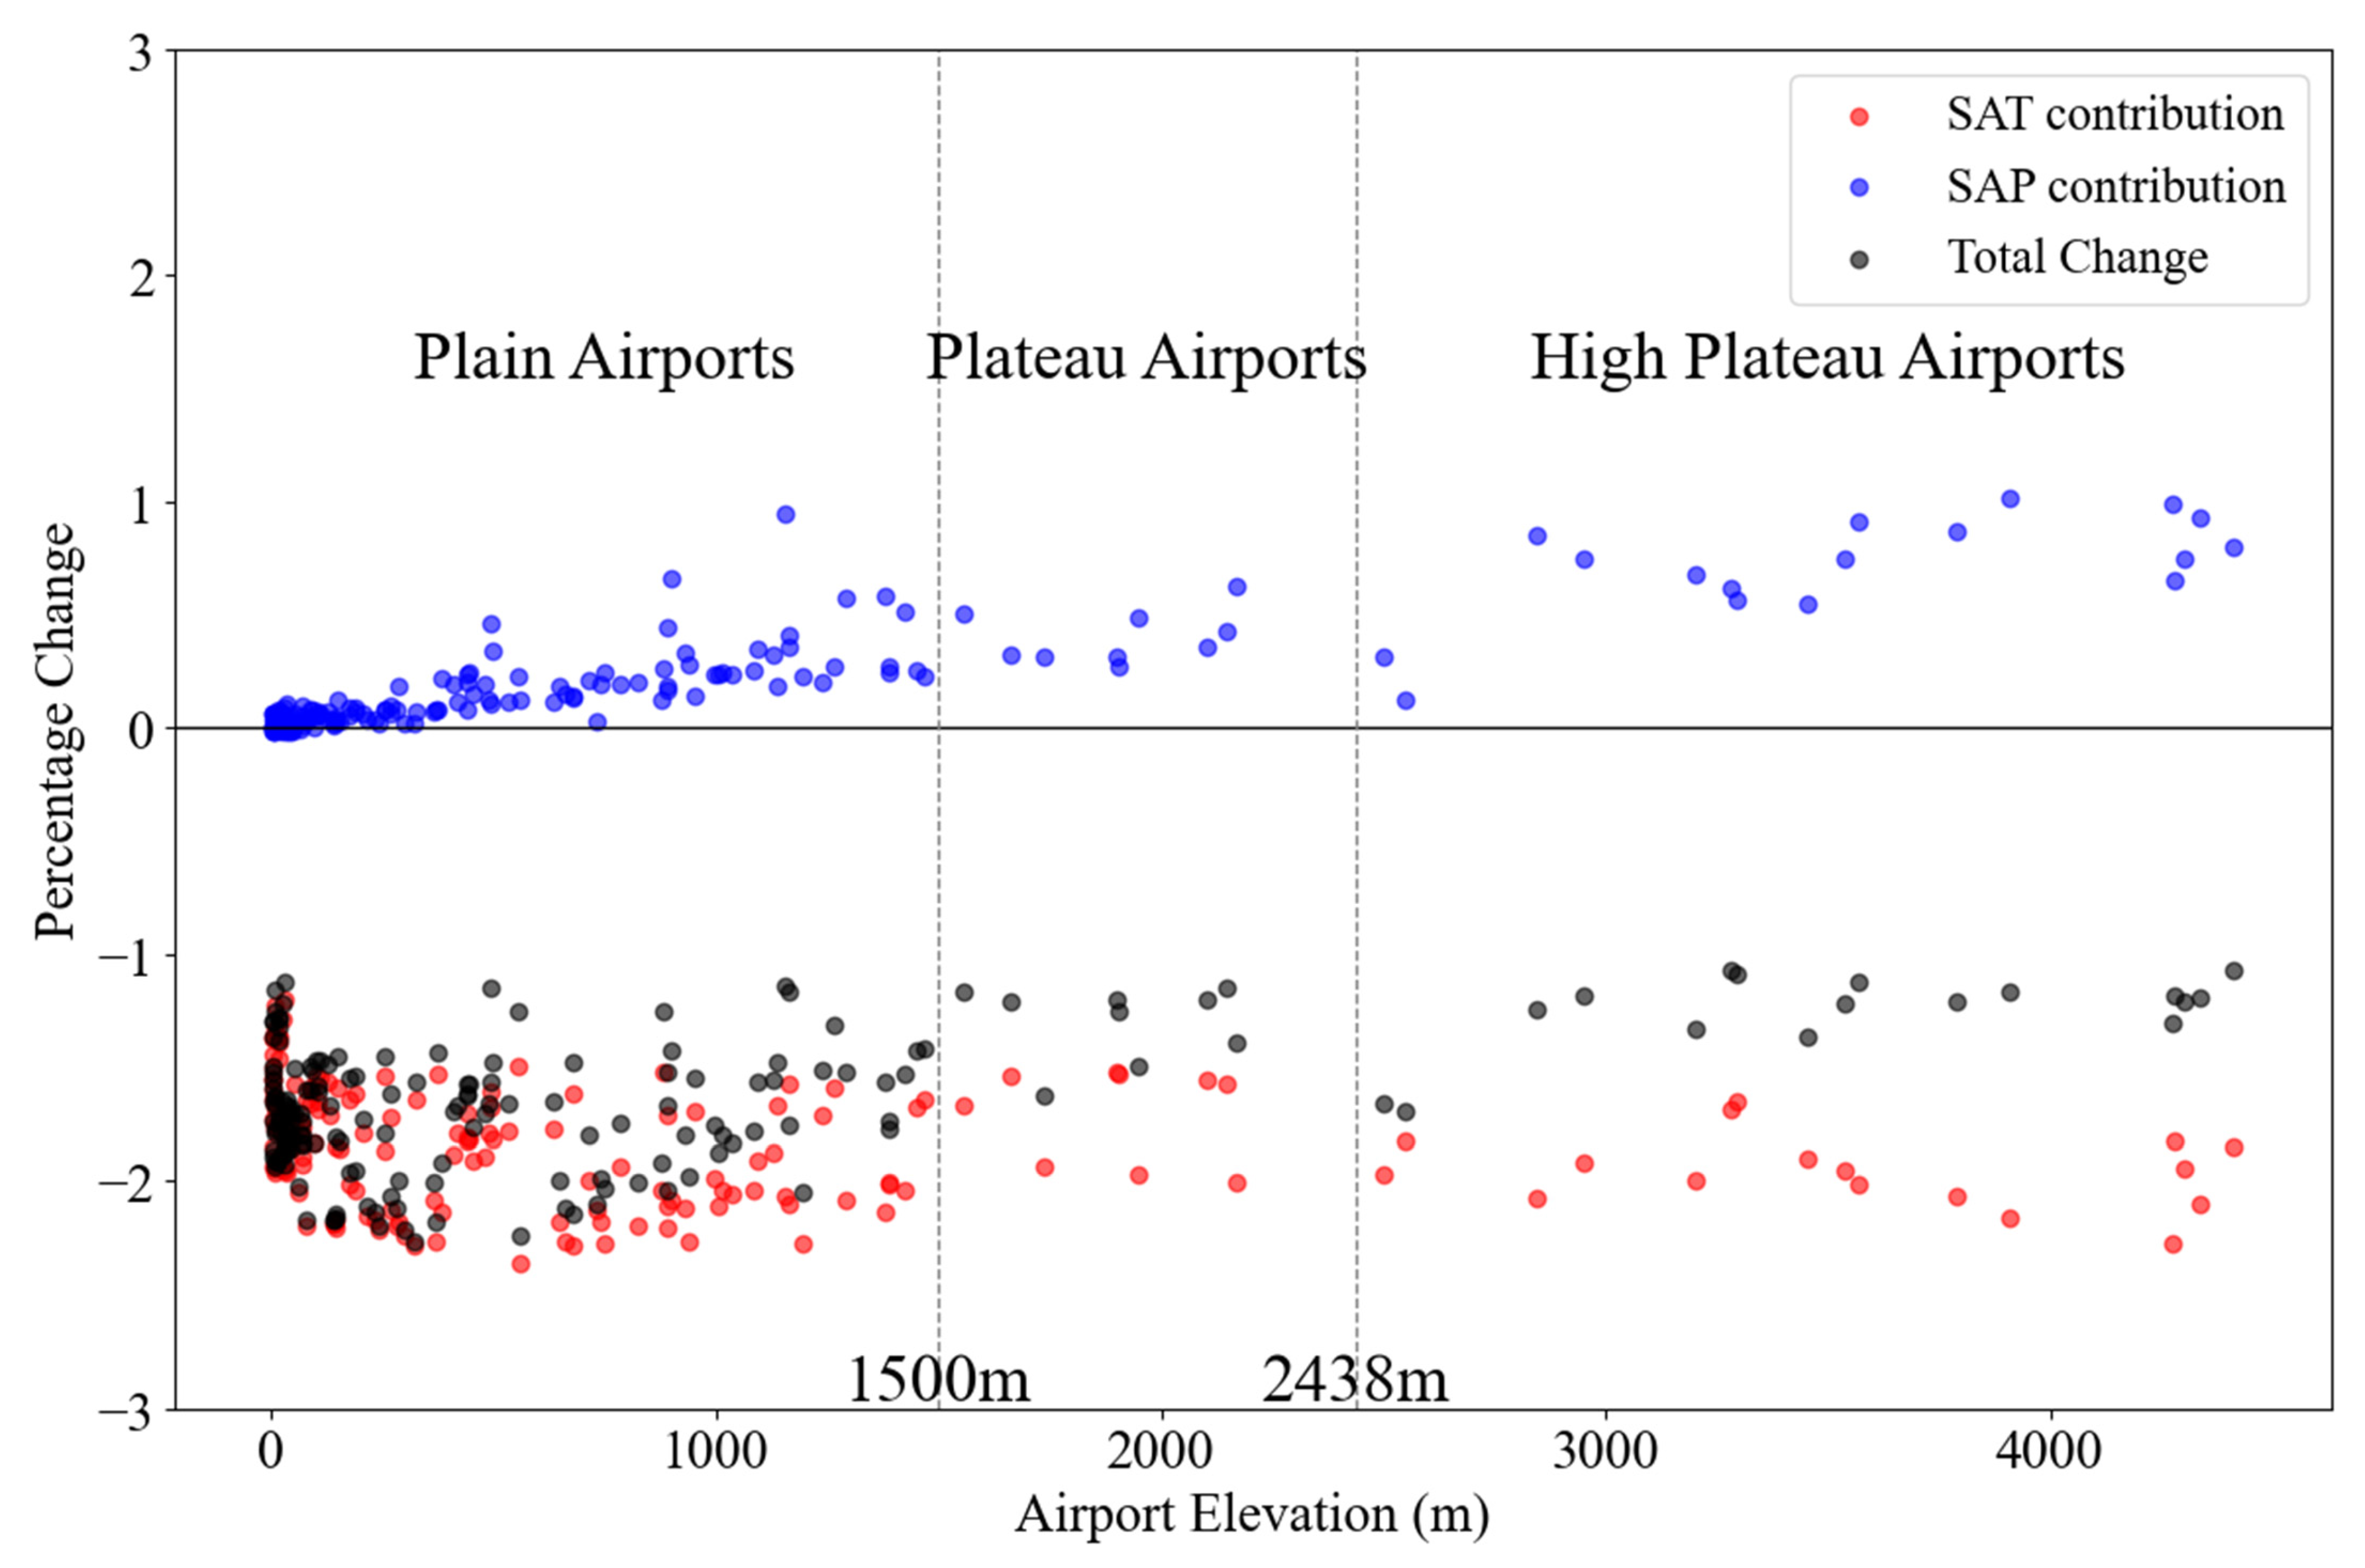
3.4. Elevation-Dependent Climate Impacts on Aviation Operations

To further elucidate the topographical dependence of climate change impacts on aviation operations, we conducted a comprehensive analysis of the relationship between airport elevation and projected MTOW changes across China’s diverse terrain (Figure 4).
Figure 4 illuminates the relationship between airport elevation and projected changes in MTOW across 184 Chinese airports, providing a clear visualization of the elevation-dependent impacts of climate change on aviation operations. Following Civil Aviation Administration of China regulations, airports are categorized into three distinct classes based on elevation thresholds: high-plateau airports (elevation exceeding 2438 m), plateau airports (elevation between 1500 and 2438 m), and plain airports (elevation below 1500 m). This classification has operational significance, with different takeoff and landing procedures, equipment requirements, and pilot qualifications applicable to each category.
The scatter plot reveals pronounced heterogeneity in climate change impacts across this topographical gradient. The black dots, representing the net MTOW changes resulting from combined climate effects, exhibit a clear positive correlation with elevation—higher-elevation airports generally experience less severe reductions in MTOW compared to their lower-elevation counterparts. This counter-intuitive pattern challenges conventional expectations that airports operating in more challenging high-altitude environments would be more vulnerable to climate change impacts.
The differential contributions of SAT and SAP changes, represented by red and blue dots, respectively, provide a mechanistic explanation for this elevation-dependent pattern. The red dots, denoting temperature-induced MTOW changes, display consistently negative values across all elevation categories, ranging from approximately −1.5% to −2.5%. This relatively uniform distribution indicates that warming-induced thermal expansion of air universally reduces air density and consequently diminishes MTOW capabilities regardless of topographical context.
Conversely, the blue dots, representing pressure-induced MTOW changes, exhibit a strong positive correlation with elevation. Plain airports experience minimal pressure-related MTOW enhancements (approximately 0–0.2%), while high-plateau airports benefit from substantial pressure-related compensatory effects (approximately 0.5–0.8%). This stark difference in pressure response across the elevation gradient explains the topographical differentiation in net climate impacts.
The mechanism behind this elevation-dependent pressure response lies in the atmospheric dynamics of global warming. As the atmosphere warms, it expands vertically, redistributing atmospheric mass in a way that disproportionately increases surface pressure at higher elevations. This compensatory pressure increase partially offsets the negative temperature effects at high-elevation airports while providing minimal mitigation for lowland facilities. This finding highlights the complex, non-linear interactions between climate change, atmospheric physics, and topographical context that shape aviation vulnerability across diverse landscapes.
To provide a more comprehensive quantitative assessment of climate change impacts across China’s topographically diverse airport network, Table 2 presents a systematic analysis of projected changes in key atmospheric parameters and their corresponding effects on MTOW capabilities.
China’s airport network includes 17 high-plateau airports (>2438 m), 9 plateau airports (1500–2438 m), and 158 plain airports (<1500 m). Table 2 quantifies the differential impacts of climate change across China’s topographically stratified airport infrastructure under the SSP5-8.5 scenario. High-plateau airports are projected to experience the most pronounced warming (mean increase of 5.5 °C) coupled with substantial pressure enhancements (average 4.6 hPa). This combination results in counteracting effects on air density: the considerable temperature increase induces a substantial MTOW reduction of −1.95%, while the concurrent pressure increase partially compensates with a positive MTOW contribution of 0.70%. Consequently, high-plateau airports face a moderate net MTOW reduction of −1.25%, despite their heightened exposure to temperature extremes.
Plateau airports exhibit a more moderate warming signal (4.9 °C) and pressure increase (3.2 hPa). These atmospheric modifications translate to a temperature-induced MTOW reduction of −1.70%, which is partially offset by a pressure-related enhancement of 0.40%, yielding a net MTOW decrease of −1.30%. This intermediary position in both elevation and climate response demonstrates the gradational nature of climate impacts across China’s topographical gradient.
Plain airports paradoxically face the most severe operational constraints despite experiencing intermediate warming (5.3 °C). The minimal pressure increase projected for these regions (merely 0.9 hPa) provides negligible compensation (0.12%) against the substantial temperature-induced MTOW reduction (−1.84%), resulting in the most pronounced net MTOW decrease (−1.72%) among all airport categories. This finding challenges conventional wisdom regarding climate vulnerability, as these traditionally advantaged lowland facilities appear most susceptible to climate change impacts on payload capacity.
These quantitative results highlight the importance of considering the complex interplay between elevation-dependent climate responses when assessing aviation infrastructure vulnerability. The inverse relationship between elevation and net MTOW reduction demonstrates that topographical context significantly modulates climate change resilience across China’s aviation network, necessitating regionally differentiated adaptation strategies.
This elevation-dependent climate response has significant implications for China’s aviation infrastructure planning and adaptation strategies. The finding that traditionally advantaged lowland airports face more severe payload reductions than their high-elevation counterparts suggests that adaptation priorities may need reconsideration. While high-plateau airports have historically operated under more restrictive conditions due to their challenging elevation, their relative resilience to climate change impacts may reduce the need for additional adaptive measures. Conversely, lowland airports that have traditionally operated with substantial payload margins may require more significant operational adjustments or infrastructure investments to maintain their economic viability under future climate conditions.
In practical terms, a 1.72% reduction in MTOW for plain airports translates to approximately 1.3–2.9 tons of payload reduction for typical narrow-body aircraft (e.g., Boeing 737 or Airbus A320) and 4.7–8.6 tons for wide-body aircraft (e.g., Boeing 777 or Airbus A350). These reductions could necessitate passenger or cargo weight restrictions, reduced fuel loads limiting range, or schedule adjustments to cooler periods of the day. The economic implications of these operational adaptations could be substantial, particularly for routes operating near capacity limits or with thin profit margins.
Our findings underscore the importance of incorporating topographically differentiated climate responses into long-term aviation infrastructure planning. Future airport developments should consider not only current atmospheric conditions but also the projected differential impacts of climate change across varied topographical contexts. This approach would enhance the long-term resilience of China’s aviation network in the face of evolving climate challenges.

4. Conclusions

This investigation elucidates the heterogeneous impacts of climate change on aviation payload capacity across China’s complex topographical gradient. Multi-model projections under the SSP5-8.5 scenario reveal that while all airports will experience MTOW reductions by 2081–2100, the magnitude varies systematically with elevation, establishing an inverse relationship between altitude and operational vulnerability.
The differential response manifests through complex thermo–baric interactions. High-plateau facilities (>2438 m) exhibit paradoxical resilience (−1.25% MTOW reduction) despite pronounced warming (5.5 °C), attributable to significant compensatory pressure enhancements (4.6 hPa). Conversely, plain airports (<1500 m) demonstrate heightened susceptibility (−1.72% MTOW reduction) despite moderate temperature increases (5.3 °C), due to negligible pressure compensation (0.12%). This pattern emerges from tropospheric expansion under warming conditions, which redistributes atmospheric mass preferentially toward higher elevations.
The quantitative decomposition of temperature and pressure contributions across elevation categories provides mechanistic insight into previously unrecognized topographical modulation of climate impacts on aviation infrastructure. For commercial aircraft, these reductions translate to significant payload constraints, particularly at economically vital lowland hubs where a 1.72% MTOW decrease represents approximately 1.3–2.9 tons for narrow-body aircraft.
These findings necessitate a paradigm shift in aviation climate adaptation frameworks, highlighting the importance of elevation-dependent responses in infrastructure planning. The demonstrated non-linear relationship between topography and climate vulnerability offers critical guidance for targeted adaptation strategies across China’s diverse aviation network, enhancing operational resilience against projected atmospheric modifications. Future work could expand this analysis by integrating the NEX-GDDP CMIP6 dataset [26,27] for improved spatial resolution and incorporating airport-specific traffic data to translate operational constraints into economic impacts, thereby enhancing the practical applicability of these findings.

Supplementary Materials

The following supporting information can be downloaded at: https://www.mdpi.com/article/10.3390/atmos16050597/s1, Figure S1. Spatial distribution of percentage changes in MTOW (%) under the SSP5-8.5 scenario for all models. Figure S2. Spatial patterns of percentage changes in MTOW (%) attributable solely to SAT changes for all models. Figure S3. Spatial patterns of percentage changes in MTOW (%) attributable solely to SAP changes for all models.

Author Contributions

Conceptualization, H.S.; methodology, T.Z.; software, X.K.; formal analysis, H.S.; writing—original draft preparation, H.S. and T.Z.; writing—review and editing, X.K.; visualization, J.Z. All authors have read and agreed to the published version of the manuscript.

Funding

This research was supported financially by the Fundamental Research Funds for the Central Universities (Grand No. 25CAFUC01006), and the Scientific Research Startup Funding for High-Level Talent Introduction at the Civil Aviation Flight University of China (Grant No. XYKY2024064).

Institutional Review Board Statement

Not applicable.

Informed Consent Statement

Not applicable.

Data Availability Statement

CMIP6 database, Available online: https://aims2.llnl.gov/search/cmip6/ (accessed on 12 October 2023).

Acknowledgments

We are grateful to the anonymous reviewers for their valuable comments and suggestions that greatly improved this manuscript. We acknowledge the World Climate Research Programme’s Working Group on Coupled Modelling, which is responsible for CMIP6, and we thank the climate modeling groups for producing and making available their model output. The ETOPO1 global relief model was provided by the National Oceanic and Atmospheric Administration (NOAA) National Geophysical Data Center. We are grateful for the open-access availability of these datasets which made this research possible.

Conflicts of Interest

Author Jian Zou was employed by the company Sichuan Airlines Co. Ltd. The remaining authors declare that the research was conducted in the absence of any commercial or financial relationships that could be construed as a potential conflict of interest. The funders had no role in the design of this study; in the collection, analyses, or interpretation of data; in the writing of the manuscript, or in the decision to publish the results.

References

  1. Gössling, S.; Neger, C.; Steiger, R.; Bell, R. Weather, Climate Change, and Transport: A Review. Nat. Hazards 2023, 118, 1341–1360. [Google Scholar] [CrossRef]
  2. Kang, X.; Meng, Z.; Feng, W.; Liu, Y. Climate Change Impacts on the Density Altitude of Chinese Airports in Summer. Atmosphere 2023, 14, 1577. [Google Scholar] [CrossRef]
  3. Wang, K.; Peng, X.; Dan, B.; Liu, H.; Cheng, S.; Fu, N.; Fu, H.; Liu, C. Decreased Aircraft Takeoff Performance under Global Warming. Atmosphere 2023, 14, 106. [Google Scholar] [CrossRef]
  4. Ackert, S. Aircraft Payload-Range Analysis for Financiers. Aircraft Monitora. 2013. Available online: https://www.aircraftmonitor.com/uploads/1/5/9/9/15993320/aircraft_payload_range_analysis_for_financiers___v2.pdf (accessed on 11 May 2025).
  5. Ren, D.; Dickinson, R.E.; Fu, R.; Bornman, J.F.; Guo, W.; Yang, S.; Leslie, L.M. Impacts of Climate Warming on Maximum Aviation Payloads. Clim. Dyn. 2019, 52, 1711–1721. [Google Scholar] [CrossRef]
  6. Gratton, G.B.; Williams, P.D.; Padhra, A.; Rapsomanikis, S. Reviewing the Impacts of Climate Change on Air Transport Operations. Aeronaut. J. 2022, 126, 209–221. [Google Scholar] [CrossRef]
  7. Ryley, T.; Baumeister, S.; Coulter, L. Climate Change Influences on Aviation: A Literature Review. Transp. Policy 2020, 92, 55–64. [Google Scholar] [CrossRef]
  8. Williams, J.; Williams, P.D.; Guerrini, F.; Venturini, M. Quantifying the Effects of Climate Change on Aircraft Take-off Performance at European Airports. Aerospace 2025, 12, 165. [Google Scholar] [CrossRef]
  9. Pellegrin, T.D. A Simulation of the Impacts of Climate Change on Civil Aircraft Takeoff Performance. In Doctoral Dissertations and Master’s Theses; Embry-Riddle Aeronautical University: Daytona Beach, FL, USA, 2023. [Google Scholar]
  10. Fernández, V.G. Impacts of Increasing High-Temperature Extremes on Aircraft Takeoff Performance over the Euro-Mediterranean Region. Ph.D. Thesis, Université Paul Sabatier-Toulouse III, Toulouse, France, 2023. [Google Scholar]
  11. Coffel, E.D.; Thompson, T.R.; Horton, R.M. The Impacts of Rising Temperatures on Aircraft Takeoff Performance. Clim. Chang. 2017, 144, 381–388. [Google Scholar] [CrossRef]
  12. Coffel, E.; Horton, R. Climate Change and the Impact of Extreme Temperatures on Aviation. Weather Clim. Soc. 2015, 7, 94–102. [Google Scholar] [CrossRef]
  13. Cizrelioğullari, M.N.; Imanov, T.V.; Gunay, T.; Shaiq Amir, A. Trend in Tropopause Warming and Its Influence Aircraft Performance. Aircr. Eng. Aerosp. Technol. 2024, 96, 1014–1025. [Google Scholar] [CrossRef]
  14. Gratton, G.; Padhra, A.; Rapsomanikis, S.; Williams, P.D. The Impacts of Climate Change on Greek Airports. Clim. Chang. 2020, 160, 219–231. [Google Scholar] [CrossRef]
  15. Zhao, Y.; Sushama, L. Aircraft Takeoff Performance in a Changing Climate for Canadian Airports. Atmosphere 2020, 11, 418. [Google Scholar] [CrossRef]
  16. Zhou, Y.; Zhang, N.; Li, C.; Liu, Y.; Huang, P. Decreased Takeoff Performance of Aircraft Due to Climate Change. Clim. Chang. 2018, 151, 463–472. [Google Scholar] [CrossRef]
  17. Yuan, W.; Dai, P.; Xu, M.; Song, W.; Zhang, P. Estimating the Impact of Global Warming on Aircraft Takeoff Performance in China. Atmosphere 2021, 12, 1472. [Google Scholar] [CrossRef]
  18. Eyring, V.; Bony, S.; Meehl, G.A.; Senior, C.A.; Stevens, B.; Stouffer, R.J.; Taylor, K.E. Overview of the Coupled Model Intercomparison Project Phase 6 (CMIP6) Experimental Design and Organization. Geosci. Model Dev. 2016, 9, 1937–1958. [Google Scholar] [CrossRef]
  19. Zelinka, M.D.; Myers, T.A.; McCoy, D.T.; Po-Chedley, S.; Caldwell, P.M.; Ceppi, P.; Klein, S.A.; Taylor, K.E. Causes of Higher Climate Sensitivity in CMIP6 Models. Geophys. Res. Lett. 2020, 47, e2019GL085782. [Google Scholar] [CrossRef]
  20. Eyring, V.; Cox, P.M.; Flato, G.M.; Gleckler, P.J.; Abramowitz, G.; Caldwell, P.; Collins, W.D.; Gier, B.K.; Hall, A.D.; Hoffman, F.M. Taking Climate Model Evaluation to the next Level. Nat. Clim. Chang. 2019, 9, 102–110. [Google Scholar] [CrossRef]
  21. Zhu, H.; Jiang, Z.; Li, J.; Li, W.; Sun, C.; Li, L. Does CMIP6 Inspire More Confidence in Simulating Climate Extremes over China? Adv. Atmos. Sci. 2020, 37, 1119–1132. [Google Scholar] [CrossRef]
  22. You, Q.; Cai, Z.; Wu, F.; Jiang, Z.; Pepin, N.; Shen, S.S.P. Temperature Dataset of CMIP6 Models over China: Evaluation, Trend and Uncertainty. Clim. Dyn. 2021, 57, 17–35. [Google Scholar] [CrossRef]
  23. Amante, C.; Eakins, B.W. ETOPO1 Arc-Minute Global Relief Model: Procedures, Data Sources and Analysis. 2009. Available online: https://repository.library.noaa.gov/view/noaa/1163/noaa_1163_DS1.pdf (accessed on 11 May 2025).
  24. Holman, J. Thermodynamics; McGraw-Hill: New York, NY, USA, 1980; p. 217. [Google Scholar]
  25. Wallace, J.; Hobbs, P. Atmospheric Science, 2nd ed.; Academic Press: Cambridge, MA, USA, 2006. [Google Scholar]
  26. Wu, F.; Jiao, D.; Yang, X.; Cui, Z.; Zhang, H.; Wang, Y. Evaluation of NEX-GDDP-CMIP6 in Simulation Performance and Drought Capture Utility over China–Based on DISO. Hydrol. Res. 2023, 54, 703–721. [Google Scholar] [CrossRef]
  27. Jiang, F.; Wen, S.; Gao, M.; Zhu, A. Assessment of NEX-GDDP-CMIP6 Downscale Data in Simulating Extreme Precipitation over the Huai River Basin. Atmosphere 2023, 14, 1497. [Google Scholar] [CrossRef]
Figure 1. Spatial distribution of: (a) terrain elevation (m) across China; (b) long-term average of historical surface air density (SAD) (kg/m3); (c) projected changes in SAD (kg/m3) under the SSP5-8.5 scenario (2081–2100 minus 1995–2014); and (d) corresponding percentage changes in MTOW (%). Black dots indicate the locations of 184 major city transport airports analyzed in this study.
Atmosphere 16 00597 g001
Figure 2. Spatial patterns of: (a) long-term average of historical SAT (°C); (b) projected changes in SAT (°C) under the SSP5-8.5 scenario; and (c) corresponding percentage changes in MTOW (%) attributable solely to SAT changes. Results are derived from the multi-model ensemble mean of CMIP6 models.
Atmosphere 16 00597 g002
Figure 3. Spatial patterns of: (a) long-term average of historical SAP (hPa); (b) projected changes in SAP (hPa) under the SSP5-8.5 scenario; and (c) corresponding percentage changes in MTOW (%) attributable solely to SAP changes. Results are derived from the multi-model ensemble mean of CMIP6 models.
Atmosphere 16 00597 g003
Figure 4. Relationship between airport elevation (m) (x-axis) and projected percentage changes in MTOW (%) (y-axis) for 184 Chinese airports. Black dots represent total MTOW changes due to combined climate change effects, blue dots indicate the contribution from SAP changes, and red dots show the contribution from SAT changes. The data points demonstrate the differential impacts of climate change on aviation operations across varying topographical contexts under the SSP5-8.5 scenario.
Atmosphere 16 00597 g004
Table 1. Characteristics of the CMIP6 models used in this study, including model names and their corresponding developing institutions.
Model NameInstitution
ACCESS-CM2CSIRO (Commonwealth Scientific and Industrial Research Organisation, Aspendale), ARCCSS (Australian Research Council Centre of Excellence for Climate System Science)
ACCESS-ESM1-5CSIRO
BCC-CSM2-MRBeijing Climate Center
CanESM5-CanOECanadian Centre for Climate Modelling and Analysis, Environment and Climate Change Canada
CanESM5
CESM2NCAR (National Center for Atmospheric Research, Climate and Global Dynamics Laboratory)
CESM2-WACCM
CNRM-CM6-1CNRM (Centre National de Recherches Meteorologiques), CERFACS (Centre Europeen de Recherche et de Formation Avancee en Calcul Scientifique)
CNRM-CM6-1-HR
CNRM-ESM2-1
EC-Earth3EC-Earth-Consortium, Europe-wide consortium
EC-Earth3-Veg
FGOALS-f3-LChinese Academy of Sciences
GFDL-CM4National Oceanic and Atmospheric Administration, Geophysical Fluid Dynamics Laboratory
GFDL-ESM4
GISS-E2-1-GGoddard Institute for Space Studies
INM-CM4-8Institute for Numerical Mathematics, Russian Academy of Science
INM-CM5-0
IPSL-CM6A-LRInstitut Pierre Simon Laplace
KACE-1-0-GNational Institute of Meteorological Sciences/Korea Meteorological Administration, Climate Research Division
MCM-UA-1-0Consortium for Mathematics and Its Applications
MIROC6JAMSTEC (Japan Agency for Marine-Earth Science and Technology), AORI (Atmosphere and Ocean Research Institute, The University of Tokyo), NIES (National Institute for Environmental Studies), and R
CCS (RIKEN Center for Computational Science)
MIROC-ES2L
MPI-ESM1-2-HRMax Planck Institute for Meteorology, Germany
MPI-ESM1-2-LRMax Planck Institute for Meteorology
MRI-ESM2-0Meteorological Research Institute, Japan
NorESM2-LMNorESM Climate modeling Consortium consisting of CICERO (Center for International Climate and Environmental Research)
NorESM2-MM
UKESM1-0-LLMet Office Hadley Centre; Natural Environment Research Council; National Institute of Meteorological Sciences/Korea Meteorological Administration, Climate Research Division; National Institute of Water and Atmospheric Research
Table 2. Summary of climate change impacts on MTOW across different topographical categories of Chinese airports under the SSP5-8.5 scenario. The table presents mean values of projected changes in impact factors (SAT in °C and SAP in hPa) and their corresponding contributions to MTOW changes (%). The rightmost column shows the combined effect (%) of both factors. Airports are categorized as high-plateau, plateau, and plain based on elevation thresholds. Numbers in parentheses represent the number of airports in each category.
Impact Factor ChangesMTOW Changes (%)
SAT (°C)SAP(hPa)SATSAPSSP585
High-Plateau airports (17)5.54.6−1.950.70−1.25
Plateau airports (9)4.93.2−1.700.40−1.30
Plain airports (158)5.30.9−1.840.12−1.72
Disclaimer/Publisher’s Note: The statements, opinions and data contained in all publications are solely those of the individual author(s) and contributor(s) and not of MDPI and/or the editor(s). MDPI and/or the editor(s) disclaim responsibility for any injury to people or property resulting from any ideas, methods, instructions or products referred to in the content.

