Abstract
Implied by the terminologies “Harang Reversal” and “Harang Discontinuity”, there are two significant features of the Harang region: (i) the reversal of auroral electrojets along with the underlying plasma convection flow and electric (E) fields, and (ii) the discontinuity between the electrojets/convection flows/E-fields. Even the earliest studies reported the discontinuity observed in the meridional E-field. Conversely, some of the previous studies state that convection flow and E-field reversals do not involve any physical discontinuity. We investigate these two features (i–ii) observed in five topside-ionosphere Harang scenarios. Each scenario occurred during a sequence of events that led to the onset of the substorm expansion phase, when the Harang region was newly formed. Our results show (1) the newly formed Harang region between the dusk and dawn convection cells, where one convection cell wraps around the other, (2) the zonal drift- and E-field reversals, (3) the discontinuity between the dusk and dawn convection flows and also between the reversing E-field components, and (4) the Earthward electromagnetic energy deposition locally minimizing or diminishing within the discontinuity and peaking within the reversing zonal drift and E-fields. Thus, the observed convection flow and E-field reversals involved the development of discontinuity.
1. Introduction
Harang Discontinuity [1] is a magnetosphere–ionosphere (M–I) conjugate phenomenon [2]. Its ionosphere component was first reported in 1946 by Harang [3], who observed a discontinuity in the magnetic field perturbation (ΔH) pattern. However, the importance of the discontinuity, as a region of reversal, transition, or change for most substorm- and polar-convection-related phenomena, was first emphasized much later, in 1972, by Heppner [1]. In the ionosphere, Harang Discontinuity occurs within the nighttime auroral zone, in a narrow longitude region, mostly in the premidnight and midnight magnetic local time (MLT) sectors [1,2], but sometimes in the postmidnight MLT sector [4], and occasionally, even deep in the evening MLT sector [5]. To illustrate the Harang region plasma environment in the ionosphere, Figure 1a shows the two-cell polar convection pattern. There, the F-region plasma is driven by the mapped-down magnetospheric electric (E) field. Ordered in a twin-cell vortex pattern [6], the plasma E×B drifts clockwise in the dusk cell and anticlockwise in the dawn cell. Plasma flows are antisunward across the polar cap (marked in light green) and sunward in the oval region (marked in gray). Ionospheric E-fields (marked in blue) are directed poleward on the duskside and equatorward on the dawnside. These E-fields are associated with ionospheric Pedersen currents (JP; marked in dark red), which connect the oppositely directed Region 1 (R1) and R2 field-aligned currents (FACs): downward (↓) R2 with upward (↑) R1 on the duskside and ↓R1 with ↑R2 on the dawnside. Meanwhile, ionospheric Hall currents (JH; marked in dark green) flow antisunward: both in the duskside eastward electrojet (EEJ) and in the dawnside westward electrojet (WEJ).
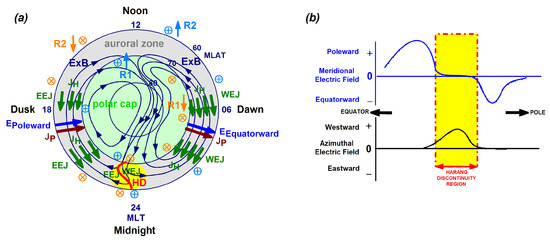
Figure 1.
(a) The schematic diagram depicts the two-cell polar convection pattern along with the underlying E-fields and currents. The Harang region (shaded in yellow) appears in the midnight MLT sector of the auroral zone. Harang Discontinuity (HD, in red) appears as a convection flow discontinuity. (b) The schematic diagram illustrates the meridional E-field’s clockwise rotation, from poleward to equatorward. Here, Harang Discontinuity (shaded in yellow) appears as a meridional E-field discontinuity, where the azimuthal E-field locally increases.
Harang Discontinuity (marked in red) appears near magnetic midnight, where the polar convection pattern becomes skewed (marked as the shaded region in yellow). As was first reported by Harang [3], the dominating EEJ (ΔH > 0) reverses in the clockwise direction to a WEJ (ΔH < 0) along the discontinuity. Thus, across the discontinuity, the EEJ is located equatorward of the WEJ. Since auroral electrojets are mainly Hall currents, the reversal is also depicted by Hall currents changing directions from antisunward to sunward, as well as meridional Pedersen currents (marked in dark red) and related E-fields (marked in blue) changing directions from poleward to equatorward. Heppner ([1,7] explained Harang Discontinuity as a convection flow discontinuity, separating oppositely directed convection flows, where sunward plasma convection flows (related to the dusk cell) become antisunward-directed (related to the dawn cell). Thus, in terms of plasma convection, Harang Discontinuity represents a convection boundary dividing the azimuthal westward (or duskward) and eastward (or dawnward) drifts [8].
In Figure 1b, the schematic diagram is modified after Figure 1 of Kamide [8] and illustrates the meridional E-fields underlying the plasma convection. As shown, the dominating poleward E-field gradually becomes equatorward-directed through a clockwise rotation. Harang Discontinuity (marked as the shaded interval in yellow) is located between the poleward and equatorward E-fields. Within the discontinuity, a directional change occurs [1,2,9]. Thus, while the region of reversal may not be a physical discontinuity, the discontinuity itself may have a finite width wherein the actual transition or change occurs [8,10].
In the magnetosphere, the plasmasheet maps down to the auroral oval, while the magnetotail lobe maps down to the polar cap. Thus, the Harang Discontinuity’s poleward region is magnetically connected to the central region of the plasmasheet, while its equatorward region is connected close to the plasmasheet’s Earthward edge [11]. In the magnetic midnight sector, the Harang region magnetically connects to the magnetotail [2,12].
The M–I conjugate Harang Discontinuity is also a common feature of substorms [1] and is associated with auroral activation [13]. Therefore, various auroral features (with plasmasheet driver mechanisms) are associated with the Harang region. These include many substorm-onset-related auroral signatures such as growth phase arcs [14], poleward boundary intensifications (PBIs) [15], and the PBIs’ frequent equatorward extensions known as auroral streamers [16,17,18,19,20,21].
Although Harang Discontinuity has a significant role in the substorm-triggering process, as was specified and put forward by Nishimura et al. [22], (a) the documentation of Harang Reversal itself is not covered in their study through ionospheric observations. Only the clockwise rotating Harang aurorae/streamers are shown by Time History of Events and Macroscale Interactions during Substorms (THEMIS) all-sky imager (ASI) images. Furthermore, in our recent study [23], we reported our comprehensive investigation of the M–I conjugate clockwise rotating Harang reversal, but various aspects were not covered. We investigated only the near-midnight Harang reversal, (b) leaving other MLT sectors out. Moreover, (c) the Harang Reversal appearing in the ionosphere was not documented with E-field observations. Therefore, (d) the important observational evidence of clockwise E-field rotation driving clockwise E×B drift rotation is still missing. Furthermore, (e) the scenario of an anticlockwise rotating Harang Reversal (when the dominating WEJ becomes an EEJ) was not investigated. Moreover, contradicting early E-field studies documenting the discontinuity between the rotating E-fields [1,2,8,9], some of the above-mentioned previous [20,21] and recent studies [24,25] state that (f) the rotation of convection flows and E-field components within the Harang region does not involve any physical discontinuity.
In order to fill these gaps (listed above as a–f) in our knowledge and understanding, we investigate both the various reversals and the discontinuity itself between the reversing components in a comprehensive way. In five topside-ionosphere scenarios, we present the Harang region occurring in various MLT sectors during a sequence of events that led to the onset of the expansion phase. Our scenarios demonstrate (i) the rotating convection flows and E-field components depicting the Harang Reversal, (ii) the discontinuity between the convection flows and underlying E-field components depicting the Harang Discontinuity, where the convection flows and E-field components minimized, and (iii) the Earthward directed electromagnetic energy deposition locally maximizing within the rotating drifts and E-fields and locally decreasing or diminishing within the discontinuity. Since our scenarios show both Harang Reversal and Harang Discontinuity, we use “Harang region” in the following sections.
2. Materials and Methods
To investigate the Harang region in the topside ionosphere, we utilized the multi-instrument Defense Meteorological Satellite Program (DMSP) data package [26] and auroral imageries unique to DMSP. To observe the Harang region, depicted by a discontinuity between the reversing zonal drift in the auroral oval, we surveyed the DMSP line plots for the calendar years of 2012 and 2013 when the DMSP data recording was of good quality and four DMSP satellites were operational. Since the detection of the actual discontinuity in the Harang region is quite rare, as the satellite has to be at the right place at the right time, we found only five good-quality observations, which we present in four events. These observations were made by the DMSP F15, F16, F17, and F18 satellites, mainly over the Southern Hemisphere and in the nighttime MLT sector. As these DMSP satellites crossed the oval in the dawn-dusk direction, they followed the discontinuity oriented in the east–west (E–W) direction and were able to provide exceptional observations of the Harang region, depicting both the reversal and the discontinuity itself. We summarize these observations in Table 1. Covered by continuous and good-quality (Level 2) data, we present five observations made in four events: three events in the Southern Hemisphere and one event in the Northern Hemisphere.

Table 1.
Events investigated and observations made by the various DMSP satellites.
We utilized multi-instrument in situ measurements and images provided by various DMSP satellites orbiting the Earth at an altitude of ~840 km in their inclined orbits at 98.7° and with a duration of 110 minutes in the topside ionosphere. The DMSP measurements used are from the SSIESs (Special Sensor for Ions Electrons Scintillations) and SSM (Special Sensor Magnetometer) instruments [26]. These measurements are processed and published as Level 2 data by the Madrigal Database. Provided by the SSIES instrument, we used drift velocities measured in the ram (VRAM; m/s) or along-the-track direction and in the cross-track horizontal (VHOR; m/s) and vertical (VVER; m/s) directions. We also used the SSM-measured magnetic B field components (BX, BY, and BZ; nT) along with the computed perturbation B field (δB) or magnetic deflection components (δBX, δBY, and δBZ; nT). By following the methodology of Kilcommons et al. [27], we computed the three E-field components (EX, EY, EZ; mV/m) based on the basic equation of E = −Vions × B as EX = VZBY − VYBZ, EY = VXBZ − VZBX, and EZ = VYBX − VXBY, where X denotes the ram direction, and Y and Z represent the cross-track horizontal and vertical directions. By following the methodology of Huang and Burke [28], we used the δB line plots to infer the directions of large-scale R1 and R2 FACs. When the DMSP satellite moves in the poleward direction, a negative δBY or δBZ gradient indicates upward FACs, and a positive δBY or δBZ gradient implies downward FACs. From the δBY or δBZ gradients, we could define the directions of ionospheric Pedersen currents connecting the oppositely directed large-scale FACs. Meanwhile, δBX or δBY amplitudes indicate the directions of ionospheric Hall currents. Based on the study of Huang et al. [29], we computed the vertical Poynting flux (S||; mW/m2) component in a spacecraft-centered coordinate system, where X is upward-downward, Y is forward-backward, and Z is eastward-westward, by using good-quality Level 2 data providing ~10% accuracy. We used the equation S|| = 1/μ0((VXBZ − VZBX)dBZ − (−VXBY)dBY), where μ0 is the permeability in a vacuum (4π × 10−7 H/m). In our S|| line plots, the Earthward (or inward) directed Poynting flux deposition into the coupled Ionosphere-Thermosphere (I-T) system is indicated by the positive (S|| > 0) values. Meanwhile, the negative (S|| < 0) values indicate the outward-directed Poynting flux deposition into the magnetosphere.
We also employed a small number of images. These include the DMSP images provided by the Special Sensor Ultraviolet Spectral Imager (SSUSI) instrument, which measures auroral and airglow emissions of Far Ultra-Violet (FUV) radiance produced by the upper atmosphere [30,31]. Therefore, SSUSI imagery provides auroral observations derived from 140–150 nm N2 emissions, which is also known as the N2 LBHS (Lyman-Birge-Hopfield short) spectrum. Both equatorward and poleward oval boundaries are defined by the SSUSI model and are shown by the Auroral Google Earth images provided by SSUSI. However, the SSUSI images show only the equatorward auroral boundary (marked in dark red). Based on the Auroral Google Earth images, we added the poleward auroral boundary (marked in red) to each SSUSI image shown.
We also used horizontal magnetic perturbation (dB) vector plots provided by the Active Magnetosphere and Planetary Electrodynamics Response Experiment (AMPERE) project [32,33]. As the eastward and westward dB vectors depict the EEJ and WEJ, respectively, we could observe the Harang region depicted (for example, in the dusk sector) by the clockwise rotation of EEJ to WEJ or anticlockwise rotation of WEJ to EEJ.
We inspected Super Dual Auroral Radar Network (SuperDARN) convection maps, which are intended for quick-look browsing only. SuperDARN convection maps depict the convection streamlines that are electrostatic equipotential contours determined from SuperDARN radar observations and from model predictions provided by the RG05 convection model [34,35,36]. As part of the SuperDARN convection map production workflow, the Heppner–Maynard (H–M) Boundary, which is an empirical boundary defined based on the underlying Interplanetary Magnetic Field (IMF) conditions [37], is marked. From the SuperDARN website, we selected (for each event) the relevant convection map. Since SuperDARN convection maps are not of publication quality, for each event, we constructed an MLT versus MLAT polar plot based on the relevant SuperDARN convection map in order to illustrate the underlying polar convection pattern depicted by the lowest equipotential contours of the dusk cell (in blue) and dawn cell (in red) along with the H–M Boundary (in dark green). The H–M Boundary marks the latitudinal extent of the polar convection [38] and is located near the equatorward oval boundary [39]. However, we also marked the SSUSI model-defined poleward auroral boundary (in red). In Figures S1–S5 (see Supplementary Materials), we show the MLT versus MLAT polar plots constructed, the SuperDARN convection maps used, and these two sets of plots and maps together in order to illustrate the validity of the polar maps constructed. As shown for each event (in Section 3), the polar map demonstrates that the Harang region was observed in the polar convection, where one convection cell wrapped around the other convection cell.
To observe the underlying interplanetary and geomagnetic conditions, we viewed the variations of the IMF BY (nT) and BZ (nT) components along with various indices, including the geomagnetic Kp index and the auroral AE (nT) and AL (nT) indices.
To observe magnetotail-reconnection-related particle injections, we used electron flux measurements provided by the Geostationary Operational Environmental Satellites (GOES) orbiting the Earth once a day at 6.6 RE. GOES-13 and GOES-15 traveled mostly in the nighttime MLT sector during the time periods of interest. The average electron flux values were measured at 40, 75, 150, 275, and 475 keV.
3. Results
3.1. The Harang Region’s Association with Substorms
Substorms are transient events that begin with a growth phase (lasting for 30–50 min) [40,41,42] as the IMF turns southward, thereby enhancing the two-cell polar convection and stretching the magnetotail because of the deposition of solar wind energy into the magnetosphere [43]. Substorms continue in the expansion phase, which is the most active substorm phase lasting for ~1.0–1.5 h [44], when the accumulated electromagnetic energy in the magnetotail is released in an explosive manner and is then channeled into the coupled M–I system. When the electromagnetic energy is released, the magnetic field reconfigures from stretched (or tail-like) to more bipolar (or dipole-like) formation during dipolarization [45]. As the magnetic field dipolarizes, energetic particles are injected Earthward from the magnetotail reconnection site in the mid-tail plasmasheet (X ≈ −18 RE) [46] to the near-Earth plasmasheet at X ≈ −10 RE, called the braking region. In the braking region (at X ≈ −10 RE), the Earthward plasma flows, also known as bursty bulk flows (BBFs) [47], are slowed down and diverted from midnight toward dusk and dawn. Due to the buildup of flow shear in the plasma and because of the consequently increased shear of the magnetic field, R1 and R2 FACs form and create the substorm current wedge 2 loop (SCW2L) system [48]. At the duskward (or westward) edge of the SCW, the azimuthally expanding BBFs are associated with localized upward FACs, which give rise to the development of the M–I conjugate auroral westward travelling surge (WTS) [49,50]. In the ionosphere, the WTS [51] develops at the duskward edge of the SCW and appears as a westward propagating wavelike surge [52]. Meanwhile, the strong dawn–dusk pressure gradient (associated with the R2 FACs) leads to the development of the M–I conjugate Harang phenomenon [20,21], where the substorm (i.e., expansion phase) onset tends to occur [53,54].
In Figure 2, we illustrate the interplanetary and geomagnetic conditions underlying the four events of interest. Figure 2 was constructed using the time series of IMF BY and BZ, Kp, AE, and AL, along with the line-plot series of electron fluxes measured at various keV channels by the GOES satellite. For each event, we marked the universal time (UT) of the Harang region observation (dot symbol in green; shaded interval in yellow) made by DMSP. In Table 2, we summarize the interplanetary and geomagnetic conditions underlying the four events of interest.
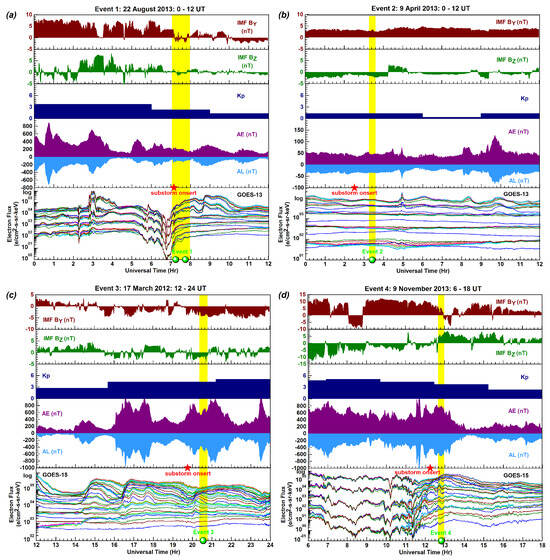
Figure 2.
The four sets of plots are constructed for the four events investigated and depict the underlying interplanetary and geomagnetic conditions during which the Harang scenario (marked as a dot symbol in green; shaded interval in yellow) occurred soon after a substorm onset (symbol star in red).
Table 2.
Events investigated and their underlying geophysical conditions.
In order to further illustrate the above-described Harang region–substorm association, we marked (in Figure 2) the substorm onset times (star symbols in red) mostly based on the listed substorm onset times and locations published by SuperMAG. Particularly, Figure 2a,d show that the GOES satellite was able to observe the dramatic decrease in electron flux, implying a stretched (or tail-like) magnetic field configuration, and the following sudden increase in electron flux, implying a dipole-like magnetic field configuration and marking the substorm onset occurring just before the Harang region was observed.
3.2. Dawnside Harang Region and Clockwise Rotation Observed in Event 1
Figure 2a was constructed for Event 1 (22 August 2013), when two dawnside scenarios occurred during 7–8 UT (marked as dot symbols in green; shaded interval in yellow). Under weak dawnward (BY < 0) and southward (BZ < 0) IMF conditions (BY ≈ −2 nT and 2 nT; BZ ≈ −1 nT), the underlying two-cell convection pattern appeared with a more elongated dusk cell that intruded dawnward and with a round-shaped dawn cell (as shown in Figure 3b and Figure 4b). Event 1 unfolded under mild geomagnetic (Kp = 2+) and weak substorm (AL ≈ −100 nT; AE ≈ 200 nT) conditions. Observed by GOES−13 during the postmidnight (1–2 MLT) hours, the two scenarios were preceded by strong particle depletions, implying a stretched magnetic field configuration, and by the following particle increases, implying a bipolar magnetic field configuration. These particle depletions and increases provide observational evidence of the dipolarization (i.e., magnetic field reconfiguration) unfolding just before the Harang region was observed by the DMSP satellites during 6–7 UT.
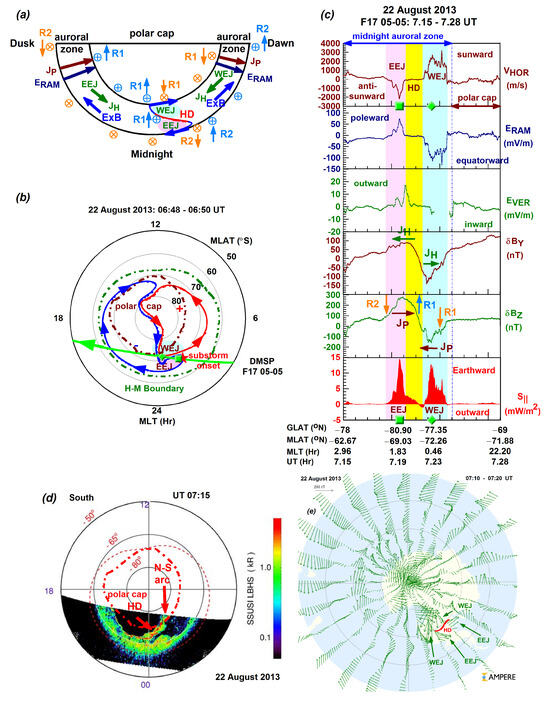
Figure 3.
(a) In the first scenario of Event 1, (b,c) DMSP F17 observed (near magnetic midnight) the Harang region characterized by both the electrojet/drift/E-field rotation in the clockwise direction and the discontinuity itself. (d) Then, the N–S auroral arc appeared and, by following the discontinuity, became E–W directed. (e) The electrojet rotated along the discontinuity.
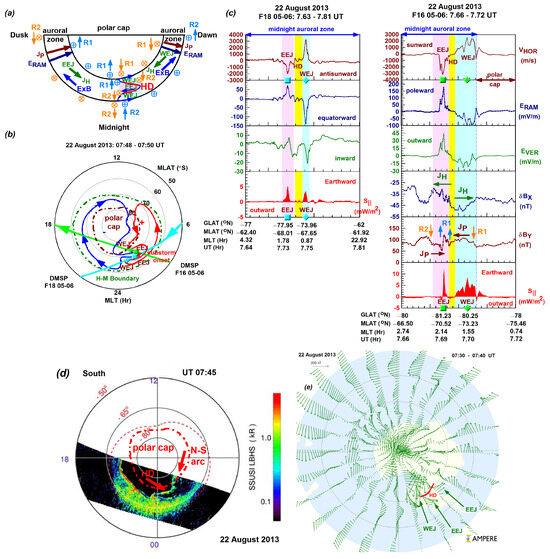
Figure 4.
(a) In the second scenario of Event 1, (b,c) two DMSP satellites (F16 and F18) observed (in the postmidnight MLT sector) the Harang region characterized by both the electrojet/drift/E-field rotation in the clockwise direction and the discontinuity. (d) Then, the N–S auroral arc was still present and, by following the discontinuity, became E–W directed. (e) The electrojet rotated along the discontinuity.
Figure 3 and Figure 4 are constructed for the two scenarios of Event 1 (22 August 2013). In Event 1, three DMSP satellites observed the Harang region in the southern postmidnight MLT sector.
Figure 3a shows a schematic diagram of the earlier observed (7:15 UT) first scenario. Within the equatorward half of the oval, the duskside EEJ intruded dawnward, where the plasma was flowing antisunward (marked by the arrow in blue). On the dawnside, the dominating WEJ (shaded in cyan) occupied the poleward half of the oval, where the plasma was flowing sunward (marked by the arrow in blue). Thus, the Harang region developed on the dawnside in the postmidnight MLT sector, where the discontinuity was directed E–W and located between the EEJ and WEJ.
Figure 3b illustrates the two-cell polar convection pattern operational at that time, along with the H–M boundary (marked in dark green) and polar cap boundary (marked in dark red). Then, the DMSP F17 pass (in green) crossed the auroral region from dawn to dusk. Here, we also plotted the location of substorm onset (star symbol in red). We also plotted the locations of EEJ (symbol square in green) and WEJ (symbol diamond in green). These show that the substorm onset, which we specified based on the AE and AL indices and GOES-13 data, occurred near the equatorward-located EEJ that was associated with the dawnward intruding dusk cell (marked in blue). Meanwhile, the poleward-located dominating WEJ was associated with the dawn cell (marked in red). Thus, as depicted by the schematic diagram in Figure 3a, the polar plot in Figure 3b shows that DMSP F17 observed the Harang region on the dawnside, where the dawn–dusk-directed discontinuity was located between the E–W-directed dusk and dawn cells. Since the F17 pass crossed the auroral zone in the dawn–dusk (or E–W) direction, it was able to observe not only the clockwise drift and E-field rotations, but also the dawn–dusk-directed discontinuity itself as well (as shown in Figure 3c).
Figure 3c shows a set of line plots constructed using the multi-instrument DMSP F17 data. These line plots are oriented in the poleward direction, similar to the schematic diagram shown in Figure 1b, allowing for direct comparisons. By progressing from top to bottom, we show the line plots of horizontal drift (VHOR), the E-field components in the ram (ERAM) and vertical (EVER) directions, the magnetic deflection components (δBY; δBZ), and Poynting flux (S||). We marked the midnight auroral zone and the polar cap region based on the electron spectrogram image from this F17 pass, which is shown in Figure S6 (see Supplementary Materials). As shown, F17 observed the Harang region within the midnight auroral zone. According to the VHOR line plot, F17 first observed the strong antisunward (−) flows (VHOR ≈ −2200 m/s) in the regime of EEJ (shaded interval in magenta) on the dawnside, where the plasma was flowing antisunward (toward midnight, as shown also in Figure 3a). Then, the discontinuity (HD; shaded interval in yellow), which is located where the zonal drift diminished (VHOR ≈ 0 m/s). Finally, the strong sunward flows (VHOR ≈ 2500 m/s), which are situated in the regime of WEJ (shaded interval in cyan). Next, the E-field line plots depict the poleward (ERAM ≈ 75 mV/m) and weaker outward (EVER≈18 mV/m) E-field components associated with the EEJ, the equally strong equatorward (−) E-field component (ERAM ≈ −100 mV/m) associated with the WEJ, and the discontinuity in both E-field components (ERAM ≈ 0 mV/m; EVER ≈ 0 mV/m). Then, the deflection components show the reversal of Hall currents (JH; from sunward in the EEJ to antisunward in the WEJ), along with the reversal of Pedersen currents (JP; from poleward in the EEJ to equatorward in the WEJ). These currents (JH and JP) peaked within the electrojets and changed directions within the discontinuity. In good agreement with the study of Kamide [8], these JH and JP observations demonstrate a current continuity within the discontinuity. Finally, the Poynting flux line plot depicts the locally increased Earthward-directed electromagnetic energy deposition from the magnetosphere to the ionosphere: S|| ≈ 14.5 mW/m2 within the EEJ and S|| ≈ 12.5 mW/m2 within the WEJ. Within the discontinuity, the Earthward energy deposition decreased from 2.5 mW/m2 to zero and continued in the outward (−) direction, reaching −1.0 mW/m2. These variables are summarized in Table 3.
Table 3.
Observed variables of the Harang region provided by DMSP F17 in the first scenario of Event 1.
Figure 3d shows the SSUSI imagery depicting the auroral oval’s southern part along with the north–south (N–S)-aligned auroral arc that became E–W-directed as the N–S arc followed Harang Reversal [22]. In good agreement with the findings of Nishimura et al. [22], the E–W-directed auroral arc is located in the Harang region, and the E–W-directed discontinuity was observed by DMSP F17.
Figure 3e shows the AMPERE dB vector map. Based on the study of Kleimenova et al. [55], we marked the WEJ and EEJ (as arrows in dark green) within the Harang region, as well as the discontinuity (as a line in red) between them. These illustrate the rotating WEJ to EEJ along the discontinuity.
Figure 4 was constructed in the same way as Figure 3 and shows the second scenario (at 7:45 UT) of Event 1 (on 22 August 2013), as observed by F16 and F18. As shown by the schematic diagram in Figure 4a, the dusk cell/EEJ intruded dawnward into the dawnside WEJ in such a way that the dawnward intruding EEJ (where the plasma was flowing toward midnight or antisunward) appeared between two WEJs (where the plasma was flowing sunward). According to the polar convection map in Figure 4b, DMSP F16 and F18 were traveling poleward and observed the EEJ (related to the dawnward-intruding dusk cell) first and then the WEJ (related to the dawn cell).
In Figure 4c, the two sets of line plots depict in the midnight auroral zone, which we specified from the respective spectrogram images of these F16 and F18 passes (see Figure S7 in Supplementary Materials), and the reversal of zonal drift from antisunward (in the regime of EEJ; VHOR: ~−2000 m/s and ~−3000 m/s) to sunward (in the regime of WEJ; VHOR: ~3200 m/s and ~2800 m/s). We also show the clockwise rotation of the E-field components: from poleward (in the regime of EEJ; ERAM: ~70 mV/m and ~180 mV/m) to equatorward (-) (in the regime of WEJ; ERAM: ~−150 mV/m and ~−100 mV/m) and from outward (in the regime of EEJ; EVER: ~8 mV/m and ~48 mV/m) to inward (-) (in the regime of WEJ; EVER: ~−20 mV/m and ~−25 mV/m). Both the F16 and the F18 observations show the discontinuity’s narrow region (shaded interval in yellow), where the zonal drift (VHOR) and meridional E-field (ERAM) became zero and where the Poynting flux became close to zero. In the Harang region, the Earthward energy deposition derived from the F18 data (S|| ≈ 5 mW/m2 within the EEJ and S|| ≈ 4 mW/m2 within the WEJ) was weaker compared to that derived from the F16 data (S|| ≈ 12 mW/m2 within the EEJ and S|| ≈ 9 mW/m2 within the WEJ). These observations provided by F16 and F18 are summarized in Table 4 and Table 5, respectively.
Table 4.
Observed variables of the Harang region in the second scenario of Event 1 provided by DMSP F16.
Table 5.
Observed variables of the Harang region in the second scenario of Event 1 provided by DMSP F18.
Finally, we show the deflection components only for the DMSP F16 observations. These depict the reversal of Hall currents (from sunward to antisunward) along with the reversal of Pedersen currents (from poleward to equatorward) and the continuation of these currents in the regime of the discontinuity. Figure 4d shows (using the SSUSI imagery) that the N–S-directed auroral arc was still there and was still following the discontinuity (i.e., it became E–W-directed). Thus, the discontinuity’s location is marked by the E–W aligned auroral arc where F16 and F18 made their observations. At the same dawnside location, the AMPERE dB vector map depicts the rotating WEJ to EEJ along the discontinuity, as marked in Figure 4e.
3.3. Duskside Harang Region and Anticlockwise Rotation Observed in Event 2
Returning to Figure 2b, the duskside scenario of Event 2 (9 April 2013) was observed under stronger duskward (BY > 0) and southward (BZ < 0) IMF conditions (BY ≈ 3.5 nT; BZ ≈ −2 nT) but quieter geomagnetic conditions (Kp = 1+; AL ≈ −35 nT and AE ≈ 50 nT) compared to Event 1, and almost one hour (in UT) after the substorm onset occurring near magnetic midnight specified by the substorm list of Forsyth et al. [56]. Since GOES-13 orbited in the dusk MLT sector, it did not record any particle injections. For the above-described IMF orientation, the two-cell convection pattern operational was characterized by a more elongated dawn cell that intruded duskward and by a less elongated dusk cell (as shown in Figure 5b).
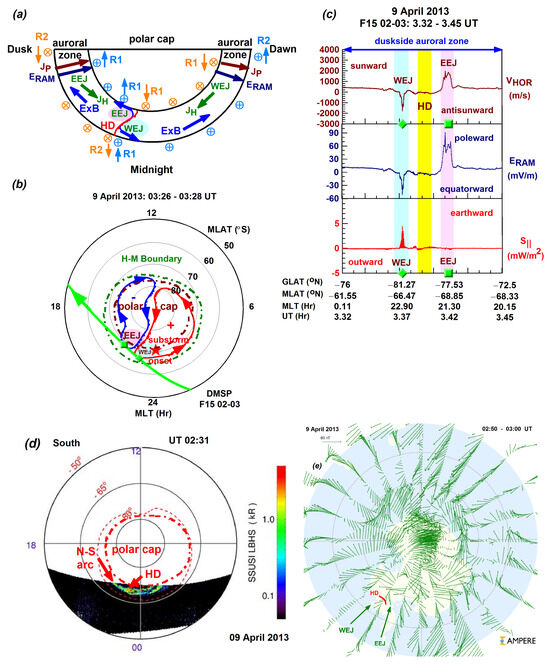
Figure 5.
(a) In Event 2, (b,c) the F15 satellite observed (in the evening MLT sector) the Harang region characterized by both the electrojet/drift/E-field rotation in the anticlockwise direction and the discontinuity. (d) Then, the N–S arc was still present and, by following the discontinuity, became E–W directed. (e) The electrojet rotated along the discontinuity.
Figure 5 depicts the duskside scenario of Event 2 (9 April 2013) occurring in the Southern Hemisphere. As shown in Figure 5a by the schematic diagram, the dawn cell intruded duskward, and therefore, the dawnside WEJ appeared near the oval’s equatorward edge, where the plasma was flowing back toward midnight or antisunward. Meanwhile, the duskside EEJ was located near the oval’s poleward edge, where the plasma was flowing sunward. Thus, in the Harang region, the dominating duskside EEJ became a WEJ via an anticlockwise rotation. In Figure 5b, the polar convection plot depicts the above-described two-cell convection pattern and the F15 pass. As the F15 satellite crossed the oval in the postmidnight–dusk direction, it first observed the duskward-intruding dawn cell (associated with the WEJ), where the substorm onset occurred (marked as star symbol in red), then the dusk cell (associated with the EEJ), and the discontinuity itself located between the two convection cells/electrojets where the duskward-intruding dawn cell wrapped around the dusk cell.
In Figure 5c, the line plots cover the duskside auroral zone. Because of the absence of F15 particle data, we specified the duskside auroral zone by inspecting the spectrogram images and plasma density line plots of other DMSP passes. At similar universal times, F16 crossed the auroral oval but in a different MLT sector and, therefore, did not observe the Harang region. However, F16 observed the auroral zone that was associated with locally increased plasma densities between two steep plasma density gradients. Based on similar observations made by F15, we specified the location of the midnight auroral zone. These DMSP F15 and F16 survey plots are shown in Figure S8 (see Supplementary Materials). This is where the Harang region was observed. According to data availability, we show only the line plots of zonal drift and meridional E-field driving the zonal drift. DMSP F15 observed the equatorward movement located antisunward (−) flows (VHOR ≈ −1800 m/s) in the regime of WEJ (shaded interval in cyan) as the dawn-cell-related plasma was drifting toward midnight and the poleward located sunward flows (VHOR ≈ 1800 m/s) in the regime of EEJ (shaded interval in magenta). Their respective underlying equatorward (−) (ERAM ≈ −50 mV/m) and poleward (ERAM ≈ 60 mV/m) E-fields depict an anticlockwise rotation. Meanwhile, the discontinuity itself appears clearly both in the zonal drift and in the meridional E-field: both became zero. Earthward energy deposition (S|| ≈ 4.5 mW/m2) occurred only within the regime of WEJ, as the Poynting flux decreased to zero elsewhere (see summary in Table 6).
Table 6.
Observed variables of the Harang region in Event 2 provided by DMSP F15.
In Figure 5d, the SSUSI imagery depicts a short section of the N–S auroral arc that became E–W-directed on the duskside by following the Harang Reversal [22]. In this MLT sector, the AMPERE dB vector map (in Figure 5e) shows the electrojet reversal along the discontinuity, where the EEJ rotated and became a WEJ.
3.4. Duskside Harang Region and Clockwise Rotation Observed in Event 3
Returning to Figure 2c, the line plots show that Event 3 (17 March 2012) occurred under strong dawnward (BY < 0) and southward (BZ < 0) IMF conditions (BY ≈ −4 nT; BZ ≈ −2 nT) and increasing geomagnetic activity (Kp = 4+) unfolding during an intense substorm (AL ≈ −500 nT and AE ≈ 700 nT). As GOES-15 traveled in the morning MLT sector, it observed only the dispersed particle injections that mark the substorm onset, which unfolded in the midnight MLT sector, less than one hour (in UT) before the Harang region was observed by DMSP F15. Uncharacteristic in relation to the above-described IMF orientation but typical in terms of the WTS, the two-cell convection pattern was highly asymmetric (as shown in Figure 6b).
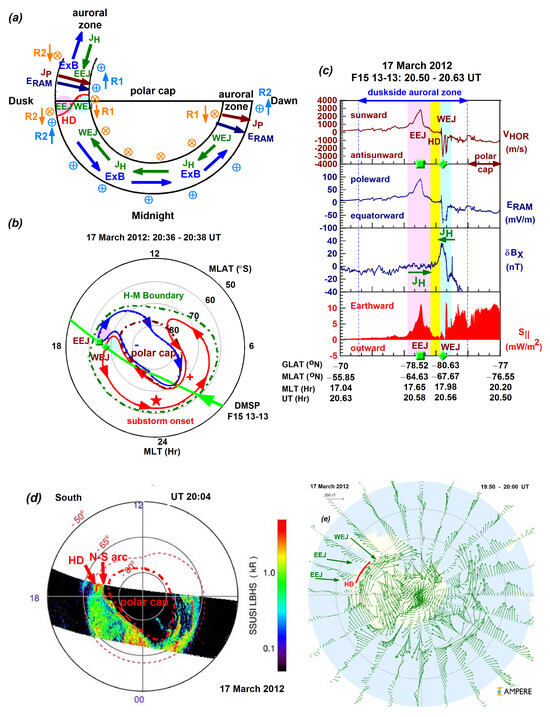
Figure 6.
(a) In Event 3, (b,c) the F17 satellite observed in the 18 MLT sector, at the duskward edge of the westward substorm surge, the Harang region characterized by both the electrojet/drift/E-field rotation in the clockwise direction and the discontinuity. Then, (d) the N–S auroral arc became E–W directed by following the discontinuity. (e) The electrojet rotated along the discontinuity.
Figure 6 illustrates Event 3 (17 March 2012) observed by DMSP F15 in the Southern Hemisphere. In Figure 6a, the schematic diagram shows (at ~18 MLT) the duskside EEJ within the oval’s equatorward half, the duskward-intruding WEJ within the oval’s poleward half, and the discontinuity between the two electrojets. Through a clockwise rotation, the EEJ/poleward E-field became a WEJ/equatorward E-field. Further illustration is provided by the polar convection map in Figure 6b.
Figure 6b shows the two-cell polar convection that displayed a highly asymmetric pattern with a significantly stronger dawn cell than dusk cell, where the dawn cell intruded into the dusk sector, up to 18 MLT. At 18 MLT, the duskward-intruding dawn cell occupied the oval’s poleward half while the dusk cell occupied the oval’s equatorward half. Such an asymmetric convection pattern is unrelated to the IMF BY component but is consistent with WEJ enhancement during a substorm [57], and it is produced by the westward substorm surge (i.e., WTS) reaching 18 MLT [58]. In this scenario, the substorm onset (star symbol in red) was located near magnetic midnight according to the substorm list of Ohtani and Gjerloev [59]. This is where the formation of the auroral bulge started and continued during the expansion phase by expanding both westward and eastward [60]. As the bulge traveled mainly westward (as a wavelike surge) under the BY < 0 conditions in the southern oval, the WTS formed mainly on the duskside and reached 18 MLT.
Because of the dawn–dusk alignment of the F15 pass, the line plots in Figure 6c cover the duskside auroral zone and a small section of the polar cap. Again, in the absence of F15 particle data, we specified the duskside auroral zone based on the F18 pass, also depicting the Harang region that we cannot present here because of the poor-quality data; however, we can show these in Figure S9 (see Supplementary Materials). Constructed using the good-quality F15 data, the line plots depict the strong sunward drift (VHOR ≈ 3000 m/s) and underlying poleward E-field (ERAM ≈ 90 mV/m) in the regime of EEJ, where the Hall currents were antisunward-directed, and also the strong antisunward (−) drift (VHOR ≈ −3000 m/s) and underlying equatorward (−) E-field (ERAM ≈ −70 mV/m) in the regime of WEJ, where the Hall currents were sunward-directed. Both the clockwise rotating meridional E-field and the discontinuity itself were observed by DMSP F15. Earthward energy deposition reached ~11.5 mW/m2 within the auroral electrojets and was minimized at ~1 mW/m2 within the discontinuity. These observations provided by F15 are summarized in Table 7.
Table 7.
Observed variables of the Harang region in Event 3 provided by DMSP F15.
In Figure 6d, the SSUSI imagery shows the auroral bulge along with the N–S auroral arc that became E–W-directed where the discontinuity was located, as the N–S auroral arc followed the Harang Reversal [22]. In Figure 6e, the AMPERE dB vector map clearly shows the signatures of strong electrojet reversal and discontinuity in the dusk sector.
3.5. Duskside Harang Region and Clockwise Rotation Observed in Event 4
Returning to Figure 2d, Event 4 occurred under duskward IMF orientation (BY ≈ 5 nT) and at the end of a long-lasting southward IMF alignment (BZ < 0), when the IMF turned northward (max BZ ≈ 9 nT) during an intense substorm (AL ≈ −650 nT and AE ≈ 800 nT) that started at 12:17 UT (marked as star symbol in red) near magnetic midnight and also when the declining geomagnetic activity was still intense (Kp = 4-). As GOES-15 traveled in the postmidnight (3 MLT) sector, it observed only weak dispersionless particle injections in Event 4. However, GOES-15 observed the intense particle injections related to the previous substorm (AL ≈ −1000 nT) unfolding in the dawn (3 MLT) sector.
Figure 7 shows the duskside scenario of Event 4 (9 November 2013) observed by DMSP F17 in the Northern Hemisphere. The schematic diagram in Figure 7a (like in Figure 6a) depicts the intrusion of the dawn cell into the dusk cell at ~18 MLT, as well as a scenario where the EEJ appeared equatorward of the WEJ. Along the discontinuity, the EEJ rotated clockwise and became a WEJ.
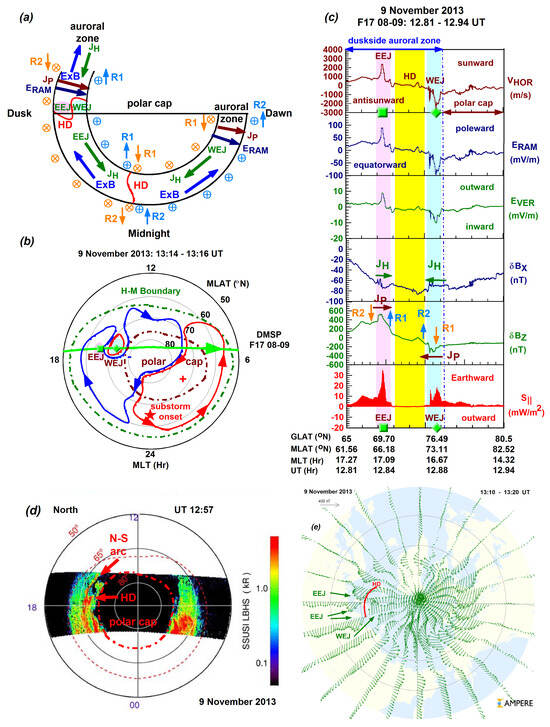
Figure 7.
(a) In Event 4, (b,c) the F17 satellite observed (in the 18 MLT sector) the Harang region characterized by both the electrojet/drift/E-field rotation in the clockwise direction and the discontinuity. Then, (d) the N–S auroral arc became E–W directed by following the discontinuity. (e) The electrojet rotated along the discontinuity.
As the polar map shows in Figure 7b, the underlying polar convection was characterized by a two-cell pattern where the substorm onset occurred near magnetic midnight (star symbol in red) according to the substorm list of Forsyth et al. [56]. Across the magnetic midnight meridian, the dawn cell intruded duskward, and possibly a Harang region formed that was not observed by DMSP. Furthermore, a localized dawn cell (at ~18 MLT) also developed because of the northward-turning IMF. Under these IMF BY > 0 and BZ > 0 conditions, the plasma was unable to convect normally in the duskside auroral sunward return flow region because the closed plasmasheet flux was protruding from the equatorial plane in the tail region [61]. At 18 MLT, the dominating EEJ appeared at lower latitudes, and the intruding WEJ appeared at higher latitudes in the Harang region, as was observed by DMSP F17 and is shown in Figure 7c.
In Figure 7c, the DMSP F17 line plots cover the duskside auroral zone, which we specified based on the spectrogram image of this F17 pass shown in Figure S10 (see Supplementary Materials), and a small section of the polar cap at ~18 MLT. These line plots depict the clockwise rotation of zonal drift (from sunward to antisunward), E-field components (from poleward/outward to equatorward/inward), and the discontinuity itself. These line plots show the sunward drift (VHOR ≈ 2600 m/s) and underlying poleward and outward E-fields (ERAM ≈ 90 mV/m; EVER ≈ 10 mV/m) in the regime of EEJ. Moreover, they show the antisunward (−) drift (VHOR ≈ −2500 m/s) and underlying equatorward (−) and inward (−) E-fields (ERAM ≈ −100 mV/m; EVER ≈ −10 mV/m) in the regime of WEJ. Earthward energy deposition was significantly stronger (S|| ≈ 33 mW/m2) in the regime of EEJ compared to the weaker (S|| ≈ 19 mW/m2) Earthward energy deposition in the regime of WEJ. Between the reversals and localized Earthward energy depositions, the discontinuity itself becomes apparent and is best illustrated by the line plots of vertical drift and Poynting flux, both of which reach zero and remain close to zero. These observations provided by F17 are summarized in Table 8. Meanwhile, the deflection components depict the reversal of Hall currents (from antisunward to sunward) and Pedersen currents (from sunward to antisunward) within the discontinuity. Thus, these current reversals demonstrate current continuity within the discontinuity.
Table 8.
Observed variables of the Harang region in Event 4 provided by DMSP F17.
In Figure 7d, the SSUSI imagery shows that the N–S auroral arc in this scenario (BY > 0 and BZ > 0) developed in the duskside oval at ~18 MLT. This was due to both the closed plasmasheet flux extruding from the equatorial plane in the tail region and the resultant buildup of closed flux preventing normal motion following the auroral sunward return flows [61]. The SSUSI imagery also shows the turning of the N–S arc into the E–W direction (in the Harang region) by following the discontinuity [22]. Since the DMSP F17 pass was dawn–dusk (E–W)-directed, the F17 spacecraft was able to observe the reversal of zonal drift and E-field components as well as the discontinuity itself.
4. Discussion
Importantly, our observational results demonstrate that one of the significant features of the Harang region is the discontinuity itself. Although the discontinuity itself was reported by early studies, it was not recognized by some of the previous studies, which preferred to use the term “Harang Reversal” (see details in Section 1). One possible reason is the rarity of the discontinuity’s detection. For example, in this study, we surveyed two years of data plots, covering the calendar years 2012 and 2013, and found only a few observations that depicted both the drift reversal and the discontinuity between the reversing sunward and antisunward drift components. Presented in our four events, these observations are from those DMSP satellites that traveled along the discontinuity and were therefore able to observe the discontinuity itself, along with the zonal drift rotation in the Harang region. In Event 1, three DMSP satellites were positioned to observe the Harang region soon after the substorm onset. Then, the Harang region had the highest occurrence frequency.
These observations provide direct evidence that within the Harang region observed, there was an actual discontinuity in terms of plasma convection, E-field vectors, and electromagnetic energy deposition. Within the convection discontinuity, developed between the reversing zonal E×B drift, the zonal E×B drift decreased to zero. Similarly, within the E-field discontinuity, developed between the reversing E-field components, the meridional and radial E-fields diminished. As a limitation of this study, due to the poor-quality azimuthal (or zonal) E-field data obtained, our scenarios do not demonstrate the localized increase in westward E-field within the discontinuity, as first described by Kamide [8] and shown in Figure 1b. Furthermore, the Earthward electromagnetic energy deposition (i.e., Poynting flux) is locally maximized within the reversing electrojet/E×B drift/E-fields and locally minimized or diminished within the discontinuity. Thus, a Poynting flux discontinuity occurred, where the Earthward electromagnetic energy deposition was minimized or ceased. Finally, in good agreement with the early study of Kamide [8], there was a current continuity within the discontinuity, where the Hall and Pedersen currents reversed.
To our investigation, the study of Nishimura et al. [22] is particularly relevant, as the Harang region’s evolution is related to the onset of the substorm expansion phase. Based on a large-scale statistical study involving 249 auroral onset events, Nishimura et al. [22] reported a repeatable sequence of events leading to substorm onset (i.e., the onset of the expansion phase) based on M–I conjugate observations from magnetosphere satellite data and ground-based ASI imageries. These events include (i) auroral PBIs and (ii) PBI evolution into N–S auroral arcs, called auroral streamers, which (iii) become E–W-directed auroral arcs by tracking (i.e., following) the Harang reversal. Nishimura et al. [22] called the N–S auroral arcs Harang streamers or Harang aurorae. It was also highlighted by the authors that some of the N–S auroral arcs follow the dawn convection cell and, thus, generally lead to substorm onsets located in the midnight and postmidnight MLT sectors.
Our Harang scenarios occurred during a sequence of events, as defined by Nishimura et al. [22], that led to the onset of the substorm expansion phase, particularly when the N–S auroral arcs following the dawn convection cell were still present and the E–W auroral arcs had already developed (as shown by the DMSP SSUSI images in Figure 3d and Figure 4d). These imply that the Harang regions observed by DMSP were newly formed.
We also investigated the respective underlying polar convection patterns when the various DMSP satellites observed the Harang region in different MLT sectors. It is well-known that the dawn–dusk asymmetry in the polar convection is caused by the IMF BY component and is associated with the Harang region’s formation. Dawn–dusk asymmetry occurs under non–substorm conditions (i.e., without any substorm expansion) when the magnetospheric convection is steady [62] and also under substorm conditions when the asymmetry develops during the growth phase and is maintained during the expansion phase [63]. Based on 1376 non-substorm [62] and 1979 northern substorm [63] events, these experimental studies also show that convection asymmetry is associated with the Harang region-related convection structure. These studies [62,63] specified the Harang region in a wider nighttime MLT sector, where (i.e., across the magnetic midnight meridian) the dusk convection cell extends and intrudes into the dawnside or the dawn convection cell extends and intrudes into the duskside. However, the Harang region-related convection structure is not always clear and well-defined. As explained by Grocott et al. [63] and shown by our Event 1 scenarios (in Figure 3b and Figure 4b, where the substorm onset is located near the Harang region), the electrodynamics of the unfolding substorm introduce their own dawn–dusk asymmetry that is independent of the pre-existing asymmetry and becomes imposed on the pre-existing asymmetry (created by the IMF BY component). Furthermore, in a recent study by Svaldi et al. [57], the authors investigated 64 substorm events and specified the Harang region in various MLT sectors. These include the dusk sector, where the dusk cell became extended (but did not intrude into the dawnside), and the dawn cell became significantly extended deep into the duskside, as seen in our Event 3 (Figure 6b). As the authors explained, the dawn cell’s extension deep into the dusk sector is a characteristic feature of unusual or unique substorms, which are largely different from typical substorms [57]. As our Event 3 demonstrates, the dawn cell’s extension deep into the dusk sector was due to the westward substorm surge (i.e., WTS) reaching 18 MLT.
According to modeling studies, the Harang region develops due to the dawn-dusk pressure asymmetry in the near-Earth plasmasheet [11], which is particularly associated with the R2 FACs [25]. However, the modeling study of Gkioulidou et al. [25] also shows that the reversing E-field’s lower-latitude component in the Harang region contributes to the intensification of subauroral zonal E×B drift and, therefore, to the enhancement of subauroral flows known as Subauroral Polarization Streams (SAPS) [64] and Subauroral Ion Drifts (SAIDs) [65,66,67]. Furthermore, recent studies by Zou et al. [20,21] report that the Harang region develops in concert with SAPS flows via their common association with R2 FACs. Moreover, according to the more recent study of Svaldi et al. [57], SAID flows become amplified in the Harang region (because of the intensified subauroral zonal E×B drift), and in such scenarios, the Harang region is present for a longer time (compared to those scenarios when the SAID flows are not extreme). In future studies, we plan to investigate the amplified SAPS and SAID flows near the Harang region based on M–I conjugate observations.
5. Conclusions
In this study, we investigated the ionospheric component of the M–I conjugate Harang phenomenon under substorm conditions, focusing on both the reversal and the discontinuity that developed between the reversing vectors. By utilizing good-quality multi-instrument DMSP data (with Level 2 accuracy) and various imageries, we used a diverse database. These include the DMSP observables and the computed values of E-field components, which are used to quantify and observe E-field rotations, and of Poynting flux quantitatively determining the electromagnetic energy transfer in the coupled M–I system. Unfolding in four events (Events 1–4), we illustrated five scenarios that demonstrate clockwise rotations (in four scenarios) and anticlockwise rotations (in one scenario), along with the discontinuity that develops between the rotating components. These observations are summarized in Table 3, Table 4, Table 5, Table 6, Table 7 and Table 8.
We obtained the following new results and findings for the newly formed Harang region investigated:
- (1)
- It develops between the dusk and dawn cells, where one cell wraps around the other.
- (2)
- It depicts the reversals of zonal drift and underlying E-field components.
- (3)
- It depicts the discontinuity itself between the reversing drift/E-field components, where the N–S auroral arc rotated (i.e., just poleward of the substorm onset latitude) and became E–W-directed by following the discontinuity.
- (4)
- It accommodates Earthward electromagnetic energy deposition according to the following:
- Local maximization within the regimes of auroral electrojets (since the accumulated magnetic energy is released into the coupled M–I system during the expansion phase [43]);
- Local minimization or absence within the regime of discontinuity.
Here, we note that these new findings (1–4) are significant, as they contribute to a better understanding of the various features of the Harang region, along with the underlying electromagnetic energy deposition estimated using the Poynting flux.
According to our knowledge, this study is the first to investigate electromagnetic energy deposition (approximated by using the Poynting flux) in the Harang region. Understanding the pattern of Earthward Poynting flux deposition is vital since Earthward electromagnetic energy deposition adversely impacts the thermosphere and causes thermospheric drag on spacecraft, leading to difficulties in both tracking and orbit determination/prediction [68].
Supplementary Materials
The following supporting information can be downloaded at https://www.mdpi.com/article/10.3390/atmos16050595/s1, For each event investigated, this supporting information provides the SuperDARN polar convection maps along with the MLT versus MLAT polar plots constructed (shown in Figures S1–S5) and the DMSP survey plots (shown in Figures S6–S10).
Author Contributions
Conceptualization, I.H.; methodology, I.H.; software, I.H. and B.C.L.; validation, I.H. and B.C.L.; formal analysis, I.H.; investigation, I.H.; resources, B.C.L.; data curation, I.H.; writing—original draft preparation, I.H.; writing—review and editing, B.C.L. and I.H.; visualization, I.H.; supervision, B.C.L.; project administration, B.C.L.; funding acquisition, B.C.L. All authors have read and agreed to the published version of the manuscript.
Funding
This research was funded by the United States Office of Naval Research, grant number N62909-23-1-2057.
Institutional Review Board Statement
Not applicable.
Informed Consent Statement
Not applicable.
Data Availability Statement
The DMSP dataset can be accessed online at http://cedar.openmadrigal.org (accessed on 30 January 2025). The SSUSI auroral images can be accessed online at https://ssusi.jhuapl.edu/gal_AUR (accessed on 2 February 2025). The SuperDARN convection maps can be accessed online at https://superdarn.ca/convection-maps (accessed on 9 February 2025). The AMPERE vector maps can be accessed online at https://ampere.jhuapl.edu/browse/ (accessed on 3 January 2025). The GOES datasets can be accessed online at https://cdaweb.gsfc.nasa.gov/cdaweb/istp_public/ (accessed on 19 February 2025). The IMF data AE and AL indices can be accessed online from the OMNI database at https://cdaweb.gsfc.nasa.gov/cdaweb/istp_public/ (accessed on 13 February 2025). The SuperMAG substorm list can be accessed online at https://supermag.jhuapl.edu/mag/?fidelity=low&tab=stationinfo&start=2001-01-01T00%3A00%3A00.000Z&interval=23%3A59 (accessed on 3 January 2025).
Acknowledgments
We gratefully acknowledge that this material is based upon research supported by the United States Office of Naval Research under award number N62909-23-1-2057. We also acknowledge the CEDAR Archival Madrigal Database for the DMSP data. The DMSP particle detectors were designed by Dave Hardy of the Air Force Research Laboratory (AFRL). We also acknowledge the SSUSI images and the GOES data. We gratefully acknowledge the use of SuperDARN convection maps. SuperDARN is a collection of radars funded by national scientific funding agencies of Australia, Canada, China, France, Italy, Japan, Norway, South Africa, the United Kingdom, and the United States of America. We thank the AMPERE team and the AMPERE Science Data Center for providing data products derived from the Iridium Communications constellation, enabled by support from the National Science Foundation. We also thank SuperMAG for providing the substorm lists.
Conflicts of Interest
The authors declare no conflicts of interest.
Abbreviations
The following abbreviations are used in this manuscript:
| AMPERE | Active Magnetosphere and Planetary Electrodynamics Response Experiment |
| ASI | All-sky imager |
| DMSP | Defense Meteorological Satellite Program |
| EEJ | Eastward electrojet |
| E-field | Electric field |
| ERAM | Along-the-track ram electric field |
| EVER | Cross-track vertical or radial electric field |
| E–W | East–west |
| FACs | Field-aligned currents |
| GOESs | Geostationary Operational Environmental Satellites |
| HD | Harang Discontinuity |
| H–M | Heppner–Maynard |
| JH | Hall currents |
| JP | Pedersen currents |
| M–I | Magnetosphere–Ionosphere |
| MLT | Magnetic local time |
| N–S | North–south |
| R1 | Region 1 |
| R2 | Region 2 |
| S|| | Poynting flux |
| SAID | Subauroral ion drifts |
| SAPS | Subauroral polarization streams |
| SSUSI | Special Sensor Ultraviolet Spectrographic Imager |
| SuperDARN | Super Dual Auroral Radar Network |
| VHOR | Cross-track horizontal drift velocity |
| WEJ | Westward electrojet |
References
- Heppner, J.P. The Harang discontinuity in auroral belt; Ionospheric currents. Geofys. Publ. 1972, 29, 105–120. [Google Scholar]
- Maynard, N.C. Electric field measurements across the Harang discontinuity. J. Geophys. Res. 1974, 79, 4620–4631. [Google Scholar] [CrossRef]
- Harang, L. The mean field of disturbance of polar geomagnetic storms. Terr. Magn. Atmos. Electr. 1946, 51, 353–380. [Google Scholar] [CrossRef]
- Rodger, A.S.; Cowley, S.W.H.; Brown, M.J.; Pinnock, M.; Simmons, D.A. Dawn-dusk (y) component of the interplanetary magnetic field and the local time of the Harang discontinuity. Planet. Space Sci. 1984, 32, 1021–1027. [Google Scholar] [CrossRef]
- Kauristie, K.; Syrjäsuo, M.; Amm, O.; Viljanen, A.; Pulkkinen, T.; Opgenoorth, H. A statistical study of evening sector arcs and electrojets. Adv. Space Res. 2001, 28, 1605–1610. [Google Scholar] [CrossRef]
- Dungey, J.W. Interplanetary magnetic field and the auroral zones. Phys. Rev. Lett. 1961, 6, 47–48. [Google Scholar] [CrossRef]
- Heppner, J.P. Empirical models of high-latitude electric fields. J. Geophys. Res. 1977, 82, 1115–1125. [Google Scholar] [CrossRef]
- Kamide, Y. On current continuity at the Harang discontinuity. Planet. Space Sci. 1978, 26, 237–244. [Google Scholar] [CrossRef]
- Madsen, M.M.; Iversen, I.B.; D’Angelo, N. Measurements of high-latitude ionospheric electric fields by means of balloon-borne sensors. J. Geophys. Res. 1976, 81, 3821–3824. [Google Scholar] [CrossRef]
- Koskinen, H.E.J.; Pulkkinen, T.I. Midnight velocity shear zone and the concept of Harang discontinuity. J. Geophys. Res. 1995, 100, 9539–9547. [Google Scholar] [CrossRef]
- Erickson, G.M.; Spiro, R.W.; Wolf, R.A. The physics of the Harang discontinuity. J. Geophys. Res. 1991, 96, 1633–1645. [Google Scholar] [CrossRef]
- Lezniak, T.; Winckler, J. Experimental study of magnetospheric motions and the acceleration of energetic electrons during substorms. J. Geophys. Res. 1970, 75, 7075–7098. [Google Scholar] [CrossRef]
- Akasofu, S.I. Auroral Substorms: Search for Processes Causing the Expansion Phase in Terms of the Electric Current Approach. Space Sci. Rev. 2017, 212, 341–381. [Google Scholar] [CrossRef]
- Lyons, L.R.; Zesta, E.; Samson, J.C.; Reeves, G.D. Auroral disturbances during the January 10, 1997 magnetic storm. Geophys. Res. Lett. 2000, 27, 3237–3240. [Google Scholar] [CrossRef]
- Lyons, L.R.; Nagai, T.; Blanchard, G.T.; Samson, J.C.; Yamamoto, T.; Mukai, T.; Nishida, A.; Kokubun, S. Association between Geotail plasma flows and auroral poleward boundary intensifications observed by CANOPUS photometers. J. Geophys. Res. 1999, 104, 4485–4500. [Google Scholar] [CrossRef]
- Sergeev, V.A.; Sauvaud, J.-A.; Popescu, D.; Kovrazhkin, R.A.; Liou, K.; Newell, P.T.; Brittnacher, M.; Parks, G.; Nakamura, R.; Mukai, T.; et al. Multiple-spacecraft observation of a narrow transient plasma jet in the Earth’s plasma sheet. Geophys. Res. Lett. 2000, 27, 851–854. [Google Scholar] [CrossRef]
- Nakamura, R.; Baumjohann, W.; Schödel, R.; Brittnacher, M.; Sergeev, V.A.; Kubyshkina, M.; Mukai, T.; Liou, K. Earthward flow bursts, auroral streamers, and small expansions. J. Geophys. Res. 2001, 106, 10791–10802. [Google Scholar] [CrossRef]
- Zesta, E.; Lyons, L.; Wang, C.-P.; Donovan, E.; Frey, H.; Nagai, T. Auroral poleward boundary intensifications (PBIS): Their two-dimensional structure and associated dynamics in the plasma sheet. J. Geophys. Res. 2006, 111, A05201. [Google Scholar] [CrossRef]
- Weygand, J.M.; McPherron, R.L.; Frey, H.; Amm, O.; Kauristie, K.; Viljanen, A.T.; Koistinen, A. Relation of substorm onset to Harang discontinuity. J. Geophys. Res. 2008, 113, A04213. [Google Scholar] [CrossRef]
- Zou, S.; Lyons, L.R.; Nicolls, M.J.; Heinselman, C.J.; Mende, S.B. Nightside ionospheric electrodynamics associated with substorms: PFISR and THEMIS ASI observations. J. Geophys. Res. Space Phys. 2009, 114, A12301. [Google Scholar] [CrossRef]
- Zou, S.; Lyons, L.R.; Wang, C.-P.; Boudouridis, A.; Ruohoniemi, J.M.; Anderson, P.C.; Dyson, P.L.; Devlin, J.C. On the coupling between the Harang reversal evolution and substorm dynamics: A synthesis of SuperDARN, DMSP, and IMAGE observations. J. Geophys. Res. 2009, 114, A01205. [Google Scholar] [CrossRef]
- Nishimura, Y.; Lyons, L.; Zou, S.; Angelopoulos, V.; Mende, S. Substorm triggering by new plasma intrusion: THEMIS all-sky imager observations. J. Geophys. Res. 2010, 115, A07222. [Google Scholar] [CrossRef]
- Horvath, I.; Lovell, B.C. Magnetosphere–Ionosphere Conjugate Harang Discontinuity and Sub-Auroral Polarization Streams (SAPS) Phenomena Observed by Multipoint Satellites. Atmosphere 2024, 15, 1462. [Google Scholar] [CrossRef]
- Lyons, L.R.; Lee, D.-Y.; Wang, C.-P.; Mende, S.B. Relation of substorm disturbances triggered by abrupt solar-wind changes to physics of plasma sheet transport. In International Conference on Substorms-8; Syrjasuo, M., Donovan, E., Eds.; Institute for Space Research, University of Calgary: Calgary, AB, Canada, 2006; p. 165. [Google Scholar]
- Gkioulidou, M.; Wang, C.-P.; Lyons, L.R.; Wolf, R.A. Formation of the Harang reversal and its dependence on plasma sheet conditions: Rice convection model simulations. J. Geophys. Res. 2009, 114, A07204. [Google Scholar] [CrossRef]
- Rich, F.J.; Hairston, M. Large-scale convection patterns observed by DMSP. J. Geophys. Res. 1994, 99, 3827–3844. [Google Scholar] [CrossRef]
- Kilcommons, L.M.; Knipp, D.J.; Hairston, M.; Coley, W.R. DMSP Poynting flux: Data processing and inter-spacecraft comparisons. J. Geophys. Res. Space Phys. 2022, 127, e2022JA030299. [Google Scholar] [CrossRef] [PubMed]
- Huang, C.Y.; Burke, W.J. Transient sheets of field-aligned current observed by DMSP during the main phase of a magnetic superstorm. J. Geophys. Res. 2004, 109, A06303. [Google Scholar] [CrossRef]
- Huang, C.Y.; Su, Y.; Sutton, E.K.; Weimer, D.R.; Davidson, R.L. Energy coupling during the August 2011 magnetic storm. J. Geophys. Res. Space Phys. 2014, 119, 1219–1232. [Google Scholar] [CrossRef]
- Paxton, L.J.; Meng, C.I.; Fountain, G.H.; Ogorzalek, B.S.; Darlington, E.H.; Goldsten, J.; Kusnierkiewicz, D.Y.; Lee, S.C.; Linstrom, L.A.; Maynard, J.J.; et al. Special Sensor UV Spectrographic Imager (SSUSI): An instrument description. In Instrumentation for Planetary and Terrestrial Atmospheric Remote Sensing; SPIE: Bellingham, WA, USA, 1992; Volume 1745, pp. 2–16. [Google Scholar] [CrossRef]
- Paxton, L.J.; Morrison, D.; Zhang, Y.; Kil, H.; Wolven, B.; Ogorzalek, B.S.; Humm, D.C.; Meng, C.-I. Validation of remote sensing products produced by the Special Sensor Ultraviolet Scanning Imager (SSUSI): A far UV-imaging spectrograph on DMSP F-16. In Optical Spectroscopic Techniques, Remote Sensing, and Instrumentation for Atmospheric and Space Research IV; SPIE: Bellingham, WA, USA, 2002; Volume 4485. [Google Scholar] [CrossRef]
- Anderson, B.J.; Korth, H.; Waters, C.L.; Green, D.L.; Merkin, V.G.; Barnes, R.J.; Dyrud, L.P. Development of large-scale birkeland currents determined from the active magnetosphere and planetary electrodynamics response experiment. Geophys. Res. Lett. 2014, 41, 3017–3025. [Google Scholar] [CrossRef]
- Anderson, B.J.; Olson, C.N.; Korth, H.; Barnes, R.J.; Waters, C.L.; Vines, S.K. Temporal and spatial development of global Birkeland currents. J. Geophys. Res. Space Phys. 2018, 123, 4785–4808. [Google Scholar] [CrossRef]
- Ruohoniemi, J.M.; Greenwald, R.A. Dependencies of high-latitude plasma convection: Consideration of interplanetary magnetic field, seasonal, and universal time factors in statistical patterns. J. Geophys. Res. 2005, 110, A09204. [Google Scholar] [CrossRef]
- Greenwald, R.A.; Bristow, W.A.; Sofko, G.J.; Senior, C.; Cerisier, J.C.; Szabo, A. Super dual auroral radar network radar imaging of dayside high-latitude convection under northward interplanetary magnetic field: Toward resolving the distorted two-cell versus multicell controversy. J. Geophys. Res. 1995, 100, 19661–19674. [Google Scholar] [CrossRef]
- Nishitani, N.; Ruohoniemi, J.M.; Lester, M.; Baker, J.B.H.; Koustov, A.V.; Shepherd, S.G.; Chisham, G.; Hori, T.; Thomas, E.G.; Makarevich, R.A.; et al. Review of the accomplishments of mid-latitude Super Dual Auroral Radar Network (SuperDARN) HF radars. Prog. Earth Planet. Sci. 2019, 6, 27. [Google Scholar] [CrossRef]
- Heppner, J.P.; Maynard, N.C. Empirical high-latitude electric field models. J. Geophys. Res. 1987, 92, 4467–4489. [Google Scholar] [CrossRef]
- Walach, M.-T.; Grocott, A.; Thomas, E.G.; Staples, F. Dusk-Dawn Asymmetries in SuperDARN Convection Maps. J. Geophys. Res. Space Phys. 2022, 127, e2022JA030906. [Google Scholar] [CrossRef]
- Imber, S.M.; Milan, S.E.; Lester, M. The Heppner-Maynard Boundary measured by SuperDARN as a proxy for the latitude of the auroral oval. J. Geophys. Res. Space Phys. 2013, 118, 685–697. [Google Scholar] [CrossRef]
- Sergeev, V.A.; Angelopoulos, V.; Kubyshkina, M.; Donovan, E.; Zhou, X.-Z.; Runov, A.; Singer, H.; McFadden, J.; Nakamura, R. Substorm growth and expansion onset as observed with ideal ground-spacecraft THEMIS coverage. J. Geophys. Res. 2011, 116, A00I26. [Google Scholar] [CrossRef]
- Petrukovich, A.A.; Artemyev, A.V.; Nakamura, R.; Panov, E.V.; Baumjohann, W. Cluster observations of dBz/dx during growth phase magnetotail stretching intervals. J. Geophys. Res. 2013, 118, 5720–5730. [Google Scholar] [CrossRef]
- Artemyev, A.V.; Angelopoulos, V.; Runov, A.; Petrukovich, A.A. Properties of current sheet thinning at x∼− 10 to− 12 RE. J. Geophys. Res. 2016, 121, 6718–6731. [Google Scholar] [CrossRef]
- Kokubun, S. Polar substorm and interplanetary magnetic field. Planet. Space Sci. 1971, 19, 697–704. [Google Scholar] [CrossRef]
- Akasofu, S.-I. Where is the magnetic energy for the expansion phase of auroral substorms accumulated? 2. The main body, not the magnetotail. J. Geophys. Res. Space Phys. 2017, 122, 8479–8487. [Google Scholar] [CrossRef]
- Cummings, W.D.; Barfield, J.N.; Coleman, P.J., Jr. Magnetospheric substorms observed at the synchronous orbit. J. Geophys. Res. 1968, 73, 6687–6698. [Google Scholar] [CrossRef]
- Sergeev, V.A.; Chernyaev, I.A.; Dubyagin, S.V.; Miyashita, Y.; Angelopoulos, V.; Boakes, P.D.; Boakes, D.; Nakamura, R.; Henderson, M.G. Energetic particle injections to geostationary orbit: Relationship to flow bursts and magnetospheric state. J. Geophys. Res. 2012, 117, A10207. [Google Scholar] [CrossRef]
- Angelopoulos, V.; Baumjohann, W.; Kennel, C.F.; Coroniti, F.V.; Kivelson, M.G.; Pellat, R.; Walker, R.J.; Lühr, H.; Paschmann, G. Bursty bulk flows in the inner central plasma sheet. J. Geophys. Res. 1992, 97, 4027–4039. [Google Scholar] [CrossRef]
- Sergeev, V.A.; Nikolaev, A.V.; Tsyganenko, N.A.; Angelopoulos, V.; Runov, A.V.; Singer, H.J.; Yang, J. Testing a two-loop pattern of the substorm current wedge (SCW2L). J. Geophys. Res. Space Phys. 2014, 119, 947–963. [Google Scholar] [CrossRef]
- Wei, D.; Zhang, F.; Yang, J.; Wang, W.; Sun, W.; Cui, J.; Angelopoulos, V. A magnetospheric driver of westward traveling surge: Plasmasheet bubble. Geophys. Res. Lett. 2021, 48, e2021GL095539. [Google Scholar] [CrossRef]
- Wei, D.; Yang, J.; Liu, C.; Zhang, F.; Wang, W.; Sun, W. Successive westward traveling surges driven by sequential plasma-sheet bubble injections. Geophys. Res. Lett. 2022, 49, e2022GL100774. [Google Scholar] [CrossRef]
- Akasofu, S.-I. The development of the auroral substorm. Planet. Space 1964, 12, 273–282. [Google Scholar] [CrossRef]
- Akasofu, S.-I.; Kimball, D.S.; Meng, C.-I. The dynamics of the aurora. II. Westward traveling surges. J. Atmos. Terr. Phys. 1965, 27, 173–187. [Google Scholar] [CrossRef]
- Baumjohann, W.; Pellinen, R.J.; Opgenoorth, H.J.; Nielsen, E. Joint two-dimensional observations of ground magnetic and ionospheric electric fields associated with auroral-zone currents: Current systems associated with local auroral breakups. Planet. Space Sci. 1981, 29, 431–447. [Google Scholar] [CrossRef]
- Bristow, W.A.; Sofko, G.J.; Stenbaek-Nielsen, H.C.; Wei, S.; Lummerzheim, D.; Otto, A. Detailed analysis of substorm observations using SuperDARN, UVI, ground-based magnetometers, and all-sky imagers. J. Geophys. Res. 2003, 108, 1124. [Google Scholar] [CrossRef]
- Kleimenova, N.G.; Gromova, L.I.; Gromov, S.V.; Malysheva, L.M.; Despirak, I.V. ‘Polar’ Substorms and the Harang Discontinuity. Geomagn. Aeron. 2024, 64, 490–499. [Google Scholar] [CrossRef]
- Forsyth, C.; Rae, I.J.; Coxon, J.C.; Freeman, M.P.; Jackman, C.M.; Gjerloev, J.; Fazakerley, A.N. A new technique for determining substorm onsets and phases from indices of the electrojet (SOPHIE). J. Geophys. Res. Space Phys. 2015, 120, 10592–10606. [Google Scholar] [CrossRef]
- Svaldi, V.; Matsuo, T.; Kilcommons, L.; Gallardo-Lacourt, B. High-latitude ionospheric electrodynamics during STEVE and non-STEVE substorm events. J. Geophys. Res. Space Phys. 2023, 128, e2022JA030277. [Google Scholar] [CrossRef]
- Nishimura, Y.; Yang, J.; Weygand, J.M.; Wang, W.; Kosar, B.; Donovan, E.F.; Angelopoulos, V.; Paxton, L.J.; Nishitani, N. Magnetospheric conditions for STEVE and SAID: Particle injection, substorm surge, and field-aligned currents. J. Geophys. Res. Space Phys. 2020, 125, e2020JA027782. [Google Scholar] [CrossRef]
- Ohtani, S.; Gjerloev, J.W. Is the substorm current wedge an ensemble of wedgelets? Revisit to midlatitude positive bays. J. Geophys. Res. Space Phys. 2020, 125, e2020JA027902. [Google Scholar] [CrossRef]
- Kamide, Y.; Kokubun, S. Two-component auroral electrojet: Importance for substorm studies. J. Geophys. Res. 1996, 101, 13027–13046. [Google Scholar] [CrossRef]
- Milan, S.E.; Hubert, B.; Grocott, A. Formation and motion of a transpolar arc in response to dayside and nightside reconnection. J. Geophys. Res. Space Phys. 2005, 110, A01212. [Google Scholar] [CrossRef]
- Kissinger, J.; Wilder, F.D.; McPherron, R.L.; Hsu, T.-S.; Baker, J.B.H.; Kepko, L. Statistical occurrence and dynamics of the Harang discontinuity during steady magnetospheric convection. J. Geophys. Res. Space Phys. 2013, 118, 5127–5135. [Google Scholar] [CrossRef]
- Grocott, A.; Milan, S.E.; Yeoman, T.K.; Sato, N.; Yukimatu, A.S.; Wild, J.A. Superposed epoch analysis of the ionospheric convection evolution during substorms: IMF BY dependence. J. Geophys. Res. 2010, 115, A00I06. [Google Scholar] [CrossRef]
- Foster, J.C.; Burke, W.J. SAPS: A new categorization for sub-auroral electric fields. Eos Trans. Am. Geophys. Union 2002, 83, 393–394. [Google Scholar] [CrossRef]
- Anderson, P.C.; Heelis, R.A.; Hanson, W.B. The ionospheric signatures of rapid subauroral ion drifts. J. Geophys. Res. 1991, 96, 5785–5792. [Google Scholar] [CrossRef]
- Galperin, Y.L.; Ponomarev, V.N.; Zosimova, A.G. Plasma convection in the polar ionosphere. Ann. De Geophys. 1974, 30, 1–7. [Google Scholar]
- Mishin, E.V. Interaction of substorm injections with the subauroral geospace: 1. Multispacecraft observations of SAID. J. Geophys. Res. Space Phys. 2013, 118, 5782–5796. [Google Scholar] [CrossRef]
- Ma, R.; Xu, J.; Wang, W.; Lei, J.; Liu, H.-L.; Maute, A.; Hagan, M.E. Variations of the nighttime thermospheric mass density at low and middle latitudes. J. Geophys. Res. 2010, 115, 301–324. [Google Scholar] [CrossRef]
Disclaimer/Publisher’s Note: The statements, opinions and data contained in all publications are solely those of the individual author(s) and contributor(s) and not of MDPI and/or the editor(s). MDPI and/or the editor(s) disclaim responsibility for any injury to people or property resulting from any ideas, methods, instructions or products referred to in the content. |
© 2025 by the authors. Licensee MDPI, Basel, Switzerland. This article is an open access article distributed under the terms and conditions of the Creative Commons Attribution (CC BY) license (https://creativecommons.org/licenses/by/4.0/).