Abstract
Despite recent improvements in particulate matter (PM) pollution, haze events still frequently occur in many regions of China. Volatile organic compounds (VOCs), as key precursors in atmospheric photochemistry, play a crucial role in haze formation. To elucidate their contributions, high-resolution hourly VOC measurements were conducted in Shaoxing, an industrial city in eastern China, during a winter field campaign from 1 December 2023 to 15 January 2024. The VOC groups were dominated by alkanes (31.5–53.8%), followed by alkenes (7.1–15.1%) and aromatics (6.7–14.1%). Positive Matrix Factorization (PMF) analysis resolved six major VOC sources: vehicle emissions (VE, 33.8%), combustion sources (CS, 20.0%), industrial emissions (IE, 13.4%), gasoline evaporation (GE, 14.6%), solvent usage (SU, 6.9%), and biogenic activities (BA, 12.6%). Based on the PMF results, we further evaluated the source-specific contributions of VOCs to OH radical loss rate (LOH), ozone formation potential (OFP), and secondary organic aerosol potential (SOAP). During the haze episode, GE was the dominant driver of LOH (33%), while IE (23%), GE (22%), and VE (20%) were major SOAP contributors. In contrast, during the other periods, CS contributed most to both OFP (24%) and SOAP (28%), followed by VE (22–23%). Overall, our study highlights the critical role of anthropogenic activities in driving secondary pollution and suggests that sector-specific mitigation strategies hold significant potential for local haze abatement.
1. Introduction
The rapid industrialization and urbanization in China have raised growing concerns about ambient volatile organic compounds (VOCs) pollution [1,2,3]. Numerous studies have demonstrated that VOCs have detrimental effects on human health, contributing to respiratory, neurological, and circulatory diseases [4,5,6]. As critical chemical intermediates, VOCs play a crucial role as key precursors in the formation of tropospheric ozone (O3) and secondary organic aerosol (SOA) [7,8,9], exerting significant impacts on air quality, ecosystem stability, and climatic dynamics [5,10].
The implementation of stringent regulatory measures targeting VOCs emissions has become a critical priority in addressing ozone and PM2.5 pollution in China [11,12,13]. Effective VOC control strategies rely on precise quantification of ozone formation potential (OFP) and secondary organic aerosol potential (SOAP) at the emission source level [3,14]. However, current estimation methods face two key challenges: uncertainties in emission inventories and limitations in measurement capabilities [15,16]. While source-specific inventories in China provide theoretical assessments, their reliance on foreign-derived emission factors introduces substantial uncertainties [17,18,19]. Field measurements, though more accurate, remain cost-prohibitive and geographically fragmented. Recent advancements in profile-based OFP and SOAP estimations underscore the need for synchronized multi-source monitoring to resolve regional disparities [20,21].
As a principal method for identifying ambient VOC sources, positive matrix factorization (PMF) serves as a key tool in atmospheric studies [22,23]. By resolving factor profiles and reactivity patterns, the PMF model enables quantitative apportionment of emission sources and has proven critical for elucidating pollution formation mechanisms [24,25]. The relative contribution of each source can be determined through PMF analysis [26,27]. For instance, studies in Beijing identified combusted vehicular emissions and fuel evaporation processes as dominant contributors to OFP [28], while parallel investigations at petroleum infrastructure sites revealed that evaporative losses from fuel storage were the primary drivers of OFP [29]. Similarly, Ref. Abeleira et al. [30] demonstrated that persistent oil and natural gas operations were the main contributors to hydroxyl radical loss (LOH) in northern Colorado. However, the contribution of various VOC sources to SOAP remains understudied, particularly regarding the identification of dominant sources in SOA formation [31].
Shaoxing, a rapidly developing city in the Yangtze River Delta region of China with a population of approximately 5.4 million in 2024, is heavily influenced by intensive anthropogenic activities. The national industrial park in northeastern Shaoxing provides strong vitality for economic growth. However, more than 300 enterprises in the park emit large amounts of air pollutants, including VOCs, into the atmosphere. To better understand the characteristics and sources of ambient VOCs in this area, continuous online monitoring was conducted at Paojiang Middle School from 1 December 2023 to 15 January 2024, using a dual-channel gas chromatography (GC) system. The levels, compositions, and diurnal variation patterns of VOCs were examined. Source identification was performed using both species-specific diagnostic ratios and the PMF model. Furthermore, this study systematically assessed LOH, OFP, and SOAP associated with different PMF-resolved VOC sources. The SOAP of each identified emission source was quantitatively evaluated. Temporal variations in source contributions were also compared between haze episode and the other periods to gain deeper insights into pollution dynamics. The results provide valuable insights for the targeted control of VOCs and PM2.5 in Shaoxing, contributing to improving air quality management strategies.
2. Experiments and Methods
2.1. Site Description and VOCs Analysis
The sampling site was located on the roof (20 m above the ground) of a school building at Paojiang Middle School (30.08° N, 120.63° E) in Shaoxing City, Zhejiang Province. The site is situated in a central urban area and is mainly surrounded by residential areas, hospitals, restaurants and other living facilities around, with several major traffic arteries nearby and a few small hills in the distance. This sampling site is a mature mixed area with no obvious air pollution sources around. Therefore, the observation data basically represents the air pollution condition in the urban area. Details of the sampling site can be found in previous studies [22,32]. The winter monitoring campaign was carried out from 1 December 2023 to 15 January 2024. Specifically, an online system (Agilent Technologies, Santa Clara, CA, USA) was used for monitoring atmospheric VOCs, which employed ultra-low-temperature pre-enrichment and dual-channel gas chromatography (GC) with flame ionization detector (FID) and mass spectrometry (MS). The monitoring system employs thermoelectric cooling to achieve cryogenic enrichment of VOCs. Its dual-stage thermal management system first removes water vapor and CO2 through a −80 °C pre-cooling trap, followed by analyte focusing at −150 °C in a deactivated capillary column. Thermal desorption was followed at 100 °C to transfer the captured material to GC-FID/MS for further analysis. Compared to conventional adsorbent-based methods, this approach eliminated the artifacts from adsorbent-analyte interactions. The high volatile VOCs (carbon atom number: 2–5, i.e., C2–C5) and VOCs with low volatility (e.g., C6–C12) were quantified using FID and MS, respectively. The external standard gases (i.e., PAMS and TO-15) and internal standard gases (e.g., bromochloromethane, 1,4-difluorobenzene, and chlorobenzene-d5) were used to calibrate the FID and MS detector, respectively. A total of 98 VOC species, including alkanes, alkenes, aromatics, halohydrocarbons, and oxygenated VOCs (OVOCs), were quantified hourly throughout the monitoring campaign. The quality control and assurance can be found in previous work [22,32]. Furthermore, meteorological data (encompassing wind velocity, directional wind patterns, temperature gradients, and humidity levels) and environmental quality data (encompassing PM10, PM2.5, NOx, NH3, O3, and CO) were also monitored to analyze the characteristics of environmental VOCs pollution. Hourly concentrations of PM10, PM2.5, NOx, NH3, O3, and CO at the SS site were obtained from continuous automated analyzers operated under the technical specifications of the China’s Ministry of Ecology and Environment (MEE) ambient air monitoring network. PM10 and PM2.5 were measured using β-attenuation or tapered element oscillating microbalance (TEOM) instruments, O3 was measured by ultraviolet (UV) photometric analyzers, CO by non-dispersive infrared (NDIR) analyzers, NOx (NO + NO2) by chemiluminescence analyzers with catalytic/photolytic conversion of NO2 to NO, and NH3 by a continuous ammonia analyzer based on gas scrubbing and subsequent detection. All instruments comply with the relevant national performance standards for continuous automatic monitoring systems and are routinely calibrated and quality-controlled by the local environmental monitoring center.
2.2. Source Apportionment
Positive matrix factorization (PMF, version 5.0), developed by the United States Environmental Protection Agency (US EPA) was applied to analyze the sources of VOCs. PMF operates as a multivariate receptor model that quantifies pollution sources through weighted error optimization of chemical species data. The PMF model setup followed Wang et al. [33], where a detailed description can be found. Briefly, the input data contained VOC concentration file and uncertainty file. Each VOC species was classified into three categories (i.e., strong, weak and bad) according to its signal-to-noise (S/N) ratio. For example, VOCs species were set as strong in the model if their S/N ratios were above 1. Measurement uncertainties were allocated within a 5–20% range for VOCs species exceeding the method detection limit (MDL) [34]. This study implemented a conservative 10% uncertainty threshold for MDL exceeding concentrations. For concentrations below the MDL, the concentration was replaced by one-half of the MDL and the corresponding uncertainty was set to 5/6 of the MDL. This treatment of censored data is consistent with the recommendations in the EPA PMF User Guide and widely adopted in previous PMF studies, in which below-MDL values are strongly down-weighted but retained in the analysis to avoid bias [22]. Q is the critical parameter of PMF mode, existing in two validated forms: Q(true) (incorporating all observations) and Q(robust) (excluding outliers with uncertainty scaled residuals > 4). We performed a series of base runs by varying the factor number from 4 to 9 and then assessed the model rotation using Fpeak test. The results of base run and Fpeak test were shown in Table S1. The Q(true)/Q(exp) values decreased along with the increase in factor number, indicating the improvements in the model fit. In contrast, the increasing increment of %dQ(robust) indicates that the improvement in model fit becomes smaller with each additional factor. In general, a %dQ(robust) value below 5% is considered acceptable in the Fpeak test, and thus factor number of 6 was selected for PMF analysis.
2.3. Reactivity of VOCs
Identifying VOCs as SOA precursors is important for mitigating PM2.5 pollution. The intricate formation pathways of SOA pose significant observational challenges, necessitating the use of empirical proxies for indirect evaluation. The secondary organic aerosol potential (SOAP) is widely used as a theoretical tool to evaluate quantitatively the influences of VOCs on SOA based on a variety of assumptions between VOCs and •OH., Individual SOA formation potentials were derived as the product of species coefficients and measured ambient concentrations. Total SOAP was subsequently calculated using following equation:
where [VOC]i represents the concentration of VOCs species i, molecule m−3. denotes the associated SOA yield for VOCs species i. In this study, the two-product model was used to calculate SOA yields in consideration of parameter accessibility and calculation efficiency, and the SOA yield of measured VOC species was obtained from Gu et al. [35].
The reactivity of VOCs based on OH radical loss rate was calculated as [30]:
where VOCi is the mixing ratio of the ith species; kVOCi is the reaction rate of the ith species with OH radical, which was adopted from Atkinson and Arey [36].
LOH = [VOC]i × kVOCi
The OFP of VOCs was quantified employing the Maximum Incremental Reactivity (MIR) methodology, which evaluates compound specific photochemical ozone creation efficiencies under optimal NOx conditions. MIR coefficients were multiplied by measured VOC concentrations to derive OFP values [32]:
where VOCi and MIRi are the concentrations and reactivity of each VOC. It should be noted that there may be uncertainties in the above calculations due to the empirical parameters (e.g., SOA yield from VOCs, maximum incremental reactivity of VOCs), these calculations are widely applied in estimating reactivity of VOCs.
OFPi = [VOC]i × MIRi
3. Results and Discussions
3.1. Overview of the Monitoring Campaign
During the whole monitoring period, a total of 93 VOC species were detected at the site, including 29 alkanes, 11 alkenes, 1 alkyne, 16 aromatics, 27 halohydrocarbons, 6 aldehydes, 2 ketones, and 1 ether. Figure 1 shows the temporal variation of observed VOCs, PM2.5, CO, NOx, O3, and meteorological parameters (including wind speed (WS) and wind direction (WD)). A pronounced haze episode occurred from 26 December 2023, to 4 January 2024, characterized by sustained PM2.5 levels (with PM2.5 concentrations exceeding 75 μg/m3 for more than five days, Figure 1d) and stagnant atmospheric conditions (Figure 1a). During this period, the daily averages reached 116.0 μg/m3 for PM2.5 (2.2× higher than other periods, Figure 1d), 12.64 ppbv for oxygenated VOCs (OVOCs, 2.2× higher, Figure 1e), and 99.8 μg/m3 for NOx (1.8× higher, Figure 1c). A clear negative correlation between O3 and PM2.5 was observed over the whole campaign (Figure 1d), reflecting the typical suppression of ozone during severe haze events [37]. In addition, both NH3 and SO2 increased during the haze episode compared with the other periods (Figure 1c), with daily mean NH3 (SO2) concentrations of 13.1 (8.8) μg m−3, corresponding to about 1.7 (1.2) times the levels during the other periods. This indicates increased availability of alkaline (NH3) and acidic (SO2-derived) precursors and favoring the formation of ammonium sulfate and nitrate, which likely contributed to the build-up of fine particulate matter [38]. Although a detailed chemical speciation of PM is beyond the scope of this work, these co-variations suggest that inorganic secondary aerosols formed from NH3 and SO2 played an important role in the haze episode, in addition to the organic fraction that is the focus of this study.
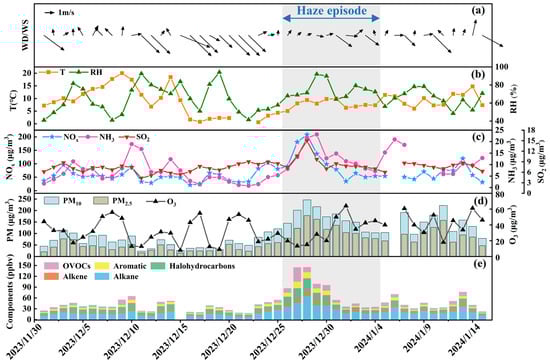
Figure 1.
Temporal variations in meteorological parameters (a,b), conventional air pollutants (c,d), and VOCs (e) during the whole monitoring period (1 December 2023, to 15 January 2024. The persistent haze episode is marked by double-sided arrow and grey area. Note that missing data for certain periods is due to instrument maintenance.
The concentration of VOCs groups followed a similar order throughout most of the monitoring period, with alkanes > halohydrocarbons ≈ OVOCs > alkenes > aromatics (Table S2). Alkanes accounted for 31.5–53.8%, while alkenes and aromatics were lower contributors, comprising 7.1–15.1% and 6.7–14.1%, respectively, in Shaoxing. During the haze episode, ambient alkane concentrations were dominated by propane, ethane, and n-butane. Notably, ethane and propane serve as robust tracers of natural gas leakage, while n-butane and isopentane distinctly correlate with vehicular exhaust and gasoline evaporation, respectively [39]. Among the 11 alkenes, ethylene, 1-butene, and propene were the most abundant. For the 16 aromatic compounds, benzene, toluene, and m/p-xylene were predominant. Benzene emissions primarily originate from fossil fuel combustion and industrial solvent use [40], while toluene is predominantly associated with wood product manufacturing and the printing industry [41]. Notably, eight overlapping compounds (i.e., dichloromethane, toluene, Freon 11, acetone, propane, 1,2-dichloroethane, m/p-xylene, and benzene) rank among the top ten most abundant VOCs. Despite its low atmospheric concentration (0.08–0.46%), Chemical Freon 11 warrants environmental priority due to its ozone-depleting potential [42]. Other VOCs species were primarily attributed to anthropogenic sources, including industrial manufacturing processes and combustion-related vehicular exhaust [22]. Detailed source apportionment will be discussed in Section 3.3.
3.2. Correlation Analysis Among Air Pollutants, Meteorological Factors, and VOCs
Figure 2 illustrates the Pearson correlation among VOCs groups, trace gases, and meteorological parameters. The VOC concentrations showed significant positive correlations (p < 0.01) with trace gases (SO2, NO2, and CO), indicating that these pollutants likely share similar emission sources [43]. A significant positive correlation (p < 0.01) was also found between VOCs and PM2.5. This association is consistent with the expectation that VOCs and particulate matter can be linked through common sources and secondary formation pathways; however, the underlying mechanisms cannot be fully resolved with the available data.
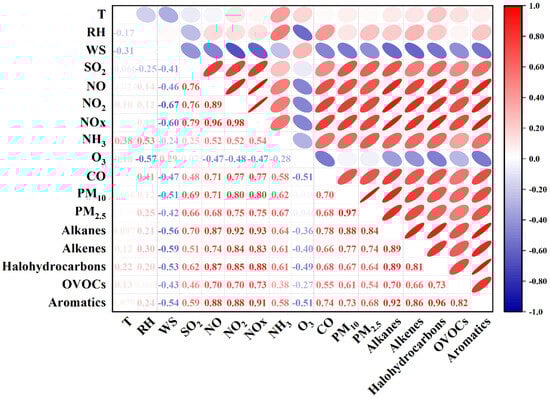
Figure 2.
Pearson correlation analysis among air pollutants, meteorological parameters, and VOC groups.
To further explore these interactions, correlations between VOCs and other parameters were analyzed using daytime data (8:00–18:00) during haze and other periods (Figures S1 and S2). During the haze episode (Figure S2), O3 and OVOCs were positively correlated, which may indicate enhanced photochemical activity and the co-occurrence of secondary products under stagnant conditions [44]. In contrast, O3 and OVOCs exhibited a significant negative correlation in other periods (Figure S1), likely reflecting weaker photochemical production and a larger relative contribution of primary OVOC emissions under weaker solar radiation and lower temperature. To be more precise, OVOCs during non-haze events may primarily originate from primary emissions, while O3 is a secondary photochemical product, leading to their inverse correlation under low-photochemistry conditions. Additionally, O3 and alkanes showed an inverse correlation throughout the monitoring period. One possible explanation is that alkanes are relatively less reactive with OH radicals compared to alkenes and aromatics; when alkanes dominate the VOC mixture, they may dilute the contribution of more reactive species that are more efficient O3 precursors, thereby shifting the overall VOC reactivity toward less photochemically active compounds and suppressing O3 production [43].
Nevertheless, the correlation analysis alone does not provide sufficient evidence to fully explain the observed association between VOCs and PM2.5. Multiple factors may contribute to this correlation, including primary organic aerosols (POAs) that share similar sources with VOCs, inorganic aerosols from the same emission origins, secondary organic aerosols (SOAs) generated from VOC oxidation, or inorganic aerosols formed through processes analogous to SOA formation. A combination of these mechanisms is also possible. Due to the lack of detailed chemical composition data for PM2.5, it remains challenging to determine which of these processes predominantly drives the observed association. Future studies integrating chemical characterization of PM2.5 and source apportionment analysis will be essential to elucidate the underlying mechanisms linking VOCs, secondary pollution formation, and particulate matter evolution.
3.3. Source Apportionment Analysis
3.3.1. Species-Specific Diagnostic Ratios
Atmospheric VOC composition reflects the characteristics of emission source, with species-specific abundance patterns acting as source signatures [45]. The benzene-to-toluene (B/T) mass concentration ratio serves as a diagnostic tool for identifying VOC emission origins [46]. Analysis of the B/T ratios in Figure 3a showed consistently low values (<0.3) across both sampling periods, indicating that aromatic compounds (16 quantified species) primarily originated from industrial solvent volatilization and vehicular combustion byproducts [22]. Photochemical processing history was assessed through paired tracer analysis using chemically analogous compounds with divergent atmospheric lifetimes [47]. Photochemical aging of air masses was quantified using the m/p-xylene-to-ethylbenzene (X/E) ratio. Lower values (<3) denote aged pollutants that have been transported over a distance, while higher values (>3) reflect fresh emissions [47]. Figure 3b reveals that during haze episodes, the X/E ratio averaged 2.59, whereas other winter periods exhibited a higher value of 3.41. While a lower X/E ratio is often interpreted as evidence of regional transport [48], this explanation appears inconsistent with the stagnant meteorological conditions typically associated with haze. Instead, the decreased X/E ratio during haze is more likely attributed to enhanced photochemical oxidation. Elevated oxidant levels (e.g., O3 and OH radicals) during haze episodes could accelerate the degradation of xylene, which reacts more rapidly than ethylbenzene, thereby reducing the X/E ratio at the sampling site. This interpretation suggests that local emissions—primarily from vehicular exhaust and industrial solvent usage—underwent substantial in situ oxidation under stagnant yet chemically active conditions, contributing to haze formation and secondary pollutant buildup [49].
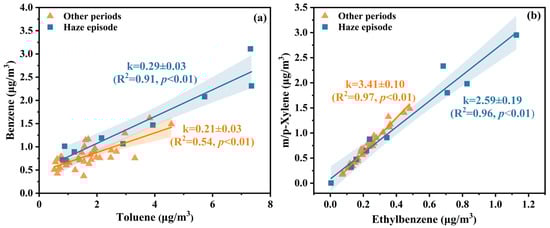
Figure 3.
Diagnostic ratios of (a) benzene/toluene (B/T) and (b) m/p-Xylene/ethylbenzene (X/E) during the haze episode and other periods. The ratios were calculated as the slopes (k) of the linear regression lines based on daily averages. The shaded areas represented the 95% confidence bands of the fitted regression lines.
3.3.2. Sources Identified Using PMF
This investigation employed PMF to apportion VOC sources and quantify their relative contributions at the study site. The PMF-derived source profiles (Figure 4) resolved six distinct emission factors within the industrial park, with model diagnostics confirming six factors as the optimal solution. While minor residual cross-source species persisted across factors, their chemical signatures aligned with known industrial processes when contextualized against local emission inventories. Subsequent tracer validation integrated sector-specific activity patterns (e.g., solvent usage schedules, combustion feedstock compositions) to refine source interpretations, ensuring ecological representativeness of the resolved profiles.
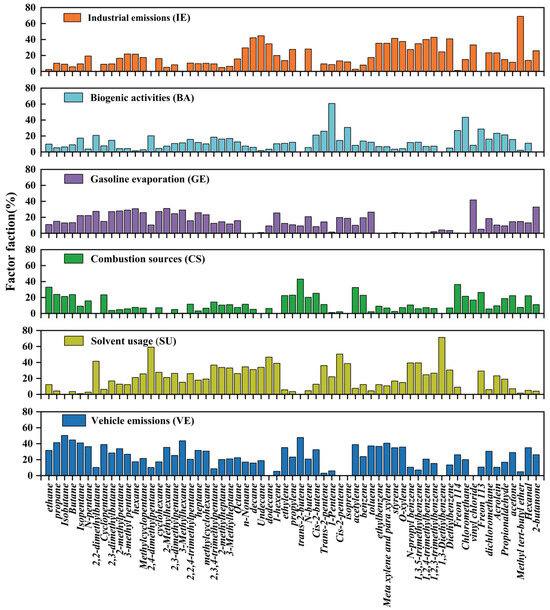
Figure 4.
Source apportionments of VOCs at the industrial park site using PMF model. A total of 63 species were selected and incorporated in PMF, and six factors were identified at the industrial park site, namely IE, BA, GE, CS, SU, and VE.
Factor 1 was characterized by high loadings of aromatic compounds, including styrene (41.4%), 1,3,5-trimethylbenzene (34.7%), toluene (17.4%), ethylbenzene (35.3%), Diethylbenzene (40.8%), m,p-xylenes (35.3%), and o-xylene (37.5%). These species are widely recognized as markers of industrial manufacturing processes and refining activities petrochemical industry [50,51]. In addition, this factor exhibited an extremely high loading of methyl tert-butyl ether (MTBE, 69.0%), which is widely used as a gasoline oxygenate and as a solvent/intermediate in petrochemical production [52,53], as well as a notable contribution from propene (27.6%), a key tracer of petrochemical operations [50,54]. Collectively, these observations conclusively classify this emission profile as industrial emissions (IE), contributing 13.4% to the total VOC concentration (Figure S3).
Factor 2 exhibited a distinct chemical signature dominated by 1-pentene (60.8%) and chloromethane (43.7%). Chloromethane is a well-established tracer of biomass burning [55,56,57]. This factor also showed a notable allocation of isoprene, which accounted for 30.7% of the total isoprene in this source profile. Isoprene is widely recognized as a marker for biogenic emissions [58]. The co-occurrence of chloromethane and isoprene, coupled with the negligible industrial indicators, suggests that this factor represents biogenic activities (BA), potentially influenced by both natural vegetation emissions and seasonal biomass combustion activities. The contribution of biogenic sources to VOCs concentration was 11.3% (Figure S3).
Factor 3 was loaded on i-pentane (22.2%) and pentane (22.2%). Refs. Zhang et al. [15] and Barletta et al. [59] identified these compounds as key indicators of gasoline evaporation and vehicular emissions. Additional components, including 2-methylpentane (27.9%) and 3-methylpentane (29.0%), are commonly associated with vehicular sources through both exhaust and evaporative processes [60,61]. Collectively, the chemical composition of this factor clearly points to gasoline evaporation (GE) as the dominant source, which contributed 14.6% to the total VOC concentration (Figure S3).
Factor 4 was heavily weighted on ethane (32.9%), ethene (22.4%), propane (23.9%), acetylene (32.6%), propene (22.9%), and benzene (22.8%). These compounds originate from combustion-related mechanisms [57], leading to the definitive attribution of this emission profile to combustion sources (CS). CS accounted for 20.0% of total VOC concentrations (Figure S3), making it the second-largest contributor to ambient VOC pollution in Shaoxing.
Factor 5 was interpreted as solvent usage (SU). It was characterized by substantial loadings of aromatic compounds such as 1,3,5-trimethylbenzene (39.5%), 1,2,4-trimethylbenzene (24.6%), and 1,2,3-trimethylbenzene (26.6%), which are widely recognized as solvent usage (SU) emissions [62]. Emission profiles from industrial sectors such as printing and surface coating further support this classification, as aromatic hydrocarbons account for 79.5–81.4% of total VOCs in these activities [63]. This factor contributed the least to VOC pollution throughout the monitoring period, accounting for just 6.9% (Figure S3).
Factor 6 was also heavily loaded on aromatics such as o-xylene (35.7%), m,p-xylenes (40.7%), and 1,2,4-trimethylbenzene (20.6%), commonly linked to vehicular exhaust and industrial solvent use [40]. Notably, this factor showed elevated proportions of propane (41.3%) and C4–C7 hydrocarbons, which are indicative of automotive combustion [57]. Similar source profiles, predominantly linked to gasoline-powered vehicle emissions, have been reported in previous studies [30,57,64]. Accordingly, this factor was identified as vehicle emissions (VE), contributing 33.8% to total VOC concentrations (Figure S3), and representing the largest source of VOC pollution in Shaoxing throughout the monitoring period.
It should be noted that our VOC measurements do not capture the full range of species present in the urban atmosphere. In particular, key OVOCs (e.g., formaldehyde, acetaldehyde), many volatile chemical product (VCP) species (e.g., glycol ethers, esters, glycols), terpenes (e.g., limonene), and intermediate-volatility organic compounds (IVOCs) were not quantified. These compounds can be important for radical production and SOA formation, especially in solvent/VCP-related, biogenic/personal-care-product, and some industrial/combustion plumes [65,66,67]. As a result, the PMF factors and SOAP-based SOA potential presented here reflect only the measured VOC fraction and likely underestimate the total contributions of such sources. Nevertheless, the six PMF factors are strongly constrained by well-established tracer species that were measured, so their qualitative interpretation and relative ranking are expected to be robust, while the absolute contributions should be regarded as lower bounds.
3.3.3. Source Contributions to Haze and Other Periods
Figure 5 presents the source apportionment of VOCs in Shaoxing across varying pollution scenarios. Quantitative analysis revealed a notable increase in the contribution of industrial emissions (IE), rising from 10.5% during the other periods to 17.5% during the haze episode, surpassing biogenic sources, in direct correlation with elevated VOC concentrations. In contrast, the share of gasoline evaporation (GE) declined slightly from 22.6% to 21.7%, yet it remained the largest pollution source in the entire episode of severe pollution. Similarly, contributions from VE and CS also decreased marginally, from 21.9% to 18.5% and 21.6% to 20.7%, respectively. Nevertheless, GE, VE, and CS collectively account for more than 60% of total VOC concentrations in both periods, underscoring their dominant roles in urban VOC pollution. The SU increases slightly from 8.4% to 13%, while the proportion of BA decreased gradually as VOC pollution intensified. However, the relative shares of SU and BA remained comparatively low, indicating a limited role in driving VOC pollution episodes. Overall, the results underscore that GE, VE, and CS are the key drivers of elevated VOC levels in Shaoxing. Under severe VOC pollution episodes, targeted mitigation of these three emission sources could significantly reduce ambient VOC concentrations. These evidence-based insights provide critical guidance for policymakers to prioritize sector-specific interventions in urban air quality management frameworks.
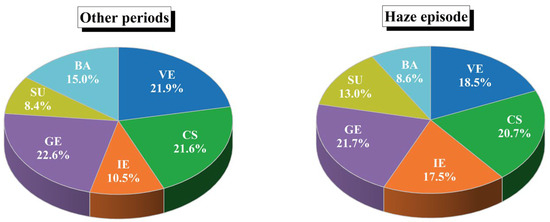
Figure 5.
Source contributions to VOCs concentration in the PMF model during the haze episode and other periods.
3.4. Comparison of Source-Based VOCs Reactivity Between Haze and Other Periods
Figure 6 ranks the top 10 contributors to SOAP during the study periods, revealing aromatic hydrocarbons as the dominant precursors. Toluene exhibited the highest SOAP contribution, accounting for 56.5% of total SOA formation during the haze episode and 53.9% during other periods (Figure 6 and Table S3). Benzene and m/p-xylene were secondary contributors. In contrast, alkanes, olefins, and acetylene demonstrated limited SOAP contributions (<5% combined), with isobutane contributing the highest alkane-derived SOAP (0.6%, Table S3). It should be noted that SOAP represents a semi-quantitative indicator of the relative SOA formation potential derived from measured VOC concentrations and simplified SOA yield coefficients, rather than the actual SOA production under ambient atmospheric conditions. In particular, SOAP does not account for differences in atmospheric lifetime and reaction kinetics. Light alkanes have relatively low reactivity with atmospheric oxidants and long lifetimes; therefore, only a small fraction of their emissions is expected to react within the spatial and temporal scales of Shaoxing. As a result, although their SOAP values are non-zero, light alkanes are unlikely to be important SOA precursors for local air-quality management and may be more relevant on regional to global scales. Real-world SOA formation depends on complex and dynamic environmental factors, including oxidant levels, photochemical activity, humidity, temperature, and interactions with inorganic aerosols. Therefore, the SOAP values presented here are intended to reflect the relative importance of VOC species in potential SOA formation, rather than the absolute SOA mass observed during the sampling period. Despite these limitations, the pronounced dominance of aromatic hydrocarbons, particularly toluene originating from industrial solvent use and vehicular emissions, underscores their critical role in secondary aerosol formation. Therefore, targeted reduction in aromatic VOC emissions could substantially mitigate SOA formation potential and improve regional air quality.
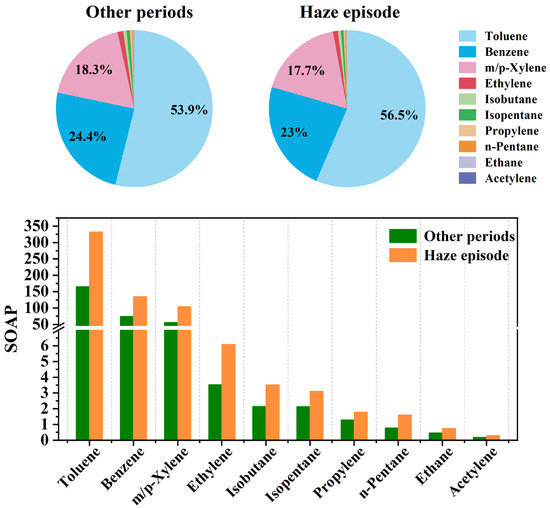
Figure 6.
Source contributions of the top 10 individual VOCs in terms of SOAP.
The PMF-resolved source contributions to LOH, OFP, and SOAP exhibited notable divergence between the haze episode and other periods (Figure 7). As shown in Figure 7b, during the other periods, VE contributed 28% to the total OH loss rate, followed by CS (25%), IE (18%), BA (15%), GE (9%), and SU (5%). Anthropogenic VOC reactivity in urban environments is predominantly driven by vehicular exhaust and petrochemical refining activities. For instance, Borbon et al. [68] reported that automotive emissions accounted for approximately 50% of total VOC reactivity in Pasadena due to their high content of reactive aromatic and alkene species. In contrast, during the haze episode, gasoline evaporation (GE) became the largest contributor to LOH, surpassing all other sources. This shift suggests that VOCs associated with gasoline evaporation either exhibit higher intrinsic •OH reactivity or experience enhanced emission rates under stagnant, pollution-favorable conditions. The diurnal variations showed lower temperatures and higher RH in the early morning and evening sunset during the haze episode than during the other periods (Figure S4), leading to a lower boundary layer height. In addition, stagnant meteorological condition with lower wind speeds during the haze episode (Figure 1a) may also be favorable for the accumulation of VOCs from gasoline evaporation in the boundary layer during haze events. Further investigation into these haze-specific emission characteristics is necessary to better understand their role in atmospheric oxidation processes.
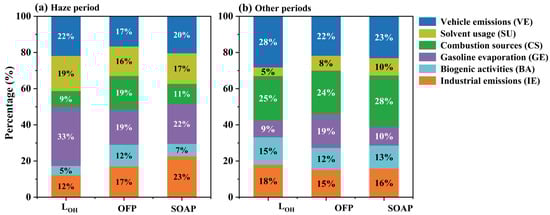
Figure 7.
Percentages (%) of different VOC sources to LOH, OFP, and SOAP during the haze period (a) and other periods (b).
For the OFP of different sources during the haze episode (Figure 7a), CS (19%) and GE (19%) were the largest contributions, followed by VE (17%), IE (17%), SU (16%), and BA (12%). During the other periods, CS (24%, Figure 7b) contributed more to ozone formation than GE (19%, Figure 7b). Nevertheless, GE and CS consistently accounted for more than one-third of the total OFP across both periods. Notably, the contribution of SU to OFP doubled from 8% during the other periods to 16% during the haze episode, underscoring the enhanced role of solvent-related emissions under stagnant atmospheric conditions. Toluene and m/p-xylene, which showed strong correlations with SU, were identified—along with ethylene—as major contributors to OFP [22]. Ethylene, a well-documented tracer of vehicular emissions (VE) [69,70], had a greater influence during the other periods when vehicular activity was more dominant. This contrast suggests that during haze episodes, the contribution of m/p-xylene and toluene to OFP may surpass that of more reactive but less abundant species like ethylene. Therefore, targeted reduction in SU is critical for mitigating photochemical ozone pollution in Shaoxing, particularly during haze-prone meteorological conditions.
For SOAP, IE owned the largest contribution (23%) during the haze episode (Figure 7a). This result aligns with prior emission inventory-based studies that have identified industrial activities as a dominant source of SOAP across China [71]. In contrast, during the other periods, combustion sources (CS) became the primary contributor, making up 28% of the total SOAP (Figure 7b). A clear shift in source contributions was observed between the two periods. Specifically, the contributions from CS, VE, and BA to SOAP decreased during haze events, consistent with the findings of [26]. In contrast, the contributions of SU, GE and IE to SOAP increased significantly under haze conditions, likely due to enhanced emissions and atmospheric reactivity in stagnant environments. These findings suggest that to effectively reduce secondary organic aerosol (SOA) formation—especially during haze events—emission controls should focus on sources such as IE, GE, and SU. Overall, VE contributed most to ambient VOC concentrations during the monitoring period (Figure S3). However, their contributions to OFP and SOAP were relatively modest. SU, despite contributing the least to total VOC mixing ratios, exhibited a substantial impact on LOH, OFP, and SOAP during the haze episode. These findings advocate prioritizing reactivity-driven VOC control strategies over traditional emission- or concentration-focused controls for effective air quality management. Specifically, targeting industrial emissions (IE) with high SOAP values would synergistically reduce both ambient VOC loads and SOA formation during pollution events. Consequently, this reactivity-based strategy offers a more precise and impactful framework for multi-pollutant mitigation, providing actionable insights for concurrently addressing ozone and fine particulate matter in urban regions like Shaoxing.
4. Conclusions
This study systematically investigated the concentration profiles, chemical speciation, and diurnal variations of VOCs at Shaoxing City during a winter observation campaign. VOC species exhibited a consistent compositional pattern, with the group order of alkanes > halohydrocarbons ≈ OVOCs > alkenes > aromatics. VOC concentrations increased significantly during the haze episode compared to the other periods. Tracer-based analysis identified vehicular exhaust and industrial solvent volatilization as dominant emission sources. Source apportionment using the PMF model resolved six major emission factors, with vehicular emissions contributing the most (VE, 33.8%), followed by combustion sources (CS, 20.0%), gasoline evaporation (GE, 14.6%), industrial emissions (IE, 13.4%), biogenic activities (BA, 11.3%), and solvent usage (SU, 6.9%). Further analysis revealed that alkanes were the largest contributors to total VOC mass (44.3% ± 5.5%), while aromatics dominated SOAP. During the transition from the other periods to the haze episode, GE and SU exhibited enhanced impacts on LOH, OFP, and SOAP, while the contributions from VE and CS declined. These results highlight that coordinated mitigation of both combustion-related sources (e.g., VE and CS) and non-combustion sources (GE and SU), particularly vehicular exhaust, gasoline evaporation, and solvent use, could effectively alleviate wintertime haze formation in Shaoxing by targeting its critical atmospheric precursors.
Supplementary Materials
The following supporting information can be downloaded at: https://www.mdpi.com/article/10.3390/atmos16121404/s1, Table S1: The results from base run and Fpeak test in PMF modeling; Table S2: Proportion of VOCs (inclusive) to overall VOCs concentration during the data monitoring period; Table S3: Average concentrations of individual VOC species and their contributions to overall VOCs concentration during the haze episode and the other periods; Figure S1: Pearson correlation analysis among air pollutants, meteorological parameters and VOCs groups in the other periods; Figure S2: Pearson correlation analysis among air pollutants, meteorological parameters and VOCs groups in the haze episode; Figure S3: Source contributions to VOCs concentration; Figure S4: Diurnal variations of temperature and relative humidity during haze episode and the other periods.
Author Contributions
Conceptualization, D.S., L.H. and D.C.; methodology, J.S.; software, Y.L.; validation, Y.L., X.G. and J.C.; formal analysis, Q.R., X.C. and W.Z.; investigation, D.S. and Y.L.; resources, L.H.; data curation, D.S. and J.S.; writing—original draft preparation, D.S.; writing—review and editing, Y.L., L.H., W.Z., K.H., D.C., X.G. and J.C.; visualization, D.S., Y.L., Q.R. and D.C.; supervision, D.C.; project administration, L.H.; funding acquisition, Y.L., L.H., D.C. and X.G. All authors have read and agreed to the published version of the manuscript.
Funding
This research was funded by Zhejiang Provincial Natural Science Foundation of China grant number LQ23B070009, National Natural Science Foundation of China grant number 42505104, Engineering Research Center of Non-metallic Minerals of Zhejiang Province grant number ZD2023K10, and Westlake University-Muyuan Joint Research Institute grant number WU2024MY002. And The APC was funded by Engineering Research Center of Non-metallic Minerals of Zhejiang Province grant number ZD2023K10.
Institutional Review Board Statement
Not applicable.
Informed Consent Statement
Not applicable.
Data Availability Statement
All the data in the paper is available upon the request on the corresponding authors.
Conflicts of Interest
Authors Dongfeng Shi, Wenting Zhuge, Kewen Hu were employed by the company Hangzhou Xufu Testing Technology Co., Ltd., Author Qing Ren was employed by the company Hangzhou Power Supply Company. The remaining authors declare that they have no known competing financial interests or personal relationships that could have appeared to influence the work reported in this paper.
References
- Cao, J.; Situ, S.; Hao, Y.; Xie, S.; Li, L. Enhanced summertime ozone and SOA from biogenic volatile organic compound (BVOC) emissions due to vegetation biomass variability during 1981-2018 in China. Atmos. Chem. Phys. 2022, 22, 2351–2364. [Google Scholar] [CrossRef]
- Zhou, X.; Li, Z.Q.; Wang, F.T.; Zhao, Z.Z.; Kang, S.C.; Yang, J.H.; Chang, Y.H.; Xia, D.S.; Li, K.M.; Zhang, X.; et al. Characterization and source analysis of VOCs and PM2.5 species in Lanzhou, northwestern China in 2017-2021: Implications for pollution control strategies. Environ. Pollut. 2025, 384, 126964. [Google Scholar] [CrossRef] [PubMed]
- Wang, Y.; Cheng, H.M.; Kang, T.F.; Wei, W.; Liu, X.L. Spatially resolved analysis of speciated VOC emissions and their contributions to secondary pollutant formation: A comparative assessment of anthropogenic and biogenic sources in China. Environ. Int. 2025, 202, 109627. [Google Scholar] [CrossRef]
- Zhang, T.; Li, G.; Yu, Y.; Ji, Y.; An, T. Atmospheric diffusion profiles and health risks of typical VOC: Numerical modelling study. J. Clean. Prod. 2020, 275, 122982. [Google Scholar] [CrossRef]
- Wu, D.; Wu, H.; Lyu, Y.; Zhang, H.; Wang, J.; Li, X.; Pang, X. The interplay of Brown carbon (BrC) surrogates and copper: Implications for the oxidative potential of ambient particles. J. Hazard. Mater. 2024, 480, 136276. [Google Scholar] [CrossRef]
- Lyu, Y.; Wu, H.; Pang, X.; Wang, J.; Zhao, M.; Chen, J.; Qin, K. The complexation of atmospheric Brown carbon surrogates on the generation of hydroxyl radical from transition metals in simulated lung fluid. Environ. Int. 2023, 180, 108240. [Google Scholar] [CrossRef] [PubMed]
- Hallquist, M.; Munthe, J.; Hu, M.; Wang, T.; Chan, C.K.; Gao, J.; Boman, J.; Guo, S.; Hallquist, Å.M.; Mellqvist, J.; et al. Photochemical smog in China: Scientific challenges and implications for air-quality policies. Natl. Sci. Rev. 2016, 3, 401–403. [Google Scholar] [CrossRef]
- Liu, B.; Ji, J.; Zhang, B.; Huang, W.; Gan, Y.; Leung, D.Y.C.; Huang, H. Catalytic ozonation of VOCs at low temperature: A comprehensive review. J. Hazard. Mater. 2022, 422, 126847. [Google Scholar] [CrossRef]
- Lyu, Y.; Xu, H.; Wu, H.; Han, F.; Lv, F.; Kang, A.; Pang, X. Spatiotemporal variations of PM2.5 and ozone in urban agglomerations of China and meteorological drivers for ozone using explainable machine learning. Environ. Pollut. 2025, 365, 125380. [Google Scholar] [CrossRef]
- Liu, C.; Ma, Z.; Mu, Y.; Liu, J.; Zhang, C.; Zhang, Y.; Liu, P.; Zhang, H. The levels, variation characteristics, and sources of atmospheric non-methane hydrocarbon compounds during wintertime in Beijing, China. Atmos. Chem. Phys. 2017, 17, 10633–10649. [Google Scholar] [CrossRef]
- Lyu, Y.; Wu, H.; Liu, X.; Han, F.; Lv, F.; Pang, X.; Chen, J. Co-Occurring Extremes of Fine Particulate Matter (PM2.5) and Ground-Level Ozone in the Summer of Southern China. Geophys. Res. Lett. 2024, 51, e2023GL106527. [Google Scholar] [CrossRef]
- Zhao, N.; Zhang, H.Y.; Wang, G. Revealing the nonlinear responses of PM2.5 and O3 to VOC and NOx emissions from various sources in Shandong, China. J. Hazard. Mater. 2025, 489, 137655. [Google Scholar] [CrossRef]
- Huang, W.C.; Yu, X.F.; Deng, H.; Chen, B.N.; Cheng, P.; Yang, W.D.; Li, M.; Yuan, B.; Wang, M.; Gong, Y.C. Strong Seasonal Transition and Complex Sources of Volatile Organic Compounds at an Urban Site in Guangzhou, China. J. Geophys. Res.-Atmos. 2024, 129, e2024JD040890. [Google Scholar] [CrossRef]
- Tan, Y.; Han, S.; Chen, Y.; Zhang, Z.; Li, H.; Li, W.; Yuan, Q.; Li, X.; Wang, T.; Lee, S.-c. Characteristics and source apportionment of volatile organic compounds (VOCs) at a coastal site in Hong Kong. Sci. Total Environ. 2021, 777, 146241. [Google Scholar] [CrossRef]
- Zhang, Y.; Wang, X.; Zhang, Z.; Lu, S.; Shao, M.; Lee, F.S.C.; Yu, J. Species profiles and normalized reactivity of volatile organic compounds from gasoline evaporation in China. Atmos. Environ. 2013, 79, 110–118. [Google Scholar] [CrossRef]
- Zhao, Y.; Sun, H.; Kim, Y.; Shu, Y.; Wang, H.; Li, H.; Deng, Y. A comprehensive provincial-level VOCs emission inventory and scenario analysis for China: Enhanced sectoral resolution through GAINS-China model. Atmos. Environ. X 2025, 25, 100316. [Google Scholar] [CrossRef]
- Zheng, J.; Shao, M.; Che, W.; Zhang, L.; Zhong, L.; Zhang, Y.; Streets, D. Speciated VOC Emission Inventory and Spatial Patterns of Ozone Formation Potential in the Pearl River Delta, China. Environ. Sci. Technol. 2009, 43, 8580–8586. [Google Scholar] [CrossRef] [PubMed]
- Wang, D.; Du, J.; Yang, L.; Zhao, J.; Zhang, X.; Zhang, Z.; Zhao, W.; Zhang, W.; Zhang, Y.; Ma, J.; et al. Identifying omitted high reactive VOCs emission sources in China based on new speciated emission inventory. J. Clean. Prod. 2025, 524, 146471. [Google Scholar] [CrossRef]
- Lu, X.; Zhang, D.; Wang, L.; Wang, S.; Zhang, X.; Liu, Y.; Chen, K.; Song, X.; Yin, S.; Zhang, R.; et al. Establishment and verification of anthropogenic speciated VOCs emission inventory of Central China. J. Environ. Sci. 2025, 149, 406–418. [Google Scholar] [CrossRef]
- Yan, Y.; Peng, L.; Li, R.; Li, Y.; Li, L.; Bai, H. Concentration, ozone formation potential and source analysis of volatile organic compounds (VOCs) in a thermal power station centralized area: A study in Shuozhou, China. Environ. Pollut. 2017, 223, 295–304. [Google Scholar] [CrossRef]
- Wang, H.L.; Gao, Y.Q.; Jing, S.A.; Lou, S.R.; Hu, Q.Y.; An, J.Y.; Wu, Y.H.; Gao, W.; Zhu, L.; Huang, C. Characterization of Volatile Organic Compounds (VOCs) Using Mobile Monitoring Around the Industrial Parks in the Yangzte River Delta Region of China. Huan Jing Ke Xue 2021, 42, 1298–1305. [Google Scholar] [CrossRef]
- Lu, Y.; Pang, X.; Lyu, Y.; Li, J.; Xing, B.; Chen, J.; Mao, Y.; Shang, Q.; Wu, H. Characteristics and sources analysis of ambient volatile organic compounds in a typical industrial park: Implications for ozone formation in 2022 Asian Games. Sci. Total Environ. 2022, 848, 157746. [Google Scholar] [CrossRef]
- Lv, Y.; Li, X.; Xu, T.T.; Cheng, T.T.; Yang, X.; Chen, J.M.; Iinuma, Y.; Herrmann, H. Size distributions of polycyclic aromatic hydrocarbons in urban atmosphere: Sorption mechanism and source contributions to respiratory deposition. Atmos. Chem. Phys. 2016, 16, 2971. [Google Scholar]
- Liu, C.; Xin, Y.; Zhang, C.; Liu, J.; Liu, P.; He, X.; Mu, Y. Ambient volatile organic compounds in urban and industrial regions in Beijing: Characteristics, source apportionment, secondary transformation and health risk assessment. Sci. Total Environ. 2023, 855, 158873. [Google Scholar] [CrossRef] [PubMed]
- Qin, J.; Wang, X.; Yang, Y.; Qin, Y.; Shi, S.; Xu, P.; Chen, R.; Zhou, X.; Tan, J.; Wang, X. Source apportionment of VOCs in a typical medium-sized city in North China Plain and implications on control policy. J. Environ. Sci. 2021, 107, 26–37. [Google Scholar] [CrossRef] [PubMed]
- Zheng, H.; Kong, S.; Chen, N.; Niu, Z.; Zhang, Y.; Jiang, S.; Yan, Y.; Qi, S. Source apportionment of volatile organic compounds: Implications to reactivity, ozone formation, and secondary organic aerosol potential. Atmos. Res. 2021, 249, 105344. [Google Scholar] [CrossRef]
- Meng, Y.; Song, J.; Zeng, L.; Zhang, Y.; Zhao, Y.; Liu, X.; Guo, H.; Zhong, L.; Ou, Y.; Zhou, Y.; et al. Ambient volatile organic compounds at a receptor site in the Pearl River Delta region: Variations, source apportionment and effects on ozone formation. J. Environ. Sci. 2022, 111, 104–117. [Google Scholar] [CrossRef]
- Liu, Y.; Kong, L.; Liu, X.; Zhang, Y.; Li, C.; Zhang, Y.; Zhang, C.; Qu, Y.; An, J.; Ma, D.; et al. Characteristics, secondary transformation, and health risk assessment of ambient volatile organic compounds (VOCs) in urban Beijing, China. Atmos. Pollut. Res. 2021, 12, 33–46. [Google Scholar] [CrossRef]
- Li, Y.; Liu, Y.; Hou, M.; Huang, H.; Fan, L.; Ye, D. Characteristics and sources of volatile organic compounds (VOCs) in Xinxiang, China, during the 2021 summer ozone pollution control. Sci. Total Environ. 2022, 842, 156746. [Google Scholar] [CrossRef]
- Abeleira, A.; Pollack, I.B.; Sive, B.; Zhou, Y.; Fischer, E.V.; Farmer, D.K. Source characterization of volatile organic compounds in the Colorado Northern Front Range Metropolitan Area during spring and summer 2015. J. Geophys. Res. Atmos. 2017, 122, 3595–3613. [Google Scholar] [CrossRef]
- Mo, Z.; Shao, M.; Lu, S.; Niu, H.; Zhou, M.; Sun, J. Characterization of non-methane hydrocarbons and their sources in an industrialized coastal city, Yangtze River Delta, China. Sci. Total Environ. 2017, 593, 641–653. [Google Scholar] [CrossRef]
- Lyu, Y.; Gao, Y.; Pang, X.; Sun, S.; Luo, P.; Cai, D.; Qin, K.; Wu, Z.; Wang, B. Elucidating contributions of volatile organic compounds to ozone formation using random forest during COVID-19 pandemic: A case study in China. Environ. Pollut. 2024, 346, 123532. [Google Scholar] [CrossRef]
- Wang, S.G.; Zhao, Y.; Han, Y.; Li, R.; Fu, H.; Gao, S.; Duan, Y.; Zhang, L.; Chen, J.J.A.E. Spatiotemporal variation, source and secondary transformation potential of volatile organic compounds (VOCs) during the winter days in Shanghai, China. Atmos. Environ. 2022, 286, 119203. [Google Scholar]
- Hui, L.; Liu, X.; Tan, Q.; Feng, M.; An, J.; Qu, Y.; Zhang, Y.; Jiang, M. Characteristics, source apportionment and contribution of VOCs to ozone formation in Wuhan, Central China. Atmos. Environ. 2018, 192, 55–71. [Google Scholar] [CrossRef]
- Gu, S.; Guenther, A.; Faiola, C. Effects of Anthropogenic and Biogenic Volatile Organic Compounds on Los Angeles Air Quality. Environ. Sci. Technol. 2021, 55, 12191–12201. [Google Scholar] [CrossRef]
- Atkinson, R.; Arey, J. Atmospheric Degradation of Volatile Organic Compounds. Chem. Rev. 2003, 103, 4605–4638. [Google Scholar] [CrossRef]
- Wang, T.; Xue, L.; Brimblecombe, P.; Lam, Y.F.; Li, L.; Zhang, L. Ozone pollution in China: A review of concentrations, meteorological influences, chemical precursors, and effects. Sci. Total Environ. 2017, 575, 1582–1596. [Google Scholar] [CrossRef] [PubMed]
- Huang, R.-J.; Zhang, Y.; Bozzetti, C.; Ho, K.-F.; Cao, J.-J.; Han, Y.; Daellenbach, K.R.; Slowik, J.G.; Platt, S.M.; Canonaco, F.; et al. High secondary aerosol contribution to particulate pollution during haze events in China. Nature 2014, 514, 218–222. [Google Scholar] [CrossRef] [PubMed]
- Zhang, L.; Wang, X.; Li, H.; Cheng, N.; Zhang, Y.; Zhang, K.; Li, L. Variations in Levels and Sources of Atmospheric VOCs during the Continuous Haze and Non-Haze Episodes in the Urban Area of Beijing: A Case Study in Spring of 2019. Atmosphere 2021, 12, 171. [Google Scholar] [CrossRef]
- Shao, P.; An, J.; Xin, J.; Wu, F.; Wang, J.; Ji, D.; Wang, Y. Source apportionment of VOCs and the contribution to photochemical ozone formation during summer in the typical industrial area in the Yangtze River Delta, China. Atmos. Res. 2016, 176–177, 64–74. [Google Scholar] [CrossRef]
- Joshi, D.; Adhikari, N. An Overview on Common Organic Solvents and Their Toxicity. J. Pharm. Res. Int. 2019, 28, 1–18. [Google Scholar] [CrossRef]
- Harrison, J.J. New and improved infrared absorption cross sections for trichlorofluoromethane (CFC-11). Atmos. Meas. Tech. 2018, 11, 5827–5836. [Google Scholar] [CrossRef]
- Yu, S.; Xue, C.; Deng, F.; Xu, Q.; Zhao, B. VOCs Concentration, SOA Formation Contribution and Festival Effects during Heavy Haze Event: A Case Study in Zhengzhou, Central China. Atmosphere 2024, 15, 1009. [Google Scholar] [CrossRef]
- Wang, S.; Shao, P.; Yang, X.; Wu, J.; Zhang, S.; Zeng, S.; Fan, J.; Ni, C.; Wang, S. Impact of photochemistry on wintertime haze in the Southern Sichuan Basin, China. Atmos. Pollut. Res. 2024, 15, 102300. [Google Scholar] [CrossRef]
- Rossabi, S.; Helmig, D. Changes in Atmospheric Butanes and Pentanes and Their Isomeric Ratios in the Continental United States. J. Geophys. Res. Atmos. 2018, 123, 3772–3790. [Google Scholar] [CrossRef]
- Brocco, D.; Fratarcangeli, R.; Lepore, L.; Petricca, M.; Ventrone, I. Determination of aromatic hydrocarbons in urban air of Rome. Atmos. Environ. 1997, 31, 557–566. [Google Scholar] [CrossRef]
- So, K.L.; Wang, T. C3–C12 non-methane hydrocarbons in subtropical Hong Kong: Spatial–temporal variations, source–receptor relationships and photochemical reactivity. Sci. Total Environ. 2004, 328, 161–174. [Google Scholar] [CrossRef] [PubMed]
- Kuntasal, Ö.O.; Kılavuz, S.A.; Karman, D.; Wang, D.; Tuncel, G. C5–C12 volatile organic compounds at roadside, residential, and background locations in Ankara, Turkey: Temporal and spatial variations and sources. J. Air Waste Manag. Assoc. 2013, 63, 1148–1162. [Google Scholar] [CrossRef] [PubMed]
- Yurdakul, S.; Civan, M.; Kuntasal, Ö.; Doğan, G.; Pekey, H.; Tuncel, G. Temporal variations of VOC concentrations in Bursa atmosphere. Atmos. Pollut. Res. 2018, 9, 189–206. [Google Scholar] [CrossRef]
- Paglione, M.; Kiendler-Scharr, A.; Mensah, A.A.; Finessi, E.; Giulianelli, L.; Sandrini, S.; Facchini, M.C.; Fuzzi, S.; Schlag, P.; Piazzalunga, A.; et al. Identification of humic-like substances (HULIS) in oxygenated organic aerosols using NMR and AMS factor analyses and liquid chromatographic techniques. Atmos. Chem. Phys. 2014, 14, 25–45. [Google Scholar] [CrossRef]
- Song, M.; Tan, Q.; Feng, M.; Qu, Y.; Liu, X.; An, J.; Zhang, Y. Source Apportionment and Secondary Transformation of Atmospheric Nonmethane Hydrocarbons in Chengdu, Southwest China. J. Geophys. Res. Atmos. 2018, 123, 9741–9763. [Google Scholar] [CrossRef]
- Zhu, B.; Zhong, X.; Cai, W.; Shi, C.; Shao, X.; Chen, Z.; Yang, J.; Chen, Y.; Ni, E.; Guo, S.; et al. Characterization of VOC source profiles, chemical reactivity, and cancer risk associated with petrochemical industry processes in Southeast China. Atmos. Environ. X 2024, 21, 100236. [Google Scholar] [CrossRef]
- Wang, S.; Zhang, J.; Zhang, Y.; Wang, L.; Sun, Z.; Wang, H. Review on Source Profiles of Volatile Organic Compounds (VOCs) in Typical Industries in China. Atmosphere 2023, 14, 878. [Google Scholar] [CrossRef]
- Cai, C.; Geng, F.; Tie, X.; Yu, Q.; An, J. Characteristics and source apportionment of VOCs measured in Shanghai, China. Atmos. Environ. 2010, 44, 5005–5014. [Google Scholar] [CrossRef]
- Lobert, J.M.; Scharffe, D.H.; Hao, W.-M.; Kuhlbusch, T.A.; Seuwen, R.; Warneck, P.; Crutzen, P.J. Experimental Evaluation of Biomass Burning Emissions: Nitrogen and Carbon Containing Compounds. In Global Biomass Burning: Atmospheric, Climatic, and Biospheric Implications; Levine, J.S., Ed.; The MIT Press: Cambridge, MA, USA, 1991. [Google Scholar]
- Ling, Z.H.; Guo, H.; Cheng, H.R.; Yu, Y.F. Sources of ambient volatile organic compounds and their contributions to photochemical ozone formation at a site in the Pearl River Delta, southern China. Environ. Pollut. 2011, 159, 2310–2319. [Google Scholar] [CrossRef]
- Liu, Y.; Shao, M.; Fu, L.; Lu, S.; Zeng, L.; Tang, D. Source profiles of volatile organic compounds (VOCs) measured in China: Part I. Atmos. Environ. 2008, 42, 6247–6260. [Google Scholar] [CrossRef]
- Wu, F.; Yu, Y.; Sun, J.; Zhang, J.; Wang, J.; Tang, G.; Wang, Y. Characteristics, source apportionment and reactivity of ambient volatile organic compounds at Dinghu Mountain in Guangdong Province, China. Sci. Total Environ. 2016, 548–549, 347–359. [Google Scholar] [CrossRef] [PubMed]
- Barletta, B.; Meinardi, S.; Sherwood Rowland, F.; Chan, C.-Y.; Wang, X.; Zou, S.; Yin Chan, L.; Blake, D.R. Volatile organic compounds in 43 Chinese cities. Atmos. Environ. 2005, 39, 5979–5990. [Google Scholar] [CrossRef]
- Chan, L.-Y.; Chu, K.-W.; Zou, S.-C.; Chan, C.-Y.; Wang, X.-M.; Barletta, B.; Blake, D.R.; Guo, H.; Tsai, W.-Y. Characteristics of nonmethane hydrocarbons (NMHCs) in industrial, industrial-urban, and industrial-suburban atmospheres of the Pearl River Delta (PRD) region of south China. J. Geophys. Res. Atmos. 2006, 111, D11304. [Google Scholar] [CrossRef]
- Liu, B.; Liang, D.; Yang, J.; Dai, Q.; Bi, X.; Feng, Y.; Yuan, J.; Xiao, Z.; Zhang, Y.; Xu, H. Characterization and source apportionment of volatile organic compounds based on 1-year of observational data in Tianjin, China. Environ. Pollut. 2016, 218, 757–769. [Google Scholar] [CrossRef]
- Ou, J.; Guo, H.; Zheng, J.; Cheung, K.; Louie, P.K.K.; Ling, Z.; Wang, D. Concentrations and sources of non-methane hydrocarbons (NMHCs) from 2005 to 2013 in Hong Kong: A multi-year real-time data analysis. Atmos. Environ. 2015, 103, 196–206. [Google Scholar] [CrossRef]
- Shen, L.; Xiang, P.; Liang, S.; Chen, W.; Wang, M.; Lu, S.; Wang, Z. Sources Profiles of Volatile Organic Compounds (VOCs) Measured in a Typical Industrial Process in Wuhan, Central China. Atmosphere 2018, 9, 297. [Google Scholar] [CrossRef]
- Dumanoglu, Y.; Kara, M.; Altiok, H.; Odabasi, M.; Elbir, T.; Bayram, A. Spatial and seasonal variation and source apportionment of volatile organic compounds (VOCs) in a heavily industrialized region. Atmos. Environ. 2014, 98, 168–178. [Google Scholar] [CrossRef]
- Huang, X.-F.; Zhang, B.; Xia, S.-Y.; Han, Y.; Wang, C.; Yu, G.-H.; Feng, N. Sources of oxygenated volatile organic compounds (OVOCs) in urban atmospheres in North and South China. Environ. Pollut. 2020, 261, 114152. [Google Scholar] [CrossRef] [PubMed]
- McDonald, B.C.; de Gouw, J.A.; Gilman, J.B.; Jathar, S.H.; Akherati, A.; Cappa, C.D.; Jimenez, J.L.; Lee-Taylor, J.; Hayes, P.L.; McKeen, S.A.; et al. Volatile chemical products emerging as largest petrochemical source of urban organic emissions. Science 2018, 359, 760–764. [Google Scholar] [CrossRef]
- Manavi, S.E.I.; Pandis, S.N. Contribution of intermediate-volatility organic compounds from on-road transport to secondary organic aerosol levels in Europe. Atmos. Chem. Phys. 2024, 24, 891–909. [Google Scholar] [CrossRef]
- Borbon, A.; Gilman, J.B.; Kuster, W.C.; Grand, N.; Chevaillier, S.; Colomb, A.; Dolgorouky, C.; Gros, V.; Lopez, M.; Sarda-Esteve, R.; et al. Emission ratios of anthropogenic volatile organic compounds in northern mid-latitude megacities: Observations versus emission inventories in Los Angeles and Paris. J. Geophys. Res. Atmos. 2013, 118, 2041–2057. [Google Scholar] [CrossRef]
- Bari, M.A.; Kindzierski, W.B. Ambient volatile organic compounds (VOCs) in Calgary, Alberta: Sources and screening health risk assessment. Sci. Total Environ. 2018, 631–632, 627–640. [Google Scholar] [CrossRef]
- Na, K.; Kim, Y.P.; Moon, K.C. Diurnal characteristics of volatile organic compounds in the Seoul atmosphere. Atmos. Environ. 2003, 37, 733–742. [Google Scholar] [CrossRef]
- Wu, R.; Xie, S. Spatial Distribution of Ozone Formation in China Derived from Emissions of Speciated Volatile Organic Compounds. Environ. Sci. Technol. 2017, 51, 2574–2583. [Google Scholar] [CrossRef]


Disclaimer/Publisher’s Note: The statements, opinions and data contained in all publications are solely those of the individual author(s) and contributor(s) and not of MDPI and/or the editor(s). MDPI and/or the editor(s) disclaim responsibility for any injury to people or property resulting from any ideas, methods, instructions or products referred to in the content. |
© 2025 by the authors. Licensee MDPI, Basel, Switzerland. This article is an open access article distributed under the terms and conditions of the Creative Commons Attribution (CC BY) license (https://creativecommons.org/licenses/by/4.0/).