Abstract
In the context of global warming, hydroclimatic conditions in the monsoon marginal zone are governed by two primary drivers: the East Asian monsoon and the westerly winds. As a sensitive indicator of climatic change, this region experiences disproportionately amplified adverse effects of climate change are markedly amplified, positioning it as a focal area for climatological research. However, the limited temporal coverage of instrumental records poses significant challenges for understanding historical hydroclimatic variability and its underlying mechanisms. To address this limitation, tree-ring width indices derived from 73 cores of Styphnolobium japonicum ((L.) Schott (1830)) are hereby employed to reconstruct summer maximum temperatures over a 433-year period in the central monsoon fringe zone—specifically, the northwestern Yan Mountains. Results confirm a strong correlation between the tree-ring width index of Styphnolobium japonicum and local summer maximum temperatures (r = 0.770, p < 0.01). Compared to the 19th century, the frequency of temperature fluctuations has increased substantially, with four abrupt regime shifts identified in the reconstructed series (1707, 1817, 1878, and 1994). Spectral analysis reveals cyclical patterns at interannual (2–7 years), decadal (10–30 years), and multidecadal (50 years) timescales. These oscillations align closely with known climate modes, including the EI Niño–Southern Oscillation (ENSO), the Pacific Decadal Oscillation (PDO), and the Atlantic Multidecadal Oscillation (AMO). Among them, the AMO presents particularly strong coherence with the reconstructed temperature variability. These outcomes improve insights into long-term temperature dynamics in the region and highlight the value of dendroclimatic proxies in reconstructing past climate conditions.
1. Introduction
In the context of global warming, the influence of human activities on climate change has become increasingly apparent, accompanied by heightened climate instability and a rising frequency of extreme weather events. Such events have drawn widespread scientific attention globally [1,2]. Extreme temperature fluctuations are currently recognised as a critical driver affecting ecosystems, agricultural productivity, and societal well-being. In particular, episodes of extreme warming have been shown to exacerbate drought conditions [3,4,5], accelerate glacial retreat [6,7,8], and increase the likelihood of flood occurrences [9,10]. These cascading impacts outlined herein constitute a foremost environmental challenge facing humanity at present.
Existing observational data have indicated steadily rising global temperatures since the 20th century, with projections suggesting a potential increase of 1.5 °C by 2040 [11]. These trends imply that the uncertainties associated with global warming amplify the risk of hydrometeorological disasters. Therefore, it is imperative to study long-term historical temperature variability and understand its patterns, particularly in the context of pronounced temperature fluctuations.
Instrumental hydrological and climatic datasets available to date are relatively brief, constraining their utility for examining long-term climate change. For example, China experienced a severe three-year drought in the mid-to-late 19th century [12], while studies conducted in Central Asia underscore the significant limitations of relying solely on instrumental data to analyse centennial-scale hydrological cycles in the Ili River basin [13]. Consequently, it has become an urgent priority to identify reliable proxy indicators that can reconstruct long-term hydrological and climatic records.
Tree rings, boasting high temporal resolution at annual to decadal scales, are extensively considered an excellent proxy for reconstructing past climate conditions [14,15,16]. The process of recording tree age and growth trends is not the only function of these records; environmental changes during the tree’s lifespan are also preserved. Due to their precise dating, strong continuity, high resolution, and reconstruction accuracy, tree-ring indicators are extensively employed for reconstructing hydrologic and climatic variables such as temperature and runoff. Examples include the utilisation of tree-ring width to reconstruct May minimum temperatures in Northeast China dating back to 1797 [17], and tree-ring density to reconstruct the maximum late-summer temperatures on the Tibetan Plateau over the past 700 years [18]. In the Tibetan plateau, tree-ring widths have been measured to reconstruct almost 400 years of runoff [19]. In recent years, the incorporation of tree-ring stable isotopes (hydrogen and oxygen) [20,21,22] and quantitative wood anatomy [23,24,25] as reliable proxies in hydroclimatic reconstructions has also been demonstrated. These approaches can capture longer-term climate histories and are frequently highly sensitive to climatic variation.
Extensive research indicates that decadal variations in global surface temperatures are primarily influenced by the Atlantic Multidecadal Oscillation (AMO) and the Pacific Decadal Oscillation (PDO) [26,27,28,29]. As hypothesised by some researchers, the PDO functions as a key driver of decadal fluctuations in surface temperatures, indicating its capability of explaining deceleration and acceleration phenomena during global warming processes. However, other research suggests that, in comparison with the AMO, the PDO exerts a comparatively negligible influence on global mean temperature variations [30]. Nevertheless, there is a paucity of tree-ring records that document temperature responses to AMO and PDO in the Yan Mountains region. In addition, an analysis of extant data indicates that research into tree-ring climate reconstruction within domestic contexts has been predominantly focused on the Tibetan Plateau [31,32], Xinjiang [33], and the Greater Khingan Range [34,35]. Consequently, precise, reliable, long-term tree-ring chronologies should be necessarily established, and climate reconstructions should be conducted to facilitate a more profound comprehension of the patterns and factors that influence climate variability and change in the Yan Mountains.
The Yan Mountains, located at the northern periphery of the North China Plain, represent a pivotal geographical boundary and ecological transition zone between the North China Plain and the Inner Mongolia Plateau [36]. As a key region within the monsoon fringe zone, the Yan Mountains exhibit high sensitivity to climate variability and change. The climate system of the Yan Mountains directly affects the ecological security of the North China Plain, and this influence is a critical consideration in any discourse on the region’s environmental stability. Huailai County is located within an intermontane basin in the northwestern segment of the Yan Mountains. The region is distinguished by the presence of distinct seasons, characterised by cold, dry winters and hot, rainy summers. Precipitation demonstrates high interannual variability and uneven spatial distribution, which is strongly influenced by the alternating control of the East Asian monsoon system (particularly the southeasterly summer monsoon) and the Mongolian High (northwesterly winter monsoon).
Meanwhile, the ancient Styphnolobium japonicum ((L.) Schott, 1830) communities of Huailai County have been preserved, and are characterised by their great age and minimal anthropogenic disturbance. Evidently, these characteristics render this species an optimal candidate for the present dendroclimatological study. Consequently, the majority of tree-ring core samples were hereby collected from these well-preserved ancient tree communities within the Yan Mountains, supplemented by a limited number of isolated individuals from temple grounds and rural settlements.
This study seeks to: (1) establish a 433-year tree-ring width chronology for the Yan Mountains in Hebei Province, with a view to evaluating its accuracy and reliability; (2) determine the climatic sensitivity of the chronology; (3) reconstruct summer maximum temperatures in the Yan Mountains to reveal long-term temperature patterns in the study area, and analyse the relationship between temperature fluctuations and historical events; and (4) delve into the primary factors influencing the climate of the Yan Mountains and their response to large-scale ocean-atmosphere circulation systems.
2. Materials and Methods
2.1. Study Area Overview
The sampling area is located in Huailai County, Zhangjiakou City, Hebei Province, on the northwestern edge of the Yan Mountains (Figure 1). Located in the central monsoon transition zone, the study region has a warm temperate continental monsoon climate with distinct seasons: summers are hot and rainy, while winters are cold and dry. The spring and autumn seasons are relatively short. What stands out is that it experiences significant daily temperature fluctuations and uneven precipitation distribution, heavily shaped by monsoon dynamics and topographical effects. Annual average precipitation here amounts to approximately 700 mm.
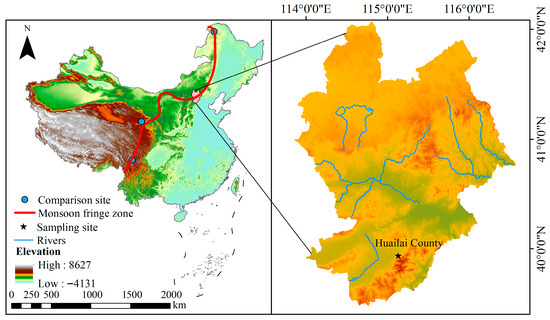
Figure 1.
Geographical overview of the study area.
2.2. Tree-Ring Data Collection
The sampling process was conducted strictly following the established collection standards of the International Tree-Ring Data Bank (ITRDB) [37]. A particular emphasis was placed on selecting trees growing in stable environments, with no evident indications of insect infestation or physical damage. Two cores were extracted from each tree at breast height (approximately 1.3 m above ground) in different directions. Ultimately, total of 38 trees and 76 cores were collected for the study. The sampling process was executed in August 2024.
The cores were labelled and stored in PVC tubes prior to being air-dried in a cool, well-ventilated area. Subsequently, the samples were meticulously sanded using a range of grits, each varying in coarseness, until the boundaries of the tree rings became distinctly discernible. Ring-width measurements were performed using WinDENDRO software (v. 2022a) with an accuracy of 0.01 mm. The cross-dating quality was subjected to verification using the COFECHA programme [38], an internationally recognised tool. Following the screening process, cores failing to meet the required standards or those found to be inconsistent with the master sequence were excluded. This process yielded a final set of 73 Styphnolobium japonicum cores, which were used to develop chronologies.
2.3. Climate Data Acquisition
The meteorological data utilised in this study were sourced from the Huailai County Meteorological Station in Zhangjiakou City, Hebei Province. The dataset encompasses the monthly averages, maximums, and minimums of temperature and precipitation from 1954 to 2023 (Figure 2). The data were sourced from the China National Meteorological Centre (http://data.cma.cn/ (accessed on 10 April 2025)). The data for the three climate mode indices—the Atlantic Multidecadal Oscillation (AMO) (1861–2022), the Pacific Decadal Oscillation (PDO) (1854–2022) and the EI Niño–Southern Oscillation (ENSO) (1948–2020)—were obtained from the National Oceanic and Atmospheric Administration (NOAA).
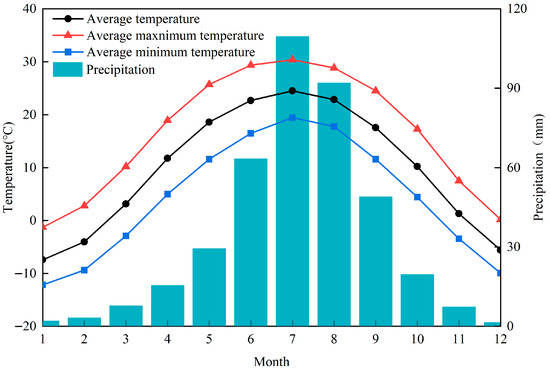
Figure 2.
Monthly average of four climate variables.
2.4. Data Processing Methods
- (1)
- The tree-ring width chronology was developed by applying negative exponential curves in the ARSTAN (v.49M2) programme, a process referred to as detrending. The procedure was applied to remove the age-related growth trend, whilst endeavouring to preserve low-frequency climate signals to the greatest extent [39]:
The formula for a negative exponential function could be expressed as:
where y(t) represents the predicted annual ring index at year t; a and b are parameters fitted using nonlinear least squares (a denotes initial growth rate; b denotes decay rate); and t denotes tree age (years).
- (2)
- The detrended ring-width series were averaged to generate a chronology, using the biweight robust mean method. To ascertain the minimum replication threshold for the chronology, the Subsample Signal Strength (SSS) criterion was utilised. The period with SSS values exceeding 0.85 was designated as the reliable interval, thereby ensuring both the reliability of the reconstructed series and the maximum possible temporal coverage. Both a Standard (STD) chronology and a Residual (RES) chronology were developed. The STD chronology was selected for analysis to maximise the retention of potential low-frequency climate signals that may arise from the inherent persistence of the climate system. Such signals may include drought legacy effects or large-scale climate modes. The quality of the standard chronology was evaluated by means of statistical analysis, the results of which included the mean sensitivity and the signal-to-noise ratio.
The formula for calculating the SSS could be given by:
where n represents the size of the sub-sample, and N represents the size of the overall sample, is average correlation coefficient between trees.
- (3)
- Pearson correlation analysis was performed using [40] to assess correlations between the aforementioned hydrometeorological data and the standardised Styphnolobium japonicum width chronology. Given the robust correlation between summer maximum temperatures and the standardised chronology (r = 0.770, p < 0.01), a reconstructed historical summer maximum temperature sequence was selected for further analysis.
- (4)
- The summer maximum temperature sequence for the study area was reconstructed using a linear regression model [41].
- (5)
- The stability and reliability of the reconstructed model were systematically evaluated using the split-simple [42]. The statistical assessment framework incorporated core accuracy metrics including Pearson correlation coefficient (r), coefficient of determination (R2), adjusted coefficient of determination (R2adj), reduction in error (RE), and coefficient of efficiency (CE). Additionally, sign tests (ST) were carried out to validate the consistency of trend changes. To examine whether model residuals conformed to regression assumptions, the Durbin-Watson test (DW) was employed to diagnose the independence of residuals derived from the calibrated models across each subinterval, thereby validating the fundamental assumptions of the regression models. The conventional two-interval division fails to fully capture the low-decadal fluctuations between climate and growth dynamics. In this study, the entire study period is subdivided into four intervals to detect abrupt temperature shifts and identify corresponding trend variations. Considering that shorter intervals may yield excessively high RE and CE values, the present analysis was supplemented with leave-one-out cross-validation to verify the stability of the reconstruction model [43,44,45].
- (6)
- The Mann–Kendall trend test [46] was conducted to identify abrupt transition years in reconstructed temperature series. This approach eliminates the requirement for data to conform to a normal distribution, rendering it especially well-suited for testing temperature and precipitation datasets.
- (7)
- To delve into the trend of reconstructed temperature series, Z-source [47] was employed to standardise the reconstructed series.where T represents the reconstructed temperature sequence value, MN denotes the reconstructed mean value, and SD indicates the standard deviation.Z-score = (T − MN)/SD
- (8)
- The coefficient of variation (Cv) [48] indicates the frequency and magnitude of temperature variations:Cv = |SD/MN|
- (9)
- The periodic variation characteristics of temperature series were reconstructed by integrating Morlet wavelet analysis with MTM multi-window spectral analysis.
The wavelet analysis formula could be expressed as:
where f(t) is the original signal, ψ(t) is the mother wavelet, a is the scale parameter, b is the shift parameter, and ψ* is the complex conjugate of the mother wavelet.
- (10)
- A cold/warm period was defined as a sequence of two or more consecutive years where temperatures were consistently classified into the same category. Specifically, a warm year was identified as one with temperatures exceeding mean + 1σ, and a cold year as one with temperatures below mean − 1σ. Here, σ represents the standard deviation.
3. Results and Analysis
3.1. Chronology Construction and Validation
A 433-year standardised tree-ring chronology for the northern Yan Mountains was constructed using the Styphnolobium japonicum width index (Figure 3). The reliability of the reconstructed chronology was validated using relevant statistical indicators (Table 1), demonstrating a significant relationship between Styphnolobium japonicum width and climate indicators.
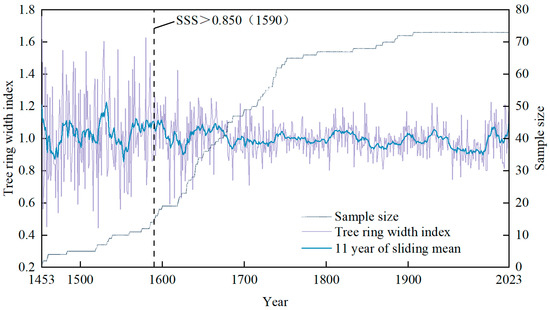
Figure 3.
Characteristics of standardised chronologies. Note: SSS is subsample signal strength.

Table 1.
Statistical indicators and statistical values of STD chronology.
3.2. Relationship Between Tree Radial Growth and Climate
In the Northern Hemisphere, seasonal temperatures during the growing season have been identified as key factors affecting xylem cell production and differentiation [49,50]. It has been previously demonstrated that temperatures from June to August represent a critical climatic factor in the radial growth of Pinus massoniana [51]. Herein, a significant positive correlation (p < 0.05) between radial growth and temperature from May to September was observed. The analysis also revealed a robust correlation between tree-ring width and maximum summer temperature, involving a high degree of statistical significance (r = 0.770, p < 0.01). Collectively, these findings underscore the pivotal role of summer temperature in the radial growth of Styphnolobium japonicum. Moreover, it has been demonstrated that both wood cell size and tree-ring width are principally influenced by growing season temperature.
In contrast to temperature, precipitation exhibited a negative correlation with tree growth across all temporal scales. This finding suggests that precipitation plays a secondary regulatory role in the study area. As demonstrated in Figure 4, while the period of peak precipitation was typically observed to be in July–August, the combined effects of persistently low temperatures and scarce rainfall during the early growing season (particularly from early spring to early summer) depleted soil moisture reserves. Consequently, even substantial precipitation in July–August failed to provide sufficient water supply to meet the demands of vigorous tree growth. This water deficit has been shown to ultimately slow metabolic activity and shorten the effective growing season. Furthermore, the correlation between winter precipitation and tree growth was found to be more pronounced compared to that between precipitation in other seasons and tree growth. This suggests that, in cold and dry conditions, precipitation rather than temperature functions as the primary factor influencing tree growth.
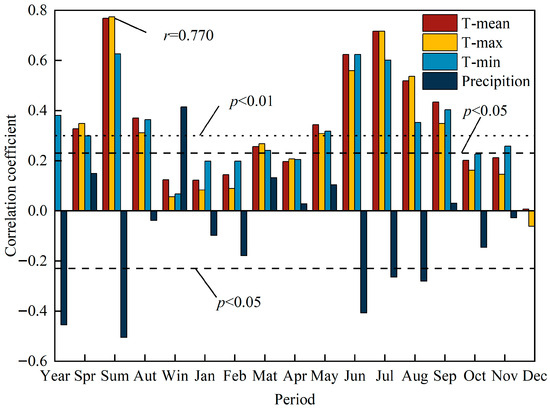
Figure 4.
Correlation between chronology and climate factors.
3.3. Summer Maximum Temperature Reconstruction and Analysis
3.3.1. Reconstruction of Summer Maximum Temperature
Based on correlation (r = 0.770, p < 0.01), a linear regression equation was established using existing summer maximum temperature data and width-normalised chronologies to reconstruct the historical summer maximum temperature sequence for the study area. The reconstructed equation could be expressed as:
where y represents the annual maximum summer temperature (°C); x denotes the annual tree-ring width index. r is the correlation coefficient between maximum summer temperature and the annual tree-ring width index; N indicates the length of observed maximum summer temperature data (years); R2 is the coefficient of determination; R2adj is the adjusted R2; F is the variance test for the reconstruction equation; and p is the significance value of the reconstruction equation.
y = 6.750x + 23.020
(r = 0.770, N = 69, R2 = 0.598, R2adj = 0.593, F = 10.521, p < 0.01)
Split-simple verification results (Table 2) demonstrated the robustness of the model’s performance, exhibiting a reduction in error (RE) values of 0.673 and 0.679 during the validation periods, accompanied by coefficient of efficiency (CE) values of 0.642 and 0.596, respectively. Moreover, both the first-difference sign test (ST1) and the sign test of original values (ST) were observed to achieve a significance level of 0.01. The Durbin-Watson (DW) statistic, a measure of serial autocorrelation in time series data, approximated the theoretical value of 2 in all sub-periods except 1954–1970, suggesting the absence of significant autocorrelation in model residuals. The leave-one-out cross-validation procedure was employed to assess the model’s stability, yielding an RE value of 0.575. Collectively, these verification statistics confirm the satisfactory stability and reliability of the reconstruction model for reconstructing the historical summer maximum temperature series (1954–2023) in the study region.
Table 2.
Characteristic parameters of the summer maximum temperature reconstruction equation.
A comparison between the reconstructed and observed temperature trends (Figure 5) revealed strong consistency in their overall patterns. Notably, around the 1990s, the reconstructed and instrumental series exhibited almost imperceptible variations. This strong congruence not only validates the high reliability of the reconstruction but also indicates that natural climate variability—not anthropogenic forcing—serves as the dominant driver of local temperature changes during the study period.
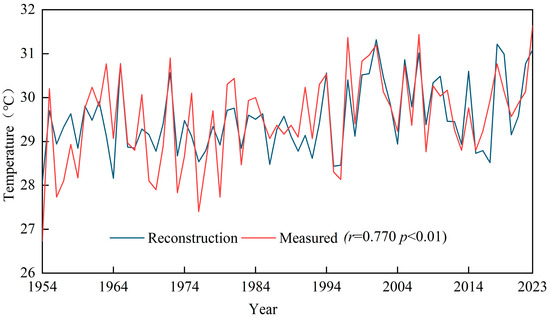
Figure 5.
Reconstructed versus Measured Summer Mean Maximum Temperature.
3.3.2. Feature Analysis of Summer Maximum Temperature Reconstruction
Figure 6a–c illustrates the temporal variation in the reconstructed summer maximum temperature series in the northern Yan Mountains from 1590 to 2023. The study area experienced three significant warming periods during the 433-year span: 1746–1753, 1870–1878, and 1994–2023, accompanied by four sustained cooling periods: 1621–1629, 1785–1789, 1800–1807, and 1935–1942.
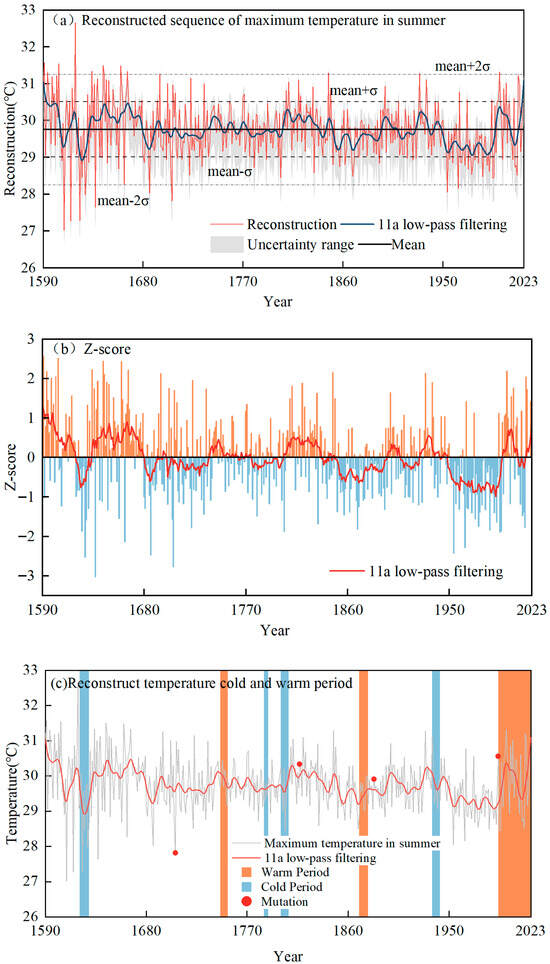
Figure 6.
Summer Maximum Temperature Reconstruction Series and Variability Characteristics in the Northwestern Yan Mountains.
Regarding the overall trend, warming accelerated significantly in the late 20th century. The warming rate was only 0.15 °C/decade from 1948 to 1969, but increased to 0.48 °C/decade from 1994 to 2023. This finding indicates that the observed global temperature rise over recent decades has exceeded the range of documented historical variability since the pre-industrial era by a substantial margin. In addition, the reconstruction also identified 49 years of below-mean temperatures (below the 1σ confidence interval) and 62 years of above-mean temperatures (above the 1σ confidence interval). On the interannual scale, extreme warm events were concentrated in the modern period: 2013 (+1.48 °C) and 2018 (+1.45 °C) were the warmest years, followed by 2016 (+1.38 °C) and 2017 (+1.35 °C). Conversely, cold events were more prevalent during the historical period, with the coldest year recorded being 1707 (−1.77 °C), followed by 1817 (−1.36 °C) and 1837 (−1.26 °C).
To further explore the characteristics of climate change, the Mann–Kendall (M-K) non-parametric statistical method was employed to detect abrupt temperature shifts. The results of the analysis identified four change points in the reconstructed series, which occurred in 1707, 1817, 1878, and 1986 (Figure 6c). The period 1610–1662 featured a stable 52-year cold phase, with summer maximum temperatures between 27.2 and 28.5 °C (1.3 °C below the long-term mean). The 11-year low-pass filtered curve demonstrated temperature fluctuations of merely ±0.6 °C (Cv = 9.2%), indicating low-amplitude climate variability. From 1663 to 1735, the climate transitioned into a phase of alternating warm and cold conditions, forming four significant oscillations with 15–20 year cycles: the warm period of 1665–1680 (peaking at 29.1 °C) alternated with the cold period of 1681–1700 (trough of 26.8 °C). The cold-to-warm transition, marked by a distinct change point in 1720, was accompanied by a gradual increase in temperature, with an average rise of 0.8 °C per decade. This warming trend endured for 86 years (1736–1821), with the median temperature rising to 29.6 °C, 1.2 °C above the baseline. A classic cold-warm oscillation characterised the period from the late 19th to the mid-20th century: a cold phase spanned 1876–1900 (encompassing seven extremely cold years), followed by a warm phase (1901–1925) that peaked at 31.2 °C. This constituted a complete cycle, after which a cooling trend occurred between 1926 and 1945, with the average temperature declining by 0.9 °C. The year 1981 was marked by intense temperature variability, with a Cv value surging to 31.7%. Subsequently, a period of four consecutive extremely warm years occurred from 1990 to 1998, involving a maximum temperature of 32.4 °C, which culminated in the series’ peak value in 1995. This pattern illustrated the warming trajectory since the industrial period, with an increase of 2.8 °C from 1600 to 2000.
To investigate the periodic oscillations and abrupt changes in the reconstructed summer maximum temperature sequence across multiple timescales, wavelet transform and MTM spectral analysis were employed [51]. The combination of wavelet contour lines and MTM spectra [Figure 7 and Figure 8] revealed three primary periodic variation scales in the reconstructed temperature sequence: 2–7 years, 10–30 years, and 40–70 years. The peak at the 50-year scale exhibited the highest amplitude, indicating this cycle’s most pronounced oscillations and establishing it as the dominant interannual temperature variation period in the northwestern Yan Mountains region. The remaining time scales were associated with the second and third principal cycles, respectively. The findings suggest that these three fundamental periodic fluctuations collectively regulate the variation characteristics of summer maximum temperatures in the study area across the entire 1590–2023 period. Within this timeframe, maximum temperature variations in the northwestern Yan Mountains exhibited quasi-periodicity, dominated by 40–70-year low-frequency oscillations. Furthermore, the reconstructed sequence displayed periodic oscillations at 10–30 years and 2–7 years. The 2–7-year cycle were observed to resemble the ENSO period, the 20-year cycle has been demonstrated to correlate with the PDO, and the 40–70-year cycle was evidenced to align with the AMO.
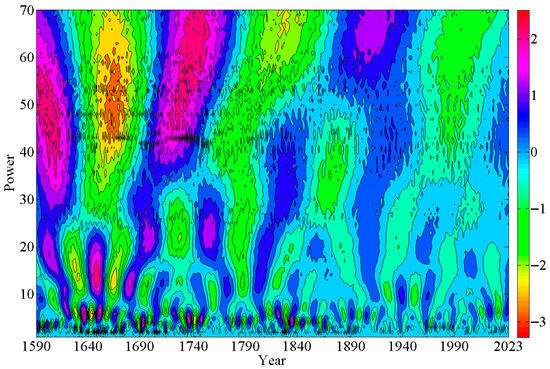
Figure 7.
Wavelet analysis plot of maximum temperature.
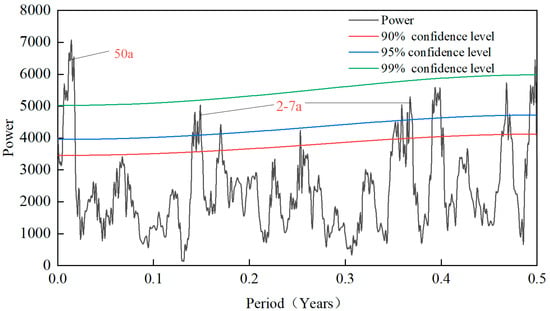
Figure 8.
MTM analysis of maximum temperature.
4. Discussion
4.1. Reconstructing the Relationship Between Temperature and Large-Scale Ocean-Atmosphere Circulation Modes
A comparative analysis was hereby conducted between the z-score values of the reconstructed temperature series and three major climate indices (Figure 9). This analysis revealed several correlations between the reconstructed series and the climate modes in question. These findings confirm the substantial effects of all three climate modes on climate variability in the study area. As indicated by earlier studies, the combined effect of ENSO and PDO could be a pivotal factor influencing temperature variability [52]. During specific phases of both phenomena, it is hypothesised that precipitation intensity in the monsoon marginal zone is enhanced, thereby increasing the probability of extreme precipitation events. Furthermore, phase shifts in the PDO have been demonstrated to modulate ENSO-related circulation patterns, correspondingly altering moisture transport processes associated with ENSO [53]. Specifically, during the warm phase of the ENSO, anomalous warming in the eastern equatorial Pacific weakens the zonal sea surface temperature gradient, which in turn reduces the intensity of the East Asian summer monsoon. This exerts a significant effect on moisture transport, yielding a 20–30% decrease in summer precipitation in the study area. Concurrently, changes in the meridional temperature gradient have been shown to cause winter temperatures to rise by 1.5–2.5 °C above normal, forming a compound climate mode characterised by “warm winters and dry summers.”
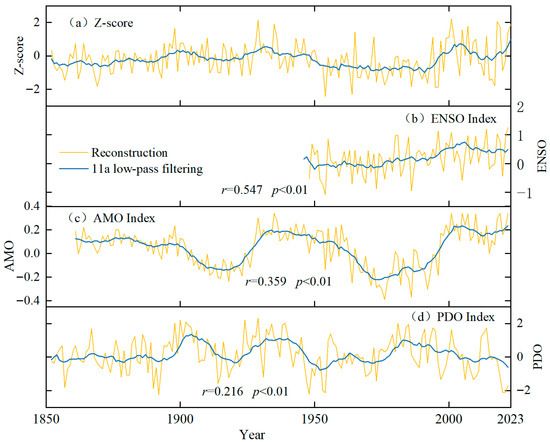
Figure 9.
Comparison Between Reconstructed Temperatures and Large-scale Ocean-Atmosphere Circulation Modes.
The negative phase of the PDO exerts an influence on the North Pacific Oscillation, thereby weakening the Aleutian Low and promoting a circulation pattern over Eurasia characterised by “high pressure in the west and low pressure in the east” [54]. This phenomenon is attributed to the facilitation of southward movement of cold Siberian air masses along a northwesterly path. Such a mechanism may facilitate a rationale for the observed decrease in winter temperatures in the study area during the 1945–1976 period (a sustained cold PDO phase) compared to the baseline period. Furthermore, the reconstructed temperature series demonstrates a modest positive correlation with the AMO index (r = 0.359, p < 0.01), indicating synchronised variability over decadal periods. To illustrate this point, consider the cold period in the reconstructed series during the 1960s–1980s. This period corresponds to a negative AMO phase, whereas the accelerated warming since 1990 aligns with a persistent positive AMO phase. The prevailing hypothesis, as evidenced by a preponderance of studies in the field, is that the warm phase of the AMO has the capacity to weaken the Siberian–Mongolian high-pressure system, thereby suppressing the intensity of the winter monsoon [55].
In summary, decadal-scale fluctuations in maximum temperatures in the study area are likely modulated by three climate modes in a concurrent manner: ENSO, PDO, and AMO. Amid intensifying global warming, the warm (positive) phases of these modes have generally strengthened, further accelerating the warming rate in the monsoon marginal zone and increasing the frequency of extreme high temperatures and irregular precipitation patterns. Future projections indicate a further intensification of the warming trend in the study area.
4.2. Comparison with Other Temperature Reconstruction Results
In order to further validate the reliability of the reconstruction, a comparison was carried out between the findings of the present study and temperature reconstructions derived from other tree species across different latitudes within the monsoon fringe zone. Specifically, the reconstructions selected for analysis were drawn from three regions: the Western Sichuan Plateau [56], the Qinghai–Tibet Plateau [57], and the Greater Khingan Range [35]. Trends and extreme temperatures among these four reconstructions were compared, as presented in Figure 10. The analysis indicated the series’ coincident periods of warming and cooling, with shared warm phases occurring during the 1600s–1610s, 1680s–1690s, 1825–1853, and 2010s–2023. As illustrated in Figure 10, all four reconstructions exhibited a pattern of initial decline followed by recovery around the 1930s, while the datasets showed a synchronous downward trend starting from the mid-20th century. However, the magnitude of this decline varied between the four regions, suggesting differential impacts of global warming across these regions. As the warming intensified, all subsequent reconstructions transitioned to a concurrent rise. Distinct fluctuations were observed during specific periods, which could be attributed to geographical and climatic variations among the sites. Furthermore, different tree species exhibited distinct temperature thresholds for root growth and varying water requirements, which could possibly contribute to interspecific response variations to climate signals.
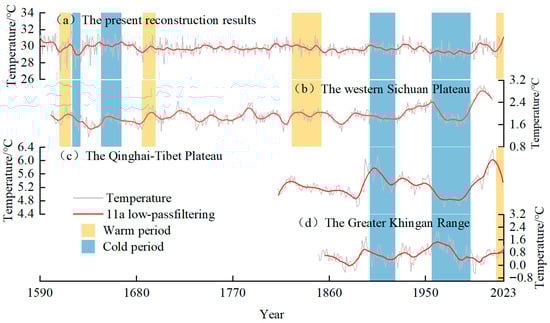
Figure 10.
Comparison with Other Studies.
4.3. Methodological Considerations and Limitations
During the calculation of statistical metrics for the split-period verification test, the Durbin-Watson (DW) statistic for the initial period in Table 2 falls below 1.5. This finding indicates that the selected confidence interval for the reconstructed series may be excessively narrow. A potential explanation for this phenomenon is that tree radial growth is not solely determined by climatic conditions of the current year; carbohydrate reserves accumulated in previous years can persistently influence the tree’s physiological status. Furthermore, the reconstructed series might retain low-frequency climate signals over certain intervals, leading to observed autocorrelation.
Future studies are thus recommended to incorporate additional tree-ring parameters, such as wood density and tracheid characteristics, to extract a more refined climate signal. Furthermore, while the reconstruction equation accounts for 59.8% of the variance, this also implies that temperature alone fails to fully explain the radial growth of Styphnolobium japonicum in the study area. Consequently, more intricate atmospheric circulation patterns should be incorporated in further research. This will facilitate a more comprehensive elucidation of the drivers of climate variability in the region.
5. Conclusions
- (1)
- Herein, Styphnolobium japonicum was collected to establish a tree-ring width chronology for the northwestern Yan Mountains spanning 1590–2023. The investigation was conducted to ascertain the correlation between tree-ring width and temperature/precipitation, so as to enhance public understanding of temperature variations in the Yan Mountains. The findings demonstrate a robust correlation between the radial growth of Styphnolobium japonicum in the designated study area and local summer maximum temperatures (r = 0.770, p < 0.01). This observation provides substantial insights into the growth conditions of trees and the historical hydrometeorological changes that have occurred.
- (2)
- The standardised tree-ring width chronology (STD chronology) of Styphnolobium japonicum was utilised to reconstruct over 400 years of historical summer maximum temperatures in the designated study area, demonstrating a high degree of reliability. The reconstructed series revealed significant climatic fluctuations in the northwestern Yan Mountains over the past four centuries, marked by distinct abrupt temperature changes and sustained cold/warm periods. Since the late 20th century, a marked warming trend has become pronounced, with the rate of warming in the study area exceeding the range of historical natural variability. This emphasises the exacerbated reaction of the monsoon marginal zone to climate change under global warming.
- (3)
- This study further investigated the correlation between three climate modes (ENSO, PDO, and AMO) and variations in summer maximum temperatures within the study area. As indicated by the results, these climate modes might be consistent with the radial growth of Styphnolobium japonicum by regulating regional hydrotemperature conditions. Specifically, observed precipitation variations during the study period showed synchrony with ENSO activity, while the compound phenomenon of high temperatures and drought stress coincided temporally with the synergistic fluctuations of PDO and AMO. Furthermore, during certain periods, the superimposition of warm phases of these climate modes on the global warming background may have collectively intensified climatic stresses, suggesting possible connection mediated by these stresses with the radial growth of Styphnolobium japonicum.
Author Contributions
Methodology, Z.Z.; Resources, J.Y.; Data curation, X.H.; Writing—original draft, S.M.; Writing—review & editing, L.M. and B.S.; Supervision, Q.Z. and C.L. All authors have read and agreed to the published version of the manuscript.
Funding
This work was supported by the National Key Laboratory of Water Engineering Ecology and Environment in Arid Area; National Natural Science Foundation of China (General Program, Grant No. 52379015); National Natural Science Foundation Youth Fund (Grant No. 52409030); National Natural Science Foundation of China (Grant No. 2025SHZR1296). The authors gratefully acknowledge all funding agencies for their scientific sponsorship.
Institutional Review Board Statement
Not applicable.
Informed Consent Statement
Not applicable.
Data Availability Statement
The data presented in this study are available on request from the corresponding author.
Conflicts of Interest
The authors declare no conflict of interest.
References
- Zhou, A.; Yuan, C. Global warming intensifies once-in-a-decade extreme precipitation in summer in China. Atmos. Ocean. Sci. Lett. 2025, 18, 50–55. [Google Scholar] [CrossRef]
- Liang, C.; Yuan, J. The evolving distribution of humidity conditional on temperature and implications for compound heat extremes across China in a warming world. Atmos. Ocean. Sci. Lett. 2025, 18, 11–16. [Google Scholar] [CrossRef]
- Feng, J.; Qin, T.; Lv, X.; Liu, S.; Wen, J.; Chen, J. Frequent drought and flood events in the Yellow River Basin, increasing future drought trends in the middle and upper reaches. Int. J. Appl. Earth Obs. Geoinf. 2025, 139, 104511. [Google Scholar] [CrossRef]
- Fleischmann, A.; Rabelo, R.; Tregidgo, D.; Benitz, T.; Viana, F.M.F.; Franco, D.d.L.; Hercos, A.; Maranhão, L.; Bicudo, T.; Camelo, P.; et al. Unprecedented social-ecological impacts of the 2023 extreme drought in the central Amazon. Sci. Rep. 2025, 15, 41239. [Google Scholar] [CrossRef]
- Luo, Y.; Gao, L.; Fu, X.; Si, L.; Li, X.; Du, N.; Yuan, Y.; Zhang, X.; Deng, Y. Widespread vegetation damage in Asian Interior due to the 2022 extreme drought. Environ. Res. 2026, 288 Pt 1, 123213. [Google Scholar] [CrossRef]
- Wu, Y.; Zhang, J.; Qu, J.; Miao, Z.; Fang, X.; Liu, J. Intensified clustered extreme precipitation in the North China in the early autumn and the association with Arctic ice loss. Clim. Dyn. 2025, 63, 287. [Google Scholar] [CrossRef]
- Li, Z.; Guo, W.; Wang, Y.; Zhang, Y.; Zhang, S.; Zhu, X.; Xu, N. Glacier melting phenology changes in the Tibetan Plateau from 1981 to 2020. Catena 2025, 257, 109199. [Google Scholar] [CrossRef]
- Muhammad, S.; Tian, L. Changes in the ablation zones of glaciers in the western Himalaya and the Karakoram between 1972 and 2015. Remote Sens. Environ. 2016, 187, 505–512. [Google Scholar] [CrossRef]
- Nie, W.; She, D.; Xia, J. Five-Century monthly streamflow reconstruction of the upper Brahmaputra River reveals Historically frequent and intense Drought-Flood abrupt alternation events. J. Hydrol. 2025, 658, 133195. [Google Scholar] [CrossRef]
- Huang, X.; Yin, J.; Kang, S.; Brunner, M.; Hao, W. Deep learning-constrained projection of global fluvial floods and their socioeconomic implications under global warming. Environ. Res. Lett. 2025, 20, 124006. [Google Scholar] [CrossRef]
- IPCC. Summary for policymakers. In Climate Change 2023: Synthesis Report. Contribution of Working Groups I, II and III to the Sixth Assessment Report of the Intergovernmental Panel on Climate Change; Lee, H., Romero, J., Eds.; IPCC: Geneva, Switzerland, 2023; pp. 1–34. [Google Scholar]
- Zhang, D.E.; Liang, Y. A long lasting and extensive drought event over China in 1876–1878. Adv. Clim. Change Res. 2010, 1, 91–99. [Google Scholar] [CrossRef]
- Panyushkina, I.P.; Meko, D.; Macklin, M.; Toonen, W.; Mukhamadiev, N.; Konovalov, V.; Ashikbaev, N.; Sagitov, A. Runoff variations in Lake Balkhash Basin, Central Asia, 1779–2015, inferred from tree rings. Clim. Dyn. 2018, 51, 3161–3177. [Google Scholar] [CrossRef]
- Shi, X.; Gao, L.; Deng, Y.; Zhang, Y.; Zhang, X.; Gou, X. A tree-ring based streamflow reconstruction for the Taohe River (Gannan Plateau, China) associated with the Asian-Pacific Oscillation since 1325 CE. Catena 2024, 241, 108027. [Google Scholar] [CrossRef]
- Zhao, S.; Li, S.; Liu, Q.; Li, L.; Zhao, Y.; Du, M.; Yang, Z.; Hu, F.; Zhang, Z.; Guo, J. Response of treeline dynamics to climate change on the northern slope of Taibai Mountain, China. Dendrochronologia 2025, 94, 126402. [Google Scholar] [CrossRef]
- Wang, J.; Li, Q.; Liu, Y.; Ren, M.; Jia, Z.; Wu, Y.; Xu, Y.; Seo, J.-W.; Sun, C.; Song, H.; et al. Water vapor signals and climate influences in northeastern China: Insights from tree-rings and precipitation δ18O. J. For. Res. 2025, 36, 128. [Google Scholar] [CrossRef]
- Wang, X.; Wang, Z.; Liu, M.; Zhang, D.; Luo, T.; Li, X.; Du, B.; Qiu, Y.; Li, L.; Zhao, Y. Reconstruction of minimum May temperatures in northeast China since 1797 AD based on tree ring width in Pinus sylvestris var. mongolica. Forests 2024, 15, 2015. [Google Scholar] [CrossRef]
- Huang, R.; Yin, H.; Zhu, H.; Liang, E.; Ullah, A.; Meier, W.J.H.; Asad, F.; Braeuning, A.; Griessinger, J. A late summer temperature reconstruction based on tree-ring maximum latewood density since AD 1246 on the southeastern Tibetan Plateau. Quat. Sci. Rev. 2025, 355, 109266. [Google Scholar] [CrossRef]
- Zhao, X.; Fang, K.; Chen, F.; Martín, H.; Roig, F.A. Reconstructed Jing River streamflow from western China: A 399-year perspective for hydrological changes in the Loess Plateau. J. Hydrol. 2023, 621, 129573. [Google Scholar] [CrossRef]
- Pandey, U.; Nakatsuka, T.; Mehrotra, N.; Zhen, L.; Kato, Y.; Sano, M.; Shah, S.K. Tree-rings stable isotope (δ18O and δ2H) based 368 years long term precipitation reconstruction of South Eastern Kashmir Himalaya. Sci. Total Environ. 2023, 892, 164640. [Google Scholar] [CrossRef] [PubMed]
- Qin, L.; Yuan, Y.; Yu, S.; Shang, H.; Zhang, T.; Zhang, R. Responses of radial growth and stable carbon isotopes to climate in the northern Tianshan Mountains. Dendrochronologia 2023, 80, 126098. [Google Scholar] [CrossRef]
- Lu, Q.; Liu, X.; Tan, L.; Keppler, F.; Treydte, K.; Wieland, A.; Zhang, L.; Shi, X.; Zhang, Y.; Wang, Y.; et al. Tree-ring δ2H records of lignin methoxy indicate spring temperature changes since 20th century in the Qinling Mountains, China. Dendrochronologia 2022, 76, 126020. [Google Scholar] [CrossRef]
- Papú, S.; Ortega-Rodriguez, D.R.; Roig, F.A.; Navas, F. Incidence of controlled water restriction on density and chemical profiles in tree rings of Araucaria araucana seedlings. Ecol. Process. 2024, 13, 45. [Google Scholar] [CrossRef]
- Büntgen, U. Experimental evidence for a thermal limitation of plant cell wall lignification at the alpine treeline. Alp. Bot. 2023, 133, 179–182. [Google Scholar] [CrossRef]
- Fonti, P.; Babushkina, E.A. Tracheid anatomical responses to climate in a forest-steppe in Southern Siberia. Dendrochronologia 2016, 39, 32–41. [Google Scholar] [CrossRef]
- Wang, H.; Zuo, Z.; Zhang, R.; Peng, L.; Zhang, K.; Chen, D.; Xiao, D.; You, Q.; Dai, G.; Zhang, R.; et al. Thermodynamic effect dictates influence of the Atlantic Multidecadal Oscillation on Eurasia winter temperature. NPJ Clim. Atmos. Sci. 2024, 7, 151. [Google Scholar] [CrossRef]
- Sui, C.; Yu, L.; Karpechko, A.Y.; Feng, L.; Liu, S. Influence of the Atlantic Multidecadal Oscillation and Interdecadal Pacific Oscillation on Antarctic surface air temperature during 1900 to 2015. Acta Oceanol. Sin. 2024, 43, 48–58. [Google Scholar] [CrossRef]
- Zhang, S.; Liu, Y.; Dong, B.; Sheng, C. Decadal modulation of the relationship between tropical Southern Atlantic SST and subsequent ENSO by Pacific Decadal Oscillation. Geophys. Res. Lett. 2023, 50, e2023GL104878. [Google Scholar] [CrossRef]
- Trascasa-Castro, P.; Maycock, A.C.; Ruprich-Robert, Y.; Turco, M.; Staten, P.W. Atlantic multidecadal variability modulates the climate impacts of El Niño–Southern Oscillation in Australia. Environ. Res. Lett. 2023, 18, 084029. [Google Scholar] [CrossRef]
- Khan, A.; Chen, F.; Saleem, S.; Chen, Y.; Zhang, H.; Bakhtiyorov, Z. Tree-ring maximum latewood density reveals unprecedented warming and long-term summer temperature in the upper Indus Basin, northern Pakistan. Sci. Total Environ. 2024, 956, 177393. [Google Scholar] [CrossRef]
- Shi, J.; Wang, H.; Li, J.; Shi, S.; Xu, J.; Zhang, Y.; Lu, H. Unprecedented early summer warming recorded in tree rings on the central eastern Tibetan Plateau over the past three centuries. Clim. Dyn. 2023, 61, 5735–5745. [Google Scholar] [CrossRef]
- Xu, S.; Zheng, C.; Zhang, Z.; Shang, Z.; Kong, X.; Zhao, Z. Altitudinal difference of growth–climate response models in the coniferous forests of southeastern Tibetan Plateau, China. Forests 2024, 15, 1265. [Google Scholar] [CrossRef]
- Xu, H.; Wang, J.; Liu, J.; Peng, X.; Pourtahmasi, K. Evolution of megadrought and pluvial events in the Qaidam Basin and Hexi Corridor, Northwest China, during the period 455–2100 CE. Int. J. Climatol. 2024, 44, 4462–4477. [Google Scholar] [CrossRef]
- Wang, X.; Wang, Z.; Zhang, D.; Yu, S.; Zhang, T.; Luo, T.; Li, X.; Du, B.; Cheng, X. Response of Pinus sylvestris var. mongholica tree-ring density to climatic factors in Northeast China under climate warming background. Front. For. Glob. Change 2025, 8, 1531983. [Google Scholar] [CrossRef]
- Wang, Z.; Zhang, D.; Zhang, T.; Li, X.; Wang, X.; Luo, T.; Zhong, S.; Song, K. Reconstructing the temperature and precipitation changes in the northern part of the Greater Khingan Mountains over the past 210 years using tree ring width data. Forests 2024, 15, 1450. [Google Scholar] [CrossRef]
- Huang, R.; Luo, W.; Liu, Y.; Wang, J.; Zhang, L. Spatiotemporal Variations and Driving Mechanisms of Vegetation Phenology Across Different Vegetation Types in Yan Mountain from 2000 to 2022. Remote Sens. 2025, 17, 3051. [Google Scholar] [CrossRef]
- Stokes, M.A.; Smiley, T.L. An Introduction to Tree-Ring Dating; University of Chicago Press: Chicago, IL, USA, 1969. [Google Scholar]
- Grissino-Mayer, H. Evaluating crossdating accuracy: A manual and tutorial for the computer program COFECHA. Tree-Ring Res. 2001, 57, 205–221. [Google Scholar]
- Holmes, R.L.; Adams, R.K.; Fritts, H.C. Users Manual for Program ARSTAN, in Tree-Ring Chronologies of Western North America: California, Eastern Oregon and Northern Great Basin; Laboratory of TreeRing Research, University of Arizona: Tucson, AZ, USA, 1986; pp. 50–65. [Google Scholar]
- Keyimu, M.; Li, Z.; Zhang, G.; Fan, Z.; Wang, X.; Fu, B. Tree ring–based minimum temperature reconstruction in the central Hengduan Mountains, China. Theor. Appl. Climatol. 2020, 141, 359–370. [Google Scholar] [CrossRef]
- Liu, Y.; Wang, L.; Li, Q.; Cai, Q.; Song, H.; Sun, C.; Liu, R.; Mei, R. Asian summer monsoon-related relative humidity recorded by tree ring δ18O during last 205 years. J. Geophys. Res. 2019, 124, 9824–9838. [Google Scholar] [CrossRef]
- Wang, T.; Bao, A.; Xu, W.; Yu, R.; Zhang, Q.; Jiang, L.; Nzabarinda, V. Tree-ring-based assessments of drought variability during the past 400 years in the Tianshan mountains, arid Central Asia. Ecol. Indic. 2021, 126, 107702. [Google Scholar] [CrossRef]
- Cook, E.R.; Kairiukstis, L.A. Methods of Dendrochronology: Applications in the Environmental Sciences; Kluwer: Dordrecht, The Netherlands, 1990. [Google Scholar]
- Durbin, J.; Watson, G.S. Testing for serial correlation in least squares regression: I. Biometrika 1950, 37, 409–428. [Google Scholar] [CrossRef]
- Meehl, G.A.; Hu, A.; Arblaster, J.M.; Fasullo, J.; Trenberth, K.E. Externally forced and internally generated decadal climate variability associated with the Interdecadal Pacific Oscillation. J. Clim. 2013, 26, 7298–7310. [Google Scholar] [CrossRef]
- Zhao, Y.; Keyimu, M.; Li, Z.; Chen, Y.; Wei, J.; Wang, X.; Fan, Z. Summer mean temperature reconstruction during the past 285 years based on tree-ring in northern Gaoligong Mountains, northwestern Yunnan of China. Geogr. Ann. A 2021, 103, 69–82. [Google Scholar] [CrossRef]
- Poljanšek, S.; Ceglar, A.; Levanič, T. Long-term summer sunshine/moisture stress reconstruction from tree-ring widths from Bosnia and Herzegovina. Clim. Past 2013, 9, 27–40. [Google Scholar] [CrossRef]
- Jin, X.; Xu, Q.; Liu, S.R.; Jiang, C.Q. Relationships of stable carbon isotope of Abies faxoniana tree-rings to climate in sub-alpine forest in Western Sichuan. Acta Ecol. Sin. 2014, 34, 1831–1840. [Google Scholar] [CrossRef]
- Rossi, S.; Deslauriers, A.; Griçar, J.; Seo, J.W.; Rathgeber, C.B.; Anfodillo, T.; Morin, H.; Levanic, T.; Oven, P.; Jalkanen, R. Critical temperatures for xylogenesis in conifers of cold climates. Glob. Ecol. Biogeogr. 2008, 17, 696–707. [Google Scholar] [CrossRef]
- Seo, J.W.; Eckstein, D.; Olbrich, A.; Jalkanen, R.; Salminen, H.; Schmitt, U.; Fromm, J. Climate control of wood formation: Illustrated for Scots pine at its northern distribution limit. In Cellular Aspects of Wood Formation; Fromm, J., Ed.; Springer: Berlin/Heidelberg, Germany, 2013; Volume 20, pp. 159–185. [Google Scholar]
- Huang, X.; Dai, D.; Xiang, Y.; Yan, Z.; Teng, M.; Wang, P.; Zhou, Z.; Zeng, L.; Xiao, W. Radial growth of Pinus massoniana is influenced by temperature, precipitation, and site conditions on the regional scale: A meta-analysis based on tree-ring width index. Ecol. Indic. 2021, 126, 107659. [Google Scholar] [CrossRef]
- Xu, C.; Buckley, B.M.; Promchote, P.; Wang, S.Y.S.; Pumijumnong, N.; An, W.; Sano, M.; Nakatsuka, T.; Guo, Z. Increased variability of Thailand’s Chao Phraya River peak season flow and its association with ENSO variability: Evidence from tree ring δ18O. Geophys. Res. Lett. 2019, 46, 4863–4872. [Google Scholar] [CrossRef]
- Medina, F.D.; Zossi, B.S.; Elias, A.G. Changes on the summer Rx1-ENSO and Rx1-SAM relations over Northern Argentina driven by PDO phases. Theor. Appl. Climatol. 2025, 156, 95. [Google Scholar] [CrossRef]
- Wang, X.; Duan, W.; Tan, M.; Cai, B.; Zhao, J.; Ning, Y.; Cheng, H.; Wang, L.; Ma, Z.; Edwards, R.L.; et al. Variability of PDO identified by a last 300-year stalagmite δ18O record in Southwest China. Quat. Sci. Rev. 2021, 261, 106947. [Google Scholar] [CrossRef]
- Zhang, R.; Delworth, T.L.; Held, I.M. Can the Atlantic Ocean drive the observed multidecadal variability in Northern Hemisphere mean temperature? Geophys. Res. Lett. 2007, 34, 346–358. [Google Scholar] [CrossRef]
- Zou, L.L.; Xu, S.S.; Zheng, C.G.; Li, S.R.; Lian, W.J.; Shang, Z.Y.; Zhang, Z.G.; Kong, X.G.; Zhao, Z.J. Relationship between the tree ring width of Sabina saltuaria and climate factors in Haizi Mountain, Daocheng, Sichuan. J. Glaciol. Geocryol. 2021, 43, 917–927. [Google Scholar] [CrossRef]
- Keyimu, M.; Li, Z.; Liu, G.; Fu, B.; Fan, Z.; Wang, X.; Wu, X.; Zhang, Y.; Halik, U. Tree-ring based minimum temperature reconstruction on the southeastern Tibetan Plateau. Quat. Sci. Rev. 2021, 251, 106712. [Google Scholar] [CrossRef]
Disclaimer/Publisher’s Note: The statements, opinions and data contained in all publications are solely those of the individual author(s) and contributor(s) and not of MDPI and/or the editor(s). MDPI and/or the editor(s) disclaim responsibility for any injury to people or property resulting from any ideas, methods, instructions or products referred to in the content. |
© 2025 by the authors. Licensee MDPI, Basel, Switzerland. This article is an open access article distributed under the terms and conditions of the Creative Commons Attribution (CC BY) license (https://creativecommons.org/licenses/by/4.0/).