Abstract
Urban clusters face escalating atmospheric challenges, with elevated PM2.5 concentrations representing a critical environmental constraint. This study investigates spatiotemporal evolution mechanisms of PM2.5 within China’s Taiyuan-Yuci-Xinzhou (TYX) urban cluster. Daily PM2.5 concentrations (July–September 2000–2020) characterized spatiotemporal distributions. The Urban Forest Effects (UFORE) model integrated multisource data—remote sensing, leaf area index (LAI), wind speed, and precipitation—within a Geographically and Temporally Weighted Regression (GTWR) framework, quantifying PM2.5 dry deposition across land cover types and identifying drivers. Key findings reveal the following: (1) PM2.5 concentrations followed an initial-rise-then-decline trajectory, with pollution hotspots concentrated in Taiyuan City and neighboring industrial corridors; (2) Construction lands sprawl markedly elevated PM2.5 levels, whereas green areas and agricultural lands expansion promoted deposition; water areas exhibited no significant effect; (3) Wind speeds and precipitation positively modulated PM2.5 in green areas and agricultural lands, contrasting with NDVI’s negative influence; elevation showed null correlation, while agricultural lands deposition correlated positively with PM2.5; (4) GDP displayed an inverted U-curve association with PM2.5; positive correlations emerged with AVSI, TIOV, NOP, and EC indices, but negative linkage with TOC. This clarifies land cover impacts on urban atmospheric particulates, providing empirical foundations for pollution control.
1. Introduction
Integrated urban development is a fundamental approach to sustainable urban planning and a critical pathway for enhancing regional economic competitiveness [1]. In 1933, German geographer W. Christaller first systematically introduced the concept of urban agglomeration [2]. Later in 1957, Gottmann proposed that future urbanization trajectories would depend on the amalgamation of multiple cities around central urban cores, leading to mega-city formation [3]. This phenomenon is driven by the pursuit of economic advancement at regional levels [4,5].
In China, urban integration development was formally proposed and initiated in 2014 to synergize economic growth across urban clusters. This strategy expands both the scope and depth of cooperation within regional urban networks [6]. As integration progresses, however, expanded production, construction, and industrial development inevitably increase emissions of pollutants such as PM2.5. These emissions constitute significant pollution sources with demonstrable adverse effects on regional air quality [7].
The study area (Figure 1) encompasses central Shanxi Province. Since the 1990s, Taiyuan City has pursued integration with surrounding urban areas, functioning as the regional core. Initial development centered on the Tai-Yu co-citizenship initiative, focusing on establishing transportation infrastructure, high-tech industries, and university parks [8]. In recent years, Tai-Yu’s urbanization has advanced to foster service sector clusters, promote ecological tourism, and develop high-tech industrial parks.
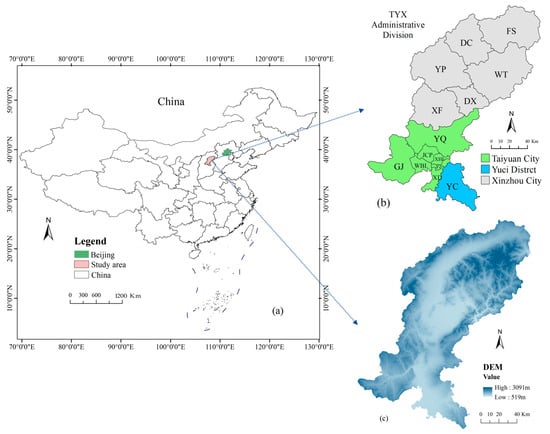
Figure 1.
Overview of the study area. (a) Geographical location of the study area and Beijing within China; (b) Administrative divisions of the study area; (c) Elevation of the study area.
For decades, Shanxi’s economic growth has been driven primarily by heavy industry and energy-intensive sectors, which account for approximately 60% of the region’s industrial output value [9]. This industrial structure is characterized by high energy consumption, high emissions, and high pollution. Research indicates that PM2.5 contributes ~30% of air pollutants in Taiyuan and adjacent areas, followed by other pollutants including PM10 [10].
Rapid urbanization and industrialization have been identified by the World Health Organization (WHO) as major contributors to air pollution [11]. In northern China’s persistent haze regions, peak PM2.5 concentrations exceed 800 μg/m3—over 30 times the WHO guideline value [12]. As the primary component of haze, PM2.5 poses substantial threats to human health, particularly respiratory systems. This pollutant increases incidence rates of respiratory diseases and contributes to cardiovascular and cerebrovascular conditions, especially among elderly and vulnerable populations [13,14,15,16]. The detrimental effects of PM2.5 on human health and the environment remain significant concerns [17].
Regional PM2.5 concentrations are substantially influenced by multiple sources, including coal combustion, transportation emissions, biomass burning (producing inorganic aerosols), and soil dust. These sources collectively account for 7% to 27% of total regional PM2.5 [18]. Despite governmental policies promoting energy conservation, emissions reduction, and cleaner production, critical scientific questions persist regarding how urban integration affects PM2.5. This knowledge gap requires urgent resolution, particularly given ongoing high energy consumption and substantial land use alterations [19].
Most studies have focused on PM2.5 in relation to natural and socioeconomic factors. Natural factors include wind speed, temperature, relative humidity, precipitation, and seasonal variations. Socioeconomic factors encompass regional economic development, urbanization, industrial structure, industrial agglomeration, market segmentation, and environmental regulation [20,21,22]. Research consistently demonstrates that urbanization substantially impacts regional ecological environments. This is primarily manifested through infrastructure development and industrial activities that cause environmental contamination and energy resource pollution. Fossil fuel combustion for seasonal heating in urban areas constitutes an important source of PM2.5 emissions, elevating atmospheric concentrations of this pollutant [23,24,25]. In recent years, research on PM2.5 within urban agglomerations or integrated urban development has gained significant attention. Scholars have comprehensively analyzed the spatiotemporal evolution of PM2.5 pollution, its relationship with meteorological conditions, and its impacts on human health. Findings indicate that PM2.5 in integrated urban areas exhibits strong spatial aggregation. Studies examining PM2.5 drivers reveal significant spatiotemporal heterogeneity in influencing factors. Meteorology, socioeconomic conditions, pollution sources, and ecological factors demonstrate interacting effects on PM2.5 concentrations [26,27]. While existing research has extensively analyzed factors affecting the spatiotemporal distribution of PM2.5, the retention effect of landscape pattern evolution on PM2.5 during integrated urban development remains underexplored.
The examination of PM2.5 concentration trends and their underlying causes during urban integration presents an urgent environmental challenge requiring resolution. This study employs the Tai-Yu-Xin (TYX) urban integration region as a case study to investigate spatiotemporal distribution patterns of PM2.5 and its dry deposition, alongside the response of PM2.5 to land use/cover changes. We further examine relationships between PM2.5 and natural/social indicators through dry deposition estimation across land classes, land use transitions, landscape pattern analysis, and geographically and temporally weighted regression (GTWR). Specifically, this research addresses three questions: (1) the spatial and temporal distribution characteristics of PM2.5 concentration in the context of urban integration of Tai-Yu-Xin (TYX); (2) response patterns of PM2.5 and its dry deposition to land use and landscape evolution; and (3) influence mechanisms of natural and social indicators on PM2.5. This work provides theoretical insights for understanding the spatiotemporal distribution of PM2.5 in integrated urban development, supporting regional PM2.5 reduction efforts.
2. Materials and Methods
2.1. Study Area
The urban integration of Taiyuan-Yuci-Xinzhou (TYX) encompasses the city of Taiyuan, various districts and counties within Xinzhou City, and Yuci District (YC) within Jinzhong City. This integration results in a total of 14 administrative districts and counties, as illustrated in Figure 1b. The seven administrative counties that constitute the Taiyuan City administrative division are Yingze (YZ), Xinghualing (XHL), Jiancaoping (JCP), Wanbailin (WBL), Xiaodian (XD), Gujiao (GJ), and Yangqu (YQ). The remaining six administrative counties are under the jurisdiction of the city of Xinzhou. They are Xinfu (XF), Dingxiang (DX), Yuanping (YP), Wutai (WT), Daixian (DC), and Fanshi (FS). TYX is situated in the north-central region of Shanxi, to the north of the Jinzhong Basin. It is bordered to the west by Lvliang Mountain and to the east by Taihang Mountain. The geographical characteristics of the study area are intricate and varied, comprising mountainous terrain as the predominant feature, interspersed with basins, valleys, and plains. The elevation of the area ranges from 519 to 3091 m above mean sea level (a.m.s.l.). The study area is classified as a warm-temperate climate zone. The climate is classified as a temperature continental monsoon climate, with an annual average precipitation of 456 mm, calculated as the mean over the period 2000–2020. The precipitation is concentrated in July and August, accounting for approximately 60% of the yearly total. Average annual sunshine duration in the study area is 2 808 h for the period 2011–2013, and the mean wind speed is 3.027 m/s for 2016–2017 [28,29]. Although our analysis covers 2000–2020, these values are used as reference averages due to data availability, and we acknowledge that actual conditions during 2000–2020 may differ slightly.
The study area is dominated by coniferous forests and mesic deciduous scrubs, with deciduous broad leaf forest representing a secondary vegetation type. Field investigations revealed that the southern part of the study area corresponds to the provincial capital, characterized as a densely populated urban region. In this area, crops such as maize, vegetables, and fruits are predominantly cultivated, whereas drought-tolerant crops such as wheat and potatoes are mainly distributed across mountainous and hilly zones.
2.2. Data Source
2.2.1. Land Use and Land Cover Data
In this study, Landsat imagery for five reference years was used: Landsat 5 TM for 2000 and 2005, Landsat 7 ETM+ (SLC-off) for 2010, and Landsat 8 OLI/TIRS for 2015 and 2020. The multispectral bands of these sensors have a native spatial resolution of 30 m. The pre-processing procedures, including radiometric calibration, atmospheric correction, image splicing, and vector cropping, were conducted on the image data in ENVI 5.3. Subsequently, the selection of training samples and supervised classification were conducted to distinguish the study area into four land use types: construction lands, water areas agricultural lands, and green areas. After completing the series of supervised classification procedures in ENVI 5.3, the class confusion matrix tool was applied by importing the training sample data for each period of land use classification. The classification accuracy was then evaluated by comparing the manually selected reference samples with the results obtained from automated supervised classification. The results indicated that: the overall validation accuracy of the classification results in each period reached over 85%, with Kappa coefficients exceeding 0.83, indicating superior classification outcomes (Figure 2). The DEM data were obtained from the ASTER GDEM 30 m resolution dataset, as illustrated in Figure 1c. The aforementioned images were sourced from the Chinese Academy of Sciences Geospatial Data Cloud Platform “http://www.gscloud.cn (accessed on 16 January 2024)”. It should be noted that the acquired data were all obtained during the summer months (July–September) of the corresponding year, with cloud coverage below 5%.
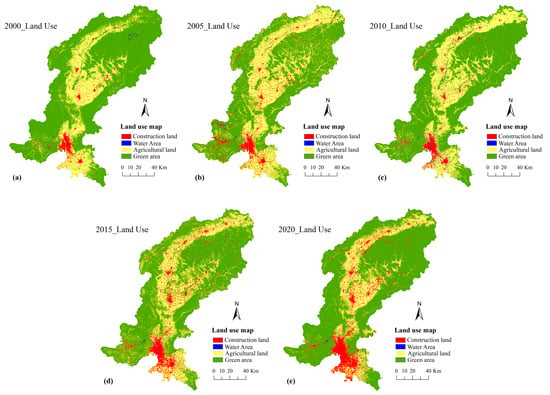
Figure 2.
Land use maps for the period 2000–2020. (a) Land use types in 2000; (b) Land use types in 2005; (c) Land use types in 2010; (d) Land use types in 2015; (e) Land use types in 2020.
2.2.2. PM2.5 Concentration Data
The data regarding the concentration of PM2.5 are derived from the National Science & Technology Infrastructure of China “http://www.geodata.cn (accessed on 21 January 2024)”. The daily seamless near-surface PM2.5 concentration dataset at 1 km resolution for China from 2000 to 2020 exhibits a correlation coefficient of over 0.95 with a root-mean-square error (RMSE) of 12.03 and 19.56 μg/m3 when compared to the measured data at state-controlled stations [30].
2.2.3. Wind Speed and Precipitation Data
Wind speed data were sourced from the monthly near-surface mean wind speed dataset for China (2000–2020), released by NSTIC at 1 km resolution [31]. Precipitation data were obtained from historical reanalysis datasets of the European Centre for Medium-Range Weather Forecasts (ECMWF) and National Aeronautics and Space Administration (NASA), accessed via www.xihe-energy.com. This dataset exhibits an average percentage discrepancy of 1.41%, demonstrating sufficient precision for this study [32,33].
2.2.4. NDVI-LAI
LAI was calculated by remote sensing inversion using NDVI values [34,35], and the results of LAI data in the study area are presented in Figure 3. The formula for NDVI and LAI is below:
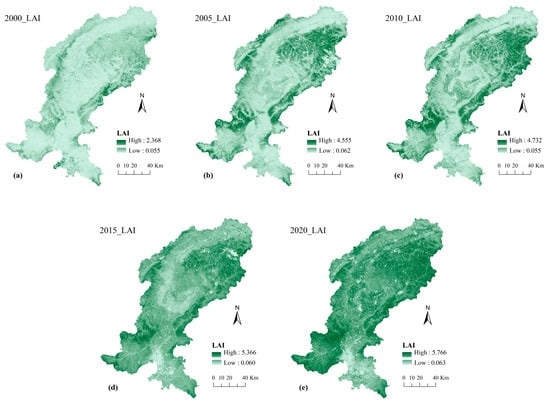
Figure 3.
Spatial and temporal distribution of the leaf area index (LAI) in the study area during 2000–2020. (a) Leaf Area Index (LAI) of the study area in 2000; (b) Leaf Area Index (LAI) of the study area in 2005; (c) Leaf Area Index (LAI) of the study area in 2010; (d) Leaf Area Index (LAI) of the study area in 2015; (e) Leaf Area Index (LAI) of the study area in 2020.
2.2.5. Socioeconomic Indicators
This study analyzes the following variables: gross domestic product (GDP), added value of the secondary industry (AVSI), total industrial output value (TIOV), population (POP), electricity consumption (EC), and total output value of the construction industry (TOC) to examine how socioeconomic development changes across administrative districts influence PM2.5 patterns. Socioeconomic data were obtained from the annual Shanxi Statistical Yearbook and China Urban (County) Statistical Yearbook.
2.3. Methods
Figure 4 presents the technical roadmap for analyzing spatiotemporal evolution patterns of dry deposition and PM2.5 concentrations in TYX over the past two decades. This is achieved by estimating the dry deposition of different land use types in the study area and using an 8 km × 8 km fishing net as the basic research unit for green areas and agricultural land types, respectively. This allows for the exploration of the relationship between PM2.5. Concentration and Landscape Pattern, Dry Deposition (DD), Wind Speed (WS), NDVI (ND), Precipitation (PR), Elevation (EL), and their responses to regional socioeconomic indicators.
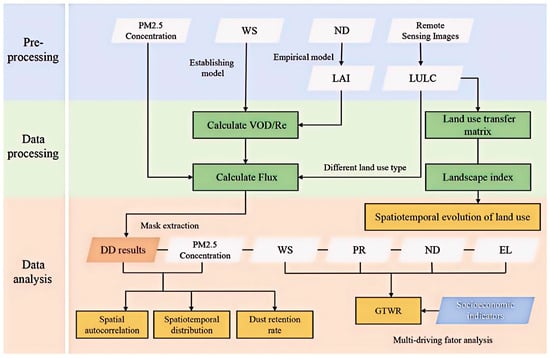
Figure 4.
Technical road map.
2.3.1. Methods of Estimating Dry Deposition
(1) Methods for estimating dry deposition in green areas and agricultural lands.
The dry deposition of PM2.5 pollutants was estimated using the Urban Forest Effects (UFORE) model for green areas and agricultural lands categories [36]. Additionally, the percentage of deposition over a specified time range and the percentage of air quality improvement effect can be calculated [37,38,39]. The calculation is performed in accordance with the specifications outlined in Equation (3):
where Qij represents the PM2.5 deposition in the ith row and jth column of the image element. LAIij denotes the current image element LAI value. Fluxij signifies the dry deposition flux of the image element, which represents the cumulative amount of particulate matter deposition per unit area and per unit time of the dry deposition state. This is calculated using the formula presented in Equation (4):
where VODij represents the dry deposition velocity on the leaf surface of vegetation in this image element (m·s−1), PM_Valueij represents Current PM2.5 concentration value in the image element (μg·m−3), Re represents resuspension rate, T represents the dry deposition time(s) which is calculated by Equation (5):
where R_Dday represents the number of days over which the actual dry deposition occurred. The elution rate of different grain sizes on different tree species has been demonstrated to reach 90% when the cumulative rainfall in a single day reaches 15 mm [40,41]. In order to obtain the effective dry deposition days in July–September of each year, the days with single-day precipitation accumulation exceeding 15 mm were excluded, in accordance with the requirements of the dry deposition calculation.
In the calculation of dry deposition flux, the settling velocity and resuspension rate of particulate matter are both closely related to natural factors [42]. In this paper, the dry deposition velocity (VOD) and resuspension rate (Re) are derived based on wind speed, and the correlation index R2 of this model is above 0.98 [43]. The calculation method is as in Equations (6) and (7).
Equations (6) and (7) are employed to calculate the corresponding dry deposition velocity and resuspension rate values for each month based on the wind speed (m·s−1) data for that period. Figure 5 illustrates the deposition velocity and resuspension rate of PM2.5 for September 2000.
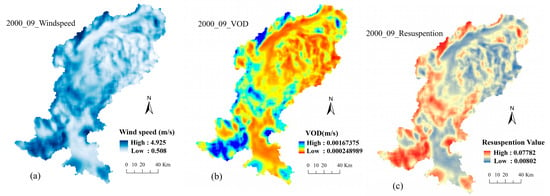
Figure 5.
Spatial distribution of wind speed, dry deposition velocity, and resuspension rate data, September 2000. (a) Wind speed of the study area in September 2000; (b) Dry deposition velocity of the study area in September 2000; (c) Resuspension rate of the study area in September 2000.
The PM2.5 particulate matter deposition velocity for agricultural crops was calculated using the PM2.5 gravitational deposition velocity, aerodynamic drag above the canopy, empirical LULC parameters, and particulate matter friction velocity, as demonstrated in Equation (8) [44].
where Vd(PM2.5) represents the dry deposition velocity of agricultural lands (m·s−1), Vg(PM2.5) represents the gravitational settling velocity of PM2.5 (m·s−1), Ra represents the aerodynamic resistance above the canopy, α1 is an empirical parameter based on LULC, and u is the friction velocity, which can be used to estimate the value of the dry deposition velocity of agricultural lands. Given the study area’s location in northern China, which is predominantly dry land, and in light of the findings of related scholars in analogous regions [45], the dry deposition velocity of agricultural lands in this experiment was determined to be 5.6·10−2 (m·s−1).
(2) Estimation of dry deposition in water areas
The accurate estimation of the dry deposition velocity of fine particulate matter in the surface layer of a water body represents a challenging area of study, with the results obtained by using various estimation models exhibiting significant geographical differences. In this experiment, the dry deposition velocity of fine particles in the surface layer of the water body in the study area was estimated to be 2·10−2 (m·s−1) by a process of comparison and synthesis involving the research results of numerous scholars and the geographic location of the study area in conjunction with the natural environmental conditions. In light of the aforementioned considerations, the following Equation (9) represents the formula for calculating the total dry deposition in the water areas [46]:
where Qwater represents the value of total dry deposition in the water body (μg·m−2). VODwater denotes the dry deposition velocity of PM2.5 in the surface layer of the water body (m·s−1). C signifies the value of particulate matter concentration (μg·m−3); T denotes the time when the dry deposition actually occurs (equivalent to Equation (4)).
(3) Calculation of dust retention rate
The dust retention rate is defined as the ratio of PM2.5 dry deposition to the total PM2.5 concentration, and it is calculated using the following Equation (10) [46]
where P is the dust retention rate, Q is the dry deposition (μg), and E represents the regional atmospheric PM2.5 background value (μg). Where E can be calculated by referring to Equation (11) [47]:
where C represents the concentration of particulate matter (μg·m−3), T denotes the dry deposition time (s), HMLH signifies the height of the atmospheric mixed layer within the designated study area (m), and S refers to the area encompassed by the specified land class (m2). In consideration of the elevation characteristics of the study area and related literature, a height of 650 m was selected as the atmospheric mixed layer height of the study area in this paper [48].
2.3.2. Evolution of the Landscape Patterns
To more accurately characterize the evolutionary patterns of regional landscape structure during urban integration development, and to more effectively investigate correlations between regional PM2.5 dry deposition and landscape pattern transformation, this study selected ten landscape indicators (Table 1). Landscape pattern indices for 2000, 2005, 2010, 2015, and 2020 were calculated using Fragstats 4.2.681 Stable Version “https://fragstats.org/index.php/downloads (accessed on 1 March 2024)” to quantify fundamental spatiotemporal characteristics of landscape configuration.

Table 1.
Selected indices and descriptions.
2.3.3. Spatiotemporal Analysis
(1) Geographically and Temporally Weighted Regression
The heterogeneity of the spatial and temporal distribution of PM2.5 and its influencing factors in the TYX area were analyzed and studied using the geographically and temporally weighted regression (GTWR) model constructed by Huang et al. (2010) [52]. This is expressed in the following equation:
where Yi represents the value of the explanatory variable at point i. The variables ui and vi denote the latitude and longitude coordinates of point i, respectively, while ti represents the time coordinate of point i. β0(ui,vi,ti) represents the value of the regression intercept at point i, βk(ui,vi,ti) denotes the regression coefficient of the kth explanatory variable at the point, and if βk > 0, it signifies that the explanatory variable is positively correlated with the dependent variable, and vice versa, it is negatively correlated. Xik denotes the value of the kth explanatory variable at point i, and ei is the random error value.
(2) Spatial Auto-Correlation
The spatial correlation of PM2.5 concentration distribution in TYX was examined through the calculation of the Moran’s I [53]. The specific calculation formula is as follows:
where the xi and xj represent the attribute values of different research units, while n represents the number of research objects. Wij represents the spatial weight matrix, and represents the average of attribute values. Moran’s I is calculated between −1 and 1. A Moran’s I value of 1 indicates a significant spatial agglomeration effect, while a value of −1 indicates a significant spatial convergence effect. A Moran’s I value of 0 indicates a random distribution of attribute values.
The local Moran’s I [54] was employed to examine the distinctive attributes of the localized areas within the study region. This was accomplished through the application of the following formula:
where the value of m represents the number of neighboring units of a research unit in space. The results of the local Moran’s I were calculated according to the following four classifications: “high-high,” “high-low,” “low-high,” and “low-low,” which correspond to the four types of agglomeration.
3. Results
3.1. Spatial and Temporal Characteristics of PM2.5
As illustrated in Figure 6, the spatial distribution of cumulative PM2.5 concentrations was examined for the months of July to September in 2000, 2005, 2010, 2015, and 2020, utilizing a uniform color scale ranging from 0 to 2500 µg/m3. As evident in the figure, the southern part of the study area exhibited persistently higher values, indicative of consistently elevated concentrations of particulate matter. The central and northern regions also exhibited varying degrees of PM2.5 pollution. Regarding the temporal dimension, the year 2000 (a–c) displayed the lightest hue and the lowest baseline pollution levels. Conversely, 2005 (d–f) and 2010 (g–i) showed a gradual deepening of the hue, while 2015 (j–l) exhibited the darkest and most extensive coverage, reaching a peak in July 2015 (j). In 2020 (m–o), the overall hue remained higher than in 2000 but lower than in 2015, suggesting that while pollution levels had decreased, they remained elevated. Furthermore, except for 2015, pollution levels in September of each year were marginally higher than those observed in July and August of the same year. Overall, PM2.5 concentrations exhibited a protracted trend of initial increase followed by a decline. The southern region of the study area demonstrated the most pronounced air pollution.
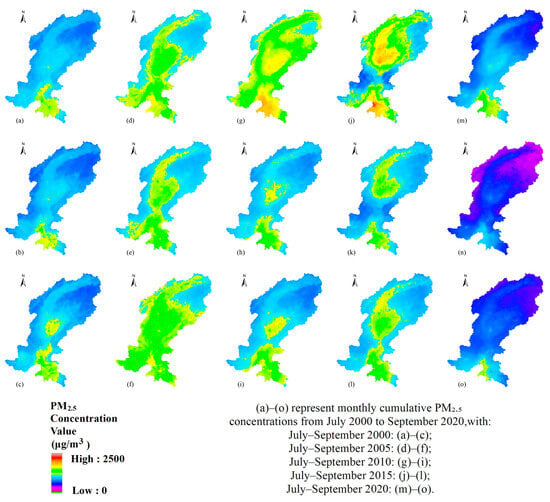
Figure 6.
Spatiotemporal distribution of monthly total PM2.5 concentration during 2000–2020. (a) Monthly cumulative PM2.5 concentration in July 2000; (b) Monthly cumulative PM2.5 concentration in August 2000; (c) Monthly cumulative PM2.5 concentration in September 2000; (d) Monthly cumulative PM2.5 concentration in July 2005; (e) Monthly cumulative PM2.5 concentration in August 2005; (f) Monthly cumulative PM2.5 concentration in September 2005; (g) Monthly cumulative PM2.5 concentration in July 2010; (h) Monthly cumulative PM2.5 concentration in August 2010; (i) Monthly cumulative PM2.5 concentration in September 2010; (j) Monthly cumulative PM2.5 concentration in July 2015; (k) Monthly cumulative PM2.5 concentration in August 2015; (l) Monthly cumulative PM2.5 concentration in September 2015; (m) Monthly cumulative PM2.5 concentration in July 2020; (n) Monthly cumulative PM2.5 concentration in August 2020; (o) Monthly cumulative PM2.5 concentration in September 2020.
The Moran’s I spatial correlation of the spatial and temporal distribution of PM2.5 indicates a significant spatial aggregation and positive spatial correlation in the distribution of PM2.5 within the study area, as illustrated in Table 2. The local Moran’s I (Figure 7) demonstrate that the high-high aggregation area is predominantly concentrated in the primary urban zone of Taiyuan and the northern region of Yuci (YC). Furthermore, the high-concentration aggregation areas observed in Yangqu (YQ) and Xinfu (XF) during the 2000–2015 period underwent a gradual dissolution in 2020. The northern part of the study area exhibited a low-low aggregation scenario, with an expanding trend in the northern end. The local spatial auto correlation analysis indicated that the localized spatial variation pattern of PM2.5 concentration was consistent with the distribution of high and low concentration values. Furthermore, the study area did not exhibit high-low aggregation or low-high aggregation types during the study period.

Table 2.
Global auto-correlation of Moran’s I.
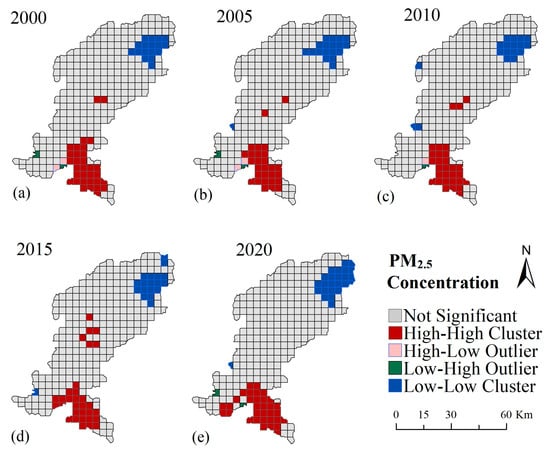
Figure 7.
Local indicators of spatial association (LISA) cluster and outlier analysis of the annual total PM2.5 concentration in the study area, showing spatial patterns at five time points: (a) 2000, (b) 2005, (c) 2010, (d) 2015, and (e) 2020.
3.2. Landscape Mosaic Evolution
In order to facilitate a more detailed analysis of the evolution of landscape pattern in the study area, a series of landscape indices were calculated, with a specific focus on the different land types present in the area.
(1) Type-Level Index
In this study, a number of representative indicators (Table 1) were selected for calculation, and the results are presented in Figure 8.
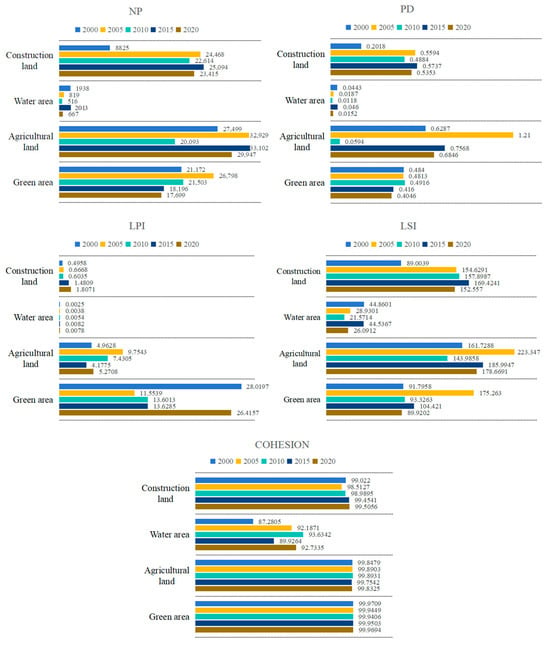
Figure 8.
Type level of landscape index from 2000 to 2020 in study area.
The NP and PD of the construction land have been increasing over the past 20 years, indicating a gradual increase in the degree of fragmentation. The LPI and LSI continue to increase, indicating that the construction land is subjected to a heightened degree of interference from human activities. The NP and PD indicate that the urbanization construction of the study area began to experience a relatively large amount of rapid development during the period of 2000–2005. In the subsequent period, as urbanization construction becomes more rational, the situation of urbanization development becomes more stable. Urbanization development is characterized by a greater degree of stability.
The NP, PD, and LSI of water areas all show a decreasing trend during 2000–2010, a marked increase between 2010 and 2015, and a subsequent decline from 2015 to 2020. Meanwhile, the LPI increases, indicating enhanced landscape dominance and reduced irregularity of shape.
The NP and PD, LPI and LSI of agricultural lands exhibited an initial increase, followed by a subsequent decrease. This suggests that the degree of fragmentation of agricultural land underwent an initial enhancement, followed by a subsequent weakening, and that the degree of landscape dominance also demonstrated an initial enhancement, followed by a subsequent weakening.
The NP and PD of green areas landscapes exhibited a rapid increase from 2000 to 2005, followed by a yearly decline from 2005 to 2020. The LPI demonstrated a gradual decrease from 2000, subsequently stabilizing. The LSI initially increased and then stabilized. The cohesion values of the various landscapes within the study area were found to be high, indicating a greater degree of connectivity between the different patch types.
(2) Landscape level indicators
As evidenced by the landscape-level index data presented in Table 3, the ED exhibited an initial increase followed by a decline and subsequent stabilization during the 2000–2020 period. In contrast, CONTAG and AI demonstrated greater stability, with minimal fluctuations in their values. This suggests that the landscape is weakly discrete, more aggregated, and more stable. The value of CONTAG is high, indicating that the dominant plaques have good connectivity. The SHDI and SHEI appeared to increase from 2000 to 2005 and then tend to stabilize, indicating that the proportion of various types of patches in the landscape increased first and then tended to stabilize, presenting a uniform spatial distribution. This indicates that land use is more abundant. The data (Table 3) demonstrate that during the period between 2000 and 2020, the landscape pattern of the study area has been influenced by human activities to a certain extent, with the degree of disturbance gradually increasing over time.

Table 3.
Landscape index of land types from 2000 to 2020 in study area.
3.3. Spatial and Temporal Characteristics of Dry Deposition in Different Land Use Contexts
(1) Spatial and temporal distribution of dry deposition in green areas
Figure 9 illustrates the spatiotemporal distribution of dry deposition over green areas in July–September for 2000, 2005, 2010, 2015, and 2020. In the high-elevation northern and central zones, blue shading indicates consistently low deposition under strong ventilation. By contrast, the southern lowlands and urban fringe exhibit a progressive transition from light yellow to deep red, reflecting concentrated and increasing particulate settling over time. Each September panel shows the most extensive warm-color coverage, suggesting that late-summer atmospheric stability and agricultural residue burning drive peak deposition. Temporally, high-value hotspots are limited in 2000 but expand in both extent and intensity by 2015; by 2020, these hotspots contract and shift southeastward, and overall deposition levels decline. The persistence of elevated deposition in the southern region underscores the need for continued targeted monitoring and mitigation.
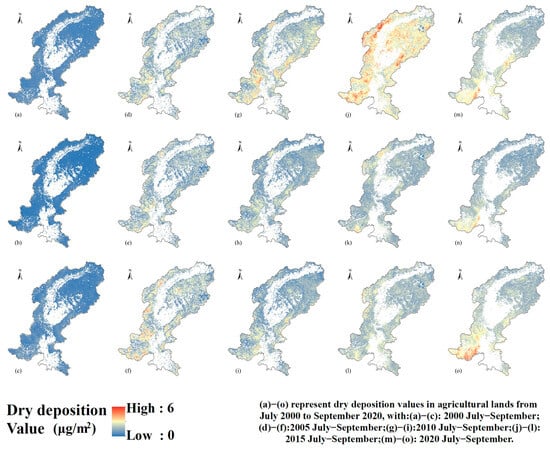
Figure 9.
Spatial and temporal distribution of dry deposition in green areas during 2000–2020. (a) Dry deposition value in green areas in July 2000; (b) Dry deposition value in green areas in August 2000; (c) Dry deposition value in green areas in September 2000; (d) Dry deposition value in green areas in July 2005; (e) Dry deposition value in green areas in August 2005; (f) Dry deposition value in green areas in September 2005; (g) Dry deposition value in green areas in July 2010; (h) Dry deposition value in green areas in August 2010; (i) Dry deposition value in green areas in September 2010; (j) Dry deposition value in green areas in July 2015; (k) Dry deposition value in green areas in August 2015; (l) Dry deposition value in green areas in September 2015; (m) Dry deposition value in green areas in July 2020; (n) Dry deposition value in green areas in August 2020; (o) Dry deposition value in green areas in September 2020.
(2) Spatial and temporal distribution of dry deposition in agricultural lands
Figure 10 shows that dry deposition over agricultural lands during July–September in 2000, 2005, 2010, 2015, and 2020, using a unified color scale of 0.01–0.55 µg/m2. Most agricultural lands remain in the low-deposition range, indicating that crop cover, residue retention, and irrigation practices effectively limit PM2.5 settling. However, discrete hotspots appear in mid-elevation zones and valley bottoms, where exposed soils and irrigation channels favor particle retention. Temporally, both deposition intensity and hotspot extent increase steadily from 2000 to a peak in 2015, then contract by 2020 in magnitude and spatial continuity. Seasonally, except for 2010 and 2015, September panels exhibit the most concentrated hotspots, reflecting post-harvest tillage and residue disturbance. Overall, the rise-and-fall pattern of dry deposition underscores the combined influence of evolving agricultural management and climatic factors. Continued soil conservation and targeted dust-control measures are recommended for vulnerable mid-elevation areas.
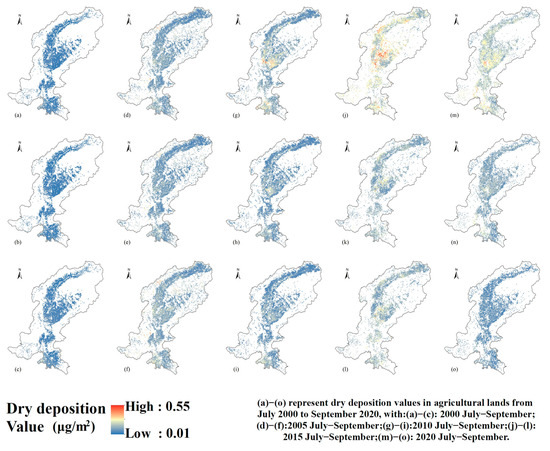
Figure 10.
Spatial and temporal distribution of dry deposition in agricultural lands during 2000–2020. (a) Dry deposition value in agricultural lands in July 2000; (b) Dry deposition value in agricultural lands in August 2000; (c) Dry deposition value in agricultural lands in September 2000; (d) Dry deposition value in agricultural lands in July 2005; (e) Dry deposition value in agricultural lands in August 2005; (f) Dry deposition value in agricultural lands in September 2005; (g) Dry deposition value in agricultural lands in July 2010; (h) Dry deposition value in agricultural lands in August 2010; (i) Dry deposition value in agricultural lands in September 2010; (j) Dry deposition value in agricultural lands in July 2015; (k) Dry deposition value in agricultural lands in August 2015; (l) Dry deposition value in agricultural lands in September 2015; (m) Dry deposition value in agricultural lands in July 2020; (n) Dry deposition value in agricultural lands in August 2020; (o) Dry deposition value in agricultural lands in September 2020.
(3) Dry deposition of water areas
As evidenced by the calculation results presented in Table 4, the monthly average value of the dry deposition of the water areas is 9.8776 t. Notably, the highest dry deposition of the water body was observed in July 2015, reaching 23 t, while the lowest was recorded in August 2020, at 3.7699 t. The data on dry deposition indicate that the magnitude of the value is closely related to the number of days of dry deposition and the rate of dry deposition.

Table 4.
Dry deposition value in water areas.
3.4. PM2.5 Responses to Land Use and Landscape Evolution
(1) Spatial and temporal evolution of PM2.5 dust retention rate
Figure 11 presents the spatiotemporal distribution of PM2.5 retention rates on green areas during July–September in 2000, 2005, 2010, 2015, and 2020. The northwestern and central high-elevation regions exhibit consistently higher retention rates, averaging 3–4%. In contrast, the northeastern region shows persistently lower retention rates across all years. Over time, the spatial extent of high-retention zones fluctuates, with southern areas showing more pronounced and persistent hotspots.
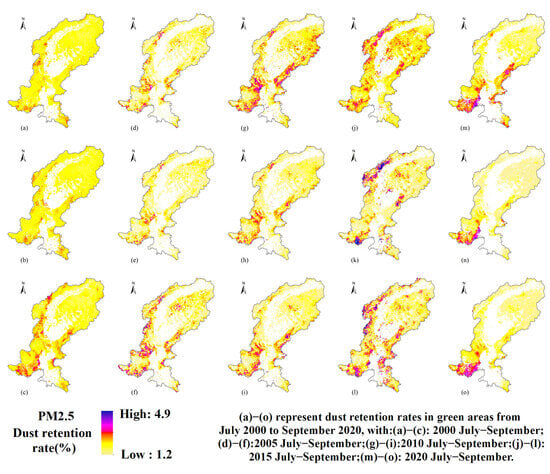
Figure 11.
Spatial and temporal distribution of PM2.5 dust retention rates in green areas during 2000–2020. (a) Dust retention rate in green areas in July 2000; (b) Dust retention rate in green areas in August 2000; (c) Dust retention rate in green areas in September 2000; (d) Dust retention rate in green areas in July 2005; (e) Dust retention rate in green areas in August 2005; (f) Dust retention rate in green areas in September 2005; (g) Dust retention rate in green areas in July 2010; (h) Dust retention rate in green areas in August 2010; (i) Dust retention rate in green areas in September 2010; (j) Dust retention rate in green areas in July 2015; (k) Dust retention rate in green areas in August 2015; (l) Dust retention rate in green areas in September 2015; (m) Dust retention rate in green areas in July 2020; (n) Dust retention rate in green areas in August 2020; (o) Dust retention rate in green areas in September 2020.
Figure 12 illustrates a gradual increase in the PM2.5 dry-deposition retention rate on agricultural lands from 2000 to 2020, along with distinct changes in spatial distribution. In 2000, retention rates were generally low, and high-value areas were scattered. From 2005 to 2015, retention rates rose steadily, with high-retention zones increasingly concentrated in the central and southern parts of the study area. By 2020, these areas further expanded and exhibited more spatial continuity.
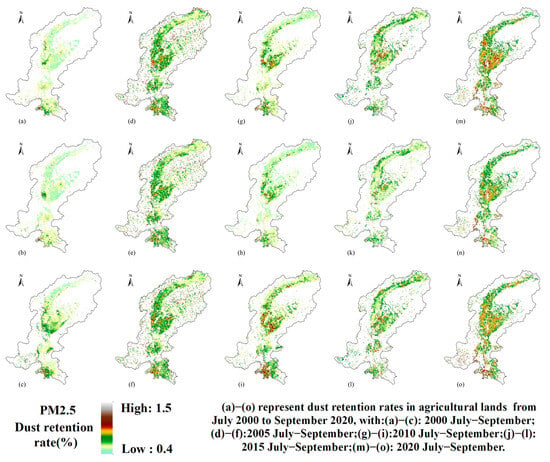
Figure 12.
Spatial and temporal distribution of PM2.5 dust retention rates in agricultural lands during 2000–2020. (a) Dust retention rate in agricultural lands in July 2000; (b) Dust retention rate in agricultural lands in August 2000; (c) Dust retention rate in agricultural lands in September 2000; (d) Dust retention rate in agricultural lands in July 2005; (e) Dust retention rate in agricultural lands in August 2005; (f) Dust retention rate in agricultural lands in September 2005; (g) Dust retention rate in agricultural lands in July 2010; (h) Dust retention rate in agricultural lands in August 2010; (i) Dust retention rate in agricultural lands in September 2010; (j) Dust retention rate in agricultural lands in July 2015; (k) Dust retention rate in agricultural lands in August 2015; (l) Dust retention rate in agricultural lands in September 2015; (m) Dust retention rate in agricultural lands in July 2020; (n) Dust retention rate in agricultural lands in August 2020; (o) Dust retention rate in agricultural lands in September 2020.
(2) PM2.5 Correlations with land use and landscape configuration
Based on the correlation coefficients between PM2.5 concentration and different land use types and landscape indices over the 20-year period (Table 5 and Table 6), the NP, PD, LSI, and LPI of construction lands are positively correlated with PM2.5 concentration. In contrast, the area and landscape indices of agricultural lands and green areas exhibit significant negative correlations with PM2.5 levels, indicating that both land types contribute to reducing atmospheric particulate concentrations. The correlation between water areas and PM2.5 is positive but not statistically significant.

Table 5.
Correlation coefficient between the land use area and PM2.5 Deposition.

Table 6.
Correlation coefficient between land use type pattern index and PM2.5.
This study also analyzes the relationship between PM2.5 concentration and six landscape-level indices—ED, CONTAG, SHDI, SHEI, and AI (Table 7). Among them, AI shows a significant negative correlation with PM2.5 concentration, whereas SHEI, ED, and CONTAG exhibit significant positive correlations. The correlation between SHDI and PM2.5 is weak and statistically insignificant. Overall, landscape fragmentation, diversity, evenness, and connectivity have a measurable impact on PM2.5 levels in the study area, though the influence is relatively moderate.

Table 7.
Correlation coefficient between land use landscape metrics and PM2.5.
3.5. GTWR Model Outputs for PM2.5 Driving Factors
(1) Natural indicators
The spatial and temporal evolution of green areas PM2.5 concentration was found to be significantly correlated with each of the natural factors, with the overall pattern of ND > WS > PR > DD > EL (Figure 13). The correlation between PM2.5 concentration in agricultural lands and the natural factors, with the exception of EL, was more significant, with the overall pattern indicating a higher concentration of PM2.5 in areas designated DD, ND, WS, and PR (Figure 14).
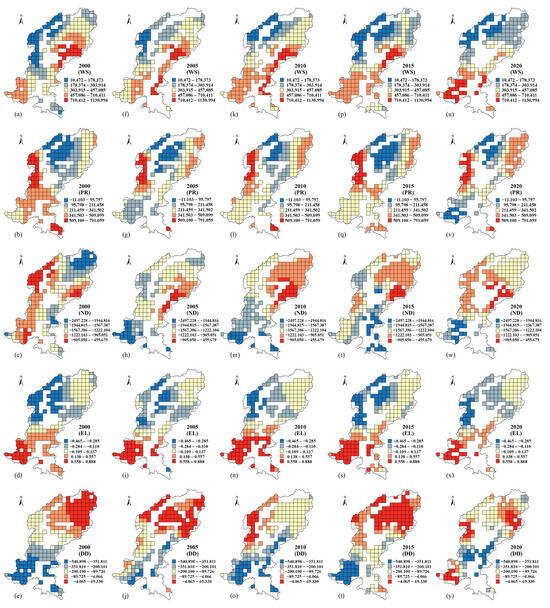
Figure 13.
Spatial distribution of regression coefficients of GTWR, a natural indicator of PM2.5 for green areas during 2000–2020. (a) Spatial distribution of regression coefficients of GTWR for PM2.5 and wind speed in 2000; (b) Spatial distribution of regression coefficients of GTWR for PM2.5 and Precipitation in 2000; (c) Spatial distribution of regression coefficients of GTWR for PM2.5 and NDVI in 2000; (d) Spatial distribution of regression coefficients of GTWR for PM2.5 and Elevation in 2000; (e) Spatial distribution of regression coefficients of GTWR for PM2.5 and Dry deposition in 2000; (f) Spatial distribution of regression coefficients of GTWR for PM2.5 and wind speed in 2005; (g) Spatial distribution of regression coefficients of GTWR for PM2.5 and Precipitation in 2005; (h) Spatial distribution of regression coefficients of GTWR for PM2.5 and NDVI in 2005; (i) Spatial distribution of regression coefficients of GTWR for PM2.5 and Elevation in 2005; (j) Spatial distribution of regression coefficients of GTWR for PM2.5 and Dry deposition in 2005; (k) Spatial distribution of regression coefficients of GTWR for PM2.5 and wind speed in 2010; (l) Spatial distribution of regression coefficients of GTWR for PM2.5 and Precipitation in 2010; (m) Spatial distribution of regression coefficients of GTWR for PM2.5 and NDVI in 2010; (n) Spatial distribution of regression coefficients of GTWR for PM2.5 and Elevation in 2010; (o) Spatial distribution of regression coefficients of GTWR for PM2.5 and Dry deposition in 2010; (p) Spatial distribution of regression coefficients of GTWR for PM2.5 and wind speed in 2015; (q) Spatial distribution of regression coefficients of GTWR for PM2.5 and Precipitation in 2015; (r) Spatial distribution of regression coefficients of GTWR for PM2.5 and NDVI in 2015; (s) Spatial distribution of regression coefficients of GTWR for PM2.5 and Elevation in 2015; (t) Spatial distribution of regression coefficients of GTWR for PM2.5 and Dry deposition in 2015; (u) Spatial distribution of regression coefficients of GTWR for PM2.5 and wind speed in 2020; (v) Spatial distribution of regression coefficients of GTWR for PM2.5 and Precipitation in 2020; (w) Spatial distribution of regression coefficients of GTWR for PM2.5 and NDVI in 2020; (x) Spatial distribution of regression coefficients of GTWR for PM2.5 and Elevation in 2020; (y) Spatial distribution of regression coefficients of GTWR for PM2.5 and Dry deposition in 2020.
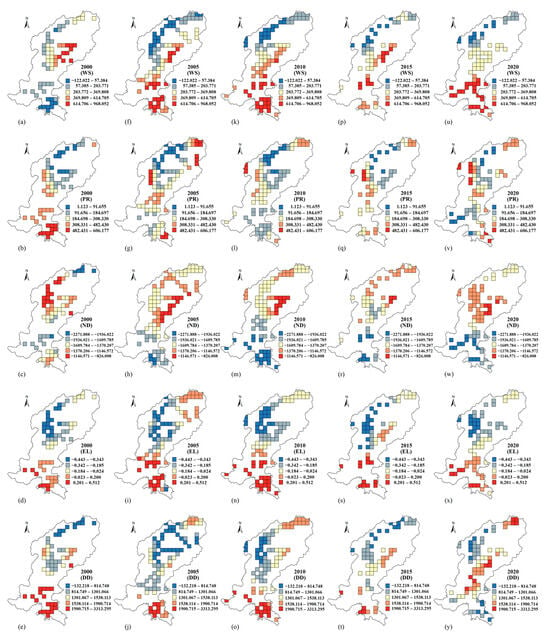
Figure 14.
Spatial distribution of regression coefficients of GTWR, a natural factor indicator of PM2.5 for agricultural lands during 2000–2020. (a) Spatial distribution of regression coefficients of GTWR for PM2.5 and wind speed in 2000; (b) Spatial distribution of regression coefficients of GTWR for PM2.5 and Precipitation in 2000; (c) Spatial distribution of regression coefficients of GTWR for PM2.5 and NDVI in 2000; (d) Spatial distribution of regression coefficients of GTWR for PM2.5 and Elevation in 2000; (e) Spatial distribution of regression coefficients of GTWR for PM2.5 and Dry deposition in 2000; (f) Spatial distribution of regression coefficients of GTWR for PM2.5 and wind speed in 2005; (g) Spatial distribution of regression coefficients of GTWR for PM2.5 and Precipitation in 2005; (h) Spatial distribution of regression coefficients of GTWR for PM2.5 and NDVI in 2005; (i) Spatial distribution of regression coefficients of GTWR for PM2.5 and Elevation in 2005; (j) Spatial distribution of regression coefficients of GTWR for PM2.5 and Dry deposition in 2005; (k) Spatial distribution of regression coefficients of GTWR for PM2.5 and wind speed in 2010; (l) Spatial distribution of regression coefficients of GTWR for PM2.5 and Precipitation in 2010; (m) Spatial distribution of regression coefficients of GTWR for PM2.5 and NDVI in 2010; (n) Spatial distribution of regression coefficients of GTWR for PM2.5 and Elevation in 2010; (o) Spatial distribution of regression coefficients of GTWR for PM2.5 and Dry deposition in 2010; (p) Spatial distribution of regression coefficients of GTWR for PM2.5 and wind speed in 2015; (q) Spatial distribution of regression coefficients of GTWR for PM2.5 and Precipitation in 2015; (r) Spatial distribution of regression coefficients of GTWR for PM2.5 and NDVI in 2015; (s) Spatial distribution of regression coefficients of GTWR for PM2.5 and Elevation in 2015; (t) Spatial distribution of regression coefficients of GTWR for PM2.5 and Dry deposition in 2015; (u) Spatial distribution of regression coefficients of GTWR for PM2.5 and wind speed in 2020; (v) Spatial distribution of regression coefficients of GTWR for PM2.5 and Precipitation in 2020; (w) Spatial distribution of regression coefficients of GTWR for PM2.5 and NDVI in 2020; (x) Spatial distribution of regression coefficients of GTWR for PM2.5 and Elevation in 2020; (y) Spatial distribution of regression coefficients of GTWR for PM2.5 and Dry deposition in 2020;.
(2) Social indicators
Based on the GTWR model, this study calculated the spatiotemporal regression coefficients between PM2.5 concentrations and six socioeconomic indicators across 14 counties within the study area (Table 8a,b). The aim is to quantitatively reveal the spatial heterogeneity in the relationship between PM2.5 concentrations and socioeconomic indicators.

Table 8.
(a,b) Regression coefficients of social indicators and GTWR of PM2.5 concentration.
This study also calculated the correlations between various socioeconomic indicators and both PM2.5 concentration and its dry deposition, aiming to examine the influence of socioeconomic factors on air pollution levels and the ecological capacity for particulate removal (Table 9). The results show that all socioeconomic indicators are significantly positively correlated with PM2.5 concentration. Except for EC, all indicators exhibit significant negative correlations with PM2.5 dry deposition. The model’s R2 and adjusted R2 values indicate that the selected socioeconomic indicators effectively explain the variations in both PM2.5 concentration and dry deposition.

Table 9.
Statistics on the correlation between various economic indicators and PM2.5.
4. Discussion
4.1. Mechanism of PM2.5 Responses to Land Use and Landscape Patterns
Figure 11 presents the spatiotemporal distribution of PM2.5 dust retention rate on green areas during July–September in 2000, 2005, 2010, 2015, and 2020. The relatively higher retention rates observed in the northwestern and central high-elevation regions may be explained by dense vegetation cover and favorable meteorological conditions that promote particle deposition. This pattern is consistent with the findings of Li et al., who also reported stronger dust retention capacity in high-elevation environments [47]. This likely reflects dense vegetation cover and stable plant growth, which promote pollutant–leaf contact and effective particle adsorption [55]. In contrast, the northeastern region maintains lower retention year-round; its high altitude and complex terrain support scattered coniferous forests and alpine meadows with low canopy density, limiting dry-deposition efficiency [56]. These spatial patterns and their temporal fluctuations underscore the combined effects of vegetation management practices and interannual climate variability on PM2.5 capture by green spaces. Nevertheless, the urban areas in the southern sector generally exhibit relatively low dust retention rates, indicating the need for targeted measures—such as optimizing green infrastructure and implementing regular foliar cleansing—to further enhance particulate retention in these regions.
Figure 12 illustrates a steady increase in PM2.5 dust retention rate on agricultural lands from 2000 to 2020, accompanied by notable shifts in spatial distribution. In 2000, dust retention rates were generally low, with high-rate patches dispersed across the landscape. Between 2005 and 2015, dust retention rates climbed annually, and prominent hotspots gradually concentrated in the central and southern sectors. By 2020, these high-retention areas expanded further, forming more continuous clusters. This pattern reflects the dominance of broadleaf crops—such as maize, orchards, and vegetables—that offer large foliar surfaces for particle capture [57]. In contrast, regions sown with wheat, soybean, or potato exhibit lower retention due to smaller leaf areas. The overall rise in retention by 2020 may also stem from integrated clean-production initiatives that have reduced ambient PM2.5 levels, thereby enhancing deposition efficiency [58]. Nevertheless, the expansion of high-retention zones signals increased environmental pressure in vulnerable areas, underscoring the need for targeted soil-management and conservation practices.
Land use factors play a critical role in shaping the “source–sink” landscape system’s impact on PM2.5 concentration. As shown in Table 5 and Table 6, construction lands functions predominantly as a “source” landscape [59]. The expansion of construction land, along with increased patch fragmentation and edge density, tends to exacerbate PM2.5 pollution. Therefore, future planning of construction land should aim to regulate edge growth and reduce fragmentation to help mitigate PM2.5 emissions. In contrast, vegetated landscapes serve as “sink” landscapes. Through direct adsorption of PM2.5 by plant surfaces and indirect effects such as transpiration and airflow reduction by tree canopies, vegetation can retain particles and modify local microclimates to suppress dust dispersion [60]. Agricultural and green spaces thus contribute significantly to particulate matter reduction. Given the limited area of water bodies and their exposure to pollutant diffusion from nearby construction zones, the observed rise in PM2.5 concentration in water landscapes may be attributed to these external influences [61]. According to the results in Table 7, enhancing patch aggregation in green areas can effectively reduce PM2.5 levels, whereas increased landscape fragmentation may weaken the capacity of vegetated land types to mitigate air pollution.
4.2. Driving Mechanisms of Natural and Socioeconomic Factors on PM2.5
(1) Driving mechanisms of natural factors
As illustrated in Figure 13, a notable positive correlation exists between PM2.5 concentration and WS in green areas and agricultural lands. WS exerts a pronounced influence on PM2.5 concentrations in green areas within the south-central and southwestern regions of the study area. Conversely, its impact is relatively limited in the northwestern and northeastern zones. This is due to the differing rates of ground-transfer winds at varying elevations, which in turn result in disparate levels of transport and dispersion of PM2.5 particulate matter. The flat terrain facilitates the diffusion of PM2.5 particulate matter. However, as elevation increases in the northwest and northeast, it impedes the diffusion of PM2.5 particulate matter, thereby exerting a pronounced interactive effect of EL and WS on the diffusion of PM2.5 particulate matter in this region. This, in turn, gives rise to disparities in the accumulation of PM2.5 concentrations [62]. As illustrated in Figure 14, the impact of WS on PM2.5 concentration in agricultural land exhibited a progressive intensification from Daixian (DC) and Fanshi (FS) to the central urban zone of Taiyuan City, Yuci (YC), and other regions. This is due to the fact that the areas designated as Daixian (DC), Fanshi (FS), and other areas predominantly comprise villages, whereas the southeastern region constitutes the core and primary urban center of the study area. The presence of urban buildings with varying heights exerts a discernible impact on the transmission and diffusion of PM2.5, thereby imparting a degree of clustering effect on the PM2.5 concentration [63]. As illustrated in Figure 9 and Figure 11, the interaction between EL and WS on PM2.5 in green areas has been observed to enhance the dust retention effect of green areas on PM2.5, while also increasing the dry deposition of PM2.5 to a certain extent. The agricultural landscapes were primarily concentrated in the narrow plains in the central part of the study area, which resulted in a negligible and non-significant impact of EL on the spatial and temporal distribution of PM2.5.
As illustrated in Figure 9 and Figure 10, the maximum values of dry deposition on green areas and agricultural lands in August of each year were observed to be lower than those recorded in July and September of the same year. Given that August falls within the study area’s rainy season, it can be inferred that the impact of green areas and agricultural land on dry deposition of PM2.5 will diminish with an increase in PR. This is due to the fact that precipitation processes will elute the PM2.5 particulate matter deposited on the surface of vegetation, thereby reducing the retention time of PM2.5 on the surface of vegetation and consequently decreasing the dry deposition of PM2.5 on green areas and agricultural lands [64]. It has been demonstrated in related studies that when precipitation is weak or accompanied by the compounding effect of WS, the eluted particulate matter will be resuspended into the atmospheric environment along with the evapotranspiration process of rainwater, resulting in a rebound of PM2.5 concentration [65].
The magnitude of the ND value is indicative of the growth of vegetation and crops, as well as the degree of regional vegetation cover. Since 2005, the regression coefficient of ND in the southwestern region has shown an increasing trend, gradually expanding toward central areas from 2010 onward. This indicates a progressively enhanced PM2.5 retention effect of ND in these regions. This suggests that the influence of ND on PM2.5 in this region is undergoing gradual intensification. This can be attributed to the initiative to increase the regional forest greening rate, as outlined in the “11th Five-Year Plan” (2006–2010) for Taiyuan. During this period, the forest greening rate in Taiyuan increased by 4.45%, and the greening coverage rate of the built-up area increased from 36.1% to 41% [66]. During the “12th Five-Year Plan” (2010–2015), the existing ecological woodland in Taiyuan City increased from 76,446.74 ha to 97,482.14 ha, while in Xinzhou City, it increased from 335,115.36 ha to 427,598.03 ha [67]. The “13th Five-Year Plan” (2016–2020) for gardening and greening in Taiyuan highlighted the importance of increasing the forest vegetation coverage rate in the mountains surrounding the city to 42.87% by the end of 2020. Additionally, the plan set a target of 1240.31 ha for the creation of new urban green areas [68]. The spatial distribution of ND regression coefficients indicates that the ND of green areas in the vicinity of Taiyuan city is more responsive to PM2.5 in the presence of relevant policies. Additionally, the vegetation cover of green areas in the eastern and northern parts of the study area exhibits a slower rate of increase, resulting in a diminished impact on the PM2.5 concentration value in these regions. Figure 14 illustrates a robust negative correlation between the ND of agricultural land and PM2.5 concentration, which contrasts with the positive correlation observed in previous studies [69]. This is due to the fact that during the period of July to September in the study area, crops commenced the transition from the growing to the maturity stage. During this period, the natural growth process of vegetation was not affected by human activities such as mechanical harvesting and straw burning. To a certain extent, arable crops can be considered to have a similar adsorption and degradation function with respect to PM2.5 pollutants as green areas vegetation.
The correlation between DD and PM2.5 concentration in green areas is negative. Figure 13 illustrates a significant negative correlation between DD and PM2.5 in the Gujiao (GJ) area between the years 2000 and 2020. This indicates that the dry deposition process of the green areas has a considerable impact on reducing the concentration of PM2.5 in the area, thereby optimizing the regional atmospheric environment. As illustrated in Figure 6, the PM2.5 concentration in the Gujiao (GJ) area has consistently remained below that of the main city of Taiyuan over an extended period. This can be attributed to the presence of a mountainous barrier between the two regions, which has effectively impeded the diffusion of PM2.5 particulate matter into the Gujiao (GJ) area, maintaining a relatively low PM2.5 concentration in the region over time. Additionally, Figure 11 illustrates that the green areas dust retention rate in Gujiao (GJ) has remained consistently high for an extended period. The elevated dust retention rate, coupled with the low pollutant concentration in the background, has resulted in a pronounced negative correlation between DD and PM2.5 in the region. As illustrated in Figure 6, It can be observed that the green area landscapes of Wutai (WT) and Fanshi (FS) in the northeast of the study area are situated at a considerable distance from the pollution sources of industrial production and the emission sources of human activities. Additionally, the background value of PM2.5 concentration is relatively low in this area. The green areas in this region is characterized by a single type of vegetation, which is influenced by the high-altitude mountainous landform. This vegetation has a weaker effect on the dry deposition of PM2.5, which in turn has resulted in a weak correlation between the DD of green areas in this area and PM2.5 over time. The value of the DD regression coefficient for agricultural land (Figure 14) indicates that during the period of 2000–2010, the concentration area with the highest value in the entire study area is the surrounding districts and counties centered on Taiyuan City. This is due to the proximity of arable crops to populated areas, which are subject to human activities that interfere with the effective process of dry deposition of the agricultural land vegetation. Concurrently, the mechanical utilization of agricultural activities, among other factors, gives rise to the formation of novel PM2.5 particles, thereby establishing a positive correlation between DD and PM2.5. The regression coefficients of DD and PM2.5 in the northern part of Yuanping (YP) and Daixian (DC) exhibited a decline, accompanied by a shift from a positive to a negative correlation in the areas of Daixian (DC), Wutai (WT), and others. This phenomenon, when considered alongside Figure 6, can be attributed to the relatively low concentration of PM2.5 in this region. The abatement of PM2.5 by the dry deposition process of crops has a significant impact on the optimization of regional air quality. From 2015 to 2020, the regression coefficient for DD exhibited an increase for Xinfu (XF), Dingxiang (DX), and Fanshi (FS) (Figure 14), indicating that the abatement of PM2.5 concentration by agricultural land landscapes in the process of urban cluster construction is influenced by a multitude of factors and does not significantly optimize regional air quality.
(2) Driving mechanisms of socioeconomic factors
Some scholars have investigated the significance of urban integration in socioeconomic development from the vantage point of socio-spatial dynamics. This perspective posits that spatial transformations associated with urban integration exert an influence on social structure and community relations [70]. Urban integration represents a significant process whereby urban and rural socio-spatial forces converge and coexist. It can be conceptualized as a form of “spatial succession,” encompassing the transformation of residential, production, and public spaces [71]. The transformation of social networks subsequent to the migration of rural residents to urban areas, a consequence of urban integration, has influenced regional social relations and regional economic development [72]. By employing a socio-spatial dynamics lens, it is feasible to conduct a more exhaustive examination of the manner in which regional PM2.5 concentration fluctuates in response to an array of socioeconomic indicators throughout the process of urban integration.
The regression coefficient value of GDP in the study area in 2000 (Table 8a) indicates a combination of positive and negative coefficients. The positive correlation is primarily evident in Taiyuan City and YC, which are the core areas of economic and social development and human activities in the study area. Since 2005, as the regional economic development model began to prioritize cleaner production, the Shanxi Provincial Government implemented a series of energy-saving and emission-reduction initiatives and goals [73]. Under the guidance of relevant policies, GDP and PM2.5 concentration began to exhibit a negative correlation, indicating that economic growth and environmental quality are increasingly aligned. This suggests that economic growth and environmental quality are developing in a more harmonious manner. However, due to the varying stages of socioeconomic development across regions, the predominant types of industries and production efficiency vary considerably, leading to spatial and temporal heterogeneity in the regression coefficient values.
AVSI represents the economic added value of regional industrial processing and production industries, including those in the energy, extractive, manufacturing, and construction sectors. The actual production process of each of these industries is accompanied by the emission of various forms of pollutants. From 2000 to 2020, the regression coefficient value of AVSI exhibited a gradual shift from negative to positive values (Table 8a), indicating a transition from a negative to a positive correlation between AVSI and PM2.5 concentration across all counties and districts. Additionally, the incremental increase in pollutant emissions associated with the ongoing urban integration construction in the study area contributed to the rising regional PM2.5 pollution level [74].
TIOV regression coefficients from the time series (Table 8b) demonstrate that the overall positive value is predominantly evident from 2000 to 2015, indicating a positive correlation between TIOV and PM2.5. This indicates that the integrated development of the city has resulted in regional economic growth, which has been accompanied by a surge in fossil energy consumption. This, in turn, will lead to an increase in PM2.5 concentration [75]. The 2020 TIOV regression coefficient exhibited a negative value, indicating that the implementation of a series of related policies, such as cleaner production and energy saving, has a more pronounced positive effect on reducing the concentration of PM2.5 in the region. The results of this study also suggest that the management of pollutant sources can contribute to sustained improvements in the regional atmospheric environment.
From the perspective of the NOP (Table 8b), the impact of population size on PM2.5 has been predominantly positive in all years of the last 20 years, with the exception of 2000, when the correlation was negative. The construction of urban integration has led to an increase in the frequency of rural-urban population movement, which has in turn led to an increase in regional energy consumption and automobile exhaust emissions. This has resulted in an indirect increase in the concentration of pollutants such as PM2.5, as well as an increase in regional alkaline pollutant gases such as ammonia [76]. Furthermore, the process of population migration is accompanied by a notable increase in emissions from utilities such as power generation and heating, as well as from the heavy industry sector [77].
EC is an essential metric for assessing the energy consumption of regional equipment and products (Table 8b). In 2000, a notable positive correlation was observed between EC and PM2.5 concentration in Taiyuan and YC, indicating that electric energy consumption is a primary contributor to regional PM2.5 [78]. From 2005 to 2020, the EC regression coefficients of the major districts and counties in the study area all exhibited a positive shift, particularly in the core areas of economic development. This indicates that with the process of urban integration, the energy consumption of all industries increased significantly. The integrated urban development process, which relies primarily on fossil fuels such as coal and petroleum as its source of energy, will inevitably result in an intensification of localized air pollution, resulting in high PM2.5 concentrations [79]. The rising concentration of PM2.5 in the outdoor environment and the relocation of human activities from outdoor to indoor settings to circumvent the health effects of air pollution also elevate the EC value, which in turn reinforces the positive correlation between EC and PM2.5 even further [80].
The construction industry plays a pivotal role in the process of urban integration. The regression coefficient value of TOC demonstrates a precipitous decline from 2000 to 2005 (Table 8b), indicating that the contribution of TOC to PM2.5 commenced a sharp decrease during this period. This is attributable to the enactment and implementation of the inaugural version of the cleaner production regulations by the local government in 1999, which established the mandates for energy conservation and emission reduction in the construction industry and strictly regulated the contribution of TOC to the regional PM2.5 [81]. From 2005 to 2015, the value of the TOC regression coefficient continued to decrease and began to change from positive to negative, indicating that the production process in the construction industry began to no longer have an impact on regional air quality. This can be attributed to the fact that since 2011, China has formulated the “12th Five-Year Plan” for the development of the construction industry, which sets out clear targets for energy saving and emission reduction in construction [82].
Table 9 illustrates a significant correlation between PM2.5 concentration and dry deposition with each economic indicator. PM2.5 concentration demonstrates a notable positive correlation with GDP, indicating that regional GDP exerts a considerable influence on PM2.5 concentration, with TOC and AVSI also exerting a notable effect. Conversely, the dry deposition of PM2.5 exhibits a negative correlation with each economic indicator, with the exception of EC, which exerts a notable effect on PM2.5 dry deposition. The remaining indicators exert a significant influence on PM2.5 dry deposition, with TOC and GDP exerting a more pronounced effect on PM2.5 dust retention. In the context of integrated urban development, the growth of GDP and other economic indicators is likely to have a negative impact on regional air quality. Consequently, it is essential to implement further controls on pollutant emissions associated with industrial and construction activities. This will entail optimizing production processes, reducing reliance on the energy industry, exploring alternative avenues of economic growth and formulating low-carbon and environmentally friendly industrial development plans.
5. Conclusions
This study quantitatively assessed the multi-scale effects of natural and socioeconomic factors on PM2.5 concentrations and dry deposition in the TYX region under the context of urban integration. The results demonstrate that PM2.5 distribution is jointly influenced by topographic, meteorological, land use, and socioeconomic variables. The spatial configuration of source–sink landscape systems plays a critical role, with construction land acting as a PM2.5 source and green areas serving as sinks. The spatial spillover of PM2.5 further underscores the importance of regional coordination rather than isolated local governance. In particular, promoting urban integration and improving the spatial layout of green spaces—by increasing patch size, connectivity, and dominance—can enhance PM2.5 removal capacity. Simultaneously, controlling the fragmentation and edge complexity of construction land is essential for mitigating pollution.
Methodologically, the use of an 8 km × 8 km grid unit in GTWR analysis helped to reduce the limitations imposed by administrative boundaries and revealed spatial heterogeneity in PM2.5 responses. The study also highlights the importance of selecting appropriate spatial scales when analyzing landscape-ecological processes, as different scales may affect the interpretation and reliability of results. These findings provide theoretical support for atmospheric environmental governance and offer practical guidance for land planning and regional integration strategies.
Author Contributions
Conceptualization, J.Y. and Y.Z., methodology, Software, data curation, formal analysis, writing, J.Y.; Review, J.Y. and Y.Z. All authors have read and agreed to the published version of the manuscript.
Funding
This research was funded by the Ministry of Education’s Program for Young Backbone Teachers from Central and Western Higher Education Institutions to Undertake Domestic Visiting Programs in 2023.
Institutional Review Board Statement
Not applicable.
Informed Consent Statement
Not applicable.
Data Availability Statement
Publicly available datasets were analyzed in this study. This data can be found here: [http://www.gscloud.cn; http://www.geodata.cn; www.xihe-energy.com].
Acknowledgments
Thanks for the data support from National Earth System Science Data Center, National Science & Technology Infrastructure of China.
Conflicts of Interest
The authors declare no conflicts of interest.
References
- Fang, C.; Yu, D. Urban Agglomeration: An Evolving Concept of an Emerging Phenomenon. Landsc. Urban Plan. 2017, 162, 126–136. [Google Scholar] [CrossRef]
- Gao, X.; Xu, Z.; Niu, F.; Long, Y. An Evaluation of China’s Urban Agglomeration Development from the Spatial Perspective. Spat. Stat. 2017, 21, 475–491. [Google Scholar] [CrossRef]
- Gottmann, J. Megalopolis or the Urbanization of the Northeastern Seaboard. Econ. Geogr. 1957, 33, 189–200. [Google Scholar] [CrossRef]
- Lang, R.; Knox, P.K. The New Metropolis: Rethinking Megalopolis. Reg. Stud. 2009, 43, 789–802. [Google Scholar] [CrossRef]
- Kanemoto, Y.; Tokuoka, K. Proposal for the Standards of Metropolitan Areas of Japan. J. Appl. Reg. Sci. 2002, 7, 1–15. [Google Scholar]
- Zhang, Y.W.; Liu, S.L. China’s Practice, Concept Interpretation and Strategies on Cities’ Integration. Beijing Soc. Sci. 2023, 2, 33–44. [Google Scholar] [CrossRef]
- Ji, X.; Yao, Y.; Long, X. What Causes PM2.5 Pollution? Cross-Economy Empirical Analysis from Socioeconomic Perspective. Energy Policy 2018, 119, 458–472. [Google Scholar] [CrossRef]
- Tian, L.; Cheng, W. Shanxi Starts to Build the Greater Taiyuan Metropolitan Area. People’s Political Consultative Conference Daily, 22 October 2005. [Google Scholar]
- Shanxi Provincial Bureau of Statistics. Shanxi Statistical Yearbook; China Statistics Press: Beijing, China, 2013. [Google Scholar]
- Yang, S.-Y.; Yu, X.-Y.; Zhao, X.-Y.; Li, Y.-Y.; Shun, H.-P.; Tian, Z.-J.; Li, Y.; Wu, S.; Wang, Z.-H. Characteristics of Key Size Spectrum of PM2.5 Affecting Winter Haze Pollution in Taiyuan. Environ. Sci. 2018, 39, 2512–2520. [Google Scholar] [CrossRef]
- World Health Organization. Air Quality Guidelines: Global Update 2005: Particulate Matter, Ozone, Nitrogen Dioxide, and Sulfur Dioxide; World Health Organization: Geneva, Switzerland, 2006. [Google Scholar]
- Zhou, M.; He, G.; Fan, M.; Wang, Z.; Liu, Y.; Ma, J.; Ma, Z.; Liu, J.; Liu, Y.; Wang, L. Smog Episodes, Fine Particulate Pollution and Mortality in China. Environ. Res. 2015, 136, 396–404. [Google Scholar] [CrossRef]
- Huang, R.-J.; Zhang, Y.; Bozzetti, C.; Ho, K.-F.; Cao, J.-J.; Han, Y.; Daellenbach, K.R.; Slowik, J.G.; Platt, S.M.; Canonaco, F. High Secondary Aerosol Contribution to Particulate Pollution during Haze Events in China. Nature 2014, 514, 218–222. [Google Scholar] [CrossRef]
- Lim, S.S.; Vos, T.; Flaxman, A.D.; Danaei, G.; Shibuya, K.; Adair-Rohani, H.; AlMazroa, M.A.; Amann, M.; Anderson, H.R.; Andrews, K.G. A Comparative Risk Assessment of Burden of Disease and Injury Attributable to 67 Risk Factors and Risk Factor Clusters in 21 Regions, 1990–2010: A Systematic Analysis for the Global Burden of Disease Study 2010. Lancet 2012, 380, 2224–2260. [Google Scholar] [CrossRef]
- Wang, Q.; Wang, J.; Zhou, J.; Ban, J.; Li, T. Estimation of PM2· 5-Associated Disease Burden in China in 2020 and 2030 Using Population and Air Quality Scenarios: A Modelling Study. Lancet Planet. Health 2019, 3, e71–e80. [Google Scholar] [CrossRef]
- Zhang, Q.; He, K.; Huo, H. Cleaning China’s Air. Nature 2012, 484, 161–162. [Google Scholar] [CrossRef] [PubMed]
- Delfino, R.J.; Sioutas, C.; Malik, S. Potential Role of Ultrafine Particles in Associations between Airborne Particle Mass and Cardiovascular Health. Environ. Health Perspect. 2005, 113, 934–946. [Google Scholar] [CrossRef] [PubMed]
- Tao, J.; Zhang, L.; Cao, J.; Zhang, R. A Review of Current Knowledge Concerning PM2.5 Chemical Composition, Aerosol Optical Properties and Their Relationships across China. Atmospheric Chem. Phys. 2017, 17, 9485–9518. [Google Scholar] [CrossRef]
- Lin, Y.; Zou, J.; Yang, W.; Li, C.-Q. A Review of Recent Advances in Research on PM2.5 in China. IJERPH 2018, 15, 438. [Google Scholar] [CrossRef]
- Jiang, N.; Jiang, W.; Zhang, J.; Chen, H. Can National Urban Agglomeration Construction Reduce PM2.5 Pollution? Evidence from a Quasi-Natural Experiment in China. Urban Clim. 2022, 46, 101302. [Google Scholar] [CrossRef]
- Zhang, X.; Cheng, C. Temporal and Spatial Heterogeneity of PM2.5 Related to Meteorological and Socioeconomic Factors across China during 2000–2018. Int. J. Environ. Res. Public Health 2022, 19, 707. [Google Scholar] [CrossRef]
- Yun, G.; Zhao, S. The Imprint of Urbanization on PM2.5 Concentrations in China: The Urban-Rural Gradient Study. Sustain. City Soc. 2022, 86, 104103. [Google Scholar] [CrossRef]
- Wang, S.; Wang, D.; Yang, X. Urbanization and Its Impacts on Water Environment in Tumen River Basin. Chin. Geogr. Sci. 2002, 12, 273–281. [Google Scholar] [CrossRef]
- Liu, H.; Ma, W.; Qian, J.; Cai, J.; Ye, X.; Li, J.; Wang, X. Effect of Urbanization on the Urban Meteorology and Air Pollution in Hangzhou. J. Meteorol. Res. 2015, 29, 950–965. [Google Scholar] [CrossRef]
- Mi, Y.; Sun, K.; Li, L.; Lei, Y.; Wu, S.; Tang, W.; Wang, Y.; Yang, J. Spatiotemporal Pattern Analysis of PM2.5 and the Driving Factors in the Middle Yellow River Urban Agglomerations. J. Clean. Prod. 2021, 299, 126904. [Google Scholar] [CrossRef]
- Li, Z.; Zhang, X.; Liu, X.; Yu, B. PM2.5 Pollution in Six Major Chinese Urban Agglomerations: Spatiotemporal Variations, Health Impacts, and the Relationships with Meteorological Conditions. Atmosphere 2022, 13, 1696. [Google Scholar] [CrossRef]
- Shan, Y.; Wang, X.; Wang, Z.; Liang, L.; Li, J.; Sun, J. The Pattern and Mechanism of Air Pollution in Developed Coastal Areas of China: From the Perspective of Urban Agglomeration. PLoS ONE 2020, 15, e0237863. [Google Scholar] [CrossRef]
- Guo, X.; Cui, Y.; Wang, K.; He, Q.; Wang, X. Chemical Characteristics of 3-Year Atmospheric Precipitation in Summer, Taiyuan. Huanjing Kexue Environ. Sci. 2015, 36, 388–395. [Google Scholar] [CrossRef]
- Wang, P.; Zhang, G.; Chen, F.; He, Y. A Hybrid-Wavelet Model Applied for Forecasting PM2.5 Concentrations in Taiyuan City, China. Atmos. Pollut. Res. 2019, 10, 1884–1894. [Google Scholar] [CrossRef]
- Bai, K.; Li, K.; Ma, M.; Li, K.; Li, Z.; Guo, J.; Chang, N.-B.; Tan, Z.; Han, D. LGHAP: The Long-Term Gap-Free High-Resolution Air Pollutant Concentration Dataset, derived via Tensor-Flow-Based Multimodal Data Fusion. Earth Syst. Sci. Data 2022, 14, 907–927. [Google Scholar] [CrossRef]
- Han, J.; Miao, C.; Gou, J.; Zheng, H.; Zhang, Q.; Guo, X. A New Daily Gridded Precipitation Dataset for the Chinese Mainland Based on Gauge Observations. Earth Syst. Sci. Data 2023, 15, 3147–3161. [Google Scholar] [CrossRef]
- Global Modeling and Assimilation Office (GMAO). MERRA-2 tavg1_2d_lnd_Nx, tavg1_2d_rad_Nx, tavg1_2d_slv_Nx: 2d,1-Hourly, Time-Averaged, Single-Level, Assimilation, Diagnostics V5.12.4 (M2T1NXSLV), Land Surface Diagnostics V5.12.4 (M2T1NXLND), Radiation Diagnostics V5.12.4 (M2T1NXRAD); Goddard Earth Sciences Data and Information Services Center (GES DISC): Greenbelt, MD, USA, 2015; Available online: www.xihe-energy.com (accessed on 24 May 2024).
- Hersbach, H.; Bell, B.; Berrisford, P.; Biavati, G.; Horányi, A.; Sabater, J.M.; Nicolas, J.; Peubey, C.; Radu, R.; Rozum, I.; et al. 2018. ERA5 Hourly Data on Single Levels from 1959 to Present. Copernicus Climate Change Service (C3S) Climate Data Store (CDS). Available online: https://doi.org/10.24381/cds.adbb2d47 (accessed on 24 May 2024).
- Guo, X.; Wang, R.; Chen, J.M.; Cheng, Z.; Zeng, H.; Miao, G.; Huang, Z.; Guo, Z.; Cao, J.; Niu, J. Synergetic Inversion of Leaf Area Index and Leaf Chlorophyll Content Using Multi-Spectral Remote Sensing Data. Geo-spatial Inf. Sci. 2025, 28, 22–35. [Google Scholar] [CrossRef]
- Wang, Y.; Fang, H. Estimation of LAI with the LiDAR Technology: A Review. Remote. Sens. 2020, 12, 3457. [Google Scholar] [CrossRef]
- Nowak, D.J.; Crane, D.E. The Urban Forest Effects (UFORE) Model: Quantifying Urban Forest Structure and Functions. In Integrated Tools for Natural Resources Inventories in the 21st Century; Gen. Tech. Rep. NC-212; Hansen, M., Burk, T., Eds.; US Department of Agriculture, Forest Service, North Central Forest Experiment Station: St. Paul, MN, USA, 2000; pp. 714–720. [Google Scholar]
- Ali-Mohamed, A.Y.; Matter, H.A. Determination of Inorganic Particulates:(Cationic, Anionic and Heavy Metals) in the Atmosphere of Some Areas in Bahrain during the Gulf Crisis in 1991. Atmospheric Environ. 1996, 30, 3497–3503. [Google Scholar] [CrossRef]
- Ali-Mohamed, A.Y. Inorganic Chemical Composition of Aerosols Settling in Hamad Town, Bahrain Following Dust Haze Storms. Int. J. Environ. Stud. 2004, 61, 161–171. [Google Scholar] [CrossRef]
- Li, X.; Feng, L.; Huang, C.; Yan, X.; Zhang, X. Chemical Characteristics of Atmospheric Fallout in the South of Xi’an during the Dust Episodes of 2001–2012 (NW China). Atmos. Environ. 2014, 83, 109–118. [Google Scholar] [CrossRef]
- Schaubroeck, T.; Deckmyn, G.; Neirynck, J.; Staelens, J.; Adriaenssens, S.; Dewulf, J.; Muys, B.; Verheyen, K. Multilayered Modeling of Particulate Matter Removal by a Growing Forest over Time, from Plant Surface Deposition to Washoff via Rainfall. Environ. Sci. Technol. 2014, 48, 10785–10794. [Google Scholar] [CrossRef]
- Li, X.; Zhang, T.; Sun, F.; Song, X.; Zhang, Y.; Huang, F.; Yuan, C.; Yu, H.; Zhang, G.; Qi, F. The Relationship between Particulate Matter Retention Capacity and Leaf Surface Micromorphology of Ten Tree Species in Hangzhou, China. Sci. Total. Environ. 2021, 771, 144812. [Google Scholar] [CrossRef] [PubMed]
- Pullman, M. Conifer PM2.5 Deposition and Resuspension in Wind and Rain Events; Cornell University: Ithaca, NY, USA, 2008. [Google Scholar]
- Yao, J.; Wu, S.; Cao, Y.; Wei, J.; Tang, X.; Hu, L.; Wu, J.; Yang, H.; Yang, J.; Ji, X. Dry Deposition Effect of Urban Green Spaces on Ambient Particulate Matter Pollution in China. Sci. Total. Environ. 2023, 900, 165830. [Google Scholar] [CrossRef] [PubMed]
- Liu, C.-Y.; Jin, H.; Fan, J.-L. Input Characteristics of Dry Deposition of Atmospheric Particulates and Metals in Farmland in the Suburb of Nanjing. Huanjing Kexue Environ. Sci. 2023, 44, 1873–1881. [Google Scholar] [CrossRef]
- Zhang, G.; Huang, W.; Pan, Y.; Gu, M.; Lyu, X.; Ni, X.; He, Y.; Liu, B.; Wang, Y.; Tian, S. Dry Deposition Flux of Atmospheric Heavy Metals and Its Source Apportionment in a Typical Farmland of Hebei Province. Chin. J. Eco-Agric. 2019, 27, 1245–1254. [Google Scholar] [CrossRef]
- Mariraj Mohan, S. An Overview of Particulate Dry Deposition: Measuring Methods, Deposition Velocity and Controlling Factors. Int. J. Environ. Sci. Technol. 2015, 13, 387–402. [Google Scholar] [CrossRef]
- Li, J.; Han, L.; Zhang, Z.; Zhou, W.; Li, W.; Qian, Y. Assessment on the Reduction of Atmospheric PM2.5 by Urban Forest and Its Ratio to the Total PM2.5 Pollutant in the Chinese Major Cities. Acta Ecol. Sin. 2023, 43, 2640–2649. [Google Scholar] [CrossRef]
- Li, Y.; Zhao, C.; Jing, X.; Guo, X.; Zhou, J.; Li, R. Characteristics of Dust Haze in Taiyuan and Its Causative Factors. Clim. Environ. Res. 2014, 19, 200–208. [Google Scholar]
- Li, G.; Wei, Q. Impacts of Construction Land Expansion on Landscape Pattern Evolution in China. Dili Xuebao 2019, 74, 2572–2591. [Google Scholar] [CrossRef]
- Li, Z.; Wang, Z.; Liu, X.; Sun, S.; Ma, X.; Zuo, Y. Exploring the impact of Spartina alterniflora management on the use of wetlands and landscape pattern in the Yellow River Delta using the random forest and improved CA-Markov model. Acta Ecol. Sin. 2024, 44, 8366–8382. [Google Scholar] [CrossRef]
- Lu, D.; Mao, W.; Yang, D.; Zhao, J.; Xu, J. Effects of Land Use and Landscape Pattern on PM2.5 in Yangtze River Delta, China. Atmospheric Pollut. Res. 2018, 9, 705–713. [Google Scholar] [CrossRef]
- Huang, B.; Wu, B.; Barry, M. Geographically and Temporally Weighted Regression for Modeling Spatio-Temporal Variation in House Prices. Int. J. Geogr. Inf. Sci. 2010, 24, 383–401. [Google Scholar] [CrossRef]
- Anselin, L. Specification Tests on the Structure of Interaction in Spatial Econometric Models. Papers Reg. Sci. 1984, 54, 165–182. [Google Scholar] [CrossRef]
- Anselin, L. Local Indicators of Spatial Association—LISA. Geogr. Anal. 1995, 27, 93–115. [Google Scholar] [CrossRef]
- Qi, S.; Wang, C.; Niu, Z.; Liu, Z. SVI and VCI Based on NDVI Time-Series Dataset Used to Monitor Vegetation Growth Status and Its Response to Climate Variables. Prog. Geogr. 2004, 23, 91–99. [Google Scholar] [CrossRef]
- Zu, K.; Wang, Z. Research Progress on the Elevational Distribution of Mountain Species in Response to Climate Change. Biodivers. Sci. 2022, 30, 21451. [Google Scholar] [CrossRef]
- Yue, C.; Li, G.; Xi, B.; Cao, Z. Quantitative Comparison of Methods to Assess the Airborne Particulate Matter Retention Capacity of Leaves. Huanjing Kexue Environ. Sci. 2021, 42, 114–126. [Google Scholar]
- The State Council The People’s Republic of China. Guidelines for the Assessment and Acceptance of Cleaner Production Audits. 2018. Available online: https://www.gov.cn/zhengce/zhengceku/2019-10/10/content_5438184.htm (accessed on 12 March 2024).
- Wang, L.; Tai, A.P.; Tam, C.-Y.; Sadiq, M.; Wang, P.; Cheung, K.K. Impacts of Future Land Use and Land Cover Change on Mid-21 St-Century Surface Ozone Air Quality: Distinguishing between the Biogeophysical and Biogeochemical Effects. Atmospheric Chem. Phys. Discuss. 2019, 20, 11349–11369. [Google Scholar] [CrossRef]
- Zhao, C.; Wang, Y.; Wang, Y.; Zhang, H. Interactions between Fine Particulate Matter (PM2.5) and Vegetation: A Review. Chin. J. Ecol. 2013, 32, 2203. [Google Scholar] [CrossRef]
- Tu, M.; Liu, Z.; He, C.; Fang, Z.; Lu, W. The Relationships between Urban Landscape Patterns and Fine Particulate Pollution in China: A Multiscale Investigation Using a Geographically Weighted Regression Model. J. Clean. Prod. 2019, 237, 117744. [Google Scholar] [CrossRef]
- Wang, L.; Huang, L.; Wan, X.; Zhhang, Y.; Wang, H. Progress on the Regulating Effects of Urban Forest Vegetation on Atmospheric Particulate Matter (Especially PM2.5). J. Nanjing For. Univ. (Nat. Sci. Ed.) 2016, 40, 148. [Google Scholar] [CrossRef]
- McCarty, J.; Kaza, N. Urban Form and Air Quality in the United States. Landsc. Urban. Plan. 2015, 139, 168–179. [Google Scholar] [CrossRef]
- Luan, T.; Guo, X.; Zhang, T.; Guo, L. The Scavenging Process and Physical Removing Mechanism of Pollutant Aerosols by Different Precipitation Intensities. J. Appl. Meteorol. Sci. 2019, 30, 279–291. [Google Scholar] [CrossRef]
- Yu, C.; Deng, X.; Shi, C.; Wu, B.; Zhai, Q.; Yang, G.; Huo, Y. The Scavenging Effect of Precipitation and Wind on PM2.5 and PM10. Acta Sci. Circumstantiae 2018, 38, 4620–4629. [Google Scholar] [CrossRef]
- Taiyuan Municipal Development and Reform Commission. The 11th Five-Year Plan for National Economic and Social Development of Taiyuan City. Taiyuan Municipal Development and Reform Commission Website. 2009. Available online: https://fgw.taiyuan.gov.cn/zxghjjd/20090318/803937.html (accessed on 12 March 2024).
- The People’s Government of Shanxi Province. Notice on Printing and Distributing the ‘12th Five-Year Plan’ for the Development of Forestry in Shanxi Province. People’s Government of Shanxi Province Website. 2013. Available online: http://www.shanxi.gov.cn/zfxxgk/zfxxgkzl/fdzdgknr/lzyj/szfbgtwj/202205/t20220513_5977506.shtml (accessed on 12 March 2024).
- Taiyuan Provincial People’s Government. Taiyuan Urban Greening and Landscape Planning for the 13th Five-Year Plan (2016–2020). Taiyuan Provincial People’s Government Website. 2017. Available online: https://fgw.taiyuan.gov.cn/c/site17/zxghjjd/360597.jhtml (accessed on 16 March 2024).
- Yang, W.; Jiang, X.-L. Interannual Characteristics of Fine Particulate Matter in North China and Its Relationship with Land Use and Land Cover Change. Huanjing Kexue Environ. Sci. 2020, 41, 2995–3003. [Google Scholar] [CrossRef]
- Zhu, J. Transition of Villages during Urbanization as Collective Communities: A Case Study of Kunshan, China. Cities 2018, 72, 320–328. [Google Scholar] [CrossRef]
- Wu, Q.; Zhang, X.; Xu, Y.; Li, T. Dualities of Semi-Urbanization Villages in Social-Spatial Transition: A Case Study of Zhoucun Village in Suburban Nanjing, China. J. Rural Stud. 2016, 47, 657–664. [Google Scholar] [CrossRef]
- Xu, Y.; Chan, E.H. Community Question in Transitional China, a Case Study of State-Led Urbanization in Shanghai. J. Urban Plann. Dev. 2011, 137, 416–424. [Google Scholar] [CrossRef]
- The People’s Government of Shanxi Province. Official Notification on Intensifying Efforts to Comprehensively Achieve the Pollution Reduction Objectives Set Forth in the Eleventh Five-Year Plan. People’s Government of Shanxi Province Website. 2010. Available online: http://www.shanxi.gov.cn/zfxxgk/zfxxgkzl/fdzdgknr/lzyj/szfwj/202205/t20220513_5975866.shtml (accessed on 12 March 2024).
- Li, Y.; Liao, Q.; Zhao, X.-G.; Bai, Y.; Tao, Y. Influence of PM 2.5 Pollution on Health Burden and Economic Loss in China. Huanjing Kexue Environ. Sci. 2021, 42, 1688–1695. [Google Scholar] [CrossRef]
- Geng, G.; Zheng, Y.; Zhang, Q.; Xue, T.; Zhao, H.; Tong, D.; Zheng, B.; Li, M.; Liu, F.; Hong, C. Drivers of PM2.5 Air Pollution Deaths in China 2002–2017. Nat. Geosci. 2021, 14, 645–650. [Google Scholar] [CrossRef]
- Wang, Y.; Wen, Y.; Zhang, S.; Zheng, G.; Zheng, H.; Chang, X.; Huang, C.; Wang, S.; Wu, Y.; Hao, J. Vehicular Ammonia Emissions Significantly Contribute to Urban PM2.5 Pollution in Two Chinese Megacities. Environ. Sci. Technol. 2023, 57, 2698–2705. [Google Scholar] [CrossRef]
- Shi, G.; Lu, X.; Deng, Y.; Urpelainen, J.; Liu, L.-C.; Zhang, Z.; Wei, W.; Wang, H. Air Pollutant Emissions Induced by Population Migration in China. Environ. Sci. Technol. 2020, 54, 6308–6318. [Google Scholar] [CrossRef]
- Zhang, K.-K.; Hu, D.-M.; Yan, Y.-L.; Peng, L.; Duan, X.-L.; Yin, H.; Wang, K.; Deng, M.-J. Pollution Characteristics and Influencing Factors of PM 2.5 in Shanxi Province Based on Wavelet Transform. Huanjing Kexue Environ. Sci. 2022, 43, 1226–1234. [Google Scholar] [CrossRef]
- Liang, C.-S.; Duan, F.-K.; He, K.-B.; Ma, Y.-L. Review on Recent Progress in Observations, Source Identifications and Countermeasures of PM2.5. Environ. Int. 2016, 86, 150–170. [Google Scholar] [CrossRef] [PubMed]
- Chen, H.; Shi, T.; Wang, L.; Zheng, A. Air Pollution, Avoidance Behavior and Household Electricity Consumption—Evidence from Prefecture-Level Cities of China. China Econ. Q. 2023, 23, 1865–1882. [Google Scholar] [CrossRef]
- The Standing Committee of the People’s Congress of Shanxi Province. The Taiyuan City Clean Production Regulations. The Standing Committee of the People’s Congress of Shanxi Province Website. 2016. Available online: https://falvdb.com/law/codex/acts/347016 (accessed on 12 March 2024).
- The Central People’s Government of the People’s Republic of China. Notice on the Issuance of the ‘Twelfth Five-Year Plan’ for the Construction Industry. The Central People’s Government of the People’s Republic of China Website. 2011. Available online: https://www.gov.cn/zwgk/2011-08/18/content_1927995.htm (accessed on 16 March 2024).
Disclaimer/Publisher’s Note: The statements, opinions and data contained in all publications are solely those of the individual author(s) and contributor(s) and not of MDPI and/or the editor(s). MDPI and/or the editor(s) disclaim responsibility for any injury to people or property resulting from any ideas, methods, instructions or products referred to in the content. |
© 2025 by the authors. Licensee MDPI, Basel, Switzerland. This article is an open access article distributed under the terms and conditions of the Creative Commons Attribution (CC BY) license (https://creativecommons.org/licenses/by/4.0/).