Abstract
The measurement performance and characteristics of electronic radon monitors with respect to radiological and environmental parameters are investigated. The study includes a sample of 14 different types of devices from nine manufacturers. The devices are currently available on the market with acquisition costs in the low or medium range. For comparison purposes, a high-end AlphaGUARD device is included in the study as a benchmark for measurement performance of radon monitors. Significant differences in the measurement performance are found between the tested instrument types. Overall, however, it can be concluded that most radon monitors perform acceptably and provide reliable information on radon activity concentrations in homes or workplaces, allowing residents and employers to make decisions about the need for radon protection measures. But it turns out that many radon monitors are supplied by the manufacturer with inadequate calibration, so that the instruments must be additionally calibrated in a reference atmosphere before they can be used. Among the tested radon monitors, there are also types with sufficiently good measuring performance, which represent an inexpensive alternative to high-end devices for radon professionals.
1. Introduction
Measurement of radon in homes and workplaces is a necessary prerequisite to demonstrate that health protection requirements are satisfied. Moreover, they also show the need for remediation measures and allow proof of their subsequent success. Measurements are of particular importance if they are carried out for legal reasons to protect workers from elevated radon exposure, as required by Directive 2013/59/EURATOM [1]. Achieving these goals requires accurate and traceable radon measurements that create confidence in the results and acceptance of the decisions made. Providing high-quality instruments that are verifiably suitable for measuring purposes also strengthens the credibility of the instrument manufacturer on the market.
Radon monitors are subject to permanently changing ambient conditions, as well as to different mechanical and electro-magnetic stresses. In order to ensure the quality of the measurements, the instruments must demonstrate sufficient stability in different exposure conditions. To this end, technical standards establish mutually agreed performance requirements that reflect current technical and scientific knowledge. The performance requirements consist of a set of quantities that may be encountered in standard applications of the class of instruments concerned, without claiming to cover all possible situations to which the instrument may be exposed. The selection of quantities will also take into account the availability of test equipment and procedures to perform a conformity assessment. If it is intended to use the instrument under conditions not covered by the specified requirements for standard applications, further performance tests adapted to the expected conditions should be carried out to prove measurement capability.
Specific requirements for electronic instruments measuring radon activity concentration are laid down in the standard series IEC 61577 Part 2 [2]. The conformity of radon instruments with the requirements shall be assessed by testing one or more instruments of the same type. This is referred to as a type or performance test and shall be conducted in appropriate testing facilities.
Due to technological progress, new classes of electronic radon monitors are entering the market. They enable autonomous long-term monitoring of radon activity concentration. The measurement results are stored electronically for later reading and evaluation. Increasingly, modern devices also have the ability to transfer measurement data to a mobile phone. The devices are featured by a handy design and lower cost, facilitating their wide use not only among radon professionals. Low cost, easy handling and attractive design should also be convincing arguments for the general public to monitor the radon situation in their living environment.
When measurements are performed for legal reasons, regular calibration and metrological control of the instrument by an approved laboratory is usually required. The accredited radon laboratory of the Federal Office for Radiation Protection (BfS) offers calibration of radon measuring instruments for customers on request. The applied calibration procedure includes checks and verifications, which also serve the metrological control of the instrument. Instruments with low acquisition costs, such as those used by the general public, often escape metrological control because the need is not known, and manufacturer’s specifications are trusted. It should also not be concealed that, with budget-priced instruments, there is a perceived disproportion between the cost of acquisition and the cost of an approved calibration, as these are often in the same order of magnitude.
The aim of the presented study is to investigate the measurement performance and characteristics of electronic radon monitors under different exposure conditions. Devices which acquisition costs tend to be in the lower or medium range and are offered on the European market by well-known and less well-known manufacturers are selected for the tests. For comparison purposes, a high-end instrument from type AlphaGUARD is included. The study shows the performance of the tested devices and thus supports the user in the selection of suitable devices for the determination of radon activity concentration under the conditions at the intended measurement site. It complements the ongoing activities to assess and improve the quality of radon monitors [3,4,5,6,7,8,9,10,11,12].
2. Materials and Methods
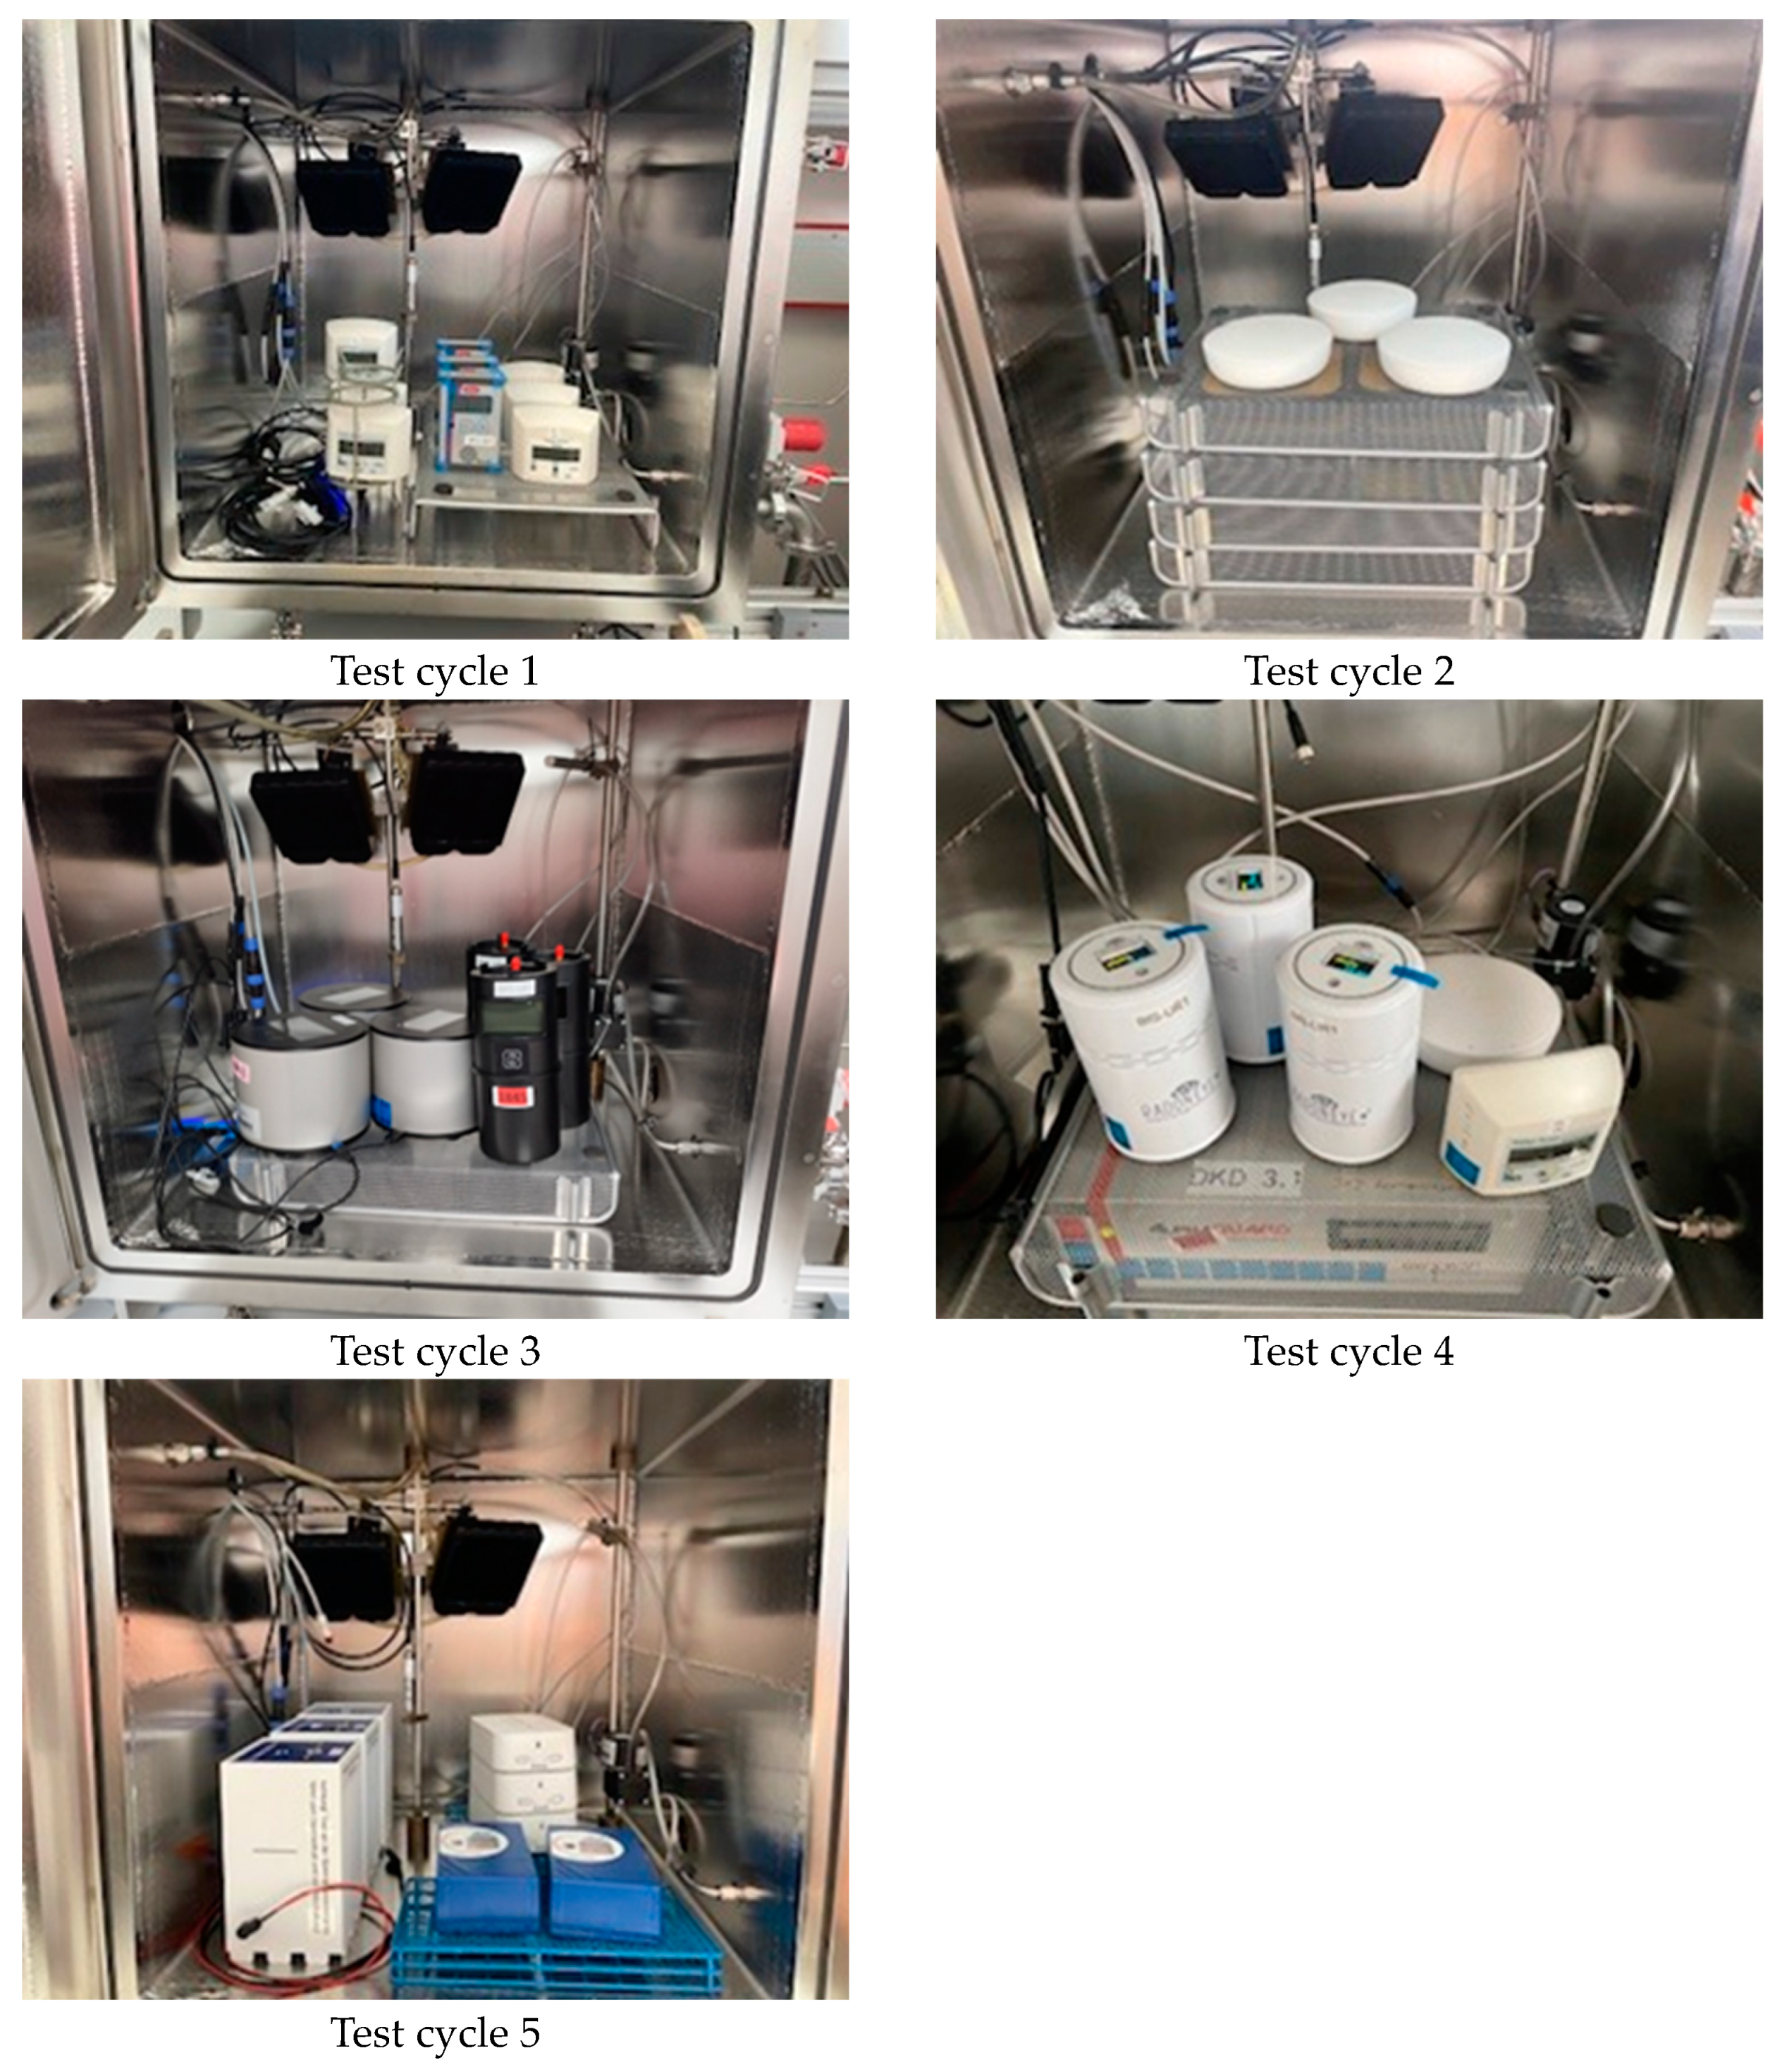
2.1. Electronic Radon Instruments Selected for the Performance Test
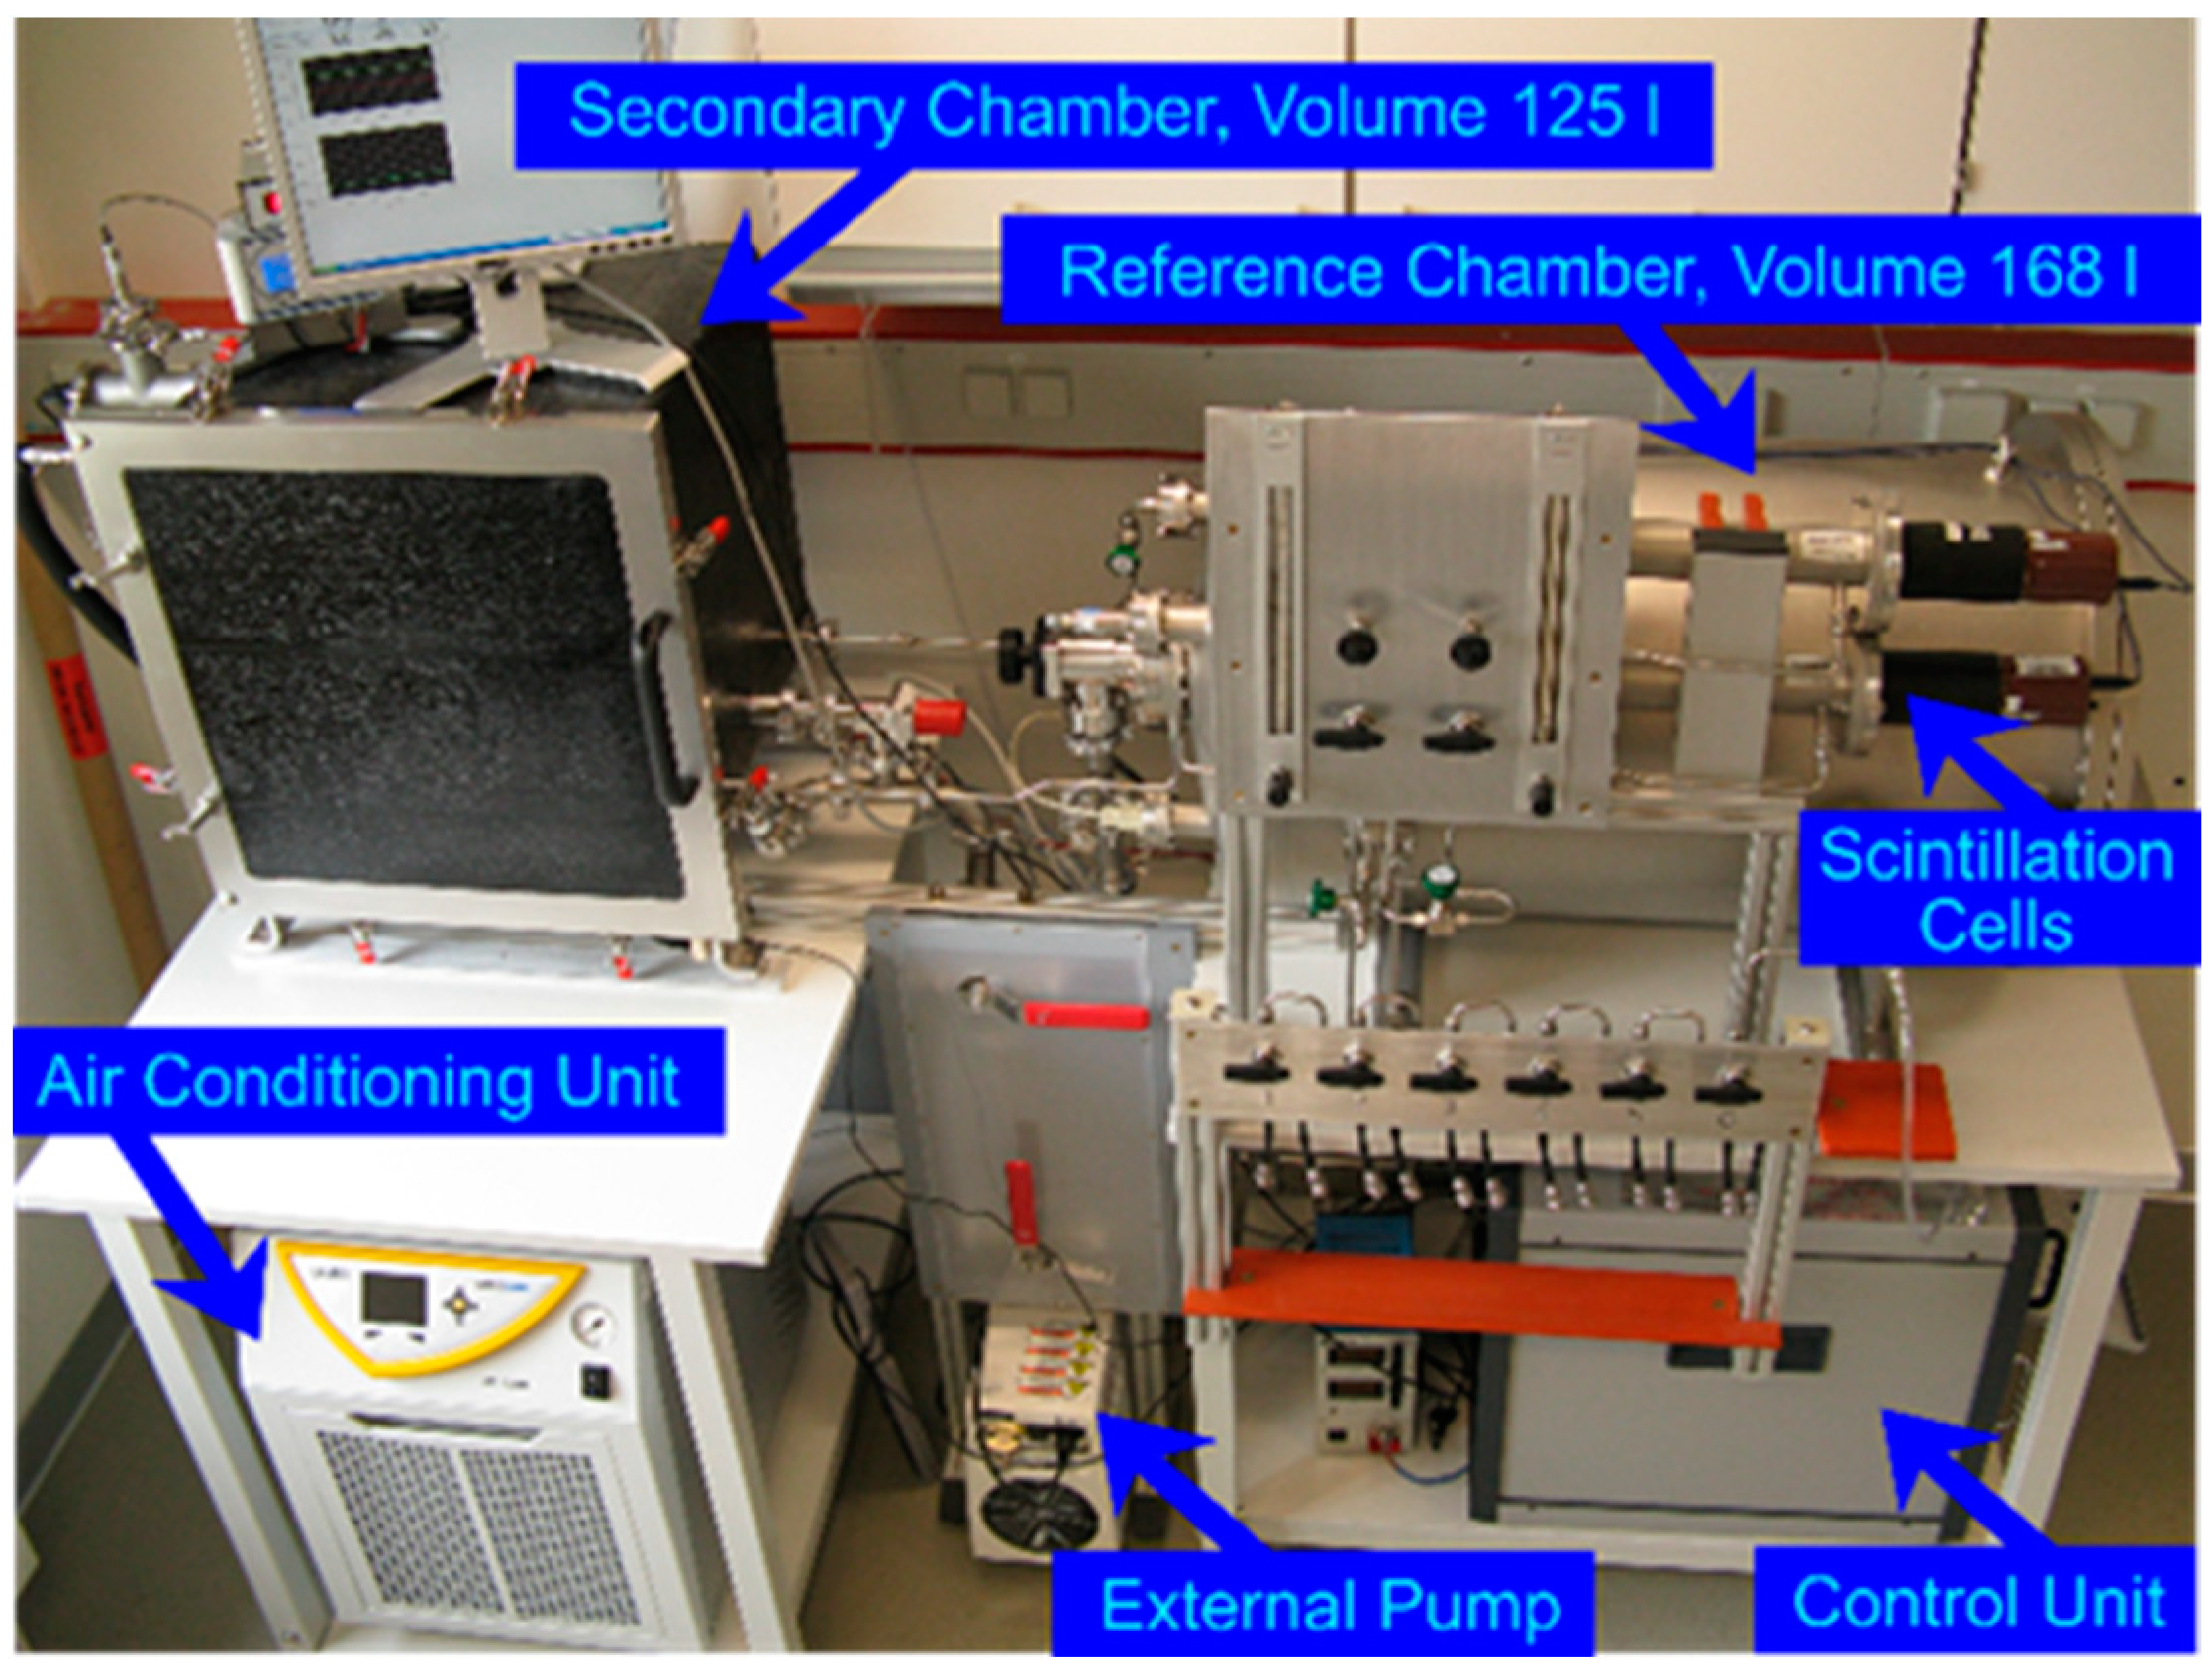
The criterion for selecting a device type is the cost of acquisition, which is between 180 EUR and 1700 EUR per single device. This fulfills the main purpose of the study, which is to include only instruments in lower or medium cost range. An exception to this is the AlphaGUARD device, which is a high-end radon monitor representing the state of technology in the measurement of radon activity concentration. The AlphaGUARD undergoes the same exposure and analysis processes as the other instruments, thus providing a benchmark for the measurement performance of radon monitors.
The devices were purchased on the European market und used for the first time. The Corentium Pro and Corentium Plus devices from the manufacturer Airthings are an exception, as they were purchased in autumn 2021 and provided by a cooperating institute. Care was taken to select devices with different measurement principles and from manufacturers in different countries. Not only market-dominant manufacturers were considered but also devices from niche manufacturers. The selection of the instruments took into account their representativeness in order to reflect the current market situation.
Table 1 compiles the selected types with the serial numbers of the tested devices. Further technical information is taken from the manuals of the devices or the websites of the manufacturers.
Table 1.
Electronic radon monitors selected for the performance test and their technical specifications given by the manufacturer.
2.2. Test Facility
The performance tests are carried out in a facility providing stable and traceable atmospheres in the low activity concentration range of airborne radon [13]. The facility is shown in Figure 1 and consists of a reference chamber with a volume of approx. 168 L traced back to the national reference volume. A secondary test chamber with a volume of approx. 125 L and equipment for circulating radon-laden air between the chambers, as well as instruments for monitoring the radon activity concentration and climatic parameters, complete the facility. The instruments used for monitoring climatic parameters are calibrated at approved calibration laboratories for the measurement quantities.
Figure 1.
Test facility with identification of the main components.
The entire system is pressure-tight to 1200 mbar and vacuum-tight to 1 mbar. The standard operating ranges in which the parameters can usually be kept constant over time are between 800 mbar and 1100 mbar for the air pressure and between 0 °C and 50 °C for the temperature. A professional air conditioning unit is used to set the temperature in the secondary test chamber. Humidity is adjusted by controlled flow through a gas wash cylinder filled with water.
A radon emanation source provided by the Czech Metrological Institute (CMI) with a nominal Radium-226 activity of about 10 kBq is used for the production of Radon-222 [14]. The emanation source can be operated in flow-through or batch mode. In batch mode, radon released over time and accumulated in the gas phase of the source is immediately transferred to the chamber volume. For example, an accumulation of radon in the source over 10 h and subsequent transfer results in an initial radon activity concentration of about 2400 Bq/m3 in the entire chamber system.
In the flow-through mode, a continuous air flow through the source takes up the emanated radon and adds it to the chamber volume. The final radon activity concentration generated in the chamber system depends on the air flow rate. For operation in the flow-through mode, the system is equipped with a calibrated mass flow controller installed upstream of the source to ensure a constant and accurate airflow through the source into the calibration chamber. The value of the flow rate displayed by the controller for standard air conditions is subsequently corrected in relation to the current conditions of the temperature, air pressure and humidity. The excess air is discharged from the chamber system via an outlet. As a result of the flow-through mode, the chamber system is open to the environment so that the air pressure inside the chambers correlates with the pressure outside. This mode of operation allows long constant exposures in the target range between 100 Bq/m3 and 1000 Bq/m3.
To flush the source and chamber system, the air flow is supplied from compressed gas bottles. This ensures a constant quality in the air transfer system with low humidity and a negligible radon background, which does not affect the emanation properties of the source and allows the generation of traceable radon atmospheres.
The radon activity concentrations occurring in the two-chamber system are mathematically described by a system of two linear differential equations, which can be solved exactly [13]. Taking into account the parameters of the source, the air flow rate and the chamber volumes, the time course of the radon activity concentration is thus determined for each operating condition using the finite element method with a standard uncertainty of 1.0% [13]. The calculated radon activity concentrations replace the measurements.
2.3. Standard Test Procedures
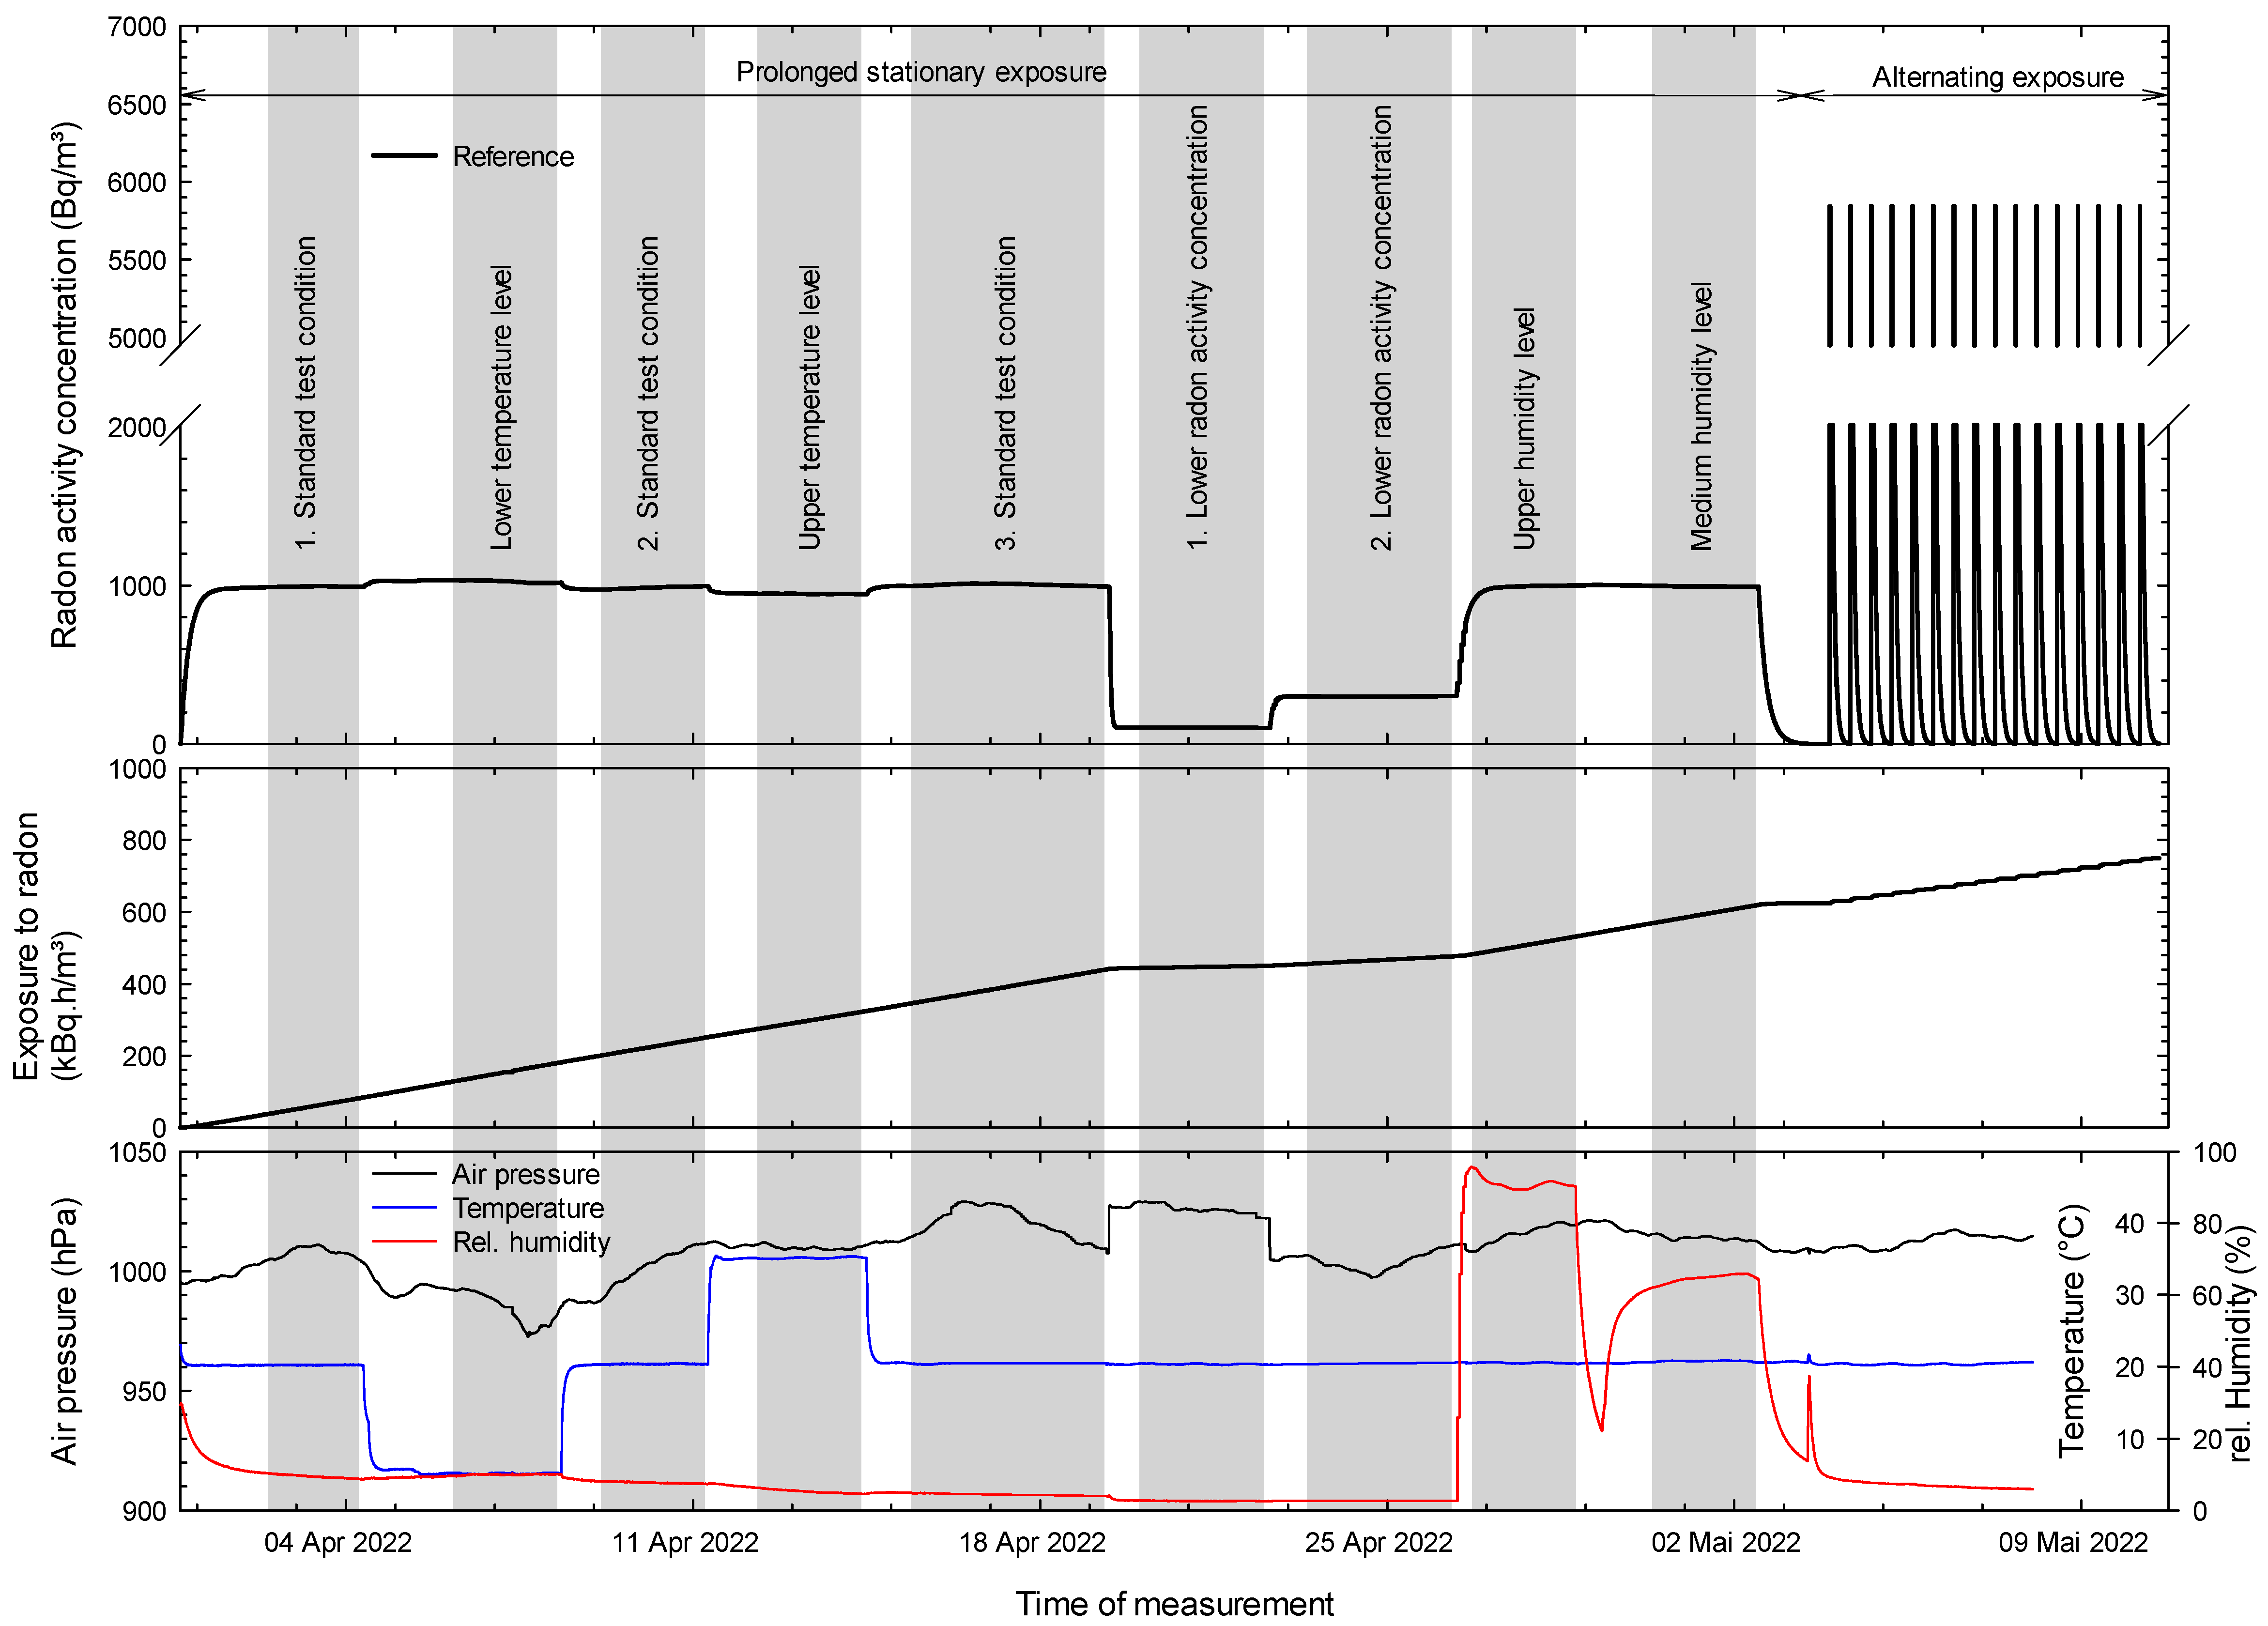
2.3.1. Standard Test Procedures with Variation of Temperature, Relative Humidity and Radon Activity Concentration
The instruments are arranged in the secondary test chamber, as shown in Figure 2. Care is taken to ensure sufficient space between the instruments, as well as to the inner walls of the chamber. Most instruments are placed on a metal stand to also provide distance to the lower inner wall. Low-intensity active ventilation circulates the radon-laden air in the chamber and between the instruments, thus distributing it uniformly throughout the chamber. To process the number of devices, a total of five identical test cycles are executed, each with different device types (up to nine single devices per test cycle).
Figure 2.
Arrangement of the devices to be tested in the various test cycles.
A test cycle is performed by cycling through various stationary exposures in the chamber atmosphere. Starting from a stationary exposure with standard test conditions, the values of temperature, humidity and radon concentration are changed sequentially and kept stable for a longer exposure time in each case. The duration of the exposure period is sufficiently long to achieve stationary state and acquire a number of measurements for statistically significant analyses. After the end of the exposure period, either the next value of the same parameter is set or the value is reset to the default standard test conditions and the next parameter is changed. During a test cycle, the standard test conditions are run three times. The exposure duration and values of the temperature, air pressure, relative humidity and radon activity concentration averaged over the decisive exposure periods are given in Table 2 for the standard test conditions and in Table 3 for tests with the changed individual parameters of the exposure conditions. The data are provided for each stationary exposure period of the respective test cycle.
Table 2.
Standard test conditions for the different test cycles; average values of temperature, air pressure, relative humidity and radon activity concentration during the exposure time.
Table 3.
Test conditions with changes of individual parameters: mean values of temperature, air pressure, relative humidity and radon activity concentration (RnC) during the corresponding exposure period; the initial value of RnC is the radon activity concentration at the start of the test.
The stationary exposure periods are followed by a period of alternating exposures during which short-term fluctuations in radon activity concentrations affect the devices. For this purpose, the radon activity accumulated in the source over 10 h is injected directly into the secondary test chamber all at once. Thereafter, the radon concentration decreases to near zero within 10 h due to decay and purging. The air flow is automatically controlled by electromagnetic valves that run through a predefined time regime. Under constant standard test conditions, the procedure is repeated 16 times for test cycle 1 and approximately the same number of times for the other test cycles.
The time course of the changing conditions in the test chamber is exemplarily shown in Figure 3 for the first test cycle. The time duration needed to complete a test cycle is 6 weeks at least. The upper graph represents the radon activity concentration in the secondary test chamber, the middle the radon exposure and the lower the climatic conditions inside the chamber. The radon exposure is the radon activity concentration accumulated over the exposure time. The corresponding values for temperature and humidity can be taken from the lower graph.
Figure 3.
Scheme of test cycle 1 (exemplarily for the other test cycles; changes in the sequence of the test cycle may occur).
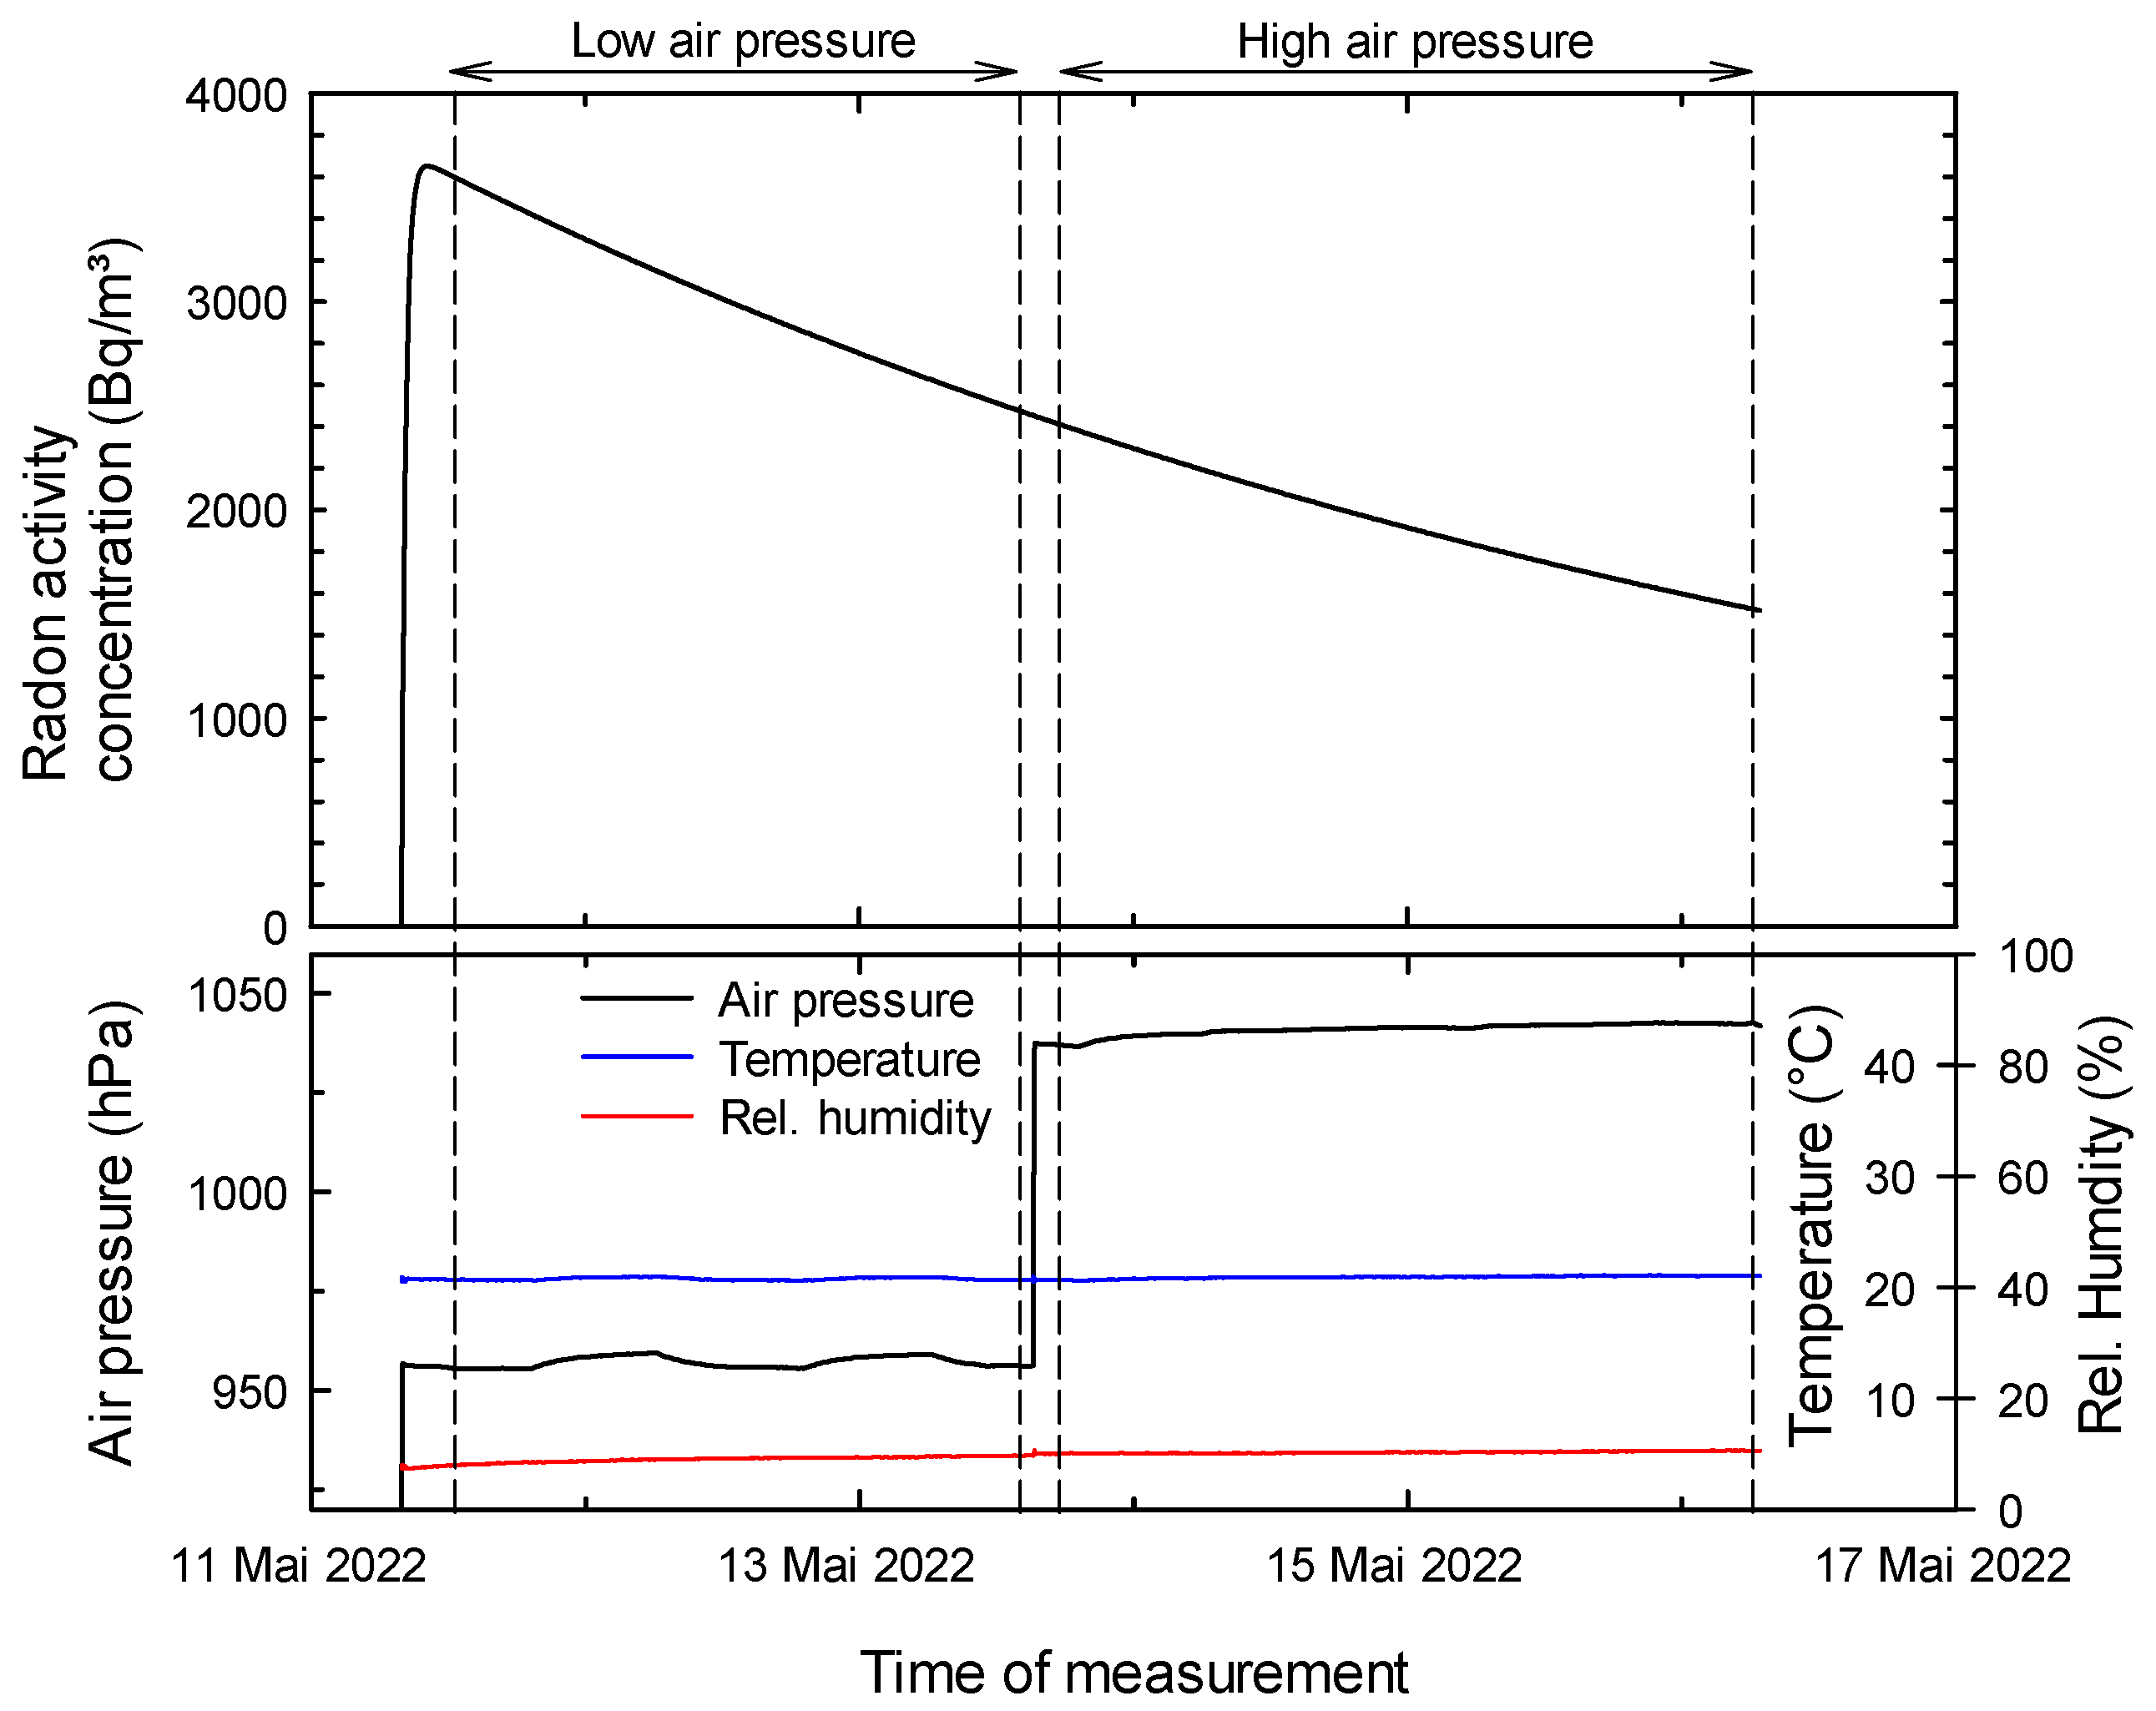
2.3.2. Standard Test Procedure with Variations in the Air Pressure
The test procedure with two specified air pressure levels is performed in batch mode of the source and follows the completion of the previous test procedures. The devices remain in the test chamber. Before the test, the chamber system is sealed off from the environment and the residual radon in the source is flushed out by a short air stream. The source is then closed, allowing the radon to build up over several hours.
At the beginning of the test, the chamber system is evacuated to a pressure of about 850 hPa using a vacuum pump. Then, air from the pressurized gas cylinders is fed into the chamber via the radon source until the lower test value of the air pressure is reached. After the air supply is stopped, all the radon accumulated in the source has been transferred to the chamber. The initial value of radon activity concentration results from the time of radon accumulation in the source and the chamber volume.
Once the chamber system is hermetically sealed from the environment, the radon activity concentration in the chamber volume decreases according to the natural decay of radon. Upon completion of exposure to low atmospheric pressure, the chamber system is filled with air from the pressurized gas cylinders (bypassing the radon source) until the upper atmospheric pressure level is reached and then hermetically sealed again. The test is terminated after a further extended exposure time. As an example of the air pressure test, Figure 4 shows the schematic of the procedure for test cycle 1. The upper graph represents the decrease in radon activity concentration after injection, the lower the time course of temperature, relative humidity and air pressure. The test periods with the constant air pressures are obvious. The exposure duration, air pressure and initial activity concentration of radon are given for the respective test periods in Table 3.
Figure 4.
Scheme of the air pressure test carried out in test cycle 1 (exemplarily for the other test cycles).
2.4. Analysis of Measurements
2.4.1. Measurement Background of the Device
The measurement background is the indication of the device in a radon-free atmosphere. In order to establish a radon-free atmosphere, the air contained in the chamber system is completely replaced by the air supplied from the compressed gas cylinders. Due to the preceding storage of several weeks, the gas cylinders supply air with a negligible low radon content. The air exchange is completed after at least 10 h of purging with an air flow rate of 3 L/min. Then, the indications of the devices are not affected by the radon activity concentration and display the measurement background.
For each device to be tested, the measurement background is determined either before or after the respective test exposure over a period of more than 150 h and, in individual cases, up to more than 1000 h. The long time periods ensure a high statistical significance in the background determination.
2.4.2. Test Value and Test Reference Value
The performance of a device is evaluated by comparing a test value against a test reference value. The analysis makes use of the fact that each test parameter influences the test results independently of the other parameters, so that covariances between different parameters are excluded.
To establish test and test reference values, the mean value of the net indication of the instrument, , and the mean reference radon activity concentration, , each obtained for the same exposure period, are related to each other:
The net indication is the indication of the instrument reduced by its average background. The mean reference radon activity concentration is the average of the actual concentrations values calculated from the solution of the system of two linear differential equations, taking into account the parameters of the source, the air flow rate and the chamber volumes [13]. Since the devices directly output measured values of the radon activity concentration, the value R is unitless.
The test reference value, , is determined according to Equation (1) when the device is exposed to standard test conditions. The test value, , is the quotient according to Equation (1) for exposure times in which the device is exposed to conditions that varied from the standard conditions. The method used here, in which both the test value and the test reference value are related to the radon activity concentration, has the advantage that the test result is independent of the current calibration status of the instrument.
Since the test reference value is the critical comparison value for determining instrument performance, it must satisfy a higher degree of confidence. To achieve this, exposures under standard test conditions are thus performed three times () during each course of the test. The final test reference value, , is the sum of the weighted ratios determined for each exposure under standard test conditions:
The weights, , are calculated from the number, , of individual measurements taken by the instrument during the exposure period in question in relation to the total number of measurements taken during all exposures under standard test conditions:
The relative standard deviation of the test reference value is
The relative standard deviation is also referred to as the coefficient of variation [2].
Unless otherwise specified, the performance of the device with respect to the tested quantity is determined by the relative deviation, , between the test value and the test reference value:
The value for is given as a percentage deviation of the indication at the condition under testing from the indication at the standard test condition. It is only reported if the difference between and is statistically significant. For specific analyses, can also be replaced by another reference value. This is used, for example, when comparing measurements taken at high and medium humidity. In this case, the measured value at medium humidity is considered as the reference.
The measurements taken for the air pressure test must be corrected for the radioactive decay of radon during the test period. By means of the corrected measurements, the test values at low and at high air pressure, and , are determined. Performance for the varying air pressure, , is evaluated using the difference between the test values at low and high air pressure, referred to the common mean and the difference between the air pressures and :
The values for or are determined according to Equation (1) and indicate the sensitivities for the respective air pressures. Values for and given in the unit hPa are used. The result of Equation (6) is the change in sensitivity per 100 hPa increase in air pressure. Such a high difference in air pressure is not to be expected under practical measuring conditions and is only used here for comparison.
2.4.3. Statistical Analysis
The independent samples t-test is used to compare the mean responses of the instrument to two different exposure conditions. The null hypothesis states that both means are equivalent. If the null hypothesis is rejected, the two means differ significantly from each other.
To decide on the equivalence of two means, and , obtained from normal distributed samples of sizes and with standard deviations and , respectively, the test parameter, , is generally provided by the statistical function [15]:
Its application presumes that both and are determined from multiple realizations of the respective variables. However, during the period of stationary exposures, only the standard test conditions are realized several times, while the tests with modified exposure conditions are performed only once each. The relative standard deviation, , of the test reference value is assumed to be equal to that of the test value for the exposure conditions under investigation. When is replaced by and by , it follows from the application of the aforementioned assumption that , and . From Equation (7), it yields
In the case of the measurement performance for the change in air pressure, the respective mean values and standard deviations of the two different air pressures are determined. The test parameter is then directly calculated from Equation (7).
The null hypothesis is verified by the two-sided t-test with degrees of freedom. This study uses an error probability of . The null hypothesis is rejected, and it is concluded that the instrument response to the modified exposure condition is significantly different from the response to the standard test conditions (), if .
The relative standard deviation affects the decision whether the measurement deviation for another characteristic is significant or not. A low value favors that even a small measurement deviation in the characteristics to be tested is classified as significant. With a high relative standard deviation, a non-significant evaluation becomes more likely for the same deviation.
2.5. Investigation of Advanced Metrological Characteristics
2.5.1. Sensitivity
In the context of this performance test, the collected data are analyzed to verify the sensitivity specified by the manufacturer for the device type. The term sensitivity represents the quotient of the change in an indication of the radon monitor and the corresponding change in a value of the radon activity concentration [16]. This quotient conforms to Equation (1) and is expressed by the number of counts recorded during the specified measurement interval for a given radon activity concentration. However, the instruments generally report the measurements directly in units of radon activity concentration rather than the number of counts in the measurement interval. Therefore, the values of radon activity concentration must be traced back to the primary registered number of counts.
The determination of sensitivity is performed at sufficiently low radon activity concentrations, at which the statistical fluctuations of radon activity lead to changes in the measured values, which smallest differences can each be assigned to a single registered count. The analyses are carried out for the readings taken at a radon activity concentration of about 100 Bq/m3.
It should be noted that this method of determining sensitivity is only applicable to instruments where the observed changes in the measured values correlate with the same changes in the radon activity concentration. The method fails if the instrument does not use the pulse counting method or if the readings have been pre-processed by applying a statistical filter (e.g., the moving average method).
2.5.2. Measurement Precision of Radon Activity Concentration
The term measurement precision is defined as being the closeness of agreement between indications or measured quantity values obtained by replicate measurements… [16]. Repeated testing at stationary exposures with standard test conditions provides measurements under identical conditions. It is assumed that the remaining minor deviations observed for temperature, air pressure and relative humidity during each run will not significantly affect the readings of the devices under testing.
The relative standard deviation of the test reference value according to Equation (4) is used as a measure for the measurement precision and is expressed as a percentage. The lower the standard deviation, the higher the measurement precision.
In addition to the relative standard deviation of the test reference value, the maximum deviation from the mean is determined.
2.5.3. Measurement Accuracy in Terms of the Reference Radon Activity Concentration
Measurement accuracy is the closeness of agreement between the measured value and the value of the reference radon activity concentration, which is considered to be the true value of the measurand for the particular test [16]. It is quantified in this study by the systematic measurement error, , resulting from the difference between the net measured value, , and the reference radon activity concentration, :
The systematic measurement error is a component of measurement error that, in replicate measurements, remains constant or varies in a predictable manner [16]. It provides information about the calibration status of the instrument. The smaller the systematic measurement error, the better the measurement accuracy.
The test is performed for the exposure time corresponding to standard indoor conditions with a relative humidity between 50% and 65%. The reference radon activity concentration is the average over the same period. By referring to this quantity, the systematic measurement error is expressed as a percentage.
2.5.4. Linearity of Indication
The linearity test checks the proportionality of the device’s display to the change in radon activity concentration. It expresses the degree of constancy of the instrument sensitivity over an extended measurement range. The test is performed for the range from 100 Bq/m3 to 1000 Bq/m3 and for the restricted range from 300 Bq/m3 to 1000 Bq/m3.
The mean deviation of the test values determined at the lower and upper limits of the measurement range serves as a measure for the change in sensitivities and thus for the assessment of the linearity [2]. The linearity error results from the ratio between the mean deviation and the average test value:
is the test value at the upper limit of the investigated measurement range. In this study, is identical to , the test value at standard test conditions with a radon activity concentration of about 1000 Bq/m3. The parameter is the test value at the standard test conditions but with a radon activity concentration of 100 Bq/m3 or 300 Bq/m3. As the linearity error only compares the sensitivities at the lower and upper limits of the measuring range, it is not an indicator of a trend and is given as an absolute value.
2.5.5. Exposure to Radon in Stationary and Alternating Atmospheres
The exposure test assesses the consistency of accumulated measurements under changing exposure conditions with the accumulation under constant conditions. When the measured values are recorded at equidistant time intervals, the exposure to radon,, determined by the device is the sum of the measured values of radon activity concentration multiplied by the time interval :
Accordingly, the reference exposure results from the reference radon activity concentration summed up over the same determination period. The test value, , is the ratio of both exposure values:
The test value is determined separately for the period of stationary and alternating exposure. The test for stationary exposures also includes transition phases from one stationary state to the next. Attention is paid to exposing the instruments to a radon-free atmosphere before the determination period to establish a verifiable starting point.
The test reference value is the weighted average of the ratio according to Equation (12) calculated over the periods of stationary exposures under standard test conditions only. The weights are equal to those used in Equation (3). The instrument performance is determined from the difference between test value and test reference value according to Equation (5). It should be noted that, even with alternating exposures, the performance of the instrument is compared with the test reference value derived from the stationary exposure under standard test conditions. This is to point out the measurement error that occurs when the instrument is used in atmospheres with fluctuating radon activity concentrations rather than in constant radon atmospheres where the instrument is usually calibrated.
The results of the exposure test only show the performance in relation to the specific exposure profiles used in this study and are not transferable to other radon atmospheres.
2.5.6. Autocorrelation of the Measured Values
Due to the statistical effects of radioactivity and other influencing factors, the individual measurement value randomly deviates from the current true value. If the radon activity concentration is constant over time, the measurement values should be evenly distributed around the long-term mean value. This indicates that the individual measurements are independent of each other. In cases, where the measured value obtained at a given time is also influenced by measurements taken at other times, the measurements are not independent. This may lead to periodicities in the measurement series.
Periodicities are analyzed using autocorrelation, which specifies the linear relationship between time-shifted values of a time series. Given measurements, at equidistant time points, the lag autocorrelation coefficient, , is defined as being
The autocorrelation function is the sequence of values for successive lags . The autocorrelation is positive if a deviation from the mean value is followed with a high probability by a measurement deviation in the same direction from the mean value. With negative autocorrelation, successive measurements tend to deviate inversely from the mean.
Autocorrelation is identified by the Durbin–Watson test with the test parameter :
The test parameter is in the range . If is close to 2, no autocorrelation is assumed. The closer is to zero, a positive autocorrelation is assumed, and the closer is to 4, a negative autocorrelation is assumed. The test is carried out for an error probability of 5%. It should be noted that, for certain ranges of the test parameter , the Durbin–Watson test does not deliver a decision. In these cases, it is evaluated in favor of the instrument, and no autocorrelation of the measured data is assumed.
Figure 5 illustrates the effects of data modification through moving averages on the autocorrelation function. The upper graph shows 200 randomly selected numbers uniformly distributed between −1 and 1. Below are shown the autocorrelation functions calculated for the original data and for the first-order (current value and the first prior), third-order (current value and the last three priors) and ninth-order (current value and the last nine prior) moving averages.
Figure 5.
Illustration of the effects of the moving average. Upper graph: 200 random numbers uniformly distributed between −1 and 1; Random: autocorrelation of the random numbers (original data without modification); MA1: autocorrelation of the moving average from the current random value and its previous value; MA3: autocorrelation of the moving average from the current random value and the three previous values; MA9: autocorrelation of the moving average from the current random value and the nine previous values.
The effect of the order of the moving average on the autocorrelation is obvious. For the autocorrelation function of the original random numbers, the Durbin–Watson test parameter is 1.95, indicating no autocorrelation. However, as the order of the moving average increases, the test parameter decreases, indicating a stronger autocorrelation. Even a moving average with the immediately preceding interval (first-order moving average) already results in a Durbin–Watson test parameter of less than 1. A statistical filter based on the moving average method is often used in radon monitors to pre-process the data in order to reduce statistical fluctuations. The moving average method smooths out sudden changes in radon concentration, so that these are not reliably detected.
2.5.7. Statistical Fluctuation
The statistical fluctuation of the measured values corresponds to the type A measurement uncertainty and evaluates the random dispersion of successive instrument readings under the same exposure conditions. The fluctuations result from both the statistical nature of the radiation generation and random variations in radionuclide sampling, radiation registration and signal processing.
The statistical fluctuation is quantified by the total variance, , of the readings taken at a constant radon activity concentration of about 1000 Bq/m3. The relative standard deviation is the square root of the total variance divided by the average of the readings.
Depending on the type of device, the statistical fluctuations of the measured value are given for the standard measurement intervals of 10 min and/or 60 min, which are either already preset in the configuration of the respective device under testing or can be set by the operator. In addition, the measured values are gathered over a virtual measurement interval of 180 min. An exception is a type of device that operates with a measuring interval of 240 min.
2.5.8. Instrument Statistical Fluctuation
The instrument statistical fluctuation is instrument-specific and includes the portion of the statistical fluctuation caused by random variations in radionuclide sampling, radiation detection and signal processing. It is assumed that the instrument-specific statistical fluctuation, , is independent of the fluctuation of the incident radiation, . Both portions result in the total variance of the measured values:
The relative standard deviation, , caused by instrument statistical fluctuation is expressed as part of the total standard deviation and given in percentage:
The variance intrinsic to radiation generation cannot be controlled by technical measures. It is evoked by the statistics of the disintegration of collected radon and its progeny, as well as by random events registered by the device when no radiation is present (background). The disintegration of collected radionuclides and background events are each assumed to be Poisson distributed. The variance is therefore calculated from the number of counts, , registered during the measurement interval and the variance of background events, , randomly included in the registered counts:
The parameter is the sensitivity that indicates at which radon activity concentration one counting event is triggered. For stationary long-term exposures with a constant radon activity concentration, , the number of counts registered during the measurement interval is and for the background events. This allows the variance attributed to radiation to be estimated by
The instrumental statistical fluctuation is determined using the method given here only if the measured values are subject to a negative binominal distribution. This is the case when the total variance of the measured values is larger than the average reading. Therefore, the instrumental statistical fluctuation cannot be determined for devices with autocorrelated readings.
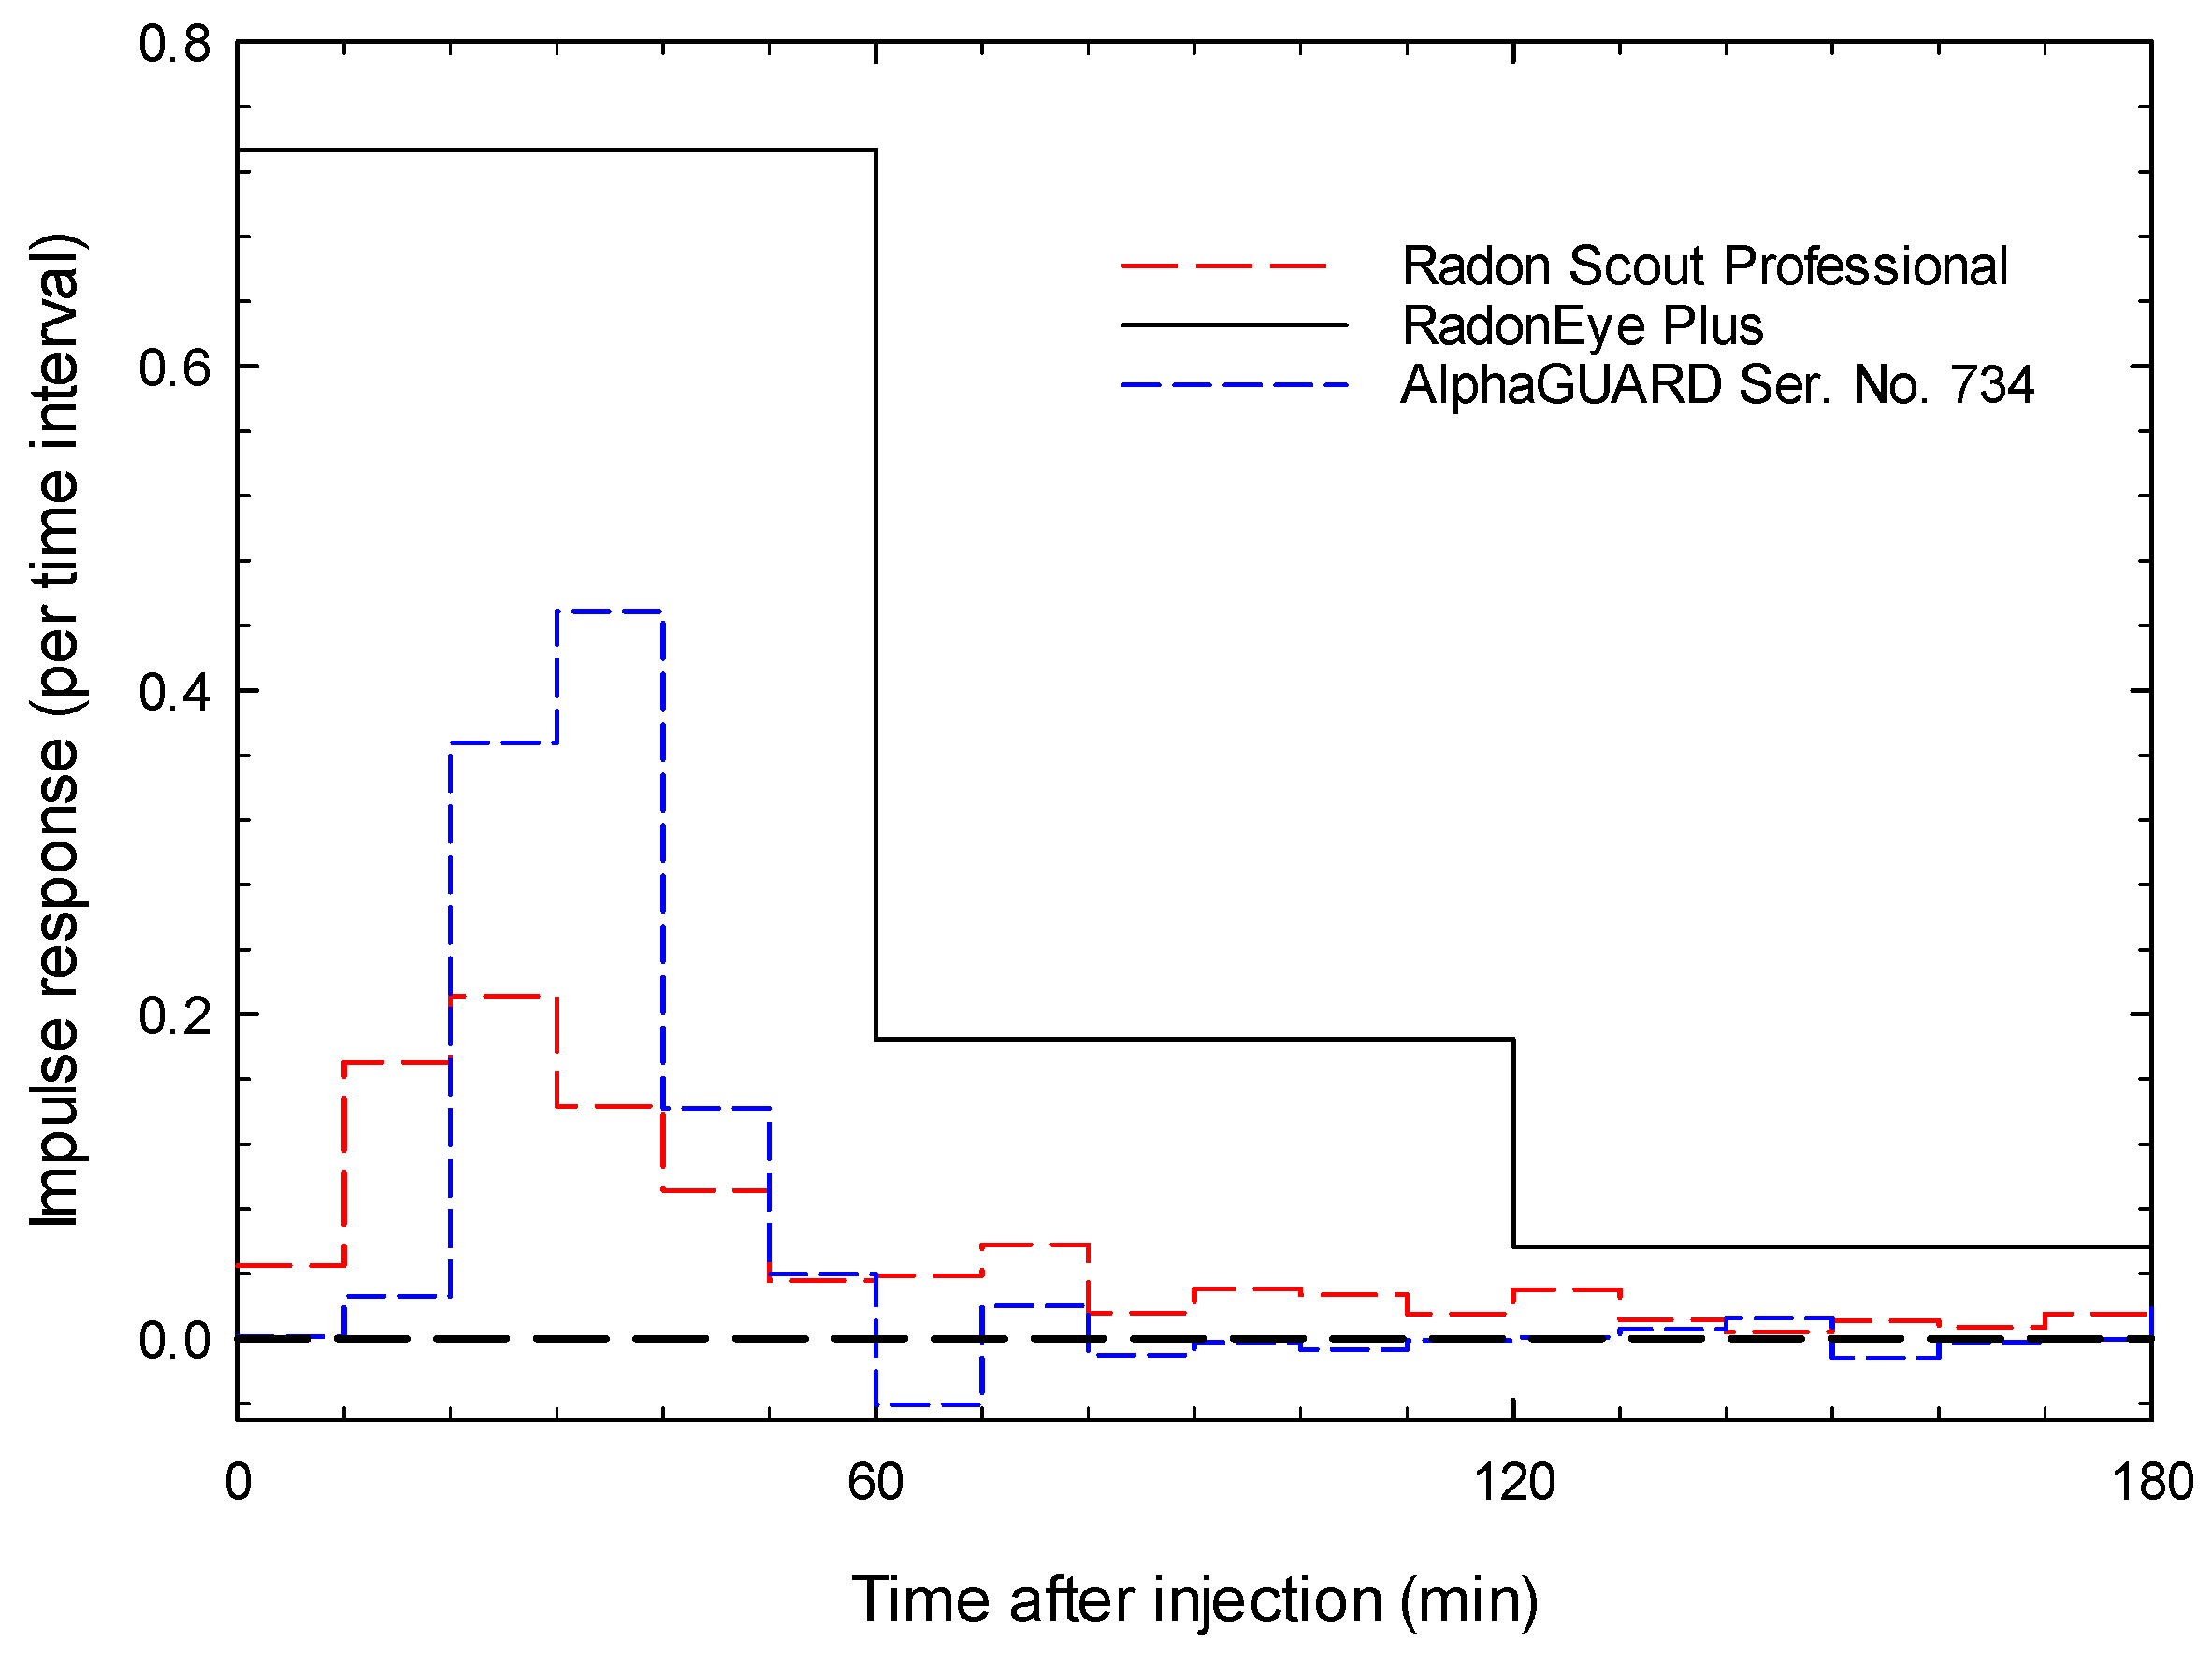
2.5.9. Impulse Response Function
The response, , of a device to an arbitrary change of radon concentration, , has a time delay:
The function is the impulse response function specific to the signal and data processing of the device under testing. The integral in Equation (19) represents the convolution of the input with the impulse response , from which the device response follows. This procedure has already been applied to radon monitors elsewhere [4].
The impulse response function is determined from the time series of radon activity concentrations recorded during the time of alternating exposures. For this purpose, the time series is further processed: After checking the device time and adjusting it with the time of the alternating reference radon concentration, the mean response function, , of the device and the mean input function, , over all the acquired alternating periods are calculated. The mean response function is obtained from the time series of radon activity concentrations taken by the device under testing; the mean input function is derived from the time series of reference radon activity concentrations. The device-specific impulse response function is derived from both functions after Fourier analysis.
2.5.10. Response Time to Changes in the Radon Activity Concentration
According to IEC 61577-2, the response time of a radon device is defined as being the time required after a step change in radon activity concentration for the device indication to reach 90% of its final value for the first time [2].
The response time can be determined experimentally by measurements in atmospheres with sudden changes in the radon concentration or mathematically by using the impulse response function. In the experiment, the device is immediately placed in an atmosphere with a constant radon activity concentration. The radon activity concentrations used for the test are in the range of 5000 Bq/m3. The increase in the readings is observed and recorded until a stable final state with only statistical fluctuations is reached. The recorded values are fitted to a parametric exponential function approaching a maximum value. The response time is the time from inserting the device in the atmosphere to achieving the level of 90% of the maximum value. In this study, the response time is also experimentally determined for a sudden drop in radon activity concentration to zero. After fitting the measured values using an exponential function decreasing to zero, the response time is the time when the measured values reach 10% of the previous maximum value for the first time.
When using the impulse response function, the response time results from its convolution with a step input function. Similar to the experimental method, the response time is the time from the simulated sudden increase in radon activity concentration to reaching 90% of the maximum value.
The study covers only electronic radon monitors that continuously measure the radon activity concentration and have internal data storage for later reading. The capacity of the data storage should be sufficient for measurements over a period of 3 months at least. The radon monitors have in common that radon enters the sensitive measurement volume by diffusion. Electrical power for the instruments is provided by batteries or a low-voltage power supply. The selected devices are transportable and can generally be considered handy in terms of design, size and weight. The software listed in Table 1 is used to read out the measurement data from the devices. It is either supplied with the purchase of the devices or provided directly by the manufacturer.
At least three single devices of each type are included in the test. This should make it possible to show and examine the manufacturing tolerance between the devices.
Most of the selected devices are also equipped with sensors measuring quantities other than radon (temperature, humidity, air pressure, carbon dioxide, etc.). The evaluation of the measurement performance in respect to these quantities is outside the scope of the present study.
3. Results
Table 4 and Table 5 compile the test results indicating the measurement performance of each device with respect to the studied characteristics. Deviations between test and reference values are considered non-significant (NS) if the statistical test does not reject the null hypothesis about the equivalence of the test and reference values. In these cases, the deviation shall be considered to be random, taking into account the specified error probability of . The complete test cycle for one device of each of the types under testing is shown in Part S1 of the Supplementary Materials.
Table 4.
Test results.
Table 5.
Test results of the advanced metrological characteristics.
The sensitivity (Table 4) could only be determined for instrument types that provide measured values without, or only weak, autocorrelation. The values obtained for the sensitivity agree well with the values specified by the manufacturer in Table 1. However, variations between individual devices of the same type may occur.
The measurement precision (Table 4) evaluated by the standard deviation of replicate measurements is excellent for most device types, and only some types have slightly higher values.
The tests show that temperature and humidity can strongly influence the measurement performance of the devices. The devices tend to overestimate the radon activity concentration when the temperature drops and underestimate it when the temperature rises (Table 4). It should be noted that both the test value and the test reference value are determined for the actual temperature and are therefore not influenced by different air densities.
The influence of humidity is particularly relevant for devices that use the effect of electrostatic deposition of the charged radon progeny for measurement. The presence of water vapor increases the neutralization rate of the charged particles, thereby reducing the effect of electrostatic deposition [17]. Since it is assumed that the various test parameters do not influence each other and thus covariances are excluded, low humidity should only affect the humidity tests themselves. The test results show that low humidity is only important for some device types, while other types perform acceptably even at very low humidity. The effects of low humidity are addressed in more detail later for the relevant device types. The influence of humidity or temperature is not the same for all device types and can vary considerably. While, for some, the sensitivity decreases with the increasing humidity or temperature, for others, it is the reverse.
In interpreting the effects of air pressure fluctuations, it should be noted that the values in Table 4 are given for an increase in air pressure of 100 hPa. Since a change of this magnitude is not to be expected under typical operating conditions, the test results indicate that the air pressure has a rather small influence on the measurement results of most devices under typical operating conditions.
The measurement accuracy of the tested devices expressed by the systematic measurement error is satisfactory only for some devices (Table 5). A high absolute value of the systematic measurement error points to insufficient calibration at the time of the test. Since most instruments on the market are purchased and used directly for testing, the errors show that many instruments are supplied by the manufacturer with inadequate primary calibration.
The statistical fluctuations provided in Table 5 show a significant decrease with the increasing measurement interval for devices without, or only weak, autocorrelation. For instruments with autocorrelation of the measured values, the statistical fluctuation decreases only slightly with the increasing measurement interval. The analysis indicates that instrument statistical fluctuation contributes significantly to the statistical fluctuation and accounts more than half for the majority of the devices tested.
The radon exposure test for prolonged stationary or short-term alternating radon activity concentrations indicates the performance of the tested devices with regard to the accumulation of successive radiation events. The test results (Table 5) are inconclusive and show both an underestimation and an overestimation of radon exposure. The results obtained for stationary exposures are determined by the measurement deviations observed for the individual test parameters. Despite this, the deviations for stationary exposures are generally smaller than for alternating exposures.
When measuring radon, the measurement effect is caused not only by the decay of radon (Rn-222) itself but also by its short-lived progeny, especially the alpha-emitting radionuclides Po-218 and Po-214. The progeny contributes to the measurement effect with a time delay after the decay of radon. Thus, alpha particles emitted by the radon progeny also contribute to the measurement effect in subsequent time intervals. The overlaps may result in a weak positive autocorrelation of the measured values, indicated by a Durbin–Watson test parameter greater than 1 but less than 2. The two modes of the TSR4DM-type instrument illustrate the influence of the radon progeny on the autocorrelation. In the ‘ARn’ mode, the alpha particles emitted by the first progeny of radon (Po-218) determine the measured values. The measured values do not show any autocorrelation. In the ‘ACRn’ mode, alpha particles of Po-214 are additionally included in the analysis. Considering the measurement interval of 60 min and the fact that Po-214 is formed with a delay of more than 45 min after Po-218, most of the alpha particles emitted by Po-214 are registered in subsequent time intervals. This could be the reason for the weak positive autocorrelation of the values measured in the ‘ACRn’ mode. The tests show that weak autocorrelation due to overlapping of registered alpha particles in subsequent measurement intervals is not characteristic for each instrument. There are also instruments where no autocorrelation is detected.
The measured values are considered to be strongly positively autocorrelated if the Durbin–Watson test parameter is less than 1. In this case, it is assumed that the primary measured values are pre-processed by a statistical filter. The moving average method is often used as such a statistical filter. Its application is based on the assumption that sudden changes in the radon activity concentration in the real atmosphere are unlikely. This is particularly the case for radon in homes. Short-term changes in the measured values are therefore considered to be random and smoothed out. Figure 6 shows exemplarily the raw and pre-processed measured values of the Alpha E-type instrument. Applying the moving average to the measured data results in the reduction of the Durbin–Watson test parameter. The time course of the radon activity concentration shown in the lower graph of Figure 6 is mainly due to the pre-processing with the moving average. The graph does not represent actual fluctuations of the quantity.
Figure 6.
Type Alpha E Ser. No. AE001356: Comparison of indicated values with and without application of the moving average, measurements taken at a radon activity concentration of 1000 Bq/m3.
The impulse response function is determined from the analysis of the measurement with alternating radon activity concentrations. Figure 7 shows the impulse response functions for the Radon Scout Professional and RadonEye instrument types in comparison with the function determined for the AlphaGUARD. Due to the shorter measurement interval of Radon Scout Professional and AlphaGUARD, the time-delayed response to a change in the current radon activity concentration is evident. The long measurement interval of 60 min for the RadonEye type conceals the time-delayed response. According to the impulse response function, the AlphaGUARD completely registers a short radon change after 60 min. After the same time, Radon Scout Professional and RadonEye types only register about 70% of the total radon change.
Figure 7.
Impulse response functions determined for the Radon Scout Professional and the RadonEye-type devices compared to the impulse response function determined for AlphaGUARD; the impulse response functions for Radon Scout Professional and RadonEye devices are averaged over the tested devices of the corresponding type.
Generally, after a step change in the radon activity concentration, the tested budget-priced devices require a response time of at least 2 h to follow the change and reach the 90% value. Most instruments need much longer times, particularly if they use internal data processing such as the moving average or similar. In this feature, the budget-priced devices distinctly differ from the AlphaGUARD device, which has a considerably shorter response time. It should be noted that the response times determined from the impulse response function and the experimental determination agree well, taking into account the uncertainties in determination. Exceptions to this are the RadonaExpert+ type, TSR4DM type and the Corentium Pro type, where the respective response times differ significantly. Furthermore, the experimental investigations show that the response times for the TSR4DM type also depend on whether the radon activity concentration is increased or decreased.
4. Discussion
4.1. General Observations during the Tests
For devices with long-term use, it has been observed that continuous operation with an external power supply can lead to defects in the internal batteries and/or connectors. Data may be lost in the event of a battery failure.
Even in the case of long-term measurements, the instruments should be regularly checked for their correct functioning, and interim readings of the measurement data should be arranged.
Individual data may occasionally be lost during data transmission via Bluetooth or cloud-based data evaluation. In this context, it should also be pointed out that the data protection requirements must be satisfied.
In general, a valid calibration status of the device by an approved calibration center must be available at the time of use. In addition, the background of the device must be checked regularly.
4.2. Measurement Performance of the AlphaGUARD
The AlphaGUARD device allows operation in flow or diffusion mode. For the measurements performed in the test, the diffusion mode was selected.
The device provides non-autocorrelated measured values for an interval of 10 min. The non-detectable autocorrelation suggests that the measured values are raw data without pre-processing. However, autocorrelated measurement data have been obtained in measurements carried out outside of this test, where a device of the same type was exposed to a radon activity concentration that decreased according to radioactive decay. The results obtained for autocorrelation of the measurements data are therefore considered ambiguous for the AlphaGUARD type.
The high sensitivity causes a low statistical fluctuation of the measured data, which is reflected in the low standard deviation at 1000 Bq/m3.
The device has a high measurement precision. Due to the associated low standard deviation at replicate measurements, even small measurement deviations for various test parameters remain significant. The device shows a slight dependence on temperature and a slightly lower sensitivity when measuring in humid air compared to dry air. The other test parameters are unremarkable.
Remarkable is that the instrument statistical fluctuation contributes almost entirely to statistical fluctuations. However, the interpretation of this value is limited, because the device uses an advanced pulse counting method, in which the pulse shape is analyzed with different algorithms to extract those events caused by alpha particles [18]. For this reason, sensitivity could not be unambiguously determined using the method of this study.
The impulse response function in Figure 7 shows that the AlphaGUARD reacts with a time delay of approx. 40 min to a short change in the radon activity concentration. The subsequent response is comparatively short and subsides within 60 min only.
The radon exposure measured for short-term alternating radon activity concentrations is about 9% lower than the reference value. Even if the response time is short compared to other devices tested, the repeated short-term changes in the radon concentration are not detected without loss.
4.3. Type-Specific Explanatory Notes for the Budget-Priced Devices Tested
4.3.1. AER2+, Algade
The measurement data recorded by the device with serial number 201–139 could not be read out. The reasons for this were not found during the test period. Therefore, only the two remaining devices are included in the analysis. One of these has no background data recorded.
Important to note is the high temperature dependence. Over the examined temperature range, the sensitivity of the device decreases by up to 35% with the increasing temperature. Although the dependence on humidity is high when comparing sensitivities in humid and dry air, variations in humidity in the range of typical indoor conditions have little effect on measurements. The manufacturer points out in the manual that measurement errors of up to 15% occur in places with very high or low humidity [19].
The high measurement deviations with varying test parameters are reflected in the high deviation for radon exposure in the stationary exposure scenario. Radon exposure is also considerably underestimated in alternating atmospheres.
The instruments show a weak pronounced autocorrelation of the measured values at a value of 1000 Bq/m3. No autocorrelation is detected at lower radon values. It is assumed that the autocorrelation is related to the delayed detection of radon progeny and not to the pre-processing of data. The impulse response is the longest of all the instrument types without autocorrelated measurements.
4.3.2. Corentium Types, Airthings
Corentium Home devices have a ring buffer, which is found to be insufficient to store the measurement data over the entire test cycle. Due to the loss of data, no test reference could be determined, and thus, a large part of the measured values of the devices could not be evaluated.
The measurements of the Corentium-type devices could be affected by the low humidity used in various tests, as this significantly influences the electrostatic collection of radon progeny. According to the manufacturer’s information, the algorithm implemented in the devices compensates for the changes in humidity. However, this compensation usually works well only at relative humidity in the range of 10% to about 80%. At humidity levels outside this range, the radon monitor cannot be expected to maintain good accuracy of the displayed radon activity concentration. The manufacturer’s response to the test results can be found in Part S2 of the Supplementary Materials.
Replicate measurements under the same standard conditions show increased deviations, indicating a lower measurement precision. Whether these deviations are attributable to the low humidity during the standard exposure conditions cannot be conclusively clarified. The humidity compensation algorithm apparently works correctly in its nominal range, since measurement deviations between the humidity range from (50–65)% to >70% are not found. A dependence on temperature could not be significantly demonstrated for the majority of the devices.
The Corentium Pro-type exhibits considerable non-linearity in the radon activity concentration range investigated, whereas the Corentium Plus devices are characterized by improved linearity. However, there may be variances between the individual devices.
With the exception of one device, both device types show no significant deviations in the measurement of radon exposure for the test procedure of this study. It should be noted that the higher standard deviation of the replicate measurements could mask existing measurement deviations and lead to a non-significant evaluation for the tested measurement characteristics.
The instruments do not show any autocorrelation. The weak positive autocorrelation of one instrument is not considered characteristic of this type of instrument and could be due to other effects.
Unlike Corentium Plus, Corentium Pro is equipped with four passive radon diffusion chambers. Therefore, it can be expected that the higher pulse rate registered per radon activity concentration will result in a lower statistical fluctuation. The values of the standard deviation for the measured value at about 1000 Bq/m3 confirm that the extensions of the Corentium Pro are associated with a reduction of the statistical variation by a factor of about two.
The considerable systematic measurement error should be taken as an indication of a low calibration status of the tested devices. However, the systematic measurement error is fairly equal for the devices of the same type. This could allow devices to be calibrated together (batch calibration) and output an average calibration factor for a batch of devices, which would save calibration effort and costs.
4.3.3. Wave Plus, Airthings
One device of the original three submitted was defective. The manufacturer replaced it with the device of serial number 2930079548. Some performance parameters of the replaced device differ from those of the other two devices. In particular, its systematic measurement error is not significant, indicating a valid calibration status. The linearity is likewise better over the tested range of radon activity concentration.
The standard deviation of replicate measurements for Wave Plus devices is lower than for the Corentium device types, indicating a slightly higher measurement precision. The temperature dependence is not significant. In terms of humidity, the dependence of wet to dry air is similar to that of the Corentium devices. However, significant deviations also occur between the humidity range from (50–65)% to >70%. In contrast to the Corentium devices, significant deviations are obtained for the radon exposures in both the stationary and alternating radon atmospheres.
The special feature of the devices is the long response time estimated with more than 7 h and the strong positive autocorrelation. This means that a statistical filter is applied, which takes into account values from the past for the evaluation of the current measurement.
4.3.4. Alpha E, Bertin Technologies
The devices of this type provide values of radon activity concentration with and without application of the moving average method. Figure 6 shows the original values compared to those results pre-processed by the moving average method. The Durbin–Watson test parameter indicates a strong positive autocorrelation of the pre-processed data.
The measured values in the upper graph of Figure 6 change from one discrete state to another. The step size expresses the sensitivity resulting in a resolution of a radon activity concentration of 206 Bq/m3 per count within the measurement interval. Thus, the device type has one of the lowest sensitivities found in this study.
Regardless of the application of the moving average method, the Alpha E-type instruments have good measurement precision. The changes in sensitivity due to varying climatic conditions are within the range also observed for the other types tested. An increased nonlinearity of the readings is observed for radon activity concentrations below 300 Bq/m3.
The low sensitivity correlates with the low pulse rates. This leads to statistical fluctuations, which increase considerably at low radon activity concentrations. Data pre-processing with the moving average method shows a reduction in fluctuation. However, this is at the price of longer response times and a strong positive autocorrelation. Noteworthy are the high background values, which are unusual for virgin devices.
It should be noted that the short response time of 60 min found in [4] for this type of device could not be verified in this study.
4.3.5. RadonaExpert+, Radontec
RadonaExpert+ devices show a good measurement precision and linearity. With regard to the climatic conditions, a significant dependency of the measurements for changes in temperature and humidity is observed. In the tested temperature range from 5 °C to 35 °C, the sensitivity of the device decreases by up to 20% with the increasing temperature. The sensitivity also decreases for increased humidity. This is particularly observed in relation to dry air. For changes in relative humidity from about (50–65)% to >70%, the effect is moderate.
The instruments show a strong positive autocorrelation, indicating the application of a statistical filter to the measured data. This also explains the overestimation of the radon exposure observed in atmospheres with short-term alternating radon concentrations as well as the small statistical fluctuations at short measurement intervals.
An interesting aspect is the experimentally determined response time, which is significantly lower than the response time calculated from the impulse response function. Obviously, the instruments track a sudden change from one stationary state to another more closely than a sudden change in radon concentration, which is constantly repeated at short intervals. The implemented statistical filter appears to act like a low-pass filter that attenuates frequent changes in radon activity concentrations.
4.3.6. RadonEye+2, RadonFTlab
RadonEye+2 devices are characterized by a low standard deviation of replicate measurements. As a result, even relatively small deviations in other test parameters become significant.
The temperature dependence of this type of device is also among the highest of all tested device types, with a decrease in sensitivity of about 30% with the increasing temperature over the tested range. The measurement deviations of the other climate parameters are comparable to those of the RadonaExpert type.
The instruments have good linearity over the range of radon activity concentration. The measured values for radon exposure are below the reference values. In the event of alternating exposure, the instrument may not completely capture high radon concentrations for short periods.
As the impulse response function in Figure 7 shows, the long measurement interval of 60 min masks short-term changes in radon activity concentration. Only about 70% of the input radon pulse is recorded within the first 60-min interval. Thus, the short-term changes in the response of the device are still visible at measurement times after 60 min. It should be noted that the response time is slightly less than 2 h. This coincides approximately with the response time of 90 min determined for this type of device in [4] using the experimental method.
The measured values do not show any autocorrelation. The statistical fluctuation of the measured values is among the lowest of all tested devices and only moderately higher than that of the AlphaGUARD type.
4.3.7. Radon Scout Professional, Sarad
Radon Scout Professional devices are the only ones of the tested instrument types that use Lucas scintillation cells for radiation detection. The measurement performance of this type is characterized by a high measurement accuracy, good linearity over the examined range of radon activity concentration and low dependence on climatic conditions.
While the value of radon exposure is consistent with the test reference for stationary radon activity concentrations, short-term alternating radon concentrations are not fully captured by this type of instrument, resulting in an underestimation of radon exposure.
The impulse response function in Figure 7 shows that the Radon Scout Professional responds to a short, changing radon difference in a similar way to AlphaGUARD. However, the impulse responses do not subside within 60 min and continue to influence the measurement results at later times. After 60 min, only about 70% of the original pulse is recorded. This ultimately increases the response time value. Despite this, the response time is one of the lowest of the device types tested.
The measured values recorded in an interval of 10 min are characterized by an increased statistical fluctuation. With a measurement interval of 60 min, the statistical fluctuation is about three times as high as with the AlphaGUARD type and is within the range of the other devices tested. The increased fluctuation can be attributed to the lower sensitivity. Autocorrelation is not observed. Occasionally, a weak positive autocorrelation occurs that is not considered characteristic of the device type and could be due to delayed detection of radon progeny.
4.3.8. Radon Scout Home, Sarad
Radon Scout Home devices operate with a standard measurement interval of 240 min. This is the longest interval among the tested devices and is required due to the low sensitivity. The measured values are not autocorrelated, which indicates that the device provides raw measured values without internal pre-processing. The response time is determined experimentally for more than 5 h.
The devices have acceptable linearity. One device significantly overestimates low radon concentrations. The measurement precision is not uniform and varies among the tested devices.
The sensitivity is significantly lower in dry air than in humid air. Changes in relative humidity from about (50–65)% to >70% have little effect on the measurement sensitivity. In contrast to most other device types, the sensitivity increases as the temperature rises from 5 °C to 20 °C. As the temperature rises further, the results are ambiguous. The manufacturer’s response to the test results can be found in Part S2 of the Supplementary Materials.
Radon exposures determined for prolonged stationary and for short-term alternating radon activity concentrations are in good agreement with the corresponding reference values. The long measurement interval masks short-term changes in radon activity concentration, but their effects are obviously accumulated in the integral values of radon exposure.
4.3.9. Radonsystem, DNE Elektronik-Systeme
The device is the largest that was tested in this study. Because of its considerable size, it cannot be called handy. The device only provides measurements of radon activity concentration but does not provide additional information such as climatic conditions during the measurements.
It turned out that early measurement data was overwritten by data that were recorded later in the course of the test procedure. By reading out the data intermediate, it was possible to reconstruct the complete series of measurements. Due to the malfunction in data recording, the device must be technically revised to make it suitable for practical use.
If one disregards the shortcomings in data management, the devices have prominent metrological features. This is evidenced by the high sensitivity, which is the highest of all tested device types, the good measurement precision and the low dependence on air humidity. In the tested temperature range from 5 °C to 35 °C, the sensitivity of the device decreases on average by 20% with the increasing temperature. Fluctuations in air pressure have the greatest effect of all the devices tested. Therefore, the devices should be additionally equipped with sensors for temperature and air pressure so that the measurement results can be corrected accordingly.
The instruments show a weak pronounced autocorrelation of the measured values at a value of 1000 Bq/m3. No autocorrelation is detected at lower radon values. It is assumed that the autocorrelation is related to the delayed detection of radon progeny and not to the pre-processing of data. The short impulse response time, which is one of the shortest of all tested instrument types, should be emphasized.
The low measurement accuracy, inferred by the high systematic measurement error, indicates that the devices are supplied by the manufacturer with an inadequate factory calibration.
4.3.10. Spirit, Radonova
The Spirit type is the only one included in the test that works with varying measurement intervals. While radon monitors usually measure in fixed equidistant time intervals, Spirit type devices obviously adjust the measuring interval to the fluctuation of the radon activity concentration. During the stationary exposure periods, measurements are taken every 60 min or even every 120 min. In the case of alternating exposure periods, the instrument takes measurements every 60 min. Measurement intervals are also registered, which are shortened to about 10 min.
The measurement performance of the instruments ranks in the upper performance range of the instruments tested in this study for most of the characteristics examined. However, humidity is an exception. Especially in the range of typical indoor conditions, the dependence of sensitivity on humidity is the highest of all the devices tested. The manufacturer’s response to the test results can be found in Part S2 of the Supplementary Materials.
The readings from the instruments show a pronounced positive autocorrelation for each radon value examined. This indicates the application of a statistical filter to pre-process the acquired measurement data.
Compared to other devices with pre-processing of the measurement data, the impulse response time is the lowest and is in the upper range of the response times for devices without data pre-processing.
4.3.11. TSR4DM, Tesla
TSR4DM devices offer two measurement alternatives. Following the information of the manufacturer, the measured values of radon activity concentrations indicated by ‘ARn’ are calculated only from the decay of Po-218. With this method, the measurement result is obtained fast. It is therefore supposed to be preferably suitable for measurements in atmospheres changing over short times. In the mode labeled ‘ACRn’, the measured values of radon activity concentration are determined by including the decays of Po-218 and Po-214. This method is expected to provide higher sensitivity but at the expense of a delayed response.
The devices have acceptable measurement precision and linearity in the display. The dependence of the measurement sensitivity on the climatic conditions is particularly striking. The humidity has a pronounced influence on the measurement result. In high humidity, the sensitivity is twice as high as in dry air. In contrast to most other device types, the sensitivity of this device type increases as the temperature rises from 5 °C to 35 °C. The increase is more than 30% over the tested temperature range.
The effects of climatic conditions are responsible for the determined deviations of radon exposure at prolonged stationary radon activity concentrations. Large measurement deviations of radon exposure are also observed in atmospheres with short-term alternating radon activity concentrations. The fast ‘ARn’ mode shows no improvements compared to the slow ‘ACRn’ mode.
A positive autocorrelation of the measured values is revealed for the slow ‘ACRn’ mode. However, this autocorrelation is only weakly pronounced and could be mainly due to the time-delayed registration of effects by the radon progeny.
The experimentally determined response times are significantly lower than the response time calculated from the impulse response function. Furthermore, the experimentally determined response times depend on whether the radon concentration increases or decreases.
4.4. Conformity of the Performance of the Tested Instruments with the Requirements of the IEC 61577-2 Standard
The IEC 61577-2 standard sets out specific requirements for instruments used to measure the activity concentration of airborne Rn-222 and applies to all types of electronic measuring equipment, regardless of the sampling method.
Since the device types tested in this study have in common that the collected air enters the sensitive measurement volume by diffusion, not all requirements of the standard are applicable. In addition, tests of electrical and mechanical requirements are not in the scope of this study.
The standard test conditions used are essentially the same as those specified in the IEC standard. Only the standard conditions for relative humidity differ, since aged dry air is used to create the test atmosphere for technical reasons. The environmental performance tests cover a somewhat narrower range than the specified ranges of the IEC standard. The reasons for this are, on the one hand, the limitation by the technical capabilities of the test facility. On the other hand, the test ranges should be limited so that the technical functionality of the measuring instruments is not impaired to keep them available for further measurement tasks.
Table 6 compares the results for the measurement characteristics of the tested devices with the respective requirements of the IEC 61577-2 standard. It can be seen that this study also addresses features that are not included in the IEC standard. The last columns of Table 6 summarize the test results. The median value and the spread for the respective metrological characteristic indicated by the minimum and maximum values of individual devices are given. If appropriate, a distinction is made between instruments with strong autocorrelation and those for which the measured values are not or only weakly autocorrelated. The sign of the deviation is not uniform for the different device types: While one type underestimates the test reference, the other type can show an overestimation. However, it can be concluded that the maximum permissible measurement deviations specified in IEC 61577-2 are satisfied by the majority of instrument types.
Table 6.
Comparison of the test results obtained in this study with the requirements of the IEC 61577-2 standard (without results from AlphaGUARD).
Assuming a standard temperature of 20 °C, most devices meet the performance criteria when the temperature drops to 5 °C. Increasing the temperature poses a greater challenge for compliance with the specified measurement performance.
The results of the tests confirmed the expectation that humidity can have a striking effect on the measurement result. The highest variations in the sensitivity of the devices are observed in measurements for humid air compared to measurements for dry air. The significant deviations observed in measurements in wet to dry air have little practical relevance, as dry air is not a common ambient condition in real atmospheres.
For most device types, the indication is linear over the tested range of radon activity concentration. The deviation from linearity is far below the limit value of 15% accepted by IEC 61577-2. A review and improved definition of the IEC requirement is recommended.
Statistical fluctuation of the measurement results is largely determined by the contribution of the instrument statistical fluctuation. Total statistical variation satisfies the requirement of the IEC standard. It includes the instrument statistical fluctuation, which rather reveals optimization potentials in the design, sampling and detection methods but is only of limited use for evaluating the measurement capability of a radon monitor.
The test results for radon exposure are not uniform and vary over a wide range for devices with strong autocorrelation. In alternating atmospheres with short-term fluctuating radon activity concentrations, instruments with strong autocorrelation tend to overestimate radon exposure, while instruments without or only weak autocorrelation show the opposite behavior and tend to underestimate radon exposure. Obviously, a short-term change in radon activity concentration is tracked more closely when the measurement data are not pre-processed with a statistical data filter. Consideration should be given to including a performance requirement for the measurement of radon exposure in the IEC standard.
The response time for devices with autocorrelated measurements is doubled, compared to an average of about 2.5 h for devices without.
5. Conclusions
The measurement performance and characteristics of electronic radon monitors with respect to radiological and environmental parameters were investigated. The study comprised a selection of electronic radon monitors currently available on the market with acquisition costs in the low or medium range. A high-end AlphaGUARD device was included in the study and examined using the same exposures and analytical procedures as the other devices. It thus provided a benchmark for comparing the measurement performance of budget-priced radon monitors with the state-of-the-art technology.
The investigations show that the metrological characteristics of the different device types vary considerably. The observed measurement deviations are not uniform in size and sign. In particular, air humidity can have a strong effect on the sensitivity of radon monitors. This is especially true for devices that use electrostatic deposition of radon progeny to improve the measurement sensitivity.
In general, however, the metrological requirements of IEC 61577-2 are met by the majority of devices. Taking additionally into account the limited variations in typical ambient conditions in indoor air, the resulting measurement deviations of most instruments are acceptable for this measurement purpose.
It turns out that radon monitors currently on the market require additional calibration in a reference atmosphere before they can be used. In order to relieve the normal purchaser from this obligation, the manufacturer should be obliged to additionally provide the devices with a recognized calibration. For this purpose, the calibration should be performed close to the established national radon reference value and under ambient conditions adequate for the intended use. Calibration in conjunction with functional testing also helps to identify devices with reduced measurement capability.
It has been found that instrument manuals tend to be generous with nominal operating conditions and underestimate the associated measurement variations. In order to create confidence in the measurement results and in decisions on measures to mitigate radon exposure, reliable information is required about the nominal operating conditions of devices and the measurement deviations that occur due to external influences.
The primary purpose of the devices considered in this study is to provide residents with the ability to monitor radon activity concentrations in their living environment. However, some of these devices have sufficiently good measurement performance to make them also attractive to radon professionals as a budget-priced alternative to high-end devices. This applies in particular to devices that supply raw measured values without pre-processing. Limitations in use may exist as a result of the longer response time compared to AlphaGUARD and the increased statistical fluctuations due to the lower sensitivity.
The results of the performance test will contribute to the further development of standardization in this area. Metrological tests of radon monitors to confirm compliance with the agreed on technical requirements are a decisive prerequisite for assuring the quality of the measurements.
At a meeting held in Dublin on 13 October 2023, the results of the performance test were presented to the manufacturers, and an opportunity for discussion was given. The authors received responses from a number of manufacturers, which are summarized in Part S2 of the Supplementary Materials.
Supplementary Materials
The following supporting information can be downloaded at https://www.mdpi.com/article/10.3390/atmos15101180/s1, Part S1: Test cycles for selected devices of each tested type. Part S2: Responses from the manufacturers.
Author Contributions
Conceptualization, T.R.B. and E.F.; methodology, T.R.B.; formal analysis, T.R.B.; data curation, T.R.B., E.F. and M.B.; resources, E.F. and M.B.; investigation, T.R.B., E.F. and M.B.; software, M.B.; funding acquisition, S.F.; writing—original draft preparation, T.R.B.; writing—review and editing, T.R.B. and E.F. All authors have read and agreed to the published version of the manuscript.
Funding
This research is part of the RadoNorm project: Towards effective radiation protection based on improved scientific evidence and social considerations—focus on radon and NORM. The project received funding from the Euratom research and training programme 2014–2018 under grant agreement No. 900009.
Institutional Review Board Statement
Not applicable.
Informed Consent Statement
Not applicable.
Data Availability Statement
Data are contained within the article or in the Supplementary Materials.
Conflicts of Interest
The authors declare no conflicts of interest. Neither funders nor stakeholders played any role in the design of the study; in the collection, analysis or interpretation of the data; in the writing of the manuscript or in the decision to publish the results.
References
- Council Directive 2013/59/Euratom of 5 December 2013 Laying down Basic Safety Standards for Protection against the Dangers Arising from Exposure to Ionising Radiation, and Repealing Directives 89/618/Euratom, 90/641/Euratom, 96/29/Euratom, 97/43/Euratom and 2003/122/Euratom. Available online: https://eur-lex.europa.eu/eli/dir/2013/59/oj (accessed on 3 November 2021).
- IEC 61577-2; Radiation Protection Instrumentation—Radon and Radon Decay Product Measuring Instruments—Specific Requirements for 222Rn and 220Rn Measuring Instruments. International Electrotechnical Commission: Geneva, Switzerland, 2014.
- Daraktchieva, Z.; Howarth, C.B.; Wasikiewicz, J.M.; Miller, C.A.; Wright, D.A. Long-term comparison and performance study of consumer grade electronic radon integrating monitors. J. Radiol. Prot. 2024, 44, 031508. [Google Scholar] [CrossRef] [PubMed]
- Dimitrova, I.; Georgiev, S.; Mitev, K.; Todorov, V.; Dutsov, C.; Sabot, B. Study of the performance and time response of the RadonEye Plus2 continuous radon monitor. Measurement 2023, 207, 112409. [Google Scholar] [CrossRef]
- Fuente, M.; Rabago, D.; Herrera, S.; Quindos, L.; Fuente, I.; Foley, M.; Sainz, C. Performance of radon monitors in a purpose-built radon chamber. J. Radiol. Prot. 2018, 38, 1111–1127. [Google Scholar] [CrossRef] [PubMed]
- Gunning, G.A.; Murray, M.; Long, S.C.; Foley, M.J.; Finch, E.C. Inter-comparison of radon detectors for one to four week measurement periods. J. Radiol. Prot. 2016, 36, 104–116. [Google Scholar] [CrossRef] [PubMed]
- Luca, A.; Rădulescu, I.; Ioan, M.-R.; Fugaru, V.; Teodorescu, C.; Barna, C.; Tuță, C.S.; Tugulan, C.L.; Antohe, A.; Lalău, I.; et al. Recent Progress in Radon Metrology at IFIN-HH, Romania. Atmosphere 2022, 13, 363. [Google Scholar] [CrossRef]
- Rey, J.F.; Meisser, N.; Licina, D.; Pernot, J.G. Evaluating the impact of indoor aerosols on the performance of real-time radon sensors. Front. Built Environ. 2024, 10, 1407499. [Google Scholar] [CrossRef]
- Rey, J.F.; Meisser, N.; Licina, D.; Pernot, J.G. Performance evaluation of radon active sensors and passive dosimeters at low and high radon concentrations. Build. Environ. 2024, 250, 111154. [Google Scholar] [CrossRef]
- Rábago, D.; Fernández, E.; Celaya, S.; Fuente, I.; Fernández, A.; Quindós, J.; Rodriguez, R.; Quindós, L.; Sainz, C. Investigation of the performance of various low-cost radon monitors under variable environmental conditions. Sensors 2024, 24, 1836. [Google Scholar] [CrossRef] [PubMed]
- Warkentin, P.; Curry, E.; Michael, O.; Bjorndal, B. A comparison of consumer-grade electronic radon monitors. J. Radiol. Prot. 2020, 40, 1258–1272. [Google Scholar] [CrossRef] [PubMed]
- Jilek, K.; Slezakova, M.; Havelka, M.; Fronka, A. The preliminary results and experience from 2023 SURO international comparison of continuous monitors in a mixed field of radon-thoron gas and their short lived decay products. In Proceedings of the RadoNorm Interest Group Meeting, 7th European Radiation Protection Week, Dublin, Ireland, 9–13 October 2023; unpublished. [Google Scholar]
- Beck, T.R.; Biel, M. Metrological realization of the radon activity concentration in air. Appl. Radiat. Isot. 2024, 212, 111448. [Google Scholar] [CrossRef] [PubMed]
- Eurostandard CZ, Products: RF—222Rn Flow through Source. Available online: https://www.eurostandard.cz/products.html#rf (accessed on 15 August 2024).
- Ross, A.; Willson, V.L. Independent Samples T-Test. In Basic and Advanced Statistical Tests; Ross, A., Willson, V.L., Eds.; SensePublishers: Rotterdam, The Netherlands, 2017; pp. 13–16. [Google Scholar] [CrossRef]
- ISO/IEC Guide 99; International Vocabulary of Metrology—Basic and General Concepts and Associated Terms (VIM). International Organization for Standardization/International Electrotechnical Commission: Geneva, Switzerland, 2007.
- Hopke, P.K. The initial behavior of 218Po in indoor air. Environ. Int. 1989, 15, 299–308. [Google Scholar] [CrossRef]
- Saphymo GmbH. AlphaGUARD—Portable Radon Monitor. In User Manual; Saphymo GmbH: Frankfurt, Germany, 2012. [Google Scholar]
- ALGADE. User Guide. Radon Sensors AER2, AER2+, AER2C; ALGADE: Bessines-Sur-Gartempe, France, 2023. [Google Scholar]
Disclaimer/Publisher’s Note: The statements, opinions and data contained in all publications are solely those of the individual author(s) and contributor(s) and not of MDPI and/or the editor(s). MDPI and/or the editor(s) disclaim responsibility for any injury to people or property resulting from any ideas, methods, instructions or products referred to in the content. |
© 2024 by the authors. Licensee MDPI, Basel, Switzerland. This article is an open access article distributed under the terms and conditions of the Creative Commons Attribution (CC BY) license (https://creativecommons.org/licenses/by/4.0/).