Abstract
The study of tropical tropospheric disturbances has led to important challenges from both observational and theoretical points of view. In particular, the observed wavenumber-frequency spectrum of tropical oscillations has helped bridge the gap between observations and the linear theory of equatorial waves. In this study, we obtained a similar wavenumber-frequency spectrum for each equatorial wave type by performing a normal mode function (NMF) decomposition of global Era–Interim reanalysis data. The NMF basis used here is provided by the eigensolutions of the primitive equations in spherical coordinates as linearized around a resting background state. In this methodology, the global multi-level horizontal velocity and geopotential height fields are projected onto the normal mode functions, characterized by a vertical mode, a zonal wavenumber, a meridional quantum index, and a mode type, namely, Rossby, Kelvin, mixed Rossby-gravity, and westward/eastward propagating inertio-gravity modes. The horizontal velocity and geopotential height fields associated with each mode type are then reconstructed in the physical space, as well as their corresponding filtered versions defined according to the vertical mode classes that exhibit barotropic and baroclinic structures within the troposphere. The results reveal expected structures, such as the dominant global-scale Rossby and Kelvin waves constituting the intraseasonal frequency associated with the Madden–Julian Oscillation. On the other hand, a number of unexpected features, such as eastward propagating westward inertio-gravity waves, are revealed by our observed 200 hPa zonal wind spectrum. Among all possible nonlinear processes, we focus on the analysis of the interaction between Kelvin and westward inertio-gravity waves, providing evidence for their coupling. Apart from the nonlinearity, we discuss the potential roles of a vertically/meridionally varying background state as well as the coupling with moist convection in explaining the departures of the observed spectra from the corresponding linear equatorial wave theory.
1. Introduction
The study of tropical tropospheric oscillations is one of incredible complexity due to the interaction of multiple scales, strong nonlinearities, and multiple competing physical phenomena [1], including the Madden–Julian Oscillation (MJO) [2], tropical convection [3], convectively coupled waves [4], interactions with the extra-tropics [5], interactions with the stratosphere [6], tropical cyclones [7], and tropical rainfall [8,9], among others. Within each of these topics, there are crucial associated socio-economic and environmental impacts.
In the theoretical framework, a number of the first successful attempts in tropical meteorology originated from the modeling of waves on the equatorial -plane, beginning with the works of Matsuno and others in the 1960s [10,11,12]. The waves arising in this type of system, whether shallow water or primitive equations [13,14], on the equatorial -plane, all have mid-latitude counterparts such as the Rossby and inertio-gravity waves; in addition, other modes arise that are unique to the equatorial region, such as Kelvin and mixed Rossby-Gravity modes. The latter modes have recently been shown to have deep theoretical roots due to topological invariants, behaving as interfacial waves between different media [15].
An important step towards connecting equatorial wave theory and observations was initially achieved in Takayabu [16], Pires et al. [17] and Wheeler and Kiladis [18]. These studies obtained the wavenumber vs. time-frequency spectrum of tropical oscillations from either the dynamical field variables or the outgoing long-wave radiation (OLR), revealing a striking correspondence between the observed time frequencies and the theoretical predictions of linear equatorial wave theory. These and subsequent studies, e.g., [19], have been regarded as observational evidence for the existence of convectively coupled equatorial waves. In the simplest theories, convectively coupled waves are oscillations that resemble the free linear modes, except with slower frequencies due to the coupling of the waves with moist convection; these theories are reviewed in Kiladis et al. [4]. In addition to the observed oscillations, which exhibit good correspondence with the linear (free or convectively coupled) equatorial waves, Kiladis et al. [4] provided insight into the structure of the Madden–Julian Oscillation, which does not correspond to any of the linear equatorial wave modes [2]. An alternative approach to detecting equatorial wave signals from observed atmospheric data fields was proposed by Yang et al. [20]. This approach obtains the observed wavenumber-frequency spectrum of the equatorial wave modes by projecting the meridional structure of a single-level atmospheric field (after the Fourier decomposition of its x-t dependence) onto the parabolic cylinder functions associated with each y-structure of the equatorial wave types, with the equatorial Rossby deformation radius of the wave mode being inferred from the meridional structure of the observed field. This approach has been applied to both observational data [21] and outputs of atmospheric general circulation models [22]. A similar method consists of projecting the observed OLR field onto empirical orthogonal functions (EOFs) [23,24,25]. The correspondence between the time-frequency spectrum of observed OLR or velocity field oscillations and the linear eigenfrequency of equatorial waves suggests that it is possible to isolate the field variables associated with a single wave type by filtering the corresponding band in the wavenumber-frequency spectrum. This type of decomposition has been carried out in a number of studies e.g., [19]. In this context, departures from the linear wave eigenfrequencies may have several origins, such as a non-resting basic state [20,26], more complex mechanisms of moisture coupling [27,28], nonlinear effects [1], or coupling with oceanic processes [29]. A comparison among the different methods of identifying equatorial wave signals from observed field data can be found in Knippertz et al. [30].
A more mathematically rigorous approach to decomposing a given set of velocity and pressure fields into their corresponding eigenmodes is to project them onto the orthogonal basis set provided by the equatorial wave eigenfunctions. This procedure was carried out, for instance, in Gehne and Kleeman [31] using the equatorial -plane shallow water equations. Despite the simplicity of the model equations, the authors showed several important results, such as the role of long barotropic Rossby waves in generating spectral peaks on synoptic scales. A normal mode decomposition approach combined with space-time spectral analysis was put forward by Castanheira and Marques [32], who studied the coherence between the OLR signal and the normal-mode decomposed fields.
In the present study, we use a similar procedure to those documented in Gehne and Kleeman [31] and Castanheira and Marques [32], in which the contribution of each mode type to the field variables is obtained by the projection onto the corresponding mode eigenvector rather than the spectral peak bands in the wavenumber-frequency domain. In this context, as in Castanheira and Marques [32], the basis function set associated with the modal decomposition is provided by the eigensolutions of the spherical geometry primitive equations linearized around a resting background state. In this way, the corresponding normal mode functions (NMF) consist of the eigenfunctions of a rigid lid boundary condition Sturm–Liouville problem as vertical structure functions and the eigenfunctions of Laplace’s tidal equations, the so-called Hough vector harmonics [33,34,35], as the horizontal structure functions. We use ERA-Interim reanalysis data from the European Centre for Medium-Range Weather Forecasts [36] to decompose the velocity and geopotential height fields onto the NMF basis. The projection procedure was first proposed by Kasahara and Puri [37]; here, we use a particular implementation of this procedure provided by the open source MODES software described in Žagar et al. [38]. This procedure has been successful in describing different atmospheric phenomena, such as the MJO [39] and the QBO [6,40].
Therefore, our approach to interpreting the observed data utilizes the eigensolutions of a simplified and incomplete model, namely, the dry linear primitive equation model. However, because the eigensolutions of this simplified model constitute an orthogonal and complete set, the solution of a more complex model (and, supposedly, the observed atmospheric fields) can be expanded in terms of these basis functions; this expansion may be truncated with an arbitrary accuracy at each time. In this context, unlike the linear and homogeneous terms of the governing equations, the non-homogeneous terms associated with nonlinearity, a non-resting background state, and parametric forcings due to the unresolved physics do not hold a diagonalized representation in terms of the basis set, and as such are responsible for coupling between different wave modes. Consequently, the normal mode decomposition provides a data interpretation perspective in which the aforementioned non-homogeneous terms of a more complex model can be thought of as mechanisms responsible for the breakdown of the normal modes’ independence, which in turn can lead to: (i) the excitation and/or instability of the normal modes, (ii) the modification of their propagation frequencies, and (iii) energy exchanges among different wave modes.
Following normal mode decomposition of the horizontal velocity and geopotential height fields, we obtain the wavenumber-frequency spectrum of the reconstructed 200 hPa zonal velocity field associated with each mode type, namely, Rossby (R), Kelvin (K), mixed Rossby-gravity (MRG), and eastward/westward propagating inertio-gravity modes (EIG/WIG), using the methodology proposed by Wheeler and Kiladis [18]. In addition, the wavenumber-frequency spectra mentioned above are computed for the barotropic and baroclinic components of the reconstructed wind fields, with these components being defined according to the vertical structure of the eigenmodes within the troposphere, as shown later. The results reveal a number of surprising departures from those expected based on linear wave theory. For instance, certain waves propagate in the opposite direction to what would be expected based on linear theory (e.g., WIG waves propagating eastward), and there are significant departures from the linear eigenfrequencies. We speculate that these discrepancies can be attributed to the interplay among the different coupling mechanisms involving distinct wave types, such as wave interactions through either the background state or nonlinearity, as well as coupling between waves and moist convection.
2. Normal Mode Function and Equatorial Wave Theory
2.1. Normal Mode Function
As previously mentioned, the basis functions utilized here for the projection of the three-dimensional global field dataset are the normal modes of the compressible primitive equations in the spherical coordinate frame linearized around a resting background state. Following the formulation of Kasahara and Puri [37], these equations can be written using the so-called -coordinate system as follows:
In the equations above, refers to the horizontal wind field, with u and v indicating its zonal and meridional components, respectively; = is the vertical coordinate, where p and are the pressure and surface pressure fields, respectively; (, ) refers to the regular longitude–latitude coordinate system; is the Earth’s rotation rate; R is the dry air gas constant; a is the average radius of the Earth; is the static stability parameter of the stably stratified background atmosphere; and
, with corresponding to the background temperature, z the geopotential height, and g the gravitational acceleration. Assuming the rigid lid boundary conditions at and , Kasahara and Puri [37] showed that the eigensolutions of system (1)–(3) above can be expressed as follows:
In (4), k is the zonal wavenumber, m and n are the indices that characterize the vertical and meridional structures of the eigenmodes, respectively, and the index distinguishes the wave type, as is discussed later. In this context, the vertical structure functions satisfy the following Sturm–Liouville problem:
where the separation constant is labeled as the equivalent height [41] and is determined from the eigenvalues of the boundary value problem above. To find these eigenvalues and their corresponding eigenfunctions, we use the numerical procedure proposed in Kasahara and Puri [37], which consists of solving the matrix eigenvalue problem obtained from the finite difference representation of Equations (5)–(7). The solutions corresponding to the first twenty eigenmodes are displayed in Figure 1. It can be noted that the first five modes exhibit a barotropic structure in the troposphere, that is, their eigenfunctions do not change sign throughout this layer. In addition, the vertical modes , and exhibit one, two, and three complete oscillations within the troposphere, respectively. Therefore, the mode classes , , , and can be thought of as analogous to the barotropic mode and the first, second, and third baroclinic modes, respectively, of a simpler version of (5)–(7) characterized by a constant static stability parameter and the upper lid located at the tropopause (see, for instance, [42]). Another point to be noted is that although modes exhibit only a few oscillations in the troposphere, they are highly oscillatory in the stratosphere. This can be attributed to the stronger static stability of the stratosphere in comparison with the troposphere. As in Žagar et al. [38], we have computed these modes for the basic state temperature profile provided by the global mean temperature field referred to the year 2000; however, this profile is not significantly different from the corresponding multi-year average field. In addition, the vertical eigenmodes displayed in Figure 1 are only slightly different from the ones obtained from typical tropical and extratropical temperature profiles (figures not shown). More specifically, as the troposphere is deeper in the tropics than extra-tropically, our classification of the vertical modes for the barotropic and baroclinic modes could be slightly changed by considering a typical tropical or extra-tropical temperature profile.
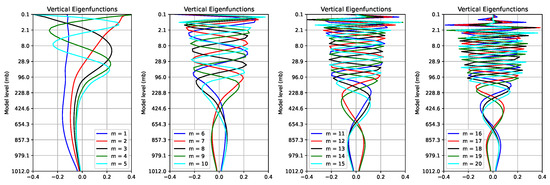
Figure 1.
Vertical structure functions corresponding to the first twenty vertical modes of the normal mode decomposition.
On the other hand, the meridional structure vector functions
, known as the Hough vector harmonics [34,35,43], along with the eigenfrequencies satisfy the following eigenvalue problem:
with the assumption that at the poles. The eigenvalue problem presented above, known as Laplace’s tidal equations, can only be solved numerically, unless asymptotic approximations are made as in Longuet-Higgins [33]. In the open-source MODES software utilized here, the eigenfrequencies and the corresponding Hough vector eigenfunctions are obtained from the numerical procedure described in Kasahara [34] and Swarztrauber and Kasahara [44]. According to Kasahara [34], the eigensolutions of (8)–(10) can be divided into the symmetric and antisymmetric eigenmodes. For the symmetric modes, and exhibit an even symmetry about the equator and exhibits an odd symmetry, whereas the antisymmetric modes are characterized by and exhibiting an odd symmetry and exhibiting an even one. As shown later, the symmetric (antisymmetric) modes are labeled by an odd (even) meridional quantum index n. Longuet-Higgins [33] classified the mode types of (8)–(10) as the first-kind oscillations, which correspond to the high-frequency westward/eastward propagating inertio-gravity waves, and the second-kind oscillations or rotational modes, which represent the so-called Rossby–Haurwitz waves. The Kelvin wave corresponds to the first eastward propagating symmetric mode of the first-kind oscillations, while the mixed Rossby-gravity waves refer to the first antisymmetric rotational mode [34].
2.2. Equatorial Wave Theory
Although we have utilized the normal mode functions on the sphere for the eigenmode decomposition of the observed large-scale atmospheric fields, as the Hough vector functions can only be obtained numerically, it is useful to make an analogy with the equatorial wave theory in order to show approximate analytical expressions for the meridional structure functions . In fact, for small values of the equivalent height , the Hough vector functions can be approximated by the eigensolutions of the equatorial -plane version of (8)–(10) [14]. These eigensolutions of the equatorial -plane shallow-water equations can be expressed in terms of the orthogonal basis of parabolic cylinder functions [10,13,14]. The meridional structure of the non-dispersive Kelvin wave is written as follows:
where ,
, with y representing the meridional displacement from the equator and the equatorial value of the Rossby parameter. The equatorial Kelvin wave dispersion relation is provided by . The e-folding length appearing in the equation above refers to the equatorial Rossby deformation radius, which is a measure of the equatorial trapping of the eigenmode; the smaller the value of this parameter, the more equatorially trapped the eigenmode is. Figure 2 displays the equatorial Rossby deformation radius as a function of the vertical mode index m. It can be noted from Figure 2 that the equatorial Rossby deformation radius is maximum for the vertical mode and sharply decreases with the vertical mode index m. This implies that the equatorially trapped eigenmodes, for which the meridional structure functions can be closely approximated by the parabolic cylinder functions described here, refer to the vertical modes having a baroclinic structure in the troposphere (). On the other hand, the modes having a barotropic structure in the troposphere ( are no longer trapped near the equator, exhibiting a large projection in middle and high latitudes, as is discussed later.
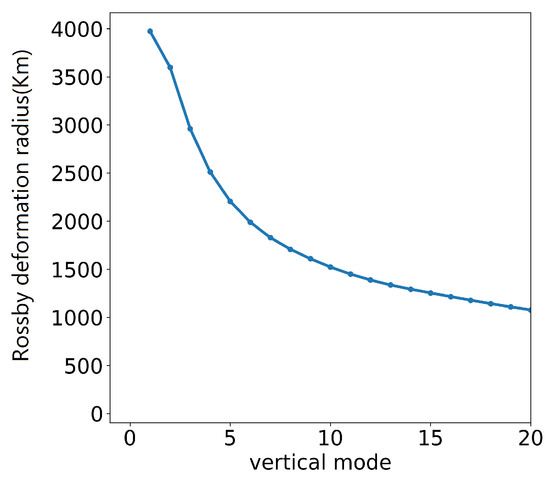
Figure 2.
Equatorial Rossby deformation radius (in Km) as a function of the vertical mode index m.
The mixed Rossby-gravity (MRG) wave and the first anti-symmetric eastward propagating inertio-gravity wave (EIG) have meridional structure functions of the following form:
with the eigenfrequencies satisfying
where the negative (positive) sign in (13) refers to ().
For the other EIG waves, as well as for the Rossby (R) and westward propagating inertio-gravity (WIG) waves, the meridional structure functions are provided by
where is the Hermite function, with representing the n-th degree Hermite polynomial and the eigenfrequencies satisfying the dispersion relation
Above, is defined such that .
3. Data and Methods
Here, in order to perform the normal mode decomposition, as well as to compute the space-time power spectra and the spatial coherence, we have used Era-Interim (ERAI) reanalysis data from the European Centre for Medium-Range Weather Forecasts [36]. The dataset consists of horizontal velocity, temperature, specific humidity, surface pressure, geopotential height, and orography fields; its horizontal resolution is × , with 60 vertical levels from surface level up to hPa.
3.1. Normal Mode Decomposition
From the orthogonality and completeness of the normal mode functions described in Section 2.1, the observed atmospheric fields can be expanded in a normal mode function series as follows:
In this way, given the observations of the horizontal wind, pressure and geopotential height fields, the spectral coefficients are obtained by the projection of the observed fields onto a particular eigenmode characterized by a vertical mode index m, zonal wavenumber k, meridional quantum index n, and a mode type labeled by , according to Equation (18). The parameter indicates whether the mode is an eastward inertia-gravity wave (EIG), a westward inertia-gravity wave (WIG), or a rotational mode (ROT). Thus, the meridional truncation considers N EIG, N WIG, and N ROT modes. The EIG and ROT modes with the lowest meridional index n are defined as the Kelvin wave and mixed Rossby-gravity wave modes, respectively [38].
The decomposition illustrated above is performed using the open source MODES software [38] with a truncation of K = 32, N = 20, and M = 43. Details on the numerical procedures are provided in Žagar et al. [38] and Kasahara and Puri [37]. The coefficients obtained from (18) can be used to compute filtered reconstructions of the atmospheric fields, for instance, the reconstruction of the dynamical fields associated with a single mode type:
3.2. Wavenumber-Frequency Power Spectrum Analysis
The wavenumber-frequency spectrum of tropical disturbances was initially documented in Takayabu [16], Takayabu [45] and then extended in Wheeler and Kiladis [18], with both of these studies analysing the OLR signals. The approach consists of performing the Fourier transform regarding both the zonal and time dependencies of the corresponding field variable averaged within the equatorial belt from to . Because the raw spectrum obtained by this procedure exhibits a red-noise nature, Wheeler and Kiladis [18] proposed its division by a background spectrum in order to allow clearer distinction of local maxima in the space associated with propagating wave disturbances. This background spectrum was defined by Wheeler and Kiladis [18] as a smoothed version of the raw spectrum obtained by applying a 1-2-1 filter. In this work, we use a 96-day time window with 65 overlapping days between consecutive windows. We adopt the methodology proposed by Wheeler and Kiladis [18] and implement it using the NCAR command language, available at https://www.ncl.ucar.edu/Document/Functions/Diagnostics/wkSpaceTime.shtml, accessed on 23 January 2023 [46].
However, because the normal mode decomposition comprises only velocity and geopotential height fields, we chose the zonal component of the velocity field (u) at the 200 hPa level to obtain the wavenumber-frequency spectra. As can be noted in Figure 1, this pressure level refers to the maximum of the vertical structure functions associated with vertical modes m = 8 and 9, which refer to the peak projection of the tropical atmospheric circulation response to deep convection heat forcing, e.g., [47,48]. Thus, at this level one can detect the signal of both the large-scale tropical disturbances and the tropical–extratropical teleconnections associated with barotropic Rossby waves. The large-scale features occurring at this pressure level may additionally be important for modulating atmospheric parameters that are relevant to astronomical observations. In fact, Shikhovtsev et al. [49] and Shikhovtsev et al. [50] have shown that large-scale circulation features such as those associated with baroclinic instability significantly contribute to turbulence energy spectra computed from high-altitude atmospheric flow observations.
3.3. Spatial Coherence
In order to quantify the degree of coupling between the dynamical fields associated with different wave types, we adopt the concept of classical coherence to take into account spatial variability. Different versions associated with coherence have been used to quantify the coupling between normal modes [6,51]. In the present work, in particular, we apply this quantity for the zonal velocity field associated with two wave types, and . The idea is to calculate both the autocorrelation and cross-correlation functions based on the spatial correlation of the fields at each grid point. We define the cross-correlation function as
where is a time lag given in days. Analogously, the auto-correlation function is defined as
where . Then, the spatial coherence is defined as the Fourier transform of the cross-correlation function normalized by the product of the two auto-correlation functions, viz.
with the Fourier transform being defined as follows:
Here, we use the parameter days. The coherence statistics were computed separately for different seasons (December-January-February and June-July-August) within one year, while the mean and standard deviations were computed for different years.
4. Results
For illustrative purposes, Figure 3 shows the 200 hPa horizontal wind and geopotential fields for 1 January 2001 at 12UTC. Figure 3a displays the original fields, while the remaining panels illustrate their filtered versions for specific wave types according to Equation (19). The flow pattern displayed in Figure 3a is clearly dominated by the subtropical jet streams with embedded planetary-scale waves. As this flow pattern has a rotational character and relatively small divergence, it is essentially caused by the contribution of the rotational modes, as clearly demonstrated by comparing Figure 3a,b. Figure 3c is the same as Figure 3b except with the exclusion of those vertical modes with a barotropic structure in the troposphere (i.e., ). The flow pattern illustrated in Figure 3c is dominated by the subtropical jets, with equally important contributions in certain regions of the tropics, most notably in the Pacific sector. Figure 3d,e presents the respective contributions of eastward and westward inertio-gravity waves to the horizontal wind and geopotential fields displayed in Panel (a). As a consequence of the dominance of the rotational modes with respect to the flow pattern illustrated in Figure 3a, the dynamical fields due to the activity of the inertio-gravity modes are of much weaker magnitude, as can be observed in Figure 3d,e. The divergent character of the flow associated with the high-frequency waves is clear from Figure 3d,e. The Kelvin wave contribution is presented in Figure 3f. As expected, the Kelvin component is characterized by a symmetric about the equator zonal flow in phase with the geopotential field, with both exhibiting strong trapping near the equator. The mixed Rossby-gravity mode contribution displayed in Figure 3g is strongly confined near the equator, exhibiting a strong symmetric about the equator meridional flow and an antisymmetric about the equator geopotential field.
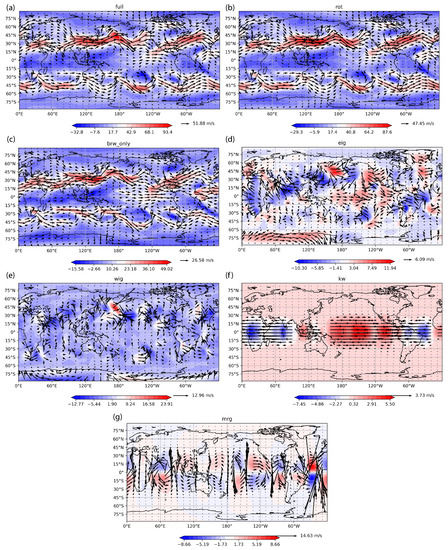
Figure 3.
Snapshot of the horizontal velocity and geopotential fields at 200 hPa (a) and their decomposition on the normal mode function basis for rotational modes (b), the baroclinic component of the rotational modes (c), eastward inertio gravity (EIG) modes (d), westward inertio-gravity modes (e), Kelvin wave mode, (f) and mixed Rossby-Gravity mode (g).
4.1. The Wavenumber-Frequency Spectra
Figure 4 shows the wavenumber-frequency spectra for the 200 hPa zonal wind field. Figure 4a–c displays the symmetric part of the spectrum, while Figure 4d–f presents the antisymmetric part. The respective raw power spectra of each diagram are shown in Figure S1 of the supplementary material [18]. The wavenumber-frequency spectrum has been computed from the raw data set in panels (a) and (d), while the remaining panels show wavenumber-frequency spectra computed from the reconstruction of the zonal wind field by considering only the barotropic (panels b and e) and baroclinic (panels c and f) components. The barotropic component refers to the vertical modes , and 5, which exhibit a barotropic structure throughout the troposphere, while the baroclinic component refers to the remaining vertical modes (). Figure 4a,d are similar to the wavenumber-frequency spectra of tropical disturbances documented in the literature, e.g., [4,16,18,45], and are presented here for comparison purposes. In Figure 4a, a significant spectral peak band is apparent following the linear dispersion relation of the Kelvin waves between wave-numbers 2 and 10. Another significant spectral peak observed in Figure 4a refers to westward-propagating planetary-scale disturbances with wavenumbers 1–5, a spectral domain that corresponds to the barotropic Rossby–Haurwitz waves, e.g., [31]. The strongest power signal of the symmetric part of the observed 200 hPa zonal wind field spectrum occurs at wave-number 1 with an intraseasonal timescale, which might be associated with the Madden–Julian Oscillation (MJO). There is a noticeable and significant spectral peak associated with large-scale () westward inertio-gravity waves, along with several significant signals above the dispersion curves associated with equatorial Rossby waves. The antisymmetric part of the spectrum (Figure 4d) shows a strong signal along the dispersion relation of the eastward propagating inertio-gravity modes with zonal wavenumbers 3–10. Here, the first antisymmetric eastward propagating inertio-gravity mode can be thought of as the eastward branch of the continuum spectrum of the mixed Rossby-gravity mode; see [52,53] for further discussion.
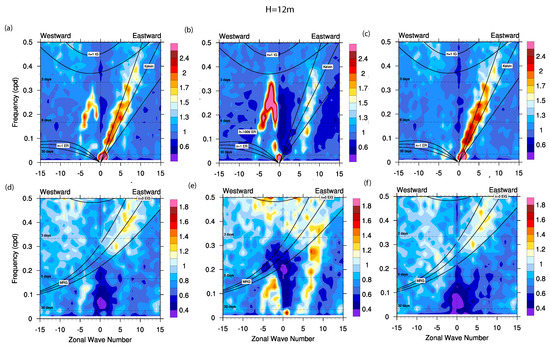
Figure 4.
Frequency-wavenumber spectrum of the zonal wind field at 200 hPa, for the symmetric (panels (a–c)) and antisymmetric (panels (d–f)) parts of the spectrum; panels (a,d) refer to the full spectrum of vertical modes, whereas panels (b,e) show the barotropic component and panels (c,f) the baroclinic component of the corresponding spectra.
The most remarkable difference between the wavenumber-frequency spectra presented in Figure 4a,d and those wavenumber-frequency spectra of outgoing long-wave radiation (OLR) presented in the literature is in the peak at planetary scales (wavenumber 1–2) having an intraseasonal timescale associated with the MJO. While here this spectral peak is strongly concentrated at planetary scales, the corresponding intraseasonal peak associated with the OLR spectrum presented by [4] is more elongated along the zonal wavenumber domain, showing a dispersion relation . This difference might be attributed to the circulation associated with moist convection containing less kinetic energy than the large-scale circulation dominated by Rossby and Kelvin waves. In addition, as the OLR field is a proxy for convection activity, its spectrum should contain the multiple scales associated with convection organization; for instance, see [1,27,54].
The wavenumber-frequency spectrum of the barotropic () component of the 200 hPa zonal wind field shows that the peak associated with westward propagating disturbances with wavenumbers and a period of days observed in Figure 4a is indeed associated with barotropic waves. This spectral peak might result from the energy injection associated with baroclinic instability, as discussed in the next subsection. On the other hand, the baroclinic component of the symmetric part of the 200 hPa zonal wind spectrum (Figure 4c) is largely dominated by a signal that follows the Kelvin wave dispersion relation, with a particularly strong spectral peak at and a period of days that may be attributed with the Madden–Julian Oscillation. Regarding the antisymmetric component of the 200 hPa zonal wind space-time spectrum, it is notable that its baroclinic component (Figure 4f) is very similar to the corresponding full spectrum (Figure 4d), and is dominated by a spectral peak following the dispersion relation of the eastward propagating inertio-gravity mode. The barotropic component, on the other hand, shows spectral peaks in different regions of the spectrum, including a narrow peak related to westward propagating disturbances for the intraseasonal timescale; this may be associated with the MJO. Spectral peaks with characteristic periods of T = 5–10 days and zonal wavenumbers k = 1–5 exhibiting westward propagation, along with a spectral peak with a period of T = 3–5 days and wavenumber k = 6–9 exhibiting eastward propagation, are observed as well. There is a noticeable strong peak of the barotropic component at k = 0 for the intraseasonal timescale. This intraseasonal timescale barotropic k = 0 signal refers to the super-rotation characteristic of the MJO. In fact, in the context of the MJO multiscale model proposed by Biello and Majda [55], Biello et al. [56] demonstrated that the planetary-scale circulation associated with the MJO exhibits a vertical and zonal mean meridional flux convergence that drives equatorial westerly flows.
In order to help with interpretation of the results presented in Figure 4, in Figure 5 we present the energy spectrum as a function of the zonal wavenumber k and the vertical mode index m. From Figure 5, it can be noted that the spectrum is dominated by disturbances with large spatial scales (k = 1–5) and a barotropic structure in the troposphere (m = 1–5). This spectral dominance of planetary-scale disturbances with a barotropic structure, observed in Figure 5, is consistent with the strong spectral peaks of the barotropic component of the flow displayed in Figure 4b, which is associated with westward propagating barotropic Rossby waves and the superrotation characteristic of the MJO. In addition, the secondary peak observed in Figure 5 over the baroclinic mode , with a somewhat broad signal over zonal wavenumbers 1-10, may be due to the strong spectral peak of the baroclinic component of both the MJO and the convectively coupled Kelvin modes verified in Figure 4c.
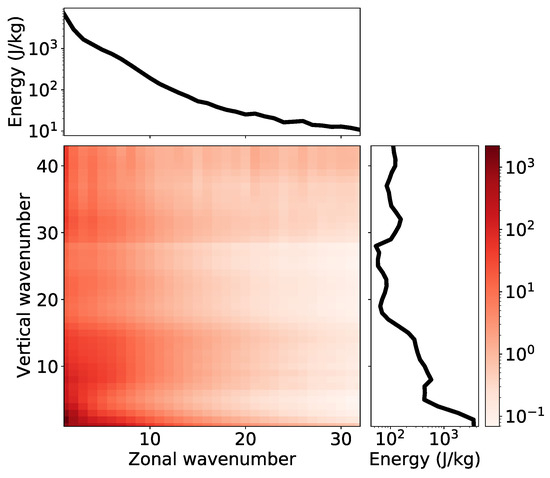
Figure 5.
Energy spectrum of the atmospheric oscillations as a function of the zonal wavenumber and the vertical mode index.
4.2. Rossby Modes
Figure 6 shows the wavenumber-frequency spectra computed from the normal mode decomposition of the 200 hPa zonal wind field that retains only the rotational modes, with all the vertical modes (Figure 6a,d), and with only the barotropic (Figure 6b,e) and baroclinic (Figure 6c,f) components. Figure 6a–c displays the symmetric part of the spectrum, while Figure 6d–f presents the antisymmetric part. The respective raw power spectra of each diagram are shown in Figure S2 of the supplementary material [18]. For the symmetric part of the full vertical mode spectrum, it can be seen in Figure 6a that there is an energy concentration on wave-number 1, with eastward propagation associated with the global-scale circulation pattern related to the Madden–Julian Oscillation (see, for instance, the MJO skeleton theory composed of global-scale Rossby and Kelvin waves presented in Majda and Stechmann [54]). A significant spectral peak is found on the synoptic timescale (3–6 day period) with westward propagation, which was proposed by Gehne and Kleeman [31] as being due to the barotropic Rossby–Haurwitz wave activity. This spectral peak on the synoptic scale with westward propagation is more pronounced and more closely related to the barotropic Rossby wave dispersion relation in the symmetric space-time spectrum evaluated from the barotropic component of the zonal wind field presented in Figure 6b, thereby confirming the Gehne and Kleeman’s claim.
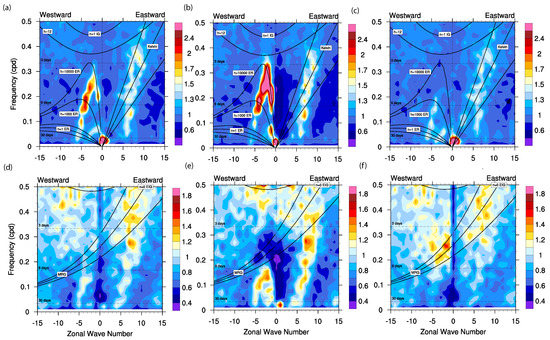
Figure 6.
Wavenumber-frequency spectrum of the 200 hPa zonal wind field associated with the rotational modes. Panels (a–c) refer to the symmetric part, while panels (d–f) refer to the antisymmetric part. The full spectrum of vertical modes is presented in panels (a,d), the barotropic component of the corresponding parts is displayed in panels (b,e), and the baroclinic component is illustrated in panels (c,f).
This spectral peak band on zonal wavenumbers 1–5 of the barotropic component of the 200 hPa zonal wind field, following the dispersion relation of barotropic Rossby–Haurwitz waves, is believed to be associated with the energy injection due to baroclinic instability. In fact, Tung and Orlando [57] used a two-layer quasi-geostrophic model to simulate the stationary energy spectrum that results from energy injection associated with baroclinic instability. They showed that the obtained stationary energy spectrum exhibits a peak on the largest synoptic-scale waves, as well as an approximate power low for the whole synoptic-scale range. The shape of the obtained energy spectrum was attributed to: (i) the selective potential energy injection from the mean flow, (ii) the role of the nonlinear wave–wave interactions having both upscale and downscale transfers, and (iii) the action of Ekman damping on planetary-scale waves. In addition, Ambacher and Waite [58] performed a similar analysis using a Galerkin expansion with the normal modes of the f-plane primitive equations; these normal modes are similar to the ones described in Section 2.1. The main difference is that Ambacher and Waite [58] considered the midlatitude f-plane geometry, for which only the vortical (geostrophic) mode and a pair of eastward/westward inertio-gravity waves are allowed. They showed that the stationary energy spectrum generated by the baroclinic energy injection is dominated by the barotropic mode, exhibiting an approximate power low of as a function of the vertical mode index m. A similar result was obtained by Kasahara and Tanaka [59], who solved the initial value problem in reference to the linearized equations around a baroclinically unstable background state for a global spherical geometry model using a Galerkin expansion in terms of the same normal modes described in Section 2.1. They showed that the energetics of the most unstable modes is dominated by the rotational wave modes characterized by the barotropic vertical mode and the lowest meridional quantum numbers n = 1–4. In addition, Kasahara [60] solved the forced-dissipative version of Kasahara and Tanaka’s equations and showed that the baroclinic instability enhances the mid-latitude circulation response to tropical deep convection heating. This mid-latitude circulation response to deep convection heating is in turn associated with barotropic Rossby–Haurwitz waves, since the eigenmodes having a barotropic structure in the troposphere are no longer trapped near the equator, as illustrated in Figure 2. According to Kasahara [60], these barotropic Rossby modes are excited by the interaction between the vertical shear of the background state and the tropical circulation response to deep convection heating, which exhibits a baroclinic structure in the troposphere. In addition, these barotropic Rossby modes can excite the equatorially trapped waves through either the vertical shear of the background flow or through nonlinear wave–wave interaction [1,42,61], as we discuss later.
An important point to be mentioned in relation to the above discussion is the use of the normal mode functions described in Section 2.1 to solve the perturbation equations around a background state having both meridional and vertical shear. In fact, as discussed in Section 1, although these normal mode functions are the eigensolutions of the perturbation equations linearized around a resting background state, the skew-Hermitian nature of the linear operator associated with these equations implies that their eigenmodes constitute an orthogonal and complete set; for instance, see [34,44]. Consequently, any square integrable vector function may be represented as a series of these eigenfunctions. This allows expression of the solution of a more complex model (presumably including the observed data fields analyzed here) that includes nonlinearity, more complex background states, and the parameterizations of unresolved physical processes such as cumulus convection in terms of a Galerkin expansion, as in Equation (17). Kasahara and Tanaka [59] compared their results with other studies on baroclinic instability, e.g., [62,63], and found that the baroclinically unstable modes can be represented with reasonable accuracy using the aforementioned normal mode expansion.
From the symmetric baroclinic component displayed in Figure 6c, we can observe that this spectral peak band over zonal wavenumbers 1–5 following the dispersion relation of barotropic Rossby waves is significantly reduced by removing the vertical modes with a barotropic structure in the troposphere, thereby confirming the above discussion of whether this signal might be attributed to the barotropic Rossby waves excited by baroclinic instability. On the other hand, the intense spectral peak at associated with the MJO remains after removing the vertical modes with a barotropic structure in the troposphere. This is in agreement with the global-scale circulation associated with the MJO being characterized by the tropospheric baroclinic structure associated with the tropical circulation response to deep convection heating [64]. The antisymmetric part of the spectrum (Figure 6d) shows a signal roughly following the dispersion relation of the MRG mode, which is evident in the baroclinic part of this spectrum as well (Figure 6f). The wavenumber-vertical mode spectrum of the rotational modes is presented in Figure 7, and is very similar in structure to the spectrum without any modal filtering presented in Figure 5; here, the energy is concentrated in low zonal wavenumbers and low vertical indices. In addition, it is possible to note a secondary peak with a baroclinic structure in the troposphere, associated with the vertical modes m = 7–10. The slower energy decay with zonal wavenumber for the barotropic mode in comparison with the other vertical modes is consistent with the baroclinic instability signal discussed above. In fact, Kurgansky [65] showed that the stationary energy spectrum of a barotropic nondivergent model is described by a power law when constrained by a baroclinic instability forcing and dissipation. The differences between the observed spectrum displayed in Figure 7 and the predicted power low of the barotropic energy spectrum obtained by Kurgansky [65] can be attributed to the upscale energy transfers occurring within the tropics, in particular the upscale energy fluxes associated with the MJO dynamics, e.g., [55].
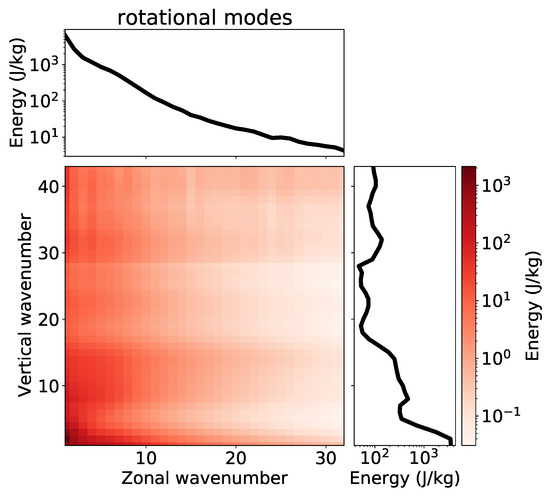
Figure 7.
Energy spectrum of the rotational mode component of the atmospheric oscillations as a function of the zonal wavenumber and vertical mode.
4.3. Westward Inertio-Gravity (WIG) Modes
Figure 8 shows the wavenumber-frequency spectrum computed from the normal mode decomposition of the 200 hPa zonal wind field that retains only the westward inertio-gravity (WIG) modes, including all the vertical modes (Figure 8a,d) and only the barotropic (Figure 8b,e) and baroclinic (Figure 8c,f) components. Figure 8a–c displays the symmetric part of the spectrum, while Figure 8d–f presents the antisymmetric part. The respective raw power spectra of each diagram are shown in Figure S3 of the supplementary material [18]. Observational evidence of WIG waves was first reported by Takayabu [45], and it has been shown that these waves are responsible for the so-called two-day oscillations; see [66] and references therein. In addition, the WIG modes are particularly important, as they have been invoked to explain the large-scale envelope of the MJO as a result of the interaction between WIG and eastward inertia-gravity (EIG) waves; for instance, see [67]. The wavenumber-frequency spectra obtained from the WIG mode contribution to the zonal wind field displayed in Figure 8 reveal a number of surprising aspects with respect to WIG wave propagation that strongly depart from the assumptions of free linear theory. Indeed, in Figure 8a it can be noted that the symmetric part of the spectrum exhibits a strong spectral peak in the vicinity of the WIG wave dispersion relation for wave-numbers k = 1–7, which is in agreement with linear theory. However, strong spectral peaks are found along the dispersion curve of the Kelvin waves with zonal wavenumbers 4–14. This result could be an indicator of coherent nonlinear interaction and wave synchronization involving Kelvin and WIG waves, as addressed in Section 5. This theoretical mechanism involving coherent nonlinear interaction through phase synchronization has previously been explored in the context of the barotropic nondivergent model [68], as well as in plasma physics [69] and solar physics [70] contexts. Other significant spectral peaks are found along the dispersion relation of the Rossby waves for k = 1–6. Figure 8 reveals other spectral peaks centered in the intraseasonal timescale, which are probably associated with the Madden–Julian oscillation. The baroclinic component of the symmetric part of the WIG wave spectrum presented in Figure 8c largely resembles the spectrum presented in Figure 8a, suggesting that the baroclinic component of the WIG waves is the dominant one, possibly due to the strong coupling of these waves with moist convection [20]. In addition, the significant spectral peak of WIG waves with eastward propagation and a typical period within the intraseasonal timescale ( days) can be associated with the possible aforementioned effect of the WIG modes on the MJO dynamics through their interaction with EIG modes. The role of inertio-gravity waves in the MJO dynamics is highlighted in a number of theories, such as the gravity wave theory of the MJO [21,67], as well as the multi-cloud theory of convection parameterization documented in Khouider and Majda [27] and Khouider and Majda [28].
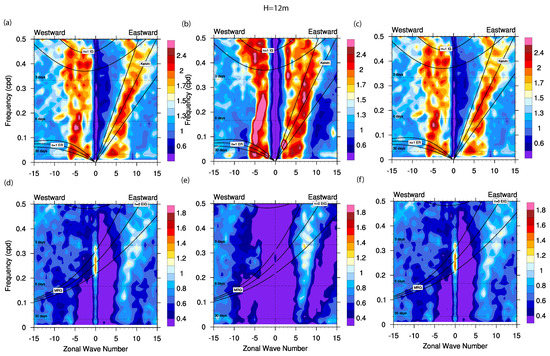
Figure 8.
Wavenumber-frequency spectrum of the 200 hPa zonal wind field associated with the westward inertio-gravity modes. Panels (a–c) refer to the symmetric part, while panels (d–f) refer to the antisymmetric part. The full spectrum of vertical modes is presented in panels (a,d), the barotropic component of the corresponding parts is displayed in panels (b,e), and the baroclinic component is illustrated in panels (c,f).
Likewise, the significant spectral peak band of the WIG projected 200 hPa zonal wind field over the dispersion curve of the Rossby modes observed in Figure 8 can be explained by the theoretical mechanism proposed by Raupp and Silva Dias [71], in which the Rossby modes can be excited by the resonant interaction of the inertio-gravity waves with the diurnal cycle of tropical deep convection heating. This mechanism proposed by Raupp and Silva Dias [71] is a linear wave interaction mechanism, similar to the interaction between two wave modes through the background state, as is discussed in Section 6. In addition, Raupp and Silva Dias [72] demonstrated that the resonant nonlinear interactions involving two baroclinic WIG waves and a barotropic Rossby mode can yield amplitude modulations of the WIG waves on the intraseasonal timescale when one of the WIG modes is resonantly excited by a diurnally varying heat source. Consequently, these nonlinear triad interactions can account for the intraseasonal spectral peaks of the WIG modes observed in Figure 8.
The power spectrum of the antisymmetric part, on the other hand, is much weaker, as can be observed in Figure 8d for the full vertical mode spectrum as well as for its decomposition into barotropic (Figure 8e) and baroclinic (Figure 8f) components.
Figure 9 is similar to Figure 8, except that it displays the wavenumber-frequency spectrum of the WIG mode contribution for the meridional wind field. The respective raw power spectra of each diagram are shown in Figure S4 of the supplementary material [18]. We analyze the wavenumber-frequency spectrum of the WIG projected meridional wind field to confirm that the spectral peak over the dispersion curve of the Kelvin wave observed in Figure 8 is indeed associated with WIG modes. This ensures that the spectrum displayed in Figure 8 do not contain any noise from the Kelvin wave activity, as Kelvin modes do not contribute to the meridional wind field. In fact, the significant power signal over the dispersion curve of the Kelvin modes is observed in Figure 9d–f as well, confirming that the strong spectral peak over the Kelvin wave dispersion relation observed in Figure 8a–c is indeed due to WIG modes. In addition, Figure 9e shows that barotropic WIG modes exhibit a strong spectral peak over their dispersion curve for zonal wavenumber 1–5. Another feature that can be noted by comparing Figure 8 and Figure 9 refers to the difference between the zonal and meridional wind spectra regarding the WIG modes. While the zonal wind field exhibits no signal at the modes, the meridional wind field spectra exhibit a strong power over the zonal wavenumber for a broad range of time frequencies. This feature is due to the fact that, according to the normal mode function theory [34,35,73], the zonal wind field associated with the inertio-gravity modes is identically zero for all the meridional quantum numbers and vertical modes.
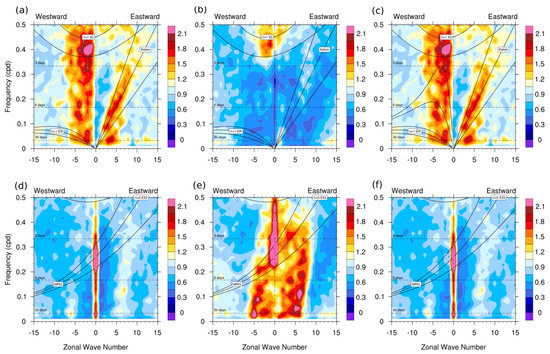
Figure 9.
Wavenumber-frequency spectrum of the 200 hPa meridional wind field associated with the westward inertio-gravity modes. Panels (a–c) refer to the antisymmetric part, while panels (d–f) refer to the symmetric component of the meridional wind field. The full spectrum of vertical modes is presented in panels (a,d), the barotropic component of the corresponding parts is displayed in panels (b,e), and the baroclinic component is illustrated in panels (c,f). Recall that the symmetric (antisymmetric) component of the meridional wind field corresponds to the antisymmetric (symmetric) modes.
The wavenumber-vertical mode spectrum of the WIG waves (Figure 10) differs from that of the rotational modes in that the primary peak in the vertical mode index is characterized by a baroclinic structure in the troposphere (m = 6–9). This result can be expected, as the divergent modes are more directly coupled with moist convection.
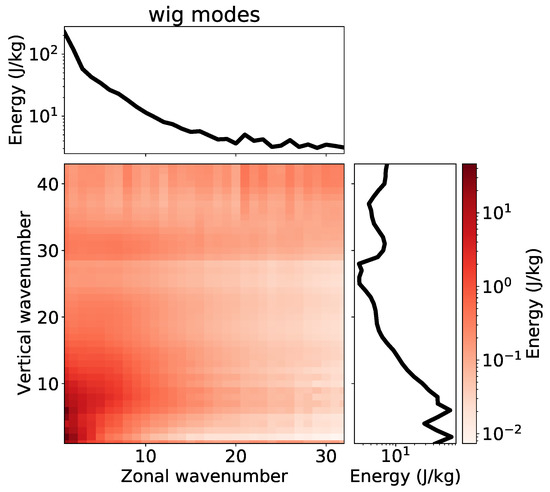
Figure 10.
Energy spectrum of the westward inertio-gravity mode component of the atmospheric oscillations as a function of the zonal wavenumber and vertical mode.
4.4. Eastward Inertio-Gravity (EIG) Modes
The wavenumber-frequency spectrum computed from the contribution of eastward inertio-gravity (EIG) waves for the 200 hPa zonal wind field is presented in Figure 11. In this normal mode reconstruction of the zonal wind field, the Kelvin waves are not considered, as their contribution is analyzed separately in the next subsection. As in Figure 4, Figure 6, and Figure 8, here panels a,b,c (d,e,f) display the symmetric (antisymmetric) part of the spectrum. In addition, panels (a) and (d) refer to the calculations with the full set of vertical modes, while panels (b) and (e) (c and f) display the results of the calculations with only the vertical modes (). The respective raw power spectra of each diagram are shown in Figure S5 of the supplementary material [18]. The symmetric part of the spectrum (Figure 11a) shows a few isolated spectral peaks near the linear dispersion curve of the planetary-scale EIG modes. The symmetric part of the spectrum for the barotropic EIG modes (Figure 11b) presents a strong and broad peak on the Kelvin wave dispersion curve within the zonal wavenumber range of k = 4–8; the same signal extends toward the EIG dispersion curve for k = 8. There is an additional spectral peak at the WIG wave dispersion curve at k = 7–9. The spectrum of the baroclinic EIG waves (Figure 11c) is quite similar to the full EIG mode spectrum (Figure 11a). Its analysis shows moderate peaks close to the dispersion relation of the Kelvin waves. This suggests that nonlinear interaction between EIG and Kelvin modes may occur, for instance by Kelvin waves exciting EIG waves as they propagate. Such nonlinear interaction involving Kelvin and EIG waves is likely to occur after Kelvin wave breaking [74], as discussed in the next subsection. Narrower regions of significant power are noticeable in the spectrum along the linear dispersion relation of the EIG modes for low wavenumbers (k = 1–4), along with a moderate peak around the 30-day period close to the dispersion relation of the equatorial Rossby waves at high wavenumbers. For the antisymmetric part of the spectrum of the EIG modes, there is a region with a high power peak following the dispersion relation of the first antisymmetric EIG mode with low wavenumbers (k = 1–5).
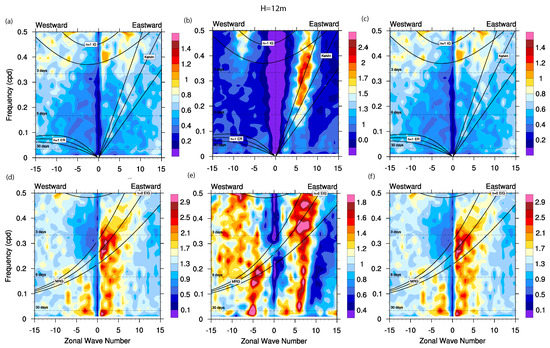
Figure 11.
Wavenumber-frequency spectrum of the 200 hPa zonal wind field associated with the eastward inertio-gravity modes. Panels (a–c) refer to the symmetric part, while panels (d–f) refer to the antisymmetric part. The full spectrum of vertical modes is presented in panels (a,d), the barotropic component of the corresponding parts is displayed in panels (b,e), and the baroclinic component is illustrated in panels (c,f).
Therefore, the results displayed in Figure 11 suggest that the EIG modes generally seem to be slave modes, with their propagation being determined by other waves such as the Kelvin and Rossby modes. The wavenumber-vertical mode spectrum of the EIG modes presented in Figure 12 is similar to that of the WIG modes, with a primary peak in the vertical mode index around m = 6–10 and the energy decaying with the zonal wavenumber.
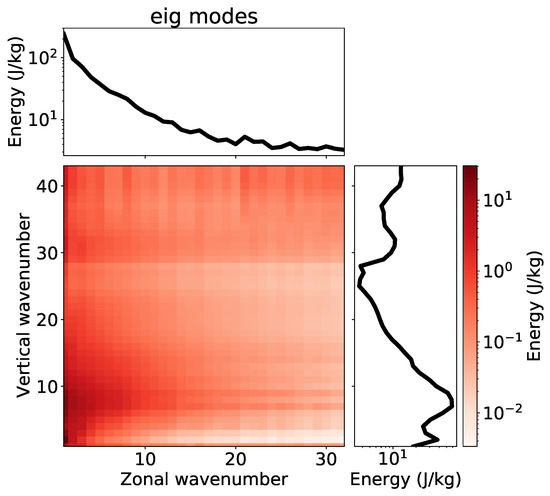
Figure 12.
Energy spectrum of the eastward inertio-gravity wave component of the atmospheric oscillations as a function of the zonal wavenumber and vertical mode.
There is a longstanding problem in tropical dynamics around understanding the lack of strong and broad spectral power along the dispersion relation of the EIG modes other than the first antisymmetric one, for instance, when observed from the OLR field [19]. The results presented in this section show that the spectral peaks on the symmetric part are weak (or at most moderate) and are isolated along the EIG mode dispersion relation, which is in agreement with previous investigations [4,19,45].
4.5. Kelvin Modes
The wavenumber-frequency spectrum computed from the contribution of the Kelvin waves for the 200 hPa zonal wind field is presented in Figure 13. Figure 13a refers to the calculations with the full set of vertical modes, while Figure 13b,c refers to the spectral reconstruction of the zonal wind field with only the barotropic () and baroclinic () components, respectively. The respective raw power spectra of each diagram are shown in Figure S6 of the supplementary material [18].
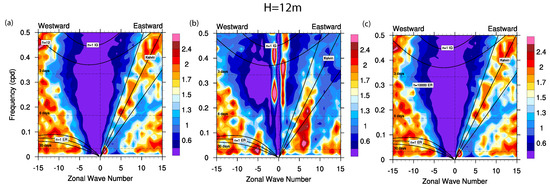
Figure 13.
Wavenumber-frequency spectrum of the 200 hPa zonal wind field associated with the Kelvin modes. The full spectrum of vertical modes is presented in panel (a), while panels (b,c) refer to the barotropic and baroclinic components, respectively.
Figure 13a shows a narrow peak with high power around the zonal wavenumber k = 1 and the intraseasonal timescale (30–70 days). This observed spectral peak is probably a manifestation of the role of the Kelvin mode in the morphology of the Madden–Julian Oscillation. For instance, Žagar and Franzke [39] performed a linear regression between the MJO multivariate index RMM1 [75] and the spectral coefficients associated with the normal mode function decomposition of the global reanalysis field data; they showed that the peaks of the MJO variance spectrum are due to: (i) the k = 0 barotropic Rossby modes with the meridional quantum number n = 1 and (ii) the Kelvin and n = 1 Rossby modes, both having zonal wavenumber 1 and vertical modes m = 7–8, which are associated with the vertical structure of the typical tropical circulation response to deep convection heating. As discussed in Section 4.1, the barotropic Rossby modes are related to the super-rotation characteristic of the MJO. Furthermore, regarding these planetary-scale wave modes associated with the MJO variability, Raphaldini et al. [76] have suggested that the Kelvin mode is the first to be excited, afterwards transferring energy to the baroclinic Rossby modes. In addition, it can be noted from Figure 13a that there is significant power in the intraseasonal range of frequencies for larger wavenumbers (k = 9–15), suggesting that these Kelvin modes contribute significantly to the variability of the MJO. Another point to be noted in Figure 13 is that the Kelvin waves with intermediate wavenumbers (k = 3–9) do not seem to exhibit a significant contribution to the MJO variability. In Figure 13a, a broad spectral signal can be observed along the linear dispersion relation of the Kelvin waves encompassing wavenumbers 5–15, along with significant power signals over high wavenumbers for both the eastward and westward components of the spectrum. These strong spectral signals over high wavenumbers are present for both the barotropic (Figure 13b) and baroclinic (Figure 13c) components of the Kelvin mode, suggesting an intrinsically turbulent nature associated with the Kelvin mode spectrum.
A possible explanation is that this turbulent nature of the Kelvin wave spectrum results from Kelvin wave breaking. In fact, as the Kelvin wave is non-dispersive, all of its harmonics are resonant with each other, meaning that a strong nonlinear interaction among all the wavenumbers composing this wave packet is allowed. In turn, this strong nonlinear interaction involving the Kelvin wave harmonics implies that as a Kelvin wave propagates eastward it steepens and breaks, resulting in a strong energy cascade towards high wavenumbers. The nonlinear dynamics of the equatorial Kelvin wave has been explored by Boyd [77] and Ripa [78]; these authors demonstrated the possibility of a nonlinear Kelvin wave steepening and breaking in a finite time. Boyd [74] demonstrated the possibility of a nonlinear Kelvin mode exciting eastward inertio-gravity modes after breaking; this excitation is related to asymptotic matching between the wave frequencies associated with high wavenumbers of both Kelvin and eastward inertio-gravity modes, implying a resonance between these two wave packets. In addition, a nonlinear Kelvin wave packet can excite specific harmonics of westward-propagating wave modes in the presence of variable topography [79].
Therefore, the formation of Kelvin wave fronts and their subsequent excitation of other wave modes may explain the strong signals at high wavenumbers observed in Figure 13. This turbulent character related to Kelvin wave activity suggests that a wavelet transform would be more appropriate for analyzing the observed space–time spectrum for the Kelvin mode, even for a global and long-period dataset. Indeed, the longitude–time spectrum of equatorial wave disturbances has previously been studied by adopting wavelet transforms to better analyze their local longitudinal features and/or time variations; for instance, see [80,81]. In a future work, we intend to extend the analysis in the present paper by employing a wavelet rather than a Fourier transform.
As in the corresponding spectra of the inertio-gravity waves, the wavenumber-vertical mode spectrum of the Kelvin waves (Figure 14) shows a primary peak for vertical indices associated with a baroclinic structure in the troposphere m = 6–10, a signature of the important role of these waves in organizing convective activity in the tropics (Figure 13c).
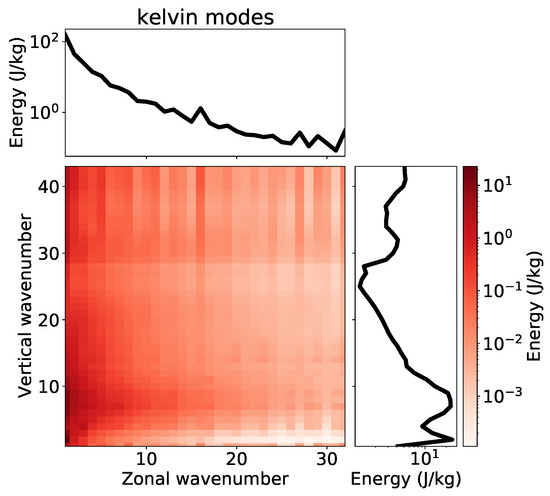
Figure 14.
Energy spectrum of the Kelvin mode component of the atmospheric oscillations as a function of the zonal wavenumber and vertical mode.
4.6. Mixed Rossby-Gravity (MRG) Waves
Because MRG waves have a negligible contribution to the zonal wind field, we computed the wavenumber-frequency spectrum based on the contribution of MRG waves to the 200 hPa meridional wind field. The resulting spectrum is illustrated in Figure 15. The respective raw power spectra of each diagram are shown in Figure S7 of the supplementary material [18]. Figure 15 shows that the MRG mode spectrum is dominated by a narrow and elongated peak with wavenumbers k = 5–6 and a characteristic timescale of 6–30 days with westward propagation, along with a secondary peak with eastward propagation around wavenumbers k = 5–10 and a characteristic timescale of 3–30 days (Figure 15a). The spectra computed from the corresponding barotropic and baroclinic components are similar. However, the barotropic component shows a more intense concentration of the power spectrum around these regions and an elongation of the eastward-propagating structures towards lower frequencies (Figure 15b). The wavenumber-vertical mode spectrum (Figure 16) of the MRG modes shows strong dominance of the barotropic structure in the troposphere m = 1–4, with a slowly decaying signal with the zonal wavenumber up to , along with a steeper slope for larger wavenumbers.
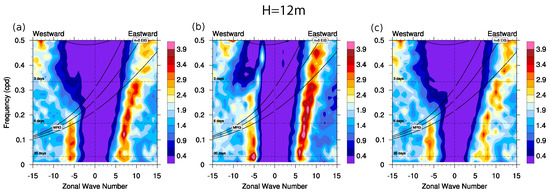
Figure 15.
Wavenumber-frequency spectrum of the 200 hPa meridional wind field associated with the mixed Rossby-gravity modes having (a) the full vertical mode spectrum, (b) a barotropic structure in the troposphere (), and (c) a baroclinic structure in the troposphere ().
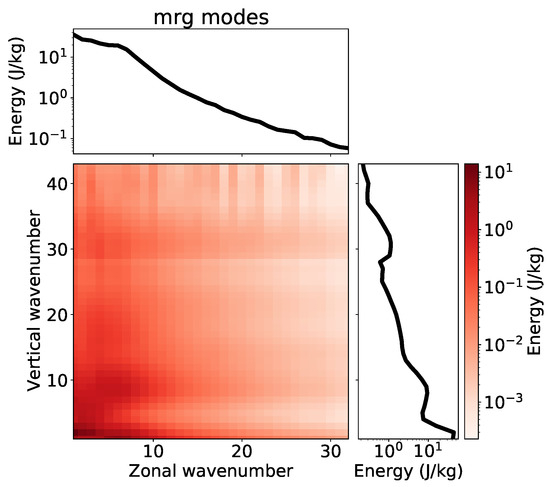
Figure 16.
Energy spectrum of the mixed Rossby-gravity mode component of the atmospheric oscillations as a function of the zonal wavenumber and vertical mode.
5. The Kelvin–WIG Interaction: A Case Study
Thus far, we have presented the observed frequency-wavenumber spectra of normal mode decomposed atmospheric fields and verified discrepancies between the obtained spectra and those expected according to the free/dry linear theory. As discussed in Section 6, there are a number of mechanisms that can potentially modify the propagation speed of waves, including the Doppler-shift effect due to a non-resting background zonal wind field [82], coupling of waves with moist convection [4,83], and advective nonlinearity [68]. Because the possible nonlinear interactions involving the different wave types are too diverse to be described here, we choose to focus on the case that appears the most outstanding, namely, WIG waves presenting spectral signals comparable with the Kelvin wave frequencies. This situation is illustrated in Figure 8, and is particularly the case for the baroclinic components (Figure 8c).
The shape of the observed WIG spectrum suggests an interaction with Kelvin waves, as confirmed by the similarity between the observed spectra of the WIG contribution to both zonal and meridional components of the 200 hPa wind field (Figure 8 and Figure 9).
Figure 17 shows the time–longitude propagation diagram, or Hovmoller diagram, for the WIG wave 200 hPa meridional wind field (a), the WIG wave 200 hPa zonal wind field (b), and the Kelvin wave 200 hPa zonal wind field (c), with the Hovmoller diagram of the outgoing longwave radiation (OLR) (d) displayed as an independent basis of comparison. In order to select a specific region of the spectrum where both Kelvin and WIG waves have a strong signal, we utilized a filter that retains only zonal wavenumbers k = 4–6 and periods shorter than 10 days, a spectral region where Kelvin waves typically present a strong peak. All the variables of the Hovmoller diagrams described above were averaged over the latitudinal belt of S to N.
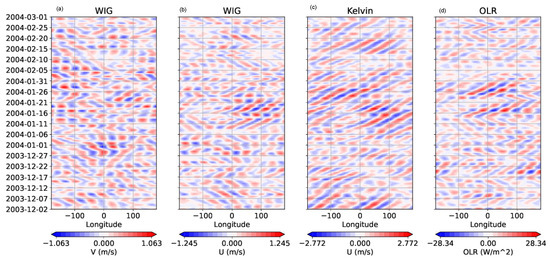
Figure 17.
Hovmöller diagram of (a) the 200 hPa meridional wind field due to westward inertio-gravity waves, (b) the 200 hPa zonal wind field due to westward inertio-gravity waves, (c) the 200 hPa zonal wind field associated with Kelvin waves, and (d) the OLR field. All fields were averaged over the latitudinal belt of S– N and filtered in space and time by removing signals with periods higher than 10 days and keeping only those signals with zonal wavenumbers between 4 and 6.
From Figure 17a,b, it can be seen that there are intervals in which the WIG waves propagate westward and periods in which these modes propagate eastward. This inversion of the propagation direction is evidence that the observed eastward propagation of WIG waves may not be due to the well-known Doppler-shift effect related to the background zonal wind velocity, because an inversion of the mean zonal wind field at the equator in a synoptic time-scale would be necessary to explain the observed behavior of the WIG modes. The Hovmoller diagram for the OLR field shows a strong resemblance to the propagation pattern of the WIG waves. The OLR field does not undergo the normal mode decomposition; rather, the dataset is from an independent data source (NCEP reanalysis). Therefore, this result can be viewed as strong evidence that (i) the WIG waves have a strong influence on the convective activity and (ii) the observed eastward propagation of the WIG waves is indeed physical.
Furthermore, it can be noted that the period of the strongest eastward propagation of WIG waves coincides with one of the periods in which the Kelvin wave signal is strongest, namely, mid-late January 2004 at around the longitude of . This suggests that in this particular period there is strong nonlinear interaction between these wave types. In order to quantify the interaction between the WIG and Kelvin waves, we calculated the coherence in terms of their zonal velocity fields. The results, displayed in Figure 18, show a strong and statistically significant coherence between the WIG and Kelvin wave signals, especially in the period range of 5–10 days. By separating this analysis into seasons, it is apparent that this coupling tends to be stronger during the southern hemisphere summer (December-January-February), suggesting that moist convection activity could be a key element in the coupling between WIG and Kelvin waves.
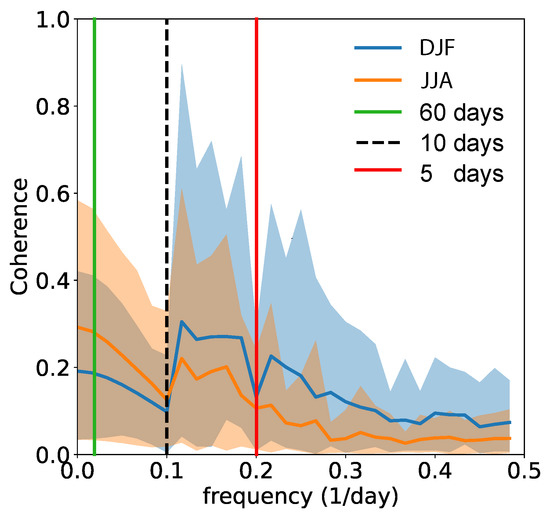
Figure 18.
Absolute value of the coherence between the westward inertio-gravity and Kelvin wave zonal wind fields at 200 hPa, averaged from 5S to 5N, from 1980 to 2010. The frequency of refers to the minimum frequency considered.
6. Possible Theoretical Mechanisms for the Modification of the Wave Frequencies
In light of the results presented in Section 4, which show that several of the observed equatorial wave spectra exhibit significant departures from the assumptions of dry linear theory, in this section we review the mechanisms that could potentially modify the mode eigenfrequencies, and as such may be responsible for these observed departures. For this purpose, recall that if we substitute the spectral expansion (17) into Equation (3), it follows that the spectral amplitudes evolve in time according to
In the equation above, we use a simplified notation for the mode indices in which the subscript a indicates a single normal mode characterized by its zonal wavenumber k, a vertical mode index m, a meridional quantum index n, and a wave type labeled , namely, . Therefore, for the linearized perturbation equations around a resting background state, each eigenmode evolves independently according to its own oscillation frequency. Nevertheless, in a more complex scenario containing the advective nonlinearity, a more complex background state (e.g., having a meridionally and/or vertically varying shear flow), and a parametric forcing associated with a cumulus convection parameterization, if one assumes a solution as a normal mode expansion according to (17) then the spectral amplitudes satisfy a set of ordinary differential equations of the form
In Equation (24), the RHS indicates the mechanisms that can potentially modify the mode eigenfrequencies. As is apparent from (24), the corresponding terms for the governing equations modeling these mechanisms do not hold a diagonalized representation in terms of the eigenmodes, meaning that , , and are coupling coefficients among different eigenmodes, as explained below. The first term in the RHS of (24) refers to the projection of the advective nonlinearity onto a particular eigenmode a, with representing a measure of the nonlinear coupling among each triplet of modes satisfying the so-called Elssaesser’s selection rules [68] and with the triad configuration resulting from the quadratic nature of the advective nonlinearity. For weak nonlinearity, the time frequencies of the wave modes are not significantly changed from their corresponding eigenvalues (, , and ); in this case, the effect of nonlinearity is to yield a modulation in the wave amplitudes associated with an energy exchange among the interacting modes. These energy exchanges occur on longer timescales than the period of the waves, and are restricted to wave-modes with linear eigenfrequencies that satisfy the resonance condition . An example is that of resonant triads involving a barotropic Rossby mode and two equatorial WIG modes, as studied by Raupp and Silva Dias [72], in which the amplitude modulation occurs on an intraseasonal time-scale. In contrast, beyond the weakly nonlinear regime, apart from the amplitude modulation associated with the energy exchanges among the waves, the wave phases (and consequently the time frequencies of the wave modes) can be significantly modified as well. For example, Raphaldini et al. [68] studied nonlinear wave interactions in the barotropic nondivergent model to analyze the role of the wave phases in the energy exchanges among different interacting wave triads. They showed that the phase propagation of the wave modes can be completely modified in the amplitude regime in which the inter-triad energy flow is maximized, with modes propagating even in the opposite direction from that predicted by linear theory. According to Raphaldini et al. [68], this amplitude regime is characterized by a kind of synchronization among the wave phases in which the fully nonlinear phase of an interacting wave triplet does not change in time. As discussed in the previous section, it is possible that a similar synchronization involving Kelvin and westward propagating inertio-gravity waves may be responsible for the modification of the frequency of the latter modes, as indicated by Figure 8.
The second term in the RHS of Equation (24) refers to the projection of the linear terms involving a background state having a meridionally/vertically varying shear flow onto a particular eigenmode a. The effect of such a background state on the normal-mode dynamics can be understood in terms of the possible limiting cases. In the limiting case, in which the magnitude of the background flow is of the same order as the disturbances’ amplitude (weak background flow), the background flow acts as a normal mode with zero zonal wavenumber and zero eigenfrequency. In this case, the role of the background flow is to act as a catalyst mode, that is, to enable two wave-modes a and b to exchange energy while maintaining its own amplitude/energy unchanged in time. This mechanism has been evoked to explain the tropical–extratropical teleconnections generated by tropical heat sources [84,85,86]. According to this conjecture, the vertical shear of the background flow allows the equatorially trapped wave-modes having a baroclinic structure within the troposphere (directly forced by tropical heat sources) to excite barotropic Rossby modes having a large midlatitude projection. In fact, Raupp et al. [42] demonstrated that baroclinic mixed Rossby-gravity modes having zonal wavenumbers are resonantly coupled with barotropic Rossby modes with meridional quantum number through the baroclinic component of the zonally symmetric geostrophic modes having even symmetry about the equator. According to Raupp et al. [42], for the initial amplitudes characterizing physically reasonable atmospheric flow perturbations, these wave modes exchange energy on an intra-seasonal time scale.
On the other hand, for a background flow with a magnitude much higher than the perturbations’ amplitude, another possible limiting case is when the background flow varies on a longer spatial scale than the wave phases, which is called WKB approximation. In this case, the effect of the background flow is to modify the propagation of the wave modes by changing their time frequencies in comparison with the corresponding eigenvalues for a resting basic state. This effect has been studied by Zhang and Webster [82], Wang and Xie [86] and Lim and Chang [87] in the equatorial wave context and Kasahara [88] in the context of the spherical normal modes. As mentioned in Section 5, it is unlikely that this effect is responsible for the most outstanding departures of the observed spectrum from the dry linear theory, namely, the case of the WIG modes exhibiting spectral signals over the Kelvin wave dispersion curve displayed in Figure 8, because the periods when the WIG modes propagate eastward are intermittent and consequently would require inversion of the background zonal wind field on a synoptic timescale.
Another possible regime refers to background flows having magnitude much higher than the waves and comparable spatial variations. In this case, apart from the modification of the mode propagation, instability is possible, and certain eigenmodes exhibit complex-valued time frequencies. These eigenmodes undergo exponential growth in their amplitudes until the breakdown of the linear approximation, with the nonlinear saturation yielding energy transfers throughout the spectral space until a stationary state is achieved. An example is the baroclinic instability spectrum discussed in Section 4.2. In practice, for an arbitrary background zonal flow with a meridional/vertical shear, all the above mentioned mechanisms are at work, namely, (i) the catalyst zero-frequency mode effect, (ii) the Doopler-shift effect on the wave propagation, and (iii) the linear wave instability. For example, Kasahara [60] studied the interplay between mechanisms (i) and (iii) by reference to a background zonal flow with both meridional and vertical shear, demonstrating in the linear context the effect of baroclinic instability in enhancing the midlatitude barotropic Rossby wave signal initially generated by the effect of the vertical shear of the background flow on coupling these barotropic modes with thermally forced tropical waves. On the other hand, this catalyst mode effect of the background flow allows a barotropic Rossby mode to excite an equatorially trapped wave mode [42]. Thus, it is possible that baroclinic instability contributes to the observed spectral peaks of tropical disturbances presented in Section 4 by the excitation of these barotropic Rossby waves. This midlatitude influence on tropical wave dynamics needs to be further investigated in the future.
The third term in the RHS of Equation (24) refers to the projection of a linear parameterization of the convective heating onto a particular eigenmode a. In the case of a nonlinear parameterization, this parametric forcing would be included in the first term in the RHS of (24). The mechanism represented by this parametric forcing term refers to the coupling of the equatorial wave modes with moist convection [89]. The role of this mechanism on the normal mode dynamics is analogous to the background state, in that it can: (i) couple two wave modes a and b, and consequently yield an energy exchange between them; (ii) modify the propagation of the wave modes; and (iii) yield a linear wave instability. The basic idea of role (ii) is that the coupling between a large-scale wave and moist convection reduces the effective static stability parameter of the atmosphere in comparison with the corresponding value of a dry atmosphere, resulting in a smaller equivalent depth and a slower propagation speed compared to what is expected from the normal mode theory of a dry atmosphere. Roles (ii) and (iii) in reference to the coupling of equatorial waves with moist convection have been demonstrated in the atmospheric science literature using different diabatic heating parameterizations, including the Wave-CISK, e.g., [90,91], boundary layer frictional convective convergence [92], multi-cloud [27,28,93], and WISHE-moisture mode [94,95,96] parameterizations. In addition, role (i) with regard to convective heating has been demonstrated by Raupp and Silva Dias [71], who showed that the resonant coupling between Rossby and inertio-gravity modes through the diurnal cycle of the background moisture field yields an energy exchange between these wave modes.
Role (ii) with respect to convective heating is evident in the observed wavenumber-frequency power spectrum of the full 200 hPa zonal wind field displayed in Figure 4, which shows the coincidence of certain spectral peaks over the dispersion curves of the wave types for small equivalent depths. Likewise, as discussed in Section 4.3, it is possible that the coupling between WIG and rotational modes through resonance with the diurnal cycle of tropical heating be responsible for the high spectral signals of the WIG decomposed zonal wind field on the Rossby wave dispersion curve observed in Figure 8. In addition, coupling with moist convection can enhance the potential for other mechanisms to modify the mode propagation. An example is the interplay between convective heating and nonlinearity, in which the wave instability produced by the former enhances the effect of the latter on wave propagation by increasing the amplitude of the wave mode.
7. Discussion
In the present study, we have analyzed the observed spectra of equatorial disturbances by computing the wavenumber-frequency spectrum of normal mode decomposed dynamical fields obtained from Era-Interim (ERAI) reanalysis data. In this approach, the large-scale atmospheric dynamical fields are projected onto the normal mode functions, defined as the eigensolutions of the compressible primitive equations in spherical coordinates linearized around a resting background state. From filtered versions of the spectral reconstruction of these dynamical field variables, we have computed the wavenumber-frequency spectrum using the methodology proposed by Wheeler and Kiladis [18] for the 200 hPa wind field considering only single mode types (Rossby, Kelvin, WIG, EIG, and MRG modes) as well as their tropospheric barotropic and baroclinic components. In this approach, the corresponding variable is averaged in the tropical belt (i.e., from S to N) and then Fourier transformed regarding its longitude–time dependence, with the original spectrum divided by a background spectrum obtained from a smoother version of the former to better evidence the local maxima. Unlike other studies in the literature that analyzed the OLR spectrum to focus on the coupling of the waves with moist convection, e.g., [16,18,32,45], here we have primarily analyzed the dynamical field variables to investigate departures of the wave spectra from the results predicted by linear theory.
Our results show several aspects that agree with linear theory; for instance, the barotropic Rossby modes show a spectral peak that clearly follows their dispersion relation. As the barotropic Rossby modes exhibit a global meridional structure and are the most excited by baroclinic instability, this spectral peak is believed to be the midlatitude signature on the tropical wave dynamics. In addition, part of the Kelvin mode power spectrum follows the results predicted by linear theory, with an elongated spectral peak seemingly of a non-dispersive character propagating eastwards. In addition, part of the power spectrum obtained for the WIG modes, corresponding to wavenumbers k = 3–7, follows the linear dispersion relation.
On the other hand, we found several spectral peaks that largely depart from the results expected based on linear theory. First, for Kelvin waves, we verified a rather complex energy distribution throughout the wavenumber-frequency space, with strong power at high wavenumbers for a broad range of frequencies. A possible explanation for this result stems from the non-dispersive nature of the Kelvin wave, which implies a strong nonlinear coupling among all of its harmonics, leading to wave breaking and shock formation in a finite time [77,78]. Similarly, the obtained wavenumber-frequency spectra for the inertio-gravity waves show peaks over the dispersion relation of other wave modes. For instance, the power spectrum obtained for the EIG modes, especially for their barotropic component, clearly follows the dispersion relation of the Kelvin waves, while the spectrum obtained for the WIG modes shows peaks along the dispersion curves of equatorial Rossby waves, barotropic Rossby waves, MJO and Kelvin waves. These results suggest the potential role of different nonlinear mechanisms in the dynamics of the inertio-gravity wave modes, namely: (i) the resonant nonlinear triad interactions involving a barotropic Rossby mode and two equatorial inertio-gravity wave modes [72], (ii) the resonant nonlinear interaction involving Kelvin and short-wavelength EIG modes [74], (iii) the EIG-WIG wave interaction mechanism proposed to explain the MJO [67], and (iv) the coherent nonlinear interaction by phase synchronization [68,69,97] involving WIG and Kelvin modes.
Among all the above-mentioned nonlinear interactions, we have focused on the analysis of mechanism (iv) involving Kelvin and WIG waves, considering the clear eastward propagation pattern verified in the observed spectra of the WIG decomposed zonal wind field displayed in Figure 8 with frequencies comparable with those of Kelvin waves. In fact, the Hovmoller diagrams of the WIG filtered zonal and meridional velocities exhibit inversions in the propagation direction together with the periods of coherent synchronization with the Kelvin waves. Furthermore, the coherence analysis between Kelvin and WIG waves reveals strong coupling between these two wave types on a timescale of 5–10 days. This strong synchronization of the eastward propagation of the WIG waves with Kelvin wave propagation suggests a strong nonlinear interaction between these two wave types.
In addition to nonlinearity, other mechanisms could be responsible for the departures of the observed spectra of tropical disturbances from those predicted by dry linear theory, such as a meridionally/vertically varying background state or coupling between waves and moist convection. In fact, as discussed in Section 6, the linear interaction between equatorial Rossby and inertio-gravity wave modes through resonance with the diurnal cycle of the moisture field could, in the context of a deep convection parameterization [71], be a possible explanation for the significant spectral peak of the WIG projected zonal wind field over the equatorial Rossby wave dispersion relation. Moreover, apart from the baroclinic instability, a vertically sheared background flow works as a catalyst mode for the interaction between barotropic Rossby and equatorially trapped (i.e., baroclinic) wave modes [42,84,86]. Consequently, in addition to the spectral signal of barotropic Rossby modes, it is possible that baroclinic instability might contribute to the spectral peaks over the dispersion curves of equatorial (baroclinic) Rossby, MRG, and Kelvin waves. We intend to investigate this point in future work.
Apart from the above-mentioned linear wave interaction mechanism through the diurnal cycle of convective heating, the role of coupling with moist convection in the modification of wave frequencies is clear in the observed equatorial wave spectra presented in Section 4.1. These results show spectral peaks over the dispersion curves referring to smaller equivalent depths than the corresponding values for the vertical mode that is most excited by deep convection heating in the tropics. In addition, coupling with moist convection may enhance the potential of other mechanisms to modify the mode eigenfrequencies. In particular, the interplay between convective heating and nonlinearity could be a reasonable conjecture to explain the observed departures of the equatorial wave spectra from the results predicted by linear theory. In this context, the wave instability produced by the convective heating through the growth of the wave amplitudes could enhance the effect of nonlinearity on the modification of the wave frequencies. This conjecture is corroborated by recent studies that have revisited the geostrophic adjustment problem in the tropics in the presence of moist convective processes [98,99]. In particular, Rostami and Zeitlin [99] used a two-layer moist-convective nonlinear shallow water model; they showed that Kelvin and Rossby modes can fuse into a hybrid structure linked through a region of enhanced condensation and that this region is related to westward inertio-gravity waves.
Another important result refers to the analysis of the EIG mode power spectra, which shed light on the question of the absence of strong and broad spectral power peaks in the vicinity of the EIG mode dispersion relation (with the exception of the first antisymmetric one, which is a continuum of the eastward extension of the MRG modes). This fact was first highlighted by Takayabu [45] and by the subsequent work of Wheeler and Kiladis [18] on the OLR field. Here, only weak and isolated power peaks are found along the dispersion relation of these EIG modes, especially for their baroclinic component, which is the one that mostly contributes to the convective activity and consequently to the OLR field. Thus, further theoretical investigations need to be carried out in the direction of understanding the lack of strong spectral peaks on the wavenumber-frequency spectrum associated with the baroclinic EIG modes. Likewise, although only large-scale modes (i.e., ) have been analyzed here, smaller-scale convective activity associated with mesoscale systems is believed to impact large-scale Kelvin waves as well [100]. Therefore, another important extension of this work is to use reanalysis data with higher resolution and a wavelet transform to obtain the equatorial wavenumber-frequency power spectra associated with the normal mode decomposed field data in order to more accurately represent the spectrum of the Kelvin wave as well as its interaction with inertio-gravity waves.
Supplementary Materials
The following are available online at https://www.mdpi.com/article/10.3390/atmos14040622/s1.
Author Contributions
A.S.W.T. and B.R. designed the data analysis and A.S.W.T. carried it out. A.S.W.T. and all co-authors analyzed and discussed the results. A.S.W.T., B.R. and C.F.M.R. prepared the manuscript. All authors have read and agreed to the published version of the manuscript.
Funding
The work reported here has been supported by Fundação de Amparo à Pesquisa do Estado de São Paulo (FAPESP) (grants 2015/50122-0 and 2020/14162-6) and Coordenação de Aperfeiçoamento de Pessoal de Nível Superior - Brasil (CAPES) - Finance Code 001. B.R. acknowledges support from the National Center for Atmospheric Research, which is a major facility sponsored by the National Science Foundation under cooperative agreement 1852977, and acknowledges partial support from NASA grants such as the NASA-LWS award 80NSSC20K0355 (awarded to NCAR) and NASA-HSR award 80NSSC21K1676 (awarded to NCAR). V.M. was supported by NOAA grant number NA22OAR4310611.
Institutional Review Board Statement
Not applicable.
Informed Consent Statement
Not applicable.
Data Availability Statement
The datasets used here were obtained from the ECMWF website at https://www.ecmwf.int/, accessed date 23 January 2023.
Acknowledgments
We thank Matthew Wheeler and two anonymous reviewers for constructive comments that led to a significantly improved paper.
Conflicts of Interest
The authors declare no conflict of interest.
References
- Khouider, B.; Majda, A.J.; Stechmann, S.N. Climate science in the tropics: Waves, vortices and PDEs. Nonlinearity 2012, 26, R1. [Google Scholar] [CrossRef]
- Zhang, C. Madden-Julian oscillation. Rev. Geophys. 2005, 43. [Google Scholar] [CrossRef]
- Kiladis, G.N.; Weickmann, K.M. Circulation anomalies associated with tropical convection during northern winter. Mon. Weather. Rev. 1992, 120, 1900–1923. [Google Scholar] [CrossRef]
- Kiladis, G.N.; Wheeler, M.C.; Haertel, P.T.; Straub, K.H.; Roundy, P.E. Convectively coupled equatorial waves. Rev. Geophys. 2009, 47. [Google Scholar] [CrossRef]
- Ferranti, L.; Palmer, T.; Molteni, F.; Klinker, E. Tropical-extratropical interaction associated with the 30–60 day oscillation and its impact on medium and extended range prediction. J. Atmos. Sci. 1990, 47, 2177–2199. [Google Scholar] [CrossRef]
- Raphaldini, B.; Teruya, A.S.W.; Leite da Silva Dias, P.; Takahashi, D.Y.; Massaroppe, L. Stratospheric ozone and QBO interaction with the tropical troposphere on intraseasonal and interanual time-scales: A wave interaction perspective. Earth Syst. Dyn. Discuss. 2020, 2020, 1–25. [Google Scholar]
- Emanuel, K. Tropical cyclones. Annu. Rev. Earth Planet. Sci. 2003, 31, 75–104. [Google Scholar] [CrossRef]
- Gadgil, S. The Indian monsoon and its variability. Annu. Rev. Earth Planet. Sci. 2003, 31, 429–467. [Google Scholar] [CrossRef]
- Mayta, V.C.; Silva, N.P.; Ambrizzi, T.; Dias, P.L.S.; Espinoza, J.C. Assessing the skill of all-season diverse Madden–Julian oscillation indices for the intraseasonal Amazon precipitation. Clim. Dyn. 2020, 54, 3729–3749. [Google Scholar] [CrossRef]
- Matsuno, T. Quasi-geostrophic motions in the equatorial area. J. Meteorol. Soc. Jpn. Ser. II 1966, 44, 25–43. [Google Scholar] [CrossRef]
- Lindzen, R.S. Planetary waves on beta-planes. Mon. Wea. Rev. 1967, 95, 441–451. [Google Scholar] [CrossRef]
- Yanai, M.; Maruyama, T. Stratospheric wave disturbances propagating over the equatorial Pacific. J. Meteorol. Soc. Jpn. Ser. II 1966, 44, 291–294. [Google Scholar] [CrossRef]
- Majda, A. Introduction to PDEs and Waves for the Atmosphere and Ocean; American Mathematical Soc.: Providence, RI, USA, 2003; Volume 9. [Google Scholar]
- Gill, A.E. Atmosphere—Ocean Dynamics; Elsevier: Amsterdam, The Netherlands, 1982. [Google Scholar]
- Delplace, P.; Marston, J.; Venaille, A. Topological origin of equatorial waves. Science 2017, 358, 1075–1077. [Google Scholar] [CrossRef] [PubMed]
- Takayabu, Y.N. Large-scale cloud disturbances associated with equatorial waves. Part I: Spectral features of the cloud disturbances. J. Meteorol. Soc. Jpn. Ser. II 1994, 72, 433–449. [Google Scholar] [CrossRef]
- Pires, P.; Redelsperger, J.L.; Lafore, J.P. Equatorial atmospheric waves and their association to convection. Mon. Wea. Rev. 1997, 125, 1167–1184. [Google Scholar] [CrossRef]
- Wheeler, M.; Kiladis, G.N. Convectively coupled equatorial waves: Analysis of clouds and temperature in the wavenumber–frequency domain. J. Atmos. Sci. 1999, 56, 374–399. [Google Scholar] [CrossRef]
- Wheeler, M.; Kiladis, G.N.; Webster, P.J. Large-scale dynamical fields associated with convectively coupled equatorial waves. J. Atmos. Sci. 2000, 57, 613–640. [Google Scholar] [CrossRef]
- Yang, G.Y.; Hoskins, B.; Slingo, J. Convectively coupled equatorial waves: A new methodology for identifying wave structures in observational data. J. Atmos. Sci. 2003, 60, 1637–1654. [Google Scholar] [CrossRef]
- Yang, G.Y.; Hoskins, B.; Slingo, J. Convectively coupled equatorial waves. Part I: Horizontal and vertical structures. J. Atmos. Sci. 2007, 64, 3406–3423. [Google Scholar] [CrossRef]
- Yang, G.Y.; Hoskins, B.; Slingo, J. Convectively coupled equatorial waves in high-resolution Hadley Centre climate models. J. Clim. 2009, 22, 1897–1919. [Google Scholar] [CrossRef]
- Roundy, P.; Schreck III, C. A combined wavenumber-frequency and time-extended EOF approach for tracking the progress of modes of large-scale organized tropical convection. Q. J. R. Meteorol. Soc. 2009, 135, 161–173. [Google Scholar] [CrossRef]
- Roundy, P.; Schreck III, C.; Janiga, M. Contributions of convectively coupled equatorial Rossby waves and Kelvin waves to the real-time multivariate MJO indices. Mon. Weather. Rev. 2009, 137, 469–478. [Google Scholar] [CrossRef]
- Roundy, P. Tracking and prediction of large-scale organized tropical convection by spectrally focused two-step space–time EOF analysis. Q. J. R. Meteorol. Soc. 2012, 138, 919–931. [Google Scholar] [CrossRef]
- Dias, J.; Kiladis, G.N. Influence of the basic state zonal flow on convectively coupled equatorial waves. Geophys. Res. Lett. 2014, 41, 6904–6913. [Google Scholar] [CrossRef]
- Khouider, B.; Majda, A.J. A simple multicloud parameterization for convectively coupled tropical waves. Part I: Linear analysis. J. Atmos. Sci. 2006, 63, 1308–1323. [Google Scholar] [CrossRef]
- Khouider, B.; Majda, A.J. A simple multicloud parameterization for convectively coupled tropical waves. Part II: Nonlinear simulations. J. Atmos. Sci. 2007, 64, 381–400. [Google Scholar] [CrossRef]
- Ramirez, E.; da Silva Dias, P.L.; Raupp, C.F.M. Multiscale atmosphere–ocean interactions and the low-frequency variability in the equatorial region. J. Atmos. Sci. 2017, 74, 2503–2523. [Google Scholar] [CrossRef]
- Knippertz, P.; Gehne, M.; Kiladis, G.; Kikuchi, K.; Satheesh, A.R.; Roundy, P.A.; Yang, G.Y.; Žagar, N.; Dias, J.; Fink, A.H.; et al. The intricacies of identifying equatorial waves. Q. J. R. Meteorol. Soc. 2022, 148, 2814–2852. [Google Scholar] [CrossRef]
- Gehne, M.; Kleeman, R. Spectral analysis of tropical atmospheric dynamical variables using a linear shallow-water modal decomposition. J. Atmos. Sci. 2012, 69, 2300–2316. [Google Scholar] [CrossRef]
- Castanheira, J.M.; Marques, C.A. Convectively coupled equatorial-wave diagnosis using three-dimensional normal modes. Q. J. R. Meteorol. Soc. 2015, 141, 2776–2792. [Google Scholar] [CrossRef]
- Longuet-Higgins, M.S. The eigenfunctions of Laplace’s tidal equation over a sphere. Philos. Trans. Roy. Soc. London 1968, 262, 511–607. [Google Scholar] [CrossRef]
- Kasahara, A. Normal modes of ultralong waves in the atmosphere. Mon. Weather. Rev. 1976, 104, 669–690. [Google Scholar] [CrossRef]
- Kasahara, A. Numerical integration of the global barotropic primitive equations with Hough harmonic expansions. J. Atmos. Sci. 1977, 34, 687–701. [Google Scholar] [CrossRef]
- Dee, D.P.; Uppala, S.; Simmons, A.; Berrisford, P.; Poli, P.; Kobayashi, S.; Andrae, U.; Balmaseda, M.; Balsamo, G.; Bauer, d.P.; et al. The ERA-Interim reanalysis: Configuration and performance of the data assimilation system. Q. J. R. Meteorol. Soc. 2011, 137, 553–597. [Google Scholar] [CrossRef]
- Kasahara, A.; Puri, K. Spectral representation of three-dimensional global data by expansion in normal mode functions. Mon. Weather. Rev. 1981, 109, 37–51. [Google Scholar] [CrossRef]
- Žagar, N.; Kasahara, A.; Terasaki, K.; Tribbia, J.; Tanaka, H. Normal-mode function representation of global 3-D data sets: Open-access software for the atmospheric research community. Geosci. Model Dev. 2015, 8, 1169–1195. [Google Scholar] [CrossRef]
- Žagar, N.; Franzke, C.L. Systematic decomposition of the Madden-Julian Oscillation into balanced and inertio-gravity components. Geophys. Res. Lett. 2015, 42, 6829–6835. [Google Scholar] [CrossRef]
- Raphaldini, B.; Teruya, A.; Silva Dias, P.L.; Mayta, V.; Takara, V.J. Normal mode perspective on the 2016 QBO disruption: Evidence for a basic state regime transition. Geophys. Res. Lett. 2020, 47, e2020GL087274. [Google Scholar] [CrossRef]
- Taylor, G.I. The oscillations of the atmosphere. Philos. Trans. R. Soc. Lond. 1936, 156, 318–326. [Google Scholar]
- Raupp, C.F.M.; Silva Dias, P.L.; Tabak, E.G.; Milewski, P. Resonant wave interactions in the equatorial waveguide. J. Atmos. Sci. 2008, 65, 3398–3418. [Google Scholar] [CrossRef]
- Hough, S.S. On the application of harmonic analysis to the dynamical theory of the tide - Part II. On the general integration of Laplace’s dynamical equations. Philos. Trans. R. Soc. Lond. 1898, A191, 139–185. [Google Scholar]
- Swarztrauber, P.N.; Kasahara, A. The vector harmonic analysis of the Laplaces’s tidal equations. SIAM J. Sci. Stat. Comput. 1985, 6, 464–491. [Google Scholar] [CrossRef]
- Takayabu, Y.N. Large-scale cloud disturbances associated with equatorial waves. Part II: Westward-propagating inertio-gravity waves. J. Meteorol. Soc. Jpn. Ser. II 1994, 72, 451–465. [Google Scholar] [CrossRef]
- UCAR/NCAR/CISL/TDD. The NCAR Command Language, (Version 6.6.2) [Software]; UCAR/NCAR/CISL/TDD: Boulder, CO, USA, 2019.
- Gill, A.E. Some simple solutions for heat-induced tropical circulation. Quart. J. R. Meteor. Soc. 1980, 106, 447–462. [Google Scholar] [CrossRef]
- Silva Dias, P.L.; Schubert, W.H.; DeMaria, M. Large-scale response of the tropical atmosphere to transient convection. J. Atmos. Sci. 1983, 40, 2689–2707. [Google Scholar] [CrossRef]
- Shikhovtsev, A.Y.; Kovadlo, P.G.; Kopylov, E.A.; Ibrahimov, M.A.; Xuan, H.L. Astroclimatic Conditions at the Hoa Lac and Nha Trang Astronomical Observatories. Atmosphere 2021, 12, 18. [Google Scholar] [CrossRef]
- Shikhovtsev, A.Y.; Kovadlo, P.G.; Kopylov, E.A.; Ibrahimov, M.A.; Ehgamberdiev, S.A.; Tillayev, Y.A. Energy Spectra of Atmospheric Turbulence for Calculating Parameter. I. Maidanak and Suffa Observatories in Uzbekistan. Atmosphere 2021, 12, 20. [Google Scholar] [CrossRef]
- Vassili, K.; Terence J., O.; Nedjeljka, Ž. A Reduced-Order Representation of the Madden–Julian Oscillation Based on Reanalyzed Normal Mode Coherences. J. Atmos. Sci. 2019, 76, 2463–2480. [Google Scholar]
- Kiladis, G.; Dias, J.; Gehne, M. The Relationship between Equatorial Mixed Rossby–Gravity and Eastward Inertio-Gravity Waves. Part I. J. Atmos. Sci. 2016, 73, 2123–2145. [Google Scholar] [CrossRef]
- Dias, J.; Kiladis, G. The Relationship between Equatorial Mixed Rossby–Gravity and Eastward Inertio-Gravity Waves. Part II. J. Atmos. Sci. 2016, 73, 2147–2163. [Google Scholar] [CrossRef]
- Majda, A.J.; Stechmann, S.N. The skeleton of tropical intraseasonal oscillations. Proc. Natl. Acad. Sci. USA 2009, 106, 8417–8422. [Google Scholar] [CrossRef] [PubMed]
- Biello, J.A.; Majda, A.J. A New Multiscale Model for the Madden–Julian Oscillation. J. Atmos. Sci. 2005, 62, 1694–1721. [Google Scholar] [CrossRef]
- Biello, J.; Majda, A.; Moncrieff, M.W. Meridional Momentum Flux and Superrotation in the Multiscale IPESD MJO Model. J. Atmos. Sci. 2007, 64, 1636–1651. [Google Scholar] [CrossRef]
- Tung, K.K.; Orlando, W.W. The k−3 and k−5/3 Energy Spectrum of Atmospheric Turbulence: Quasigeostrophic Two-Level Model Simulation. J. Atmos. Sci. 2003, 60, 824–835. [Google Scholar] [CrossRef]
- Ambacher, M.R.; Waite, M.L. Normal Mode Spectra of Idealized Baroclinic Waves. J. Atmos. Sci. 2020, 77, 813–833. [Google Scholar] [CrossRef]
- Kasahara, A.; Tanaka, H. Application of vertical normal mode expansion to problems of baroclinic instability. J. Atmos. Sci. 1989, 46, 489–510. [Google Scholar] [CrossRef]
- Kasahara, A. Transient response of planetary waves to tropical heating: Role of baroclinic instability. J. Meteorol. Soc. Jpn. 1991, 69, 293–309. [Google Scholar] [CrossRef]
- Ferguson, J.; Khouider, B.; Namazi, M. Two-Way Interactions Between Equatorially-Trapped Waves and the Barotropic Flow. Chin. Ann. Math. 2009, 30, 539–568. [Google Scholar] [CrossRef]
- Simmons, A.J.; Hoskins, B.J. Baroclinic instability on the sphere: Normal modes of the primitive and quasi-geostrophic equations. J. Atmos. Sci. 1976, 33, 1454–1477. [Google Scholar] [CrossRef]
- Frederiksen, J.S. Growth rates and phase speeds of baroclinic waves in multi-level models on a sphere. J. Atmos. Sci. 1978, 35, 1816–1826. [Google Scholar] [CrossRef]
- Madden, R.A.; Julian, P.R. Description of global-scale circulation cells in the tropics with a 40–50 day period. J. Atmos. Sci. 1972, 29, 1109–1123. [Google Scholar] [CrossRef]
- Kurgansky, M.V. Energy Spectrum in a barotropic atmosphere. Adv. Geosci. 2008, 15, 17–22. [Google Scholar] [CrossRef]
- Haertel, P.; Johnson, R. Two-day disturbances in the equatorial western Pacific. Q. J. R. Meteorol. Soc. 1998, 124, 615–636. [Google Scholar] [CrossRef]
- Yang, D.; Ingersoll, A.P. Triggered Convection, Gravity Waves, and the MJO: A Shallow-Water Model. J. Atmos. Sci. 2013, 70, 2476–2486. [Google Scholar] [CrossRef]
- Raphaldini, B.; Peixoto, P.S.; Teruya, A.S.W.; Raupp, C.F.M.; Bustamante, M. Precession resonance of Rossby wave triads and the generation of atmospheric low-frequency oscillations. Phys. Fluids 2022, 34, 076604. [Google Scholar] [CrossRef]
- Chian, A.C.L.; Miranda, R.A.; Rempel, E.L.; Saiki, Y.; Yamada, M. Amplitude-phase synchronization at the onset of permanent spatiotemporal chaos. Phys. Rev. Lett. 2010, 104, 254102. [Google Scholar] [CrossRef]
- Raphaldini, B.; Medeiros, E.; Raupp, C.F.M.; Teruya, A.S. A new mechanism for Maunder-like solar minima: Phase synchronization dynamics in a simple nonlinear oscillator of magnetohydrodynamic Rossby waves. Astrophys. J. Lett. 2020, 890, L13. [Google Scholar] [CrossRef]
- Raupp, C.F.M.; Silva Dias, P.L. Interaction of equatorial waves through resonance with the diurnal cycle of tropical heating. Tellus Dyn. Meteorol. Oceanogr. 2010, 62, 706–718. [Google Scholar] [CrossRef]
- Raupp, C.F.M.; Silva Dias, P.L. Resonant wave interactions in the presence of a diurnally varying heat source. J. Atmos. Sci. 2009, 66, 3165–3183. [Google Scholar] [CrossRef]
- Kasahara, A. Further Studies on a Spectral Model of the Global Barotropic Primitive Equations with Hough Harmonic Expansions. J. Atmos. Sci. 1978, 35, 2043–2051. [Google Scholar] [CrossRef]
- Boyd, J.P. Higher order models for the nonlinear shallow water wave equations on the equatorial β-plane with application to Kelvin wave frontogenesis. Dyn. Atmos. Oceans 1998, 28, 69–91. [Google Scholar] [CrossRef]
- Wheeler, M.C.; Hendon, H.H. An all-season real-time multivariate MJO index: Development of an index for monitoring and prediction. Mon. Weather. Rev. 2004, 132, 1917–1932. [Google Scholar] [CrossRef]
- Raphaldini, B.; Takahashi, D.; Teruya, A.; Raupp, C.F.M.; Silva-Dias, P. Information flow between MJO related waves: A network approach on wave space. Eur. Phys. J. ST 2021, 230, 3009–3017. [Google Scholar] [CrossRef]
- Boyd, J.P. The nonlinear equatorial Kelvin wave. J. Phys. Oceanogr. 1980, 10, 1–11. [Google Scholar] [CrossRef]
- Ripa, P. Nonlinear wave-wave interactions in a One-Layer Reduced-Gravity Model on the equatorial β-plane. J. Phys. Oceanogr. 1982, 12, 97–111. [Google Scholar] [CrossRef]
- Majda, A.J.; Rosales, R.R.; Tabak, E.G.; Turner, C.V. Interaction of large-scale equatorial waves and dispersion of Kelvin waves through topographic resonances. J. Atmos. Sci. 1999, 56, 4118–4133. [Google Scholar] [CrossRef]
- Wong, M.L.M. Wavelet analysis of the convectively coupled equatorial waves in the wavenumber-frequency domain. J. Atmos. Sci. 2009, 66, 209–212. [Google Scholar] [CrossRef]
- Roundy, P. A wavenumber frequency wavelet analysis of convectively coupled equatorial waves and the MJO over the Indian Ocean. Q. J. R. Meteorol. Soc. 2018, 144, 333–343. [Google Scholar] [CrossRef]
- Zhang, C.; Webster, P. Effects of zonal flows on equatorially trapped waves. J. Atmos. Sci. 1989, 46, 3632–3652. [Google Scholar] [CrossRef]
- Khouider, B. Models for Tropical Climate Dynamics: Waves, Clouds, and Precipitation; Springer: Berlin/Heidelberg, Germany, 2019; Volume 3. [Google Scholar]
- Kasahara, A.; Silva Dias, P.L. Response of planetary waves to stationary tropical heating in a global atmosphere with meridional and vertical shear. J. Atmos. Sci. 1986, 43, 1893–1911. [Google Scholar] [CrossRef]
- Lim, H.; Chang, C.P. Generation of Internal-and External-Mode Motions from Internal Heating: Effects of Vertical Shear and Damping. J. Atmos. Sci. 1986, 43, 948–960. [Google Scholar] [CrossRef]
- Wang, B.; Xie, X. Low-frequency equatorial waves in vertically sheared zonal flow. Part I: Stable waves. J. Atmos. Sci. 1996, 53, 449–467. [Google Scholar] [CrossRef]
- Lim, H.; Chang, C.P. Dynamics of teleconnections and Walker circulations forced by equatorial heating. J. Atmos. Sci. 1983, 40, 1897–1915. [Google Scholar] [CrossRef]
- Kasahara, A. Effect of zonal flows on the free oscillation of a barotropic atmosphere. J. Atmos. Sci. 1980, 37, 917–929. [Google Scholar] [CrossRef]
- Adames, Á.F.; Maloney, E.D. Moisture Mode Theory’s Contribution to Advances in our Understanding of the Madden-Julian Oscillation and Other Tropical Disturbances. Curr. Clim. Chang. Rep. 2021, 7, 72–85. [Google Scholar] [CrossRef]
- Chang, C.P.; Lim, H. Kelvin wave-CISK: A possible mechanism for the 30-50 day oscillations. J. Atmos. Sci. 1988, 45, 1709–1720. [Google Scholar] [CrossRef]
- Lau, K.M.; Peng, L. Origin of low-frequency (intraseasonal) oscillations in the tropical atmosphere. Part I: Basic theory. J. Atmos. Sci. 1987, 44, 950–972. [Google Scholar] [CrossRef]
- Wang, B.; Rui, H. Dynamics of the coupled moist Kelvin-Rossby wave on an equatorial beta-plane. J. Atmos. Sci. 1990, 47, 397–413. [Google Scholar] [CrossRef]
- Khouider, B.; Majda, A.J. Multicloud models for organized tropical convection: Enhanced congestus heating. J. Atmos. Sci. 2008, 65, 895–914. [Google Scholar] [CrossRef]
- Fuchs, Ž.; Raymond, D.J. A simple model of intraseasonal oscillations. J. Adv. Model. Earth Syst. 2017, 9, 1195–1211. [Google Scholar] [CrossRef]
- Fuchs, Ž.; Gjorgjievska, S.; Raymond, D.J. Effects of varying the shape of the convective heating profile on convectively coupled gravity waves and moisture modes. J. Atmos. Sci. 2012, 69, 2505–2519. [Google Scholar] [CrossRef]
- Fuchs-Stone, Ž.; Raymond, D.J.; Sentic, S. A simple model of convectively coupled equatorial Rossby waves. J. Adv. Model. Earth Syst. 2018, 11, 173–184. [Google Scholar] [CrossRef]
- Miranda, R.A.; Rempel, E.L.; Chian, A.L. On–off intermittency and amplitude-phase synchronization in Keplerian shear flows. Mon. Not. R. Astron. Soc. 2015, 448, 804–813. [Google Scholar] [CrossRef]
- Rostami, M.; Zeitlin, V. Geostrophic adjustment on the equatorial β-plane revisited. Phys. Fluids 2019, 31, 081702. [Google Scholar] [CrossRef]
- Rostami, M.; Zeitlin, V. Can geostrophic adjustment of baroclinic disturbances in the tropical atmosphere explain MJO events? Q. J. R. Meteorol. Soc. 2020, 146, 3998–4013. [Google Scholar] [CrossRef]
- Yang, Q.; Majda, A.J. Upscale impact of mesoscale disturbances of tropical convection on convectively coupled Kelvin waves. J. Atmos. Sci. 2018, 75, 85–111. [Google Scholar] [CrossRef]
Disclaimer/Publisher’s Note: The statements, opinions and data contained in all publications are solely those of the individual author(s) and contributor(s) and not of MDPI and/or the editor(s). MDPI and/or the editor(s) disclaim responsibility for any injury to people or property resulting from any ideas, methods, instructions or products referred to in the content. |
© 2023 by the authors. Licensee MDPI, Basel, Switzerland. This article is an open access article distributed under the terms and conditions of the Creative Commons Attribution (CC BY) license (https://creativecommons.org/licenses/by/4.0/).