Abstract
The all-sky meteor radar is an important means to detect 70–110 km wind fields. Previous studies have shown that the wind field retrieved by all-sky meteor radars is closely related to the meteor count detected by the radar. However, the precision of the wind field is still unclear. In this paper, the influence of the meteor counts detected by two all-sky meteor radars operating simultaneously at Kunming station on wind fields is analyzed based on the observations of the two radars from 1 November 2013 to 31 December 2014. First, the meteor counts detected by the two meteor radars are approximately 100–3000 per hour, and the meteor count detected by the 37.5 MHz meteor radar is more than that according to the 53.1 MHz meteor radar. The meteor counts detected by the two radars vary with the local time and altitude. The meteor counts detected from 20 UTC to 02 UTC are the largest in the altitude range of 84–92 km, while the meteor counts detected from 09 UTC to 15 UTC are the lowest at other altitudes. Second, the more meteors detected by the two radars, the smaller the wind field differences retrieved by the two radars, and the closer the wind fields are to the real average wind field. Third, because the performance of the two radars is basically identical, except that the meteor counts detected by the two radars are different due to their different operating frequencies, the meteor count is the main system error of the wind fields retrieved, and the errors can be determined by the correlation coefficients of the wind fields retrieved by the two radars. Finally, in the altitude range of 76–100 km, the mean wind field differences of the two radars are less than 5 m/s.
1. Introduction
The mesosphere is dominated by meteorological influences from the lower atmosphere, including atmospheric tides, gravity waves, and planetary waves [1,2,3,4]. In addition, solar activity through the interaction between the solar wind and the Earth’s magnetosphere causes geomagnetic activity and perturbations to the global magnetosphere–ionosphere–thermosphere–mesosphere system [5,6,7,8,9,10,11,12]. Acquiring accurate knowledge of the neutral atmosphere wind, temperature, and density in the mesosphere/lower thermosphere (MLT) region is beneficial for studying the dynamics and climate of the middle atmosphere, including short-term wave activities such as gravity waves, tides, and planetary waves, and long-term changes such as interannual variations, seasonal variations, and intraseasonal variations [13,14,15].
Ground-based measurements such as radars are always considered as a powerful observation technology in detecting the MLT region; however, the lack of reliable radar scattering mechanisms at this altitude makes it difficult for a radar to continually measure the neutral atmosphere wind, temperature, and density. A meteor radar is an important means to detect the atmosphere in nearby space. It can observe the wind field of the 70–110 km atmosphere [16,17]. It calculates the wind field by the motion of the meteor trail. With the application of meteor radar observations in near-space environment research and to improve the accuracy of the understanding of atmospheric characteristics in near space, it is necessary to understand and obtain the error of wind fields that are retrieved by meteor radars.
After the meteoroid enters the atmosphere, the meteoroid collides with atmospheric molecules and rapidly ablates and ionizes in the height range of 70–110 km. Finally, a long and thin column of high-density plasma, which is called the meteor trail, is formed on the path of the meteoroid. The meteor trail scatters radio waves, and the scatter echo is received by a meteor radar. The sight drift velocity of a single meteor is obtained by the Doppler shift between the echo signal and the transmitted signal. Then, the wind field is obtained by fitting the sight drift velocity of all meteors in a certain time and height window with the least square method. The time and height window refers to the range with a time span of 1 h and an altitude range of 2 km. However, the precision of the wind field is still unclear. There are international studies on the comparison and analysis between meteor radars and other observation means for the observation of the diurnal variation of wind fields, the average wind field in a period of time, and some large-scale waves [18,19,20,21,22,23,24,25,26,27]. Comparative analyses of wind fields between meteor radars, LiDAR, medium-frequency radars, and FPI have also been carried out in China [28,29,30]. However, due to the differences in these means in observation principles and target properties, there are unknown wind field differences in the comparison between these different devices.
The China Research Institute of Radiowave Propagation operates two meteor radars that differ only in frequency at the Kunming observation station at the same time, and they are used to observe the atmospheric wind, temperature, density, and waves in the MLT region at low latitudes. [31,32,33,34,35]. Based on the observations of two meteor radars at Kunming station from 1 November 2013 to 31 December 2014, this study analyzes the wind field error of the meteor radar by comparing the wind fields observed by the two radars.
2. Observation Data of Two Meteor Radars
2.1. Introduction of Two Meteor Radars
The two meteor radars at the Kunming observation station (25.6°N, 103.8°E) were developed by the ATRAD Weather Radar Company of Australia. They belong to the series of BPMR (Buckland Park All-sky Interferometric Meteor Radar) systems, which is similar to that described by Holdsworth et al. 2004 [36]. Their operating frequencies are 37.5 MHz and 53.1 MHz, respectively, and their peak output powers are 20 kW and 40 kW, respectively. The distance between the transmitting and receiving antenna arrays of the two meteor radars is approximately 300 m. They can detect the signal at a height of −70–110 km within a range of 300 km away from the antenna arrays. Table 1 shows the main working parameters of the two meteor radars in which only the frequency and the peak output power of the transmitter are different, and the other parameters are the same.

Table 1.
Main operation parameters of 37.5 MHz and 53.1 MHz meteor radars.
2.2. Wind Field Retrieval Method
The radial velocity of the meteor trail where the meteor trail is located along the echo direction can be calculated by the shift between the echo signal scattered by the meteor and the transmitted signal. The radial velocity of the ith meteor trail is . Assuming that the radial velocity of all meteor trails within the observation range, which takes a certain time and height window (height range is 2 km and time span is 1 h), is uniform, the wind field is the average radial velocity of these meteor trails which can be calculated by using the following equation:
is the target function. When reaches its minimum, is the optimal value that denotes the average radial velocity of these meteor trails [37]. is the number of all meteor trails within the observation range.
3. Observation Data Analysis and Discussion
This section may be divided by subheadings. It should provide a concise and precise description of the experimental results, their interpretation, as well as the experimental conclusions that can be drawn.
3.1. Meteor Counts and Wind Field Analysis
Two meteor radars can detect approximately 8000–18,000 less dense meteor trail echoes every day, which are used to retrieve the wind field. To reduce the height uncertainty of meteor trail echoes and select weak meteor trail echoes (abbreviated meteor) [38,39], this paper mainly selects meteor with zenith angles less than 55°. After the above processing, the remaining meteor used to estimate the wind field is approximately 100–3000 per hour, shown in Figure 1. Moreover, the meteor count detected by the 37.5 MHz meteor radar is more than that detected by the 53.1 MHz meteor radar. The meteor count on 1 January 2014, is used to analyze the changes in the diurnal variation detected by the two radars. The results shown in Figure 2 indicate that the meteor count detected by the two radars is higher from 16 UTC but lower at other times. This is mainly due to the rotation of the Earth leading to significant diurnal variations in the meteor count at low latitudes.

Figure 1.
Time series of total meteor counts observed by 37.5 MHz and 53.1 MHz meteor radars from 1 November 2013 to 31 December 2014.
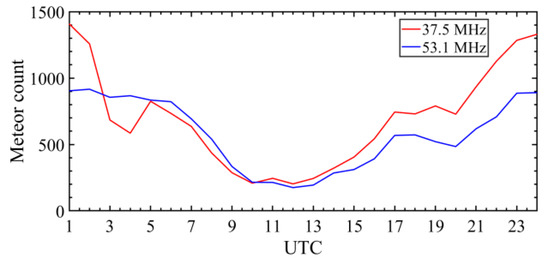
Figure 2.
Diurnal variations in meteor count detected by two meteor radars on 1 January 2014.
The comparison results of the meteor counts detected by the two meteor radars at different altitudes are shown in Figure 3. First, the meteor counts detected by the two radars are less than 100 at low altitudes (below 80 km) and high altitudes (above 96 km), and there is no obvious difference in the meteor counts detected by the two radars. Second, in the middle altitude range (80–96 km), the two meteor radars detected the largest meteor counts, the maximum value of which was more than 300. Moreover, in the altitude range of 84–92 km, the meteor count detected by the 37.5 MHz meteor radar is significantly more than that detected by the 53.1 MHz meteor radar.

Figure 3.
The distribution of the meteor count observed by two meteor radars along with the height from 1 November 2013 to 31 December 2014. (a) The 37.5 MHz meteor radar and (b) 53.1 MHz meteor radar.
Three hourly wind fields with more effective data are selected as examples to analyze the vertical variation in the meridional and zonal winds observed by two meteor radars in Figure 4. The zonal and meridional winds of the two radars have similar variation trends and periodic waves in the vertical direction with wavelengths ranging from 10–30 km, which is consistent with the wavelengths of the atmosphere tide. In the middle altitude range (82–96 km), the zonal and meridional winds observed by the two radars are close to each other. In particular, in case three, the zonal and meridional winds of the two radars are almost equal. However, the difference between the zonal and meridional winds at low altitude (<82 km) and high altitude (>96 km) becomes larger; the zonal wind directions of the two radars are even opposite above 100 km and the wind difference is as high as 60 m/s.
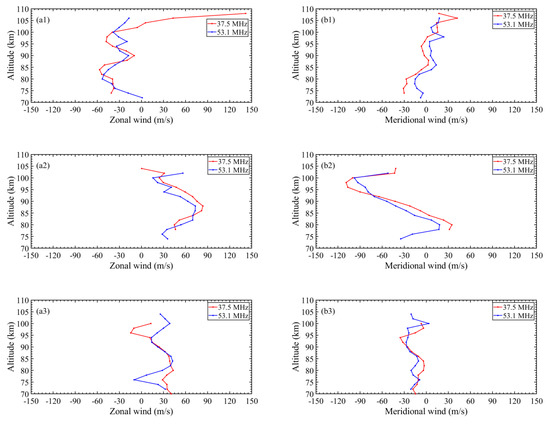
Figure 4.
Comparison of atmospheric wind profiles retrieved by two meteor radars. (a) Zonal wind and (b) meridional wind.
3.2. The Relationship between the Wind Field Difference and the Meteor Count
We compared and analyzed the zonal and meridional winds and the meteor counts observed by two meteor radars on 1 January 2014. The results shown in Figure 5 show that within one day, the zonal and meridional winds observed by the two meteor radars are basically the same, and they have the same atmosphere tide periods at different altitudes, indicating that the wind fields observed by the two radars have the same large-scale characteristics. The hourly variation results of meteors within a day detected by the two radars show that the meteor counts detected between 16 UTC and 07 UTC are higher, especially between 20 UTC and 02 UTC, while relatively few are detected at other times. The difference in the meteor count and the difference in the zonal and meridional wind detected by the two radars are compared and analyzed in Figure 5. First, when the meteor counts detected by the two radars reach the maximum times (20 UTC to 02 UTC) and the maximum altitude range (84–92 km), the meteor counts detected by the 37.5 MHz meteor radar are more than those detected by the 53.1 MHz meteor radar, and the difference in the meteor counts between the two radars is more than 100. In this case, the difference in the zonal wind between the two radars is approximately 5 m/s, while at other times or altitudes where the meteor counts are lower, the difference in the zonal wind between the two radars is as high as 20–50 m/s. Second, when the meteor counts detected by the two radars reach the minimum times (09 UTC to 15 UTC) and the minimum altitude range (below 84 km or above 92 km), the meteor count detected by the 53.1 MHz meteor radar is slightly more than that detected by the 37.5 MHz meteor radar, and the meteor count difference between the two radars is approximately 50. In this case, there is a significant difference in the meridional wind between the two radars, which is approximately 20–40 m/s. At other times within a day or heights with a large number of meteors detected, the meridional wind difference between the two radars is less than 5 m/s. Therefore, the zonal and meridional winds retrieved by the two radars are related to the meteor counts. When the meteor count is small, the zonal and meridional winds retrieved by the two meteors are significantly different. However, when more meteors are detected, there is a small difference in the zonal and meridional winds.
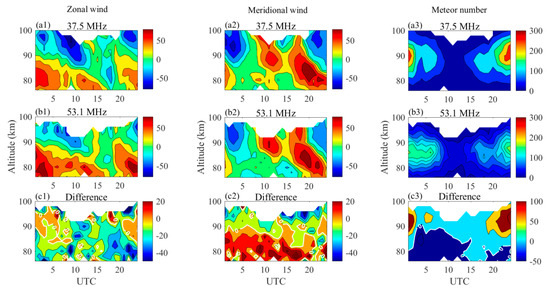
Figure 5.
Diurnal variations and their comparisons of wind fields and meteor counts observed by two meteor radars on 1 January 2014; (a1–c1) are, respectively, the zonal wind of two meteor radars and their difference; (a2–c2) are, respectively, the meridional wind of two meteor radars and their difference; and (a3–c3) are, respectively, the meteor count of two meteor radars and their difference.
Furthermore, a statistical analysis of the wind field difference between the two meteor radars at different altitudes is given in Figure 6. The horizontal axis represents the wind field difference, and the vertical ordinate represents the sample number corresponding to the wind field difference. As shown in Figure 5, the meteor counts detected by the two radars increase with altitudes from 76 km; meanwhile, the sample numbers with small wind field differences also increase with the altitudes in Figure 6, and the proportion of samples with small wind field differences in the total samples also increases. The meteor counts detected begin to decrease with altitudes from 88 km, sample numbers with small wind field difference gradually decrease, and the proportion of samples with small wind field differences in the total samples also gradually decreases. Therefore, the more meteors detected, the smaller the differences in the wind field between the two radars, and the closer to the true average wind field. Therefore, it can be considered that the meteor count is the main system error of the wind fields retrieved by the two radars.
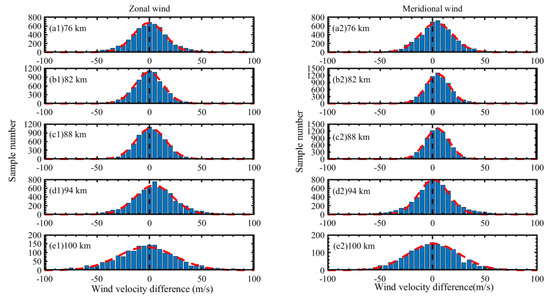
Figure 6.
Histogram statistical results of wind field difference between two meteor radars. (a1,b1,c1,d1,e1) Zonal wind, (a2,b2,c2,d2,e2) Meridional wind.
3.3. Analysis of Wind Field Error Related to Meteor Count
The correlations between the wind fields of the two meteor radars were analyzed. The correlation coefficients of the meridional and zonal winds shown in Figure 7 are obtained by using wind fields of two radars observed from 1 November 2013 to 31 December 2014. First, in the altitude range of 78–94 km, the correlation coefficients of the meridional and zonal winds observed by the two radars are both higher than 0.8, indicating a strong correlation. Especially when the meteor counts detected by the two radars reach the maximum at 84–92 km altitude, as shown in Figure 8, the correlation coefficients are greater than 0.9, because enough meteors can be detected within this altitude range so that the radars can obtain relatively more accurate average wind fields. Second, the meteor counts detected by the two radars at low altitudes (below 78 km) and high altitudes (above 94 km) are small, and the correlation coefficients are less than 0.8. Correlation coefficients are between 0.4 and 0.6 when the height is lower than 74 km or higher than 100 km. The performance of the two radars is basically identical in all aspects except for the different meteor counts detected due to their different working frequencies. Therefore, the discrepancy in the meteor counts is the main factor leading to the lack of correlation of the wind field between the two radars, which can be denoted by 1-R. Therefore, it can be determined that the relative errors of the system errors of the meridional and zonal winds caused by the meteor counts are 1-R. Table 2 shows the relative errors (%) of meridional and zonal winds at altitudes of 78–94 km.
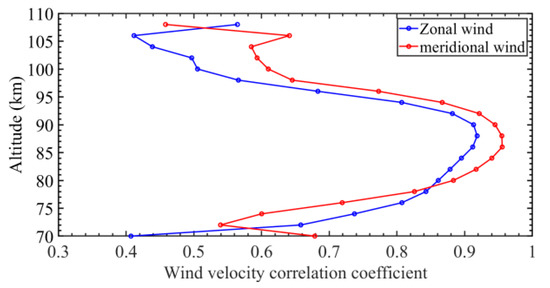
Figure 7.
The correlation coefficients of meridional and zonal winds observed by two meteor radars (the blue line shows the correlation coefficient of zonal wind, and the red line shows that of meridional wind).
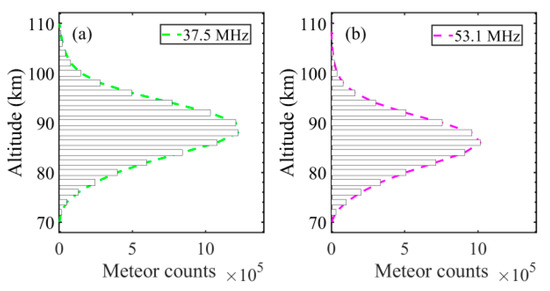
Figure 8.
Histogram statistical results of meteor counts varying with altitude observed by two meteor radars (a,b).

Table 2.
The relative errors of meridional and zonal winds at all levels.
The mean values and standard deviations of the meridional and zonal wind differences are further calculated in Figure 9. It is estimated that the average differences in meridional and zonal winds between the two meteor radars are approximately less than 5 m/s. The standard deviations (error bars in Figure 9) of the meridional and zonal winds decrease with the increase in the meteor counts detected by the two radars, which further indicates that the system errors of meridional and zonal winds related to the meteor count decrease with the increase in the meteor count.

Figure 9.
Mean values and standard deviations of meridional and zonal wind differences between the two meteor radars (standard deviations are represented by the error bars).
4. Conclusions
Based on the observations of two all-sky meteor radars with different operating frequencies at the same station during the period from 1 November 2013 to 31 December 2014, the influence of the meteor count on the wind fields of the two meteor radars was analyzed. The results are as follows: First, the meteor counts detected by the two meteor radars at the Kunming station are approximately 100–3000 per hour, and the meteor count detected by the 37.5 MHz meteor radar is more than that detected by the 53.1 MHz meteor radar. The meteor counts detected by both vary according to the local time and altitude. The maximum meteor counts are detected from 09 UTC to 15 UTC and the minimum meteor counts are detected from 20 UTC to 02 UTC. The maximum meteor counts are detected from 82 km to 96 km, while the minimum meteor counts are detected below 82 km or above 96 km. Second, the smaller the meteors detected by the two radars, the greater the wind field difference retrieved by the two radars. The more meteors detected, the smaller the difference, and the closer the wind field is to the true average wind field. Third, the correlation coefficients of the wind fields observed by the two radars are higher than 0.8 in the altitude range of 78–94 km, especially when the meteor counts detected by the two radars reach the maximum. The correlation coefficients of the wind fields are greater than 0.9 because enough meteors can be detected in this altitude range, which ensures that relatively more accurate wind fields are obtained. At other altitudes, due to the small meteor counts detected, the correlation coefficients of wind fields are relatively low. In particular, the correlation coefficients are smallest above 100 km or below 74 km, ranging from 0.4 to 0.6, indicating that the errors of the wind fields retrieved by the two radars are the largest. Fourth, the performance of the two radars is basically identical in all aspects except for the different meteor counts detected due to the different working frequencies. Therefore, the meteor counts are the main system errors of wind fields retrieved by two radars, and the errors can be determined by the correlation coefficients of the wind fields. Finally, the mean values of the wind field differences are less than 5 m/s. The standard deviations of the wind field differences range from 30 to 60 m/s.
Author Contributions
Conceptualization, X.H.; methodology, Z.D.; processing data, X.H.; formal analysis, Y.M.; resources, N.L. and J.C.; writing—review and editing, L.W.; supervision, X.H. All authors have read and agreed to the published version of the manuscript.
Funding
This research was funded by the National Key Laboratory of Electromagnetic Environment, grant number 6142403190108.
Institutional Review Board Statement
Not applicable.
Informed Consent Statement
Not applicable.
Data Availability Statement
The data used in this study are available from the corresponding author (X.Hao: haoxj22s@163.com).
Conflicts of Interest
The authors declare no conflict of interest.
References
- Forbes, J.M.; Garrett, H.B. Theoretical studies of atmospheric tides. Rev. Geophys. Space Phys. 1979, 17, 1951–1981. [Google Scholar] [CrossRef]
- Fritts, D.C.; Alexander, M.J. Gravity wave dynamics and effects in the middle atmosphere. Rev. Geophys. 2003, 41, 1003. [Google Scholar] [CrossRef]
- Wang, J.; Yi, W.; Wu, J.; Chen, T.; Xue, X.; Zeng, J.; Vincent, R.A.; Reid, I.M.; Batista, P.P.; Buriti, R.A.; et al. Coordinated observations of migrating tides by multiple meteor radars in the equatorial mesosphere and lower thermosphere. J. Geophys. Res. Space Phys. 2022, 127, e2022JA030678. [Google Scholar] [CrossRef]
- Yang, C.; Lai, D.; Yi, W.; Wu, J.; Xue, X.; Li, T.; Chen, T.; Dou, X. Observed Quasi 16-Day Wave by Meteor Radar over 9 Years at Mengcheng (33.4° N, 116.5° E) and Comparison with the Whole Atmosphere Community Climate Model Simulation. Remote Sens. 2023, 15, 830. [Google Scholar] [CrossRef]
- Lei, J.; Thayer, J.P.; Burns, A.G.; Lu, G.; Deng, Y. Wind and temperature effects on thermosphere mass density response to the November 2004 geomagnetic storm. J. Geophys. Res. 2010, 115, A05303. [Google Scholar] [CrossRef]
- Daae, M.; Espy, P.; Tyssøy, N.; Newnham, D.; Stadsnes, J.; Søraas, F. The effect of energetic electron precipitation on middle mesospheric night-time ozone during and after a moderate geomagnetic storm. Geophys. Res. Lett. 2012, 39, L21811. [Google Scholar] [CrossRef]
- Xu, J.; Wang, W.; Zhang, S.; Liu, X.; Yuan, W. Multiday thermospheric density oscillations associated with variations in solar radiation and geomagnetic activity. J. Geophys. Res. Space Physics. 2015, 120, 3829–3846. [Google Scholar] [CrossRef]
- Yuan, T.; Zhang, Y.; Cai, X.; She, C.; Paxton, L.J. Impacts of CME induced geomagnetic storms on the midlatitude mesosphere and lower thermosphere observed by a sodium lidar and TIMED/GUVI. Geophys. Res. Lett. 2015, 42, 7295–7302. [Google Scholar] [CrossRef]
- Yi, W.; Reid, I.M.; Xue, X.H.; Younger, J.P.; Murphy, D.J.; Chen, T.; Dou, X. Response of neutral mesospheric density to geomagnetic forcing. Geophys. Res. Lett. 2017, 44, 8647–8655. [Google Scholar] [CrossRef]
- Yi, W.; Reid, I.M.; Xue, X.H.; Murphy, D.J.; Hall, C.M.; Tsutsumi, M.; Ning, B.; Li, G.; Younger, J.P.; Chen, T.; et al. High- and middle-latitude neutral mesospheric density response to geomagnetic storms. Geophys. Res. Lett. 2018, 45, 436–444. [Google Scholar] [CrossRef]
- Yi, W.; Reid, I.M.; Xue, X.H.; Murphy, D.J.; Vincent, R.A.; Zou, Z.; Chen, T.; Wang, G.; Dou, X. First observations of Antarctic mesospheric tidal wind responses to recurrent geomagnetic activity. Geophys. Res. Lett. 2021, 48, e2020GL089957. [Google Scholar] [CrossRef]
- Zou, Z.C.; Xue, X.H.; Yi, W.; Shen, C.; Yang, C.; Tang, Y.; Chen, T.; Dou, X. Response of the high-latitude upper mesosphere to energetic electron precipitation. Astrophys. J. 2020, 893, 55. [Google Scholar] [CrossRef]
- Jiang, G.Y.; Xu, J.Y.; Shi, J.; Yang, G.; Wang, X.; Yan, C. The first observation of the atmospheric tides in the mesosphere and lower thermosphere over Hainan, China. Chin. Sci. Bull. 2010, 55, 1059–1066. [Google Scholar] [CrossRef]
- Yi, W.; Reid, I.M.; Xue, X.H.; Younger, J.P.; Spargo, A.J.; Murphy, D.J.; Chen, T.; Dou, X. First observation of mesosphere response to the solar wind high-speed streams. J. Geophys. Res. Space Phys. 2017, 122, 9080–9088. [Google Scholar] [CrossRef]
- Li, N.; Lei, J.; Huang, F.; Yi, W.; Chen, J.; Xue, X.; Gu, S.; Luan, X.; Zhong, J.; Liu, F.; et al. Responses of the ionosphere and neutral winds in the mesosphere and lower thermosphere in the Asian-Australian sector to the 2019 southern hemisphere sudden stratospheric warming. J. Geophys. Res. Space Phys. 2021, 126, e2020JA028653. [Google Scholar] [CrossRef]
- Robenson, D.S.; Liddy, D.T.; Elford, W.G. Measurements of winds in the upper atmosphere by means of drifting meteor trail. J. Atmos. Terr. Phys. 1953, 4, 255–270. [Google Scholar] [CrossRef]
- Charuvil Asokan, H.; Chau, J.L.; Larsen, M.F.; Conte, J.F.; Marino, R.; Vierinen, J.; Baumgarten, G.; Borchert, S. Validation of multistatic meteor radar analysis using modeled mesospheric dynamics: An assessment of the reliability of gradients and vertical velocities. J. Geophys. Res. Atmos. 2022, 127, e2021JD036039. [Google Scholar] [CrossRef]
- Cervera, M.A.; Reid, I.M. Comparison of simultaneous wind measurements using collocate VHF meteor radar and MF spaced antenna radar systems. Radio Sci. 1995, 30, 1245–1261. [Google Scholar] [CrossRef]
- Jones, G.O.L.; Berkey, F.T.; Fish, C.S.; Hocking, W.K.; Taylor, M.J. Validation of imaging Doppler interferometer winds using meteor radar. Geophys. Res. Lett. 2003, 30, 1743. [Google Scholar] [CrossRef]
- Kumar, K.K.; Ramkumar, G.; Shelbi, S.T. Initial results from SKiYMET meteor radar at Thumba (8.5° N, 77° E): 1. Comparison of wind measurements with MF spaced antenna radar system. Radio Sci. 2007, 42, RS6008. [Google Scholar] [CrossRef]
- Sharma, A.K.; Rokade, M.V.; Rao, R.K.; Gurubaran, S.; Patil, P.T. Comparative study of MLT mean winds using MF radars located at 16.8° N and 8.7° N. J. Earth Syst. Sci. 2010, 119, 461–470. [Google Scholar] [CrossRef]
- Rao, S.V.B.; Eswaraiah, S.; Ratnam, M.V.; Kosalendra, E.; Kumar, K.K.; Kumar, S.S.; Patil, P.T.; Gurubaran, S. Advanced meteor radar installed at tirupati: System details and comparison with different radars. J. Geophys. Res. Atmos. 2014, 119, 893–904. [Google Scholar] [CrossRef]
- Yu, T.; Xia, C.L.; Zuo, X.M.; Huang, C.; Mao, T.; Liu, L.; Liu, Z. A comparison of mesospheric and low-thermospheric winds measured by Fabry-Perot interferometer and meteor radar over central China. J. Geophys. Res. Space Phys. 2016, 121, 10037–10051. [Google Scholar] [CrossRef]
- Yu, T.; Zuo, X.M.; Xia, C.L.; Li, M.; Huang, C.; Mao, T.; Zhang, X.; Zhao, B.; Liu, L. Peak height of OH airglow derived from simultaneous observations a Fabry-Perot interferometer and a meteor radar. J. Geophys. Res. Space Phys. 2017, 122, 628–637. [Google Scholar] [CrossRef]
- Lee, W.; Kim, Y.H.; Lee, C.; Wu, Q. First comparison of mesospheric winds measured with a fabry-perot interferometer and meteor radar at the King Sejong Station (62.2° S, 58.8° W). J. Astron. Space Sci. 2018, 35, 235–242. [Google Scholar]
- Lee, C.; Jee, G.; Kam, H.; Wu, Q.; Ham, Y.-B.; Kim, Y.H.; Kim, J.-H. A Comparison of Fabry-Perot interferometer and meteor radar wind measurements near the polar mesopause region. Geophys. Res. Space Phys. 2021, 126, e2020JA028802. [Google Scholar] [CrossRef]
- He, Y.; Zhu, X.; Sheng, Z.; He, M.; Feng, Y. Observations of Inertia gravity waves in the western pacific and their characteristic in the 2015/2016 quasi-biennial oscillation disruption. J. Geophys. Res. Atmos. 2022, 127, e2022JD037208. [Google Scholar] [CrossRef]
- Jiang, G.Y.; Xu, J.Y.; Yuan, W.; Ning, B.; Wan, W.; Hu, L. A comparison of mesospheric winds measured by FPI and meteor radar located at 40N. Sci. China Technol. Sci. 2012, 55, 1245–1250. [Google Scholar] [CrossRef]
- Gu, S.Y.; Li, T.; Liu, A.; Swenson, G.; Gardner, C.; Riggin, D.; Fritts, D. Comparison of the simultaneous horizontal wind obervations by Na lidar, meteor radar and medium frequency radar. Chin. J. Quantum Electron. 2013, 30, 7–11. [Google Scholar]
- Fang, X.; Gu, S.Y.; Ban, C.; Li, T.; Xiong, J.G.; Ning, B.Q.; Dou, X.K.; Wang, N.N. Horizontal wind comparison between sodium temperature/wind lidar over Hefei and meteor radar over Wuhan. Chin. J. Quantum Electron. 2013, 30, 12–16. [Google Scholar]
- Zhou, B.Z.; Chen, J.S.; Li, Q.L. A new method of measuring neutral atmospheric density in upper mesosphere. Chin. J. Radio Sci. 2017, 32, 687–693. [Google Scholar]
- Zeng, J.; Yi, W.; Xue, X.H.; Reid, I.; Hao, X.; Li, N.; Chen, J.; Chen, T.; Dou, X. Comparison between the Mesospheric Winds Observed by Two Collocated Meteor Radars at Low Latitudes. Remote Sens. 2022, 14, 2354. [Google Scholar] [CrossRef]
- Yi, W.; Xue, X.H.; Chen, J.S.; Dou, X.; Chen, T.; Li, N. Estimation of mesopause temperatures at low latitudes using the Kunming meteor radar. Radio Sci. 2016, 51, 130–141. [Google Scholar] [CrossRef]
- Yi, W.; Xue, X.H.; Reid, I.M.; Younger, J.P.; Chen, J.; Chen, T.; Li, N. Estimation of mesospheric densities at low latitudes using the Kunming meteor radar together with SABER temperatures. J. Geophys. Res. Space Phys. 2018, 23, 3183–3195. [Google Scholar] [CrossRef]
- Yi, W.; Xue, X.H.; Chen, J.S.; Chen, T.; Li, N. Quasi-90-day oscillation observed in the MLT region at low latitudes from the Kunming meteor radar and SABER. Earth Planet. Phys. 2019, 3, 136–146. [Google Scholar] [CrossRef]
- Holdsworth, D.A.; Reid, I.M.; Cervera, M.A. Buckland Park all-sky interferometric meteor radar. Radio Sci. 2004, 39, RS5009. [Google Scholar] [CrossRef]
- Hocking, W.K.; Fuller, B.; Vandepeer, B. Real-time determination of meteor-related parameters utilizing modem digital technology. J. Atmos. Sol.-Terr. Phys. 2001, 63, 155–169. [Google Scholar] [CrossRef]
- Kim, J.H.; Kim, Y.H.; Lee, C.S.; Jee, G. Seasonal variation of meteor decay times observed at King Sejong Station (62.22° S, 58.78° W), Antarctica. J. Atmos. Sol. Terr. Phys. 2010, 72, 883–889. [Google Scholar] [CrossRef]
- Kim, J.H.; Kim, Y.H.; Jee, G.; Lee, C. Mesospheric temperature estimation from meteor decay times of weak and strong meteor trails. J. Atmos. Sol. Terr. Phys. 2012, 89, 18–26. [Google Scholar] [CrossRef]
Disclaimer/Publisher’s Note: The statements, opinions and data contained in all publications are solely those of the individual author(s) and contributor(s) and not of MDPI and/or the editor(s). MDPI and/or the editor(s) disclaim responsibility for any injury to people or property resulting from any ideas, methods, instructions or products referred to in the content. |
© 2023 by the authors. Licensee MDPI, Basel, Switzerland. This article is an open access article distributed under the terms and conditions of the Creative Commons Attribution (CC BY) license (https://creativecommons.org/licenses/by/4.0/).