1. Introduction
In 2023, the Intergovernmental Panel on Climate Change (IPCC) released the
AR6 Synthesis Report: Climate Change 2023. The report clearly points out that greenhouse gas emissions from human activities cause global warming. Global warming has led to more frequent and intense extreme weather events in recent years, posing increasingly dangerous impacts on the global ecosystem and humanity [
1]. Therefore, humans must take proactive and reasonable measures to mitigate the losses caused by climate hazards, importantly including the usage of green renewable energies. The active development and usage of green renewable energies have become the key focus for countries to break away from the dependence on fossil energy. Among numerous renewable energy sources, solar energy has developed particularly rapidly. Solar energy generation systems include two types: photovoltaic power (PV) generation and concentrating solar power (CSP) generation. CSP generation has gradually become favored owing to its strong thermal storage and electricity peak-shaving capabilities [
2].
Solar radiation is the fuel for CSP generation. As solar radiation passes from the atmosphere to the ground, it is affected by aerosol scattering and absorption as well as molecules and gases [
3,
4]. The degrees of light scattering and absorption by aerosol particles are critical in affecting the amount of solar radiation that reaches the ground [
5]. Light-absorbing aerosol particles (such as black carbon, organic aerosols, and desert dust) play an important role in contributing to solar radiation absorption and climate change [
6]. Aerosol particles reduce the direct normal irradiance (DNI) of the solar radiation reaching power plants’ concentrating solar fields, thereby affecting the efficiency of solar thermal power generation [
7,
8]. Carroll et al. reported that aerosols in the California region of the United States could reduce the amount of solar radiation reaching the ground by 7–25% [
9]. Xia et al. conducted a study on the impact of aerosols on the amount of solar radiation reaching the ground in China, and the results showed that the annual mean variation in the direct irradiance caused by aerosols was −89.6 W/m
2 [
10]. Nikitidou et al. evaluated the impact of changes in the aerosol optical depth (AOD) on the DNI in the European region and found that the DNI attenuation due to aerosols ranged from 20% to 45% [
11]. Sengupta et al. found that for tower-based CSP systems, the optical losses caused by the aerosol-particle-induced attenuation of the solar radiation reaching the concentrating solar field exceeded 10% [
12]. Hanrieder et al. found that tower-based CSP plants exhibited significant power losses due to the atmospheric scattering and absorption of solar radiation and that the power losses of tower-based CSP plants were related to local atmospheric conditions, especially atmospheric aerosols and water vapor [
13].
CSP plants in China are usually built in arid or desert regions and, thus, are often accompanied by problems caused by sand and desert dust. Dust, as a type of aerosol, can severely attenuate and weaken solar energy, thereby reducing the amount of solar radiation reaching the ground [
14]. At the same time, atmospheric dust can greatly reduce the atmospheric visibility, leading to a decrease in the atmospheric transmission efficiency of concentrating solar field [
15] and, thus, resulting in a loss of optical efficiency in the concentrating solar field, which reduces the power generation efficiency of CSP plants. In addition, dust can adhere to reflectors, reducing their reflectivity and solar energy conversion rates [
16] and increasing cleaning and maintenance costs, thereby increasing the cost of power generation. Raillani et al. reported that suspended aerosol particles in the CSP plant area in Morocco severely affected the DNI and that the aerosol optical depth (AOD) in the CSP plant area was inversely proportional to the reflectivity of the reflectors in the concentrating solar field [
8]. Moreover, the settling of aerosol particles reduces the reflectivity of reflectors. Guan et al. reported that for the CSP plant in the desert area of Australia, the reflectivity of the heliostat decreased sharply from 93% to 20% in one month without cleaning [
17]. Sansom et al. reported that the loss of reflectivity caused by the adhesion of aerosol particles reached 23% in Libya and Egypt [
18].
The aerosol optical depth (AOD) is a key indicator for measuring the degree of light attenuation by aerosols, an important physical quantity for characterizing atmospheric turbidity, and a significant parameter for measuring aerosol characteristics [
19]. In dry climate environments, such as desert dust, the AOD can directly affect the variation in the DNI [
20]. The water vapor in the atmosphere also affects the DNI, but its impact is minimal in dry regions [
21]; therefore, this effect is not discussed herein. In clear-sky models, the AOD is a key parameter for predicting the DNI [
22]. The AOD is also one of the input parameters for the extinction model in tower-based CSP plants [
23]. Therefore, monitoring and analyzing the changes in and characteristics of the AOD above CSP plants are of great significance for evaluating the power generation efficiency, plant power changes, power generation prediction, attenuation rate of the heliostat reflectivity, and rational allocation of electricity to the grid.
Remote sensing techniques provide an important means to acquire the spatial and temporal distributions of the AOD. The Moderate Resolution Imaging Spectroradiometer (MODIS) [
24], Cloud-Aerosol Lidar with Orthogonal Polarization (CALIOP) [
25,
26], Advanced Himawari Imager (AHI) [
27,
28], Spinning Enhanced Visible and Infrared Imagers (SEVIRI) [
29,
30], Polarization and Directionality of Earth’s Reflectances (POLDER)/Polarization and Anisotropy of Reflectances for Atmospheric Sciences coupled with Observations from a Lidar (PARASOL) [
31], and Multi-Angle Imaging Spectroradiometer (MISR) [
32] as the key satellite observation platforms, have been widely used to obtain AOD products. Reanalysis datasets assimilated ground observations and satellite remote sensing data, such as Modern-Era Retrospective analysis for Research and Applications Version 2 (MERRA-2) [
33,
34], Monitoring Atmospheric Composition and Climate Reanalysis (MACCRA) [
35], and Copernicus Atmosphere Monitoring Service (CAMS) [
36], can provide data products for AOD information. Their accuracy and reliability have been well validated by these studies.
In the last two years, China has issued a series of policies to support the development of the CSP generation industry. CSP generation has ushered in a new period of vigorous development [
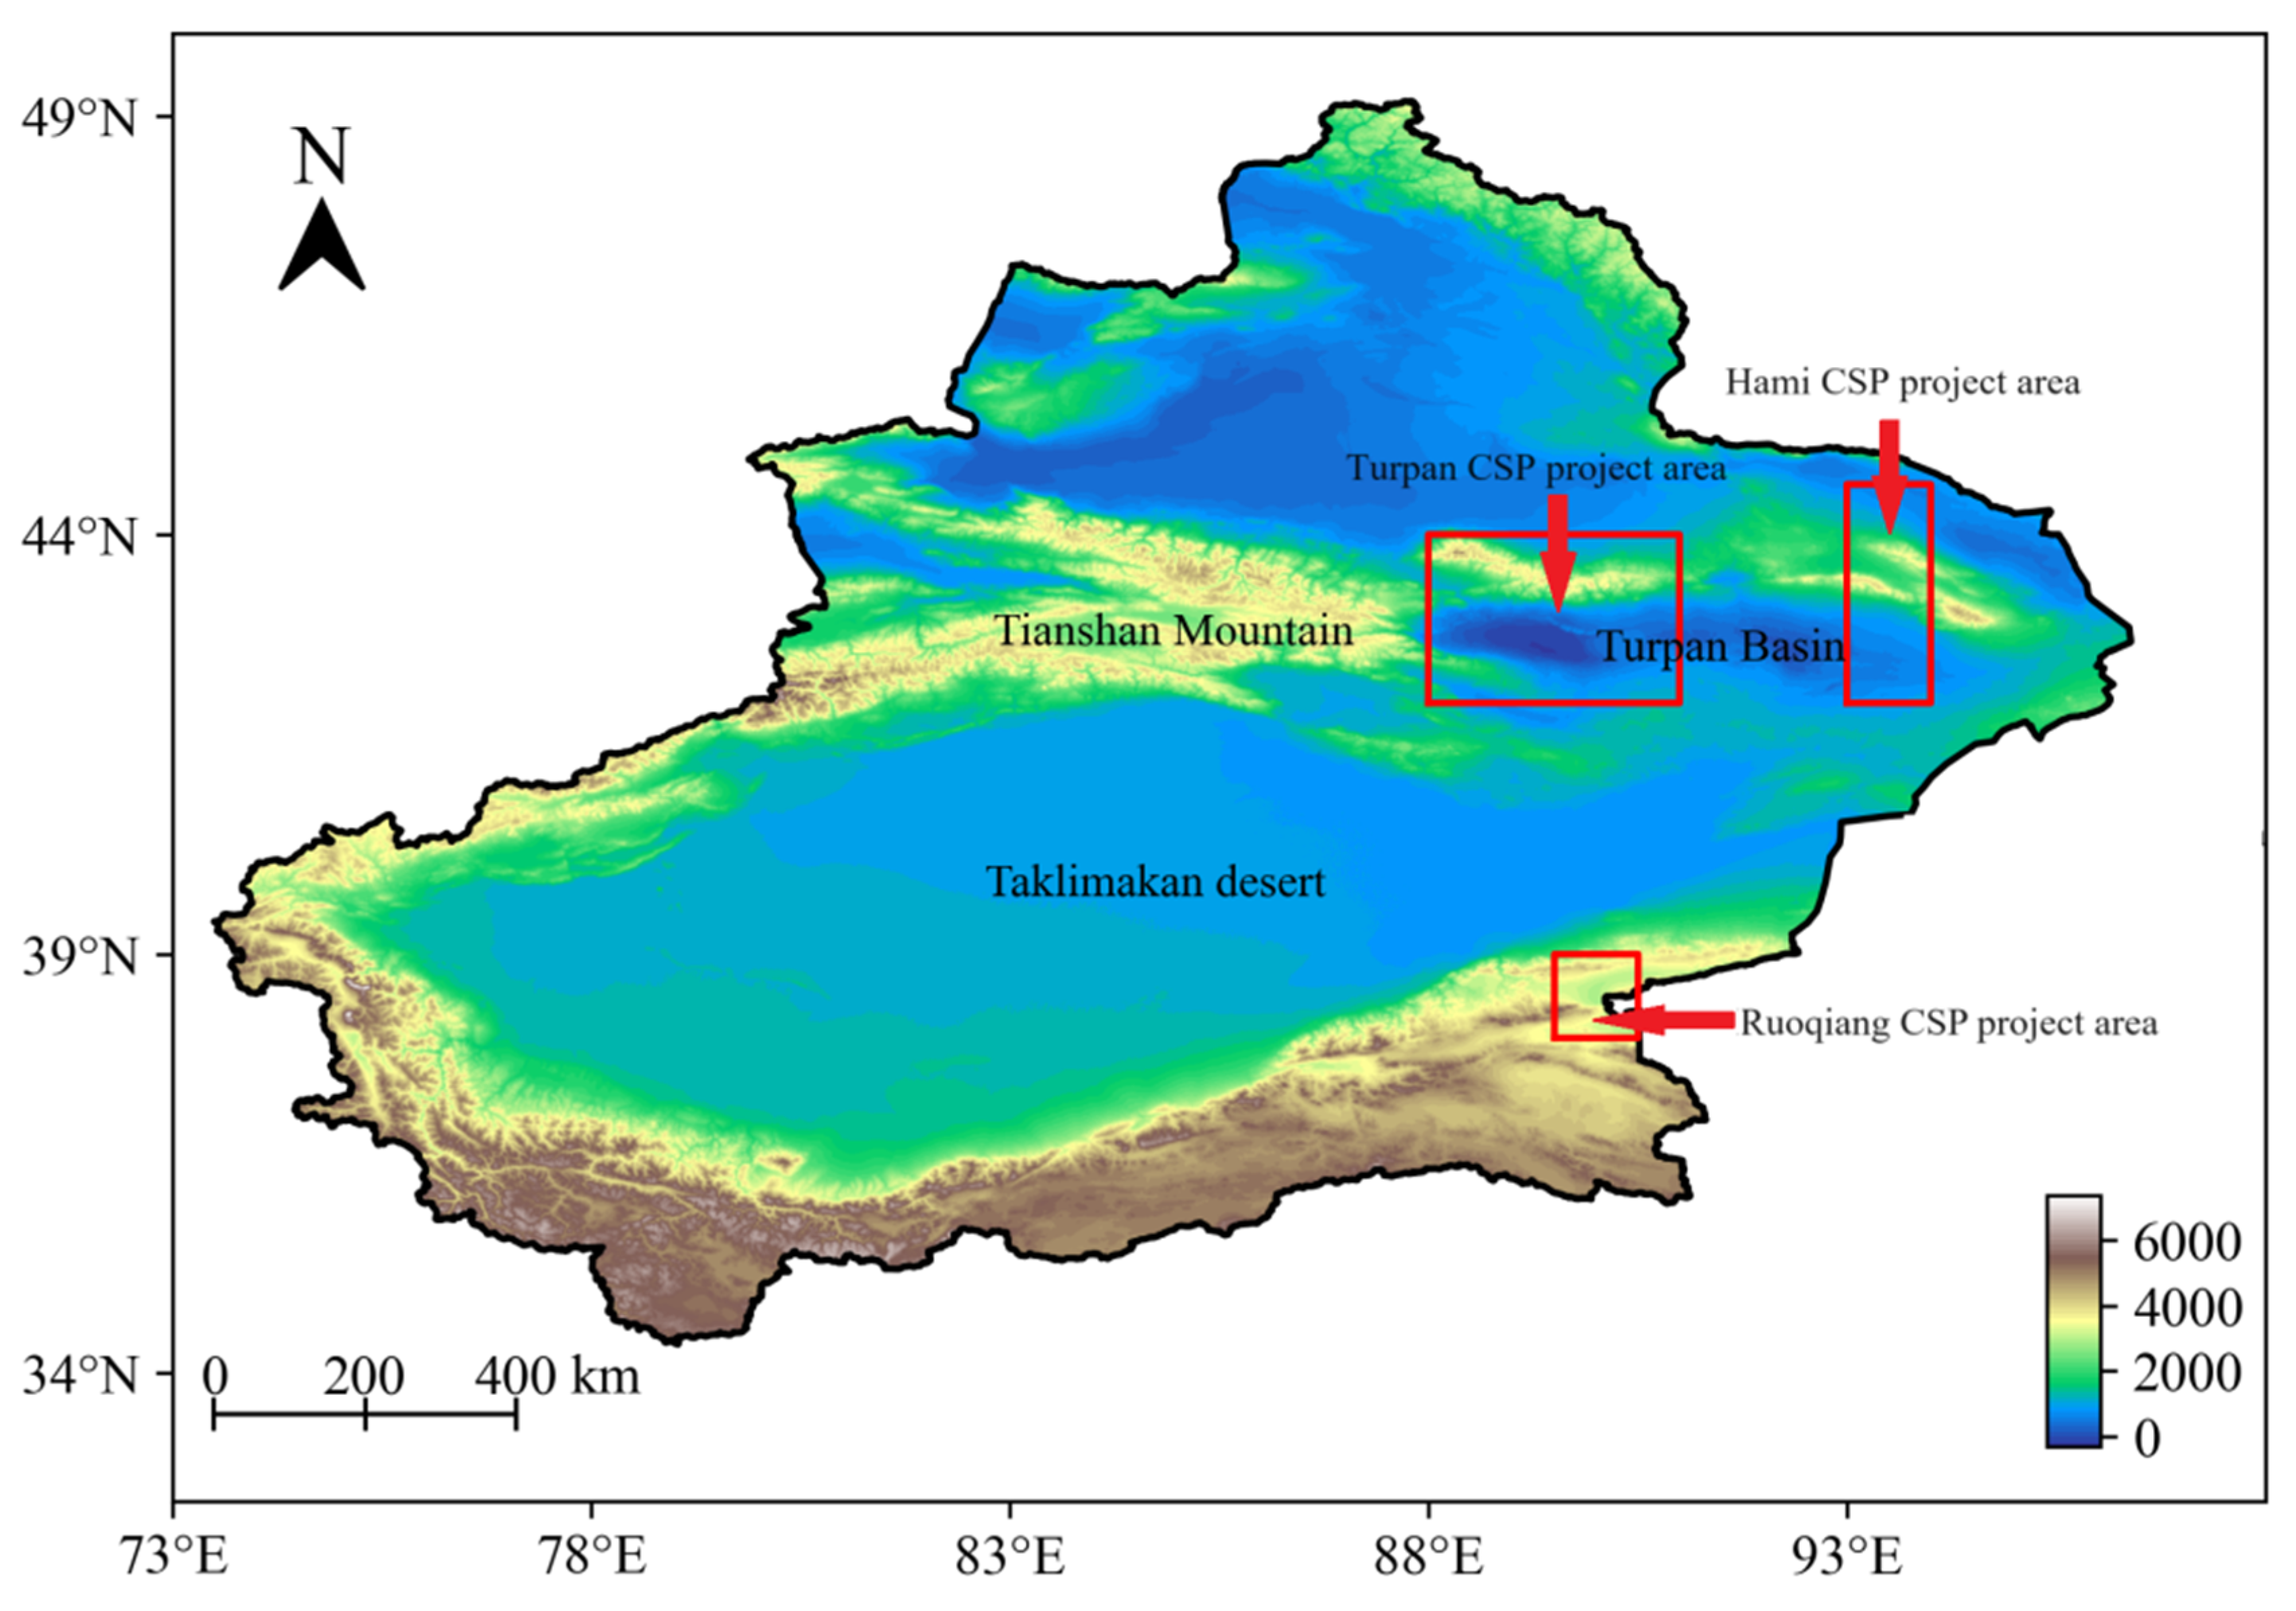
37]. According to the “14th five-year” plan for renewable energy development, China will build long-term thermal storage solar thermal power generation projects in solar energy resource-rich areas, such as Qinghai, Xinjiang, and Inner Mongolia, until 2025. Among them, Xinjiang has planned 13 CSP plant projects, the highest number among all the provinces, and all of them will be built within five years. These 13 projects are mainly distributed in Hami, Turpan, Bazhou Ruoqiang (Ruoqiang), Changji Prefecture, and Bortala Mongol Autonomous Prefecture. The four projects in Hami, four projects in Turpan, and two projects in Ruoqiang account for more than 80% of all the planned projects. Moreover, the three regions of Hami, Turpan, and Ruoqiang have the best solar resource conditions in Xinjiang, with a direct normal irradiation above 1700 KWh/m
2. Hami has a direct normal irradiation above 1800 KWh/m
2, which is the best solar resource area in Xinjiang. Therefore, Hami, Turpan, and Ruoqiang were selected as the research areas to study the long-term AOD changes and analyze, for the first time, the actual aerosol conditions over three major CSP plant areas in Xinjiang, China.
Although 13 CSP projects will be built in Xinjiang, China within five years, the details of the aerosol features and conditions have not been reported thus far for these project areas. Therefore, this paper is the first to report the variation in aerosol conditions at CSP project sites in Xinjiang, China based on 43 years of data. The aim of the paper is to analyze and study the long-term monthly, seasonal, and annual temporal and spatial variations in the AODs and dust AODs of three major CSP project areas (Hami, Turpan, and Ruoqiang) in Xinjiang, China to offer a better understanding of the characteristics, distributions, and trends of aerosol conditions in the study regions. The results reported in the current paper will promote a deeper understanding of the AOD and dust AOD condition details in the Hami, Turpan, and Ruoqiang CSP project areas. This study provides a reference for indicating whether environmental changes are favorable or unfavorable for the operation of CSP plants in these three regions. The study of the aerosol conditions will help to reduce extra costs and optimize the performance of CSP plants in these three regions. Our study also provides technical support and a reference for solar resource assessment, reflector reflectivity evaluation, and cleaning strategies for solar fields in these regions. Additionally, our study of long-term AOD variations can improve the accuracy of DNI prediction in these three CSP project areas, thereby enhancing the assessment of power generation, power plant operation, and grid optimization. Furthermore, the characteristics of the dust aerosols in the three regions were investigated, laying the foundation for further research on the relationship between dust aerosols and DNI attenuation, as well as the relationship between dust aerosols and the decline in heliostat’s reflectivity in these CSP plant areas.
The paper is organized as follows. In
Section 2, the project areas are introduced.
Section 3 presents the details of the datasets and method. In
Section 4, the monthly, seasonal, and annual variations in the AOD and the dust aerosol situations are reported and discussed. Finally, the paper is concluded in
Section 5.
3. Research Datasets and Method
The datasets were obtained from the MERRA-2 of the National Aeronautics and Space Administration (NASA). The MERRA-2 assimilation system is based on the fifth-generation Goddard Earth Observing System model (GEOS-5) [
33,
34,
39]. The model is coupled with the chemical module—Goddard Chemistry Aerosol Radiation and Transport (GOCART)—to simulate five types of aerosols (black carbon, organic carbon, dust, sulfates, and sea salt) [
40]. Aerosol data from the Aerosol Robotic Network (AERONET), the Advanced Very High-Resolution Radiometer (AVHRR), the Multiangle Imaging Spectroradiometer (MISR), and the MODIS were integrated into the MERRA-2 system. The main aerosol optical properties provided by MERRA-2 include the aerosol optical depth (AOD) at 550 nm, aerosol Angstrom exponent at 470–870 nm, as well as the mass densities and Angstrom exponents for black carbon, dust, organic carbon, sulfate, and sea salt aerosols [
41] (
https://disc.gsfc.nasa.gov/datasets?project=MERRA-2, last accessed on 3 July 2023).
The spatial resolution of MERRA-2 data is 0.625° × 0.5°, with three temporal resolutions: hourly, every three hours, and monthly. In the vertical direction, MERRA-2 is divided into 72 layers from the surface to the highest pressure of 0.01 hPa. This study uses the monthly mean total AOD at 550 nm (hereafter, AOD) and the dust aerosol optical depth (DAOD) in the Xinjiang Hami, Turpan, and Ruoqiang CSP project areas in China from 1980 to 2022.
Previous studies have validated the availability and accuracy of MERRA-2 aerosol datasets using ground-based observations in China. Sun et al. compared 4258 AOD values from MERRA-2 data collected at 12 AERONET stations in China in the four seasons and found that the correlation coefficient ranged from 0.87 to 0.92 [
42]. Pang compared the AOD data from MERRA-2 in China from 2000 to 2018 with AOD data from 19 AERONET stations and found that the correlation coefficient between the two datasets was 0.82, confirming that MERRA-2’s AOD data are generally practical in China [
43]. Zhang et al. compared the AOD data from Himawari-8, MERRA-2, and CAMS with ground-based AERONET AOD data from 2015 to 2017 and found that in northern and western China, the correlation between MERRA-2’s AOD product and the AOD data from ground-based stations was 0.74 and that MERRA-2’s AOD values were more accurate [
44]. Ou et al. compared MERRA-2 AOD data from 12 regions in China from 2011 to 2013 with ground-based AOD data from the Sun sky radiometer Observation Network (SONET) and calculated a correlation coefficient of 0.634–0.822, indicating good consistency between MERRA-2’s AOD data and the ground-based AOD data [
45]. Wang et al. reported good consistency between MERRA-2 AOD and AERONET measurements in the China area, with a correlation coefficient of 0.73 and a root-mean-square error of 0.16 [
46]. In conclusion, MERRA-2’s AOD data product is highly applicable in China and can be used for aerosol research in the Xinjiang region. Therefore, the comparison of MERRA-2-derived AOD data and ground-based observation-derived AOD data is not repeated in the paper.
CSP generation mainly relies on direct solar radiation; hence, in analyzing seasonal and monthly variations, we use daytime AOD values (between sunrise and sunset) to study the impact of the local AOD on CSP plants more accurately. MERRA-2 AOD values are recorded and stored in Coordinated Universal Time (UTC). The three CSP project areas are all in UTC+6. Local sunrise and sunset times can be found on the website (
https://richurimo.bmcx.com, last accessed on 3 July 2023), and the displayed time is Beijing Time (BJT = UTC + 8). Therefore, the AOD data used for the monthly and seasonal variations in this study are uniformly selected according to Beijing Time. To obtain more accurate research results, AOD data were selected based on different seasons. The seasons were defined as follows: spring, including March, April, and May; summer, including June, July, and August; autumn, including September, October, and November; winter, including December, January, and February. The time intervals for selecting MERRA-2 AOD data are shown in
Table 2 below. Because the three study regions are in the same time zone, there are no obvious sunrise and sunset time differences among them. Therefore, the time interval of the sunrise and sunset for daytime AOD selection is the same in the paper.
Based on the latitude and longitude ranges of the three CSP project areas given in
Table 1, the monthly mean hourly AOD data of all the points within the latitude and longitude ranges are selected. Then, the average value of these points is calculated as the AOD monthly mean hourly data for each project area. In addition, to study the impact of the dust proportion on the CSP plants in the three areas, we obtained the ratio of DAOD to AOD to analyze the proportions of dust in the aerosols.
4. Results
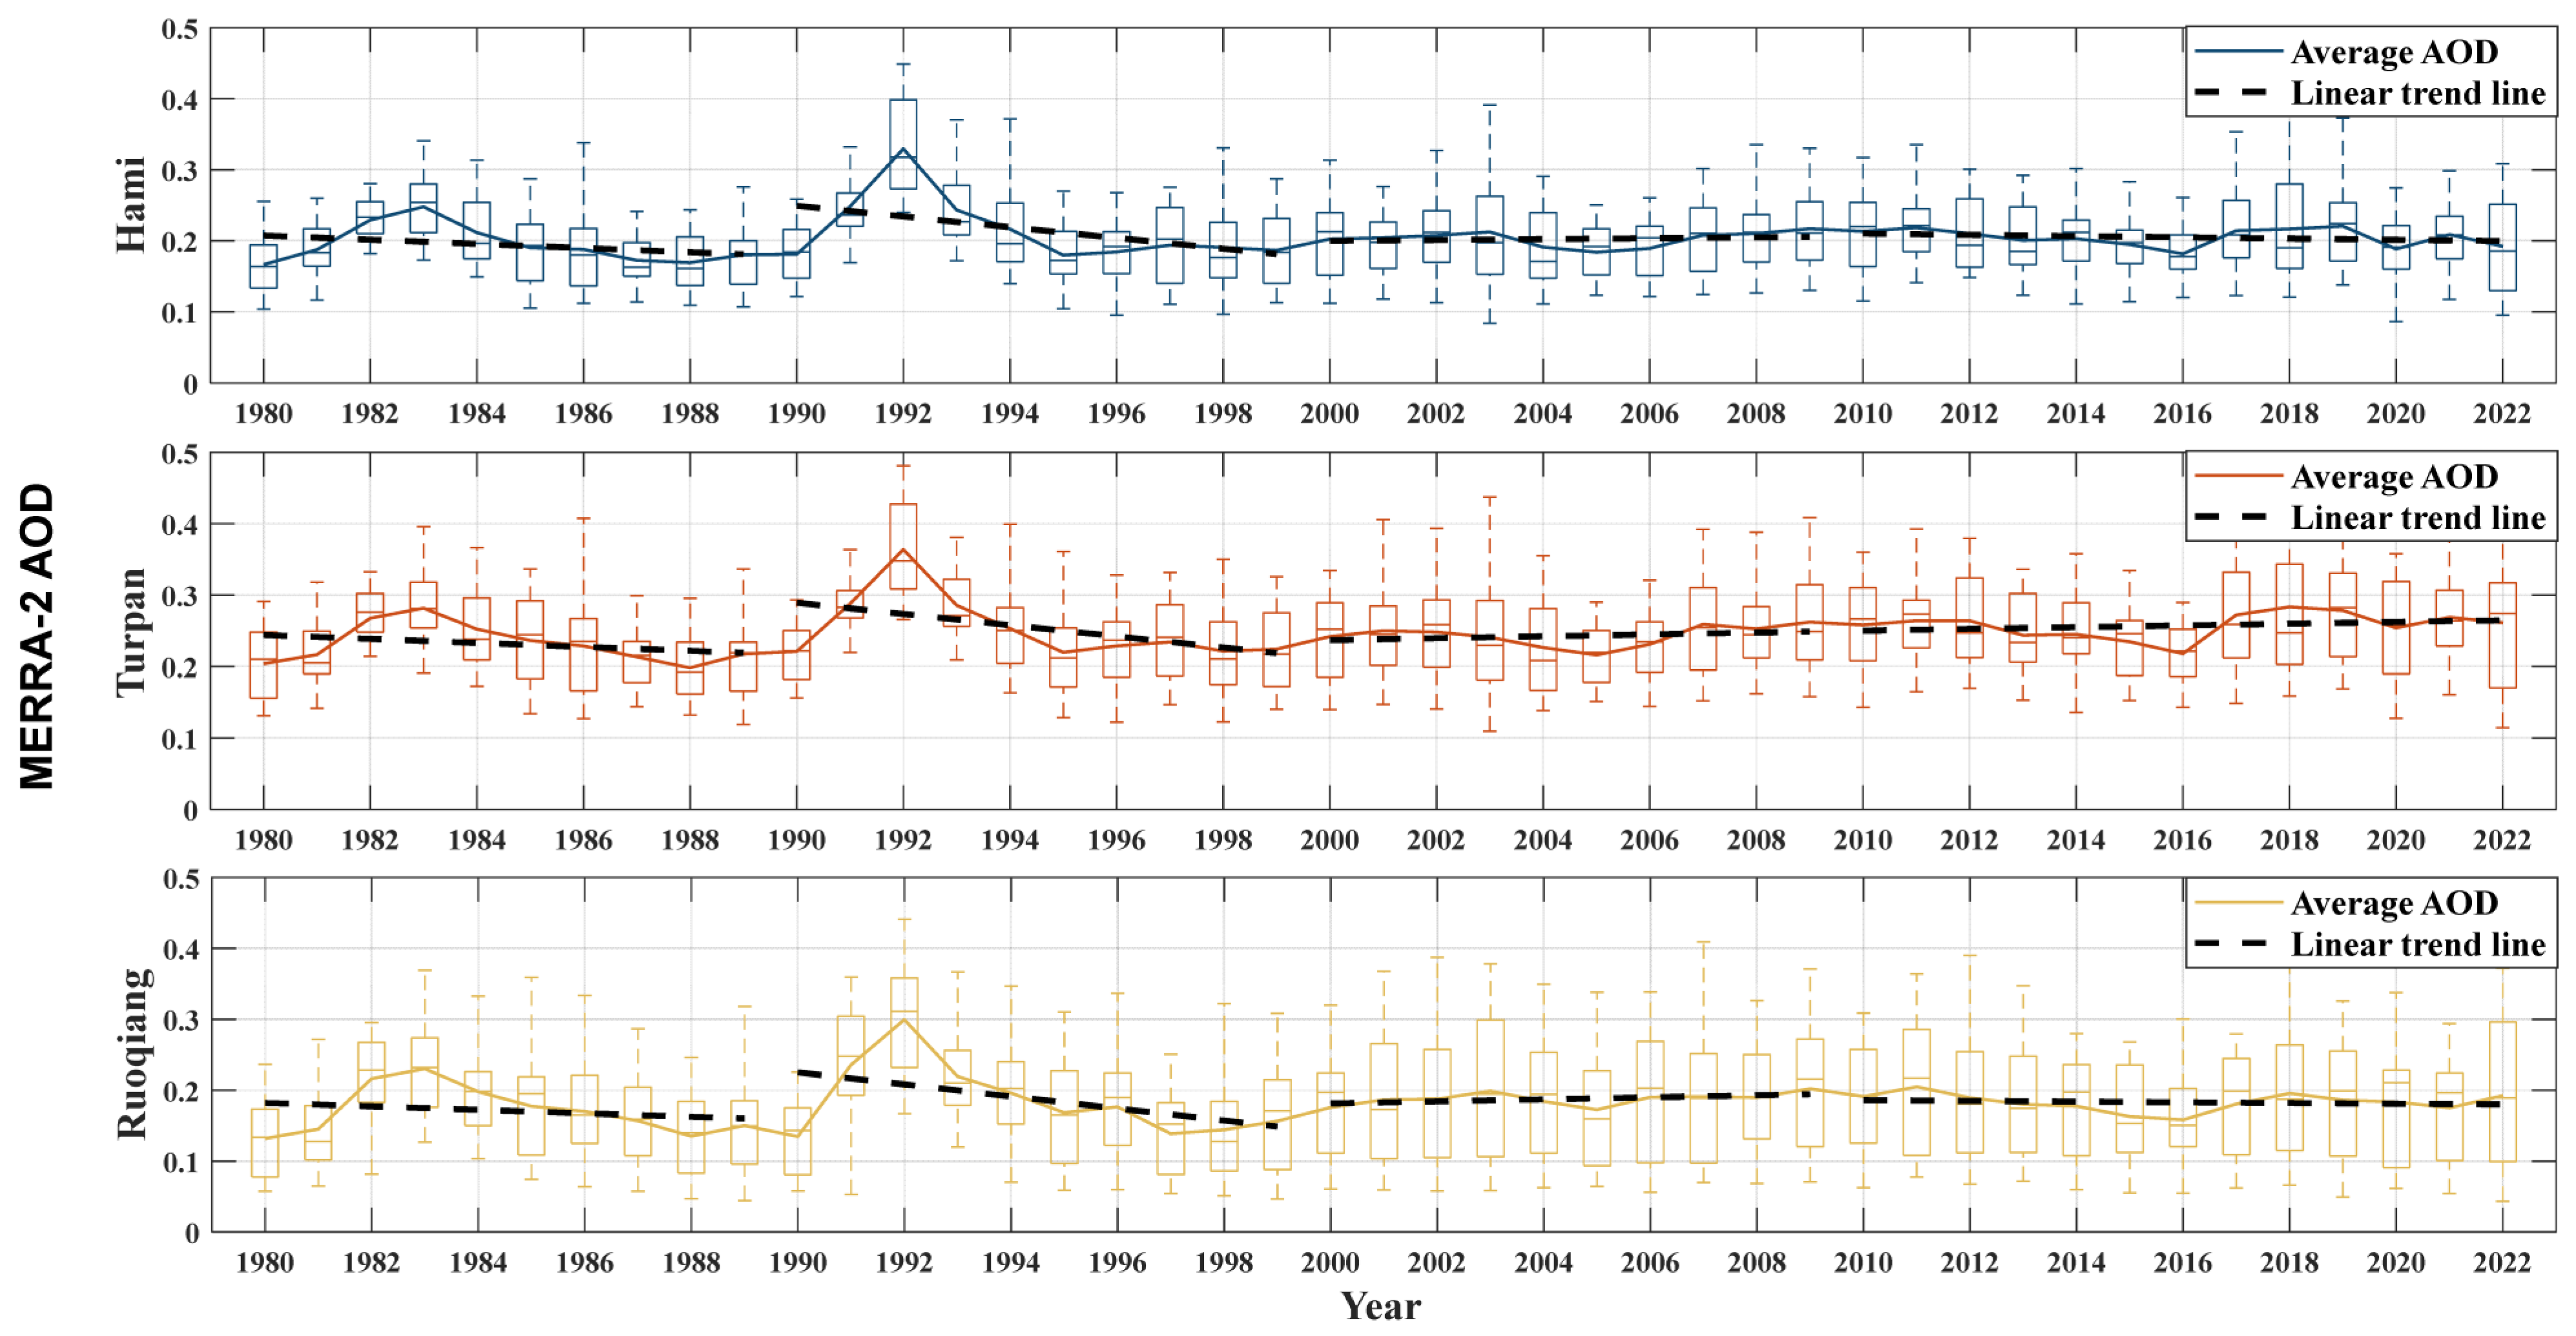
The annual mean AOD variations in the Hami, Turpan, and Ruoqiang CSP project areas from 1980 to 2022 are depicted in
Figure 2. The AOD variation trends in the three CSP project areas are similar. Starting from 1980, the AOD values in the three regions have increased year by year, slowly decreased after 1983, increased again from 1990 to reach the highest value in 1992, and then gradually decreased. The AOD values increased before 1983 and then decreased after that year because when the El Chichonal volcano erupted in Mexico in 1982 [
47], the pollutants caused by the volcanic eruption were released into the air, spread to China, and then led to an increase in the AOD in 1983. In 1992, the AOD reached its highest value in the three regions, mainly owing to the eruption of Mount Pinatubo in the Philippines in the summer of 1991. The pollutants generated by the volcanic eruption spread into the air, causing a significant increase in the overall AOD values in China [
42]. From 2000 to 2005, the AOD values slowly increased and then decreased again, which may be related to the increased use of fossil fuels for heating in Xinjiang. After 2011, the AOD values showed a certain degree of decline again, likely owing to local government policies, such as “energy saving and emission reduction” and “low-carbon trip”, which led to a reduction in pollution emissions [
48]. Li et al. conducted a study on the AOD in Xinjiang, using MODIS data from 2000 to 2019, and showed that the annual mean AOD fluctuated around 0.2; moreover, the AOD values first increased and then decreased from 2000 to 2019, reaching a low point in 2005 [
48]. This is consistent with the AOD variation reported in our paper. After 2016, the annual mean AODs slightly increased and reached a peak in 2018 (in Turpan and Ruoqiang) and 2019 (in Hami) and then they decreased again in these three areas. This phenomenon is possibly related to the contribution of the dust aerosol caused by the frequent occurrence of dust events, which is similar to the results of Liu et al. [
49].
Among all the research regions, Turpan has the highest annual mean AOD values, ranging from 0.20 to 0.36. There are 42 years in which the median AOD values are greater than 0.2 in Turpan, which account for 98% of all the study years. The annual mean AOD values in the Ruoqiang region are the lowest (0.13–0.30), with the majority of the values below 0.2 (except for the years 1982, 1983, 1991, 1992, and 1993), which was caused by the volcanic eruptions in Mexico in 1982 [
47] and in the Philippines in 1991 [
50]. In Ruoqiang, the median AOD values are above 0.2 in only 10 years, which account for 23% of the entire research period. The annual mean AOD in the Hami project area fluctuates around 0.2 (0.17–0.33), and the median AOD values are above 0.2 in 18 years, which account for 42% of the entire research period. The highest annual mean AOD value in Turpan is related to anthropogenic emissions caused by the highest population density and the frequent occurrence of dust events in the local area [
49].
The linear regression functions of AOD values have been used in several papers [
42,
51,
52] for indicating the increase or decrease in the AOD over time. Similarly, the linear trend is plotted in
Figure 2 to show, in intervals of 10 years, the overall change in the AOD value per year in the three regions. From 1980 to 1989, the annual mean AOD values in the project areas of Hami, Turpan, and Ruoqiang decreased by −0.0029, −0.0028, and −0.0025 each year, respectively. From 1990 to 1999, the corresponding AOD values in the project areas decreased by much higher rates: −0.0076, −0.0078, and −0.0085 each year, respectively. However, from 2000 to 2009, the corresponding AOD values increased slightly by 0.0006, 0.0013, and 0.0014 each year, respectively. From 2010 to 2022, the annual change rates of the AOD in Hami, Turpan, and Ruoqiang are −0.0009, 0.0012, and −0.0005, respectively. The decrease in the AOD is beneficial because more direct solar radiation can reach the ground, thereby increasing the power generation of CSP plants. Raillani et al. found a certain proportional relationship between the AOD value in solar thermal power plant areas and the reflectivity attenuation of heliostats [
8]: the higher the AOD value, the faster the heliostats become dirty, and the greater the negative impact on the efficiency of CSP plants. Conversely, the lower the AOD value, the slower the heliostats become dirty and, thus, the smaller the impact on the efficiency of CSP plants.
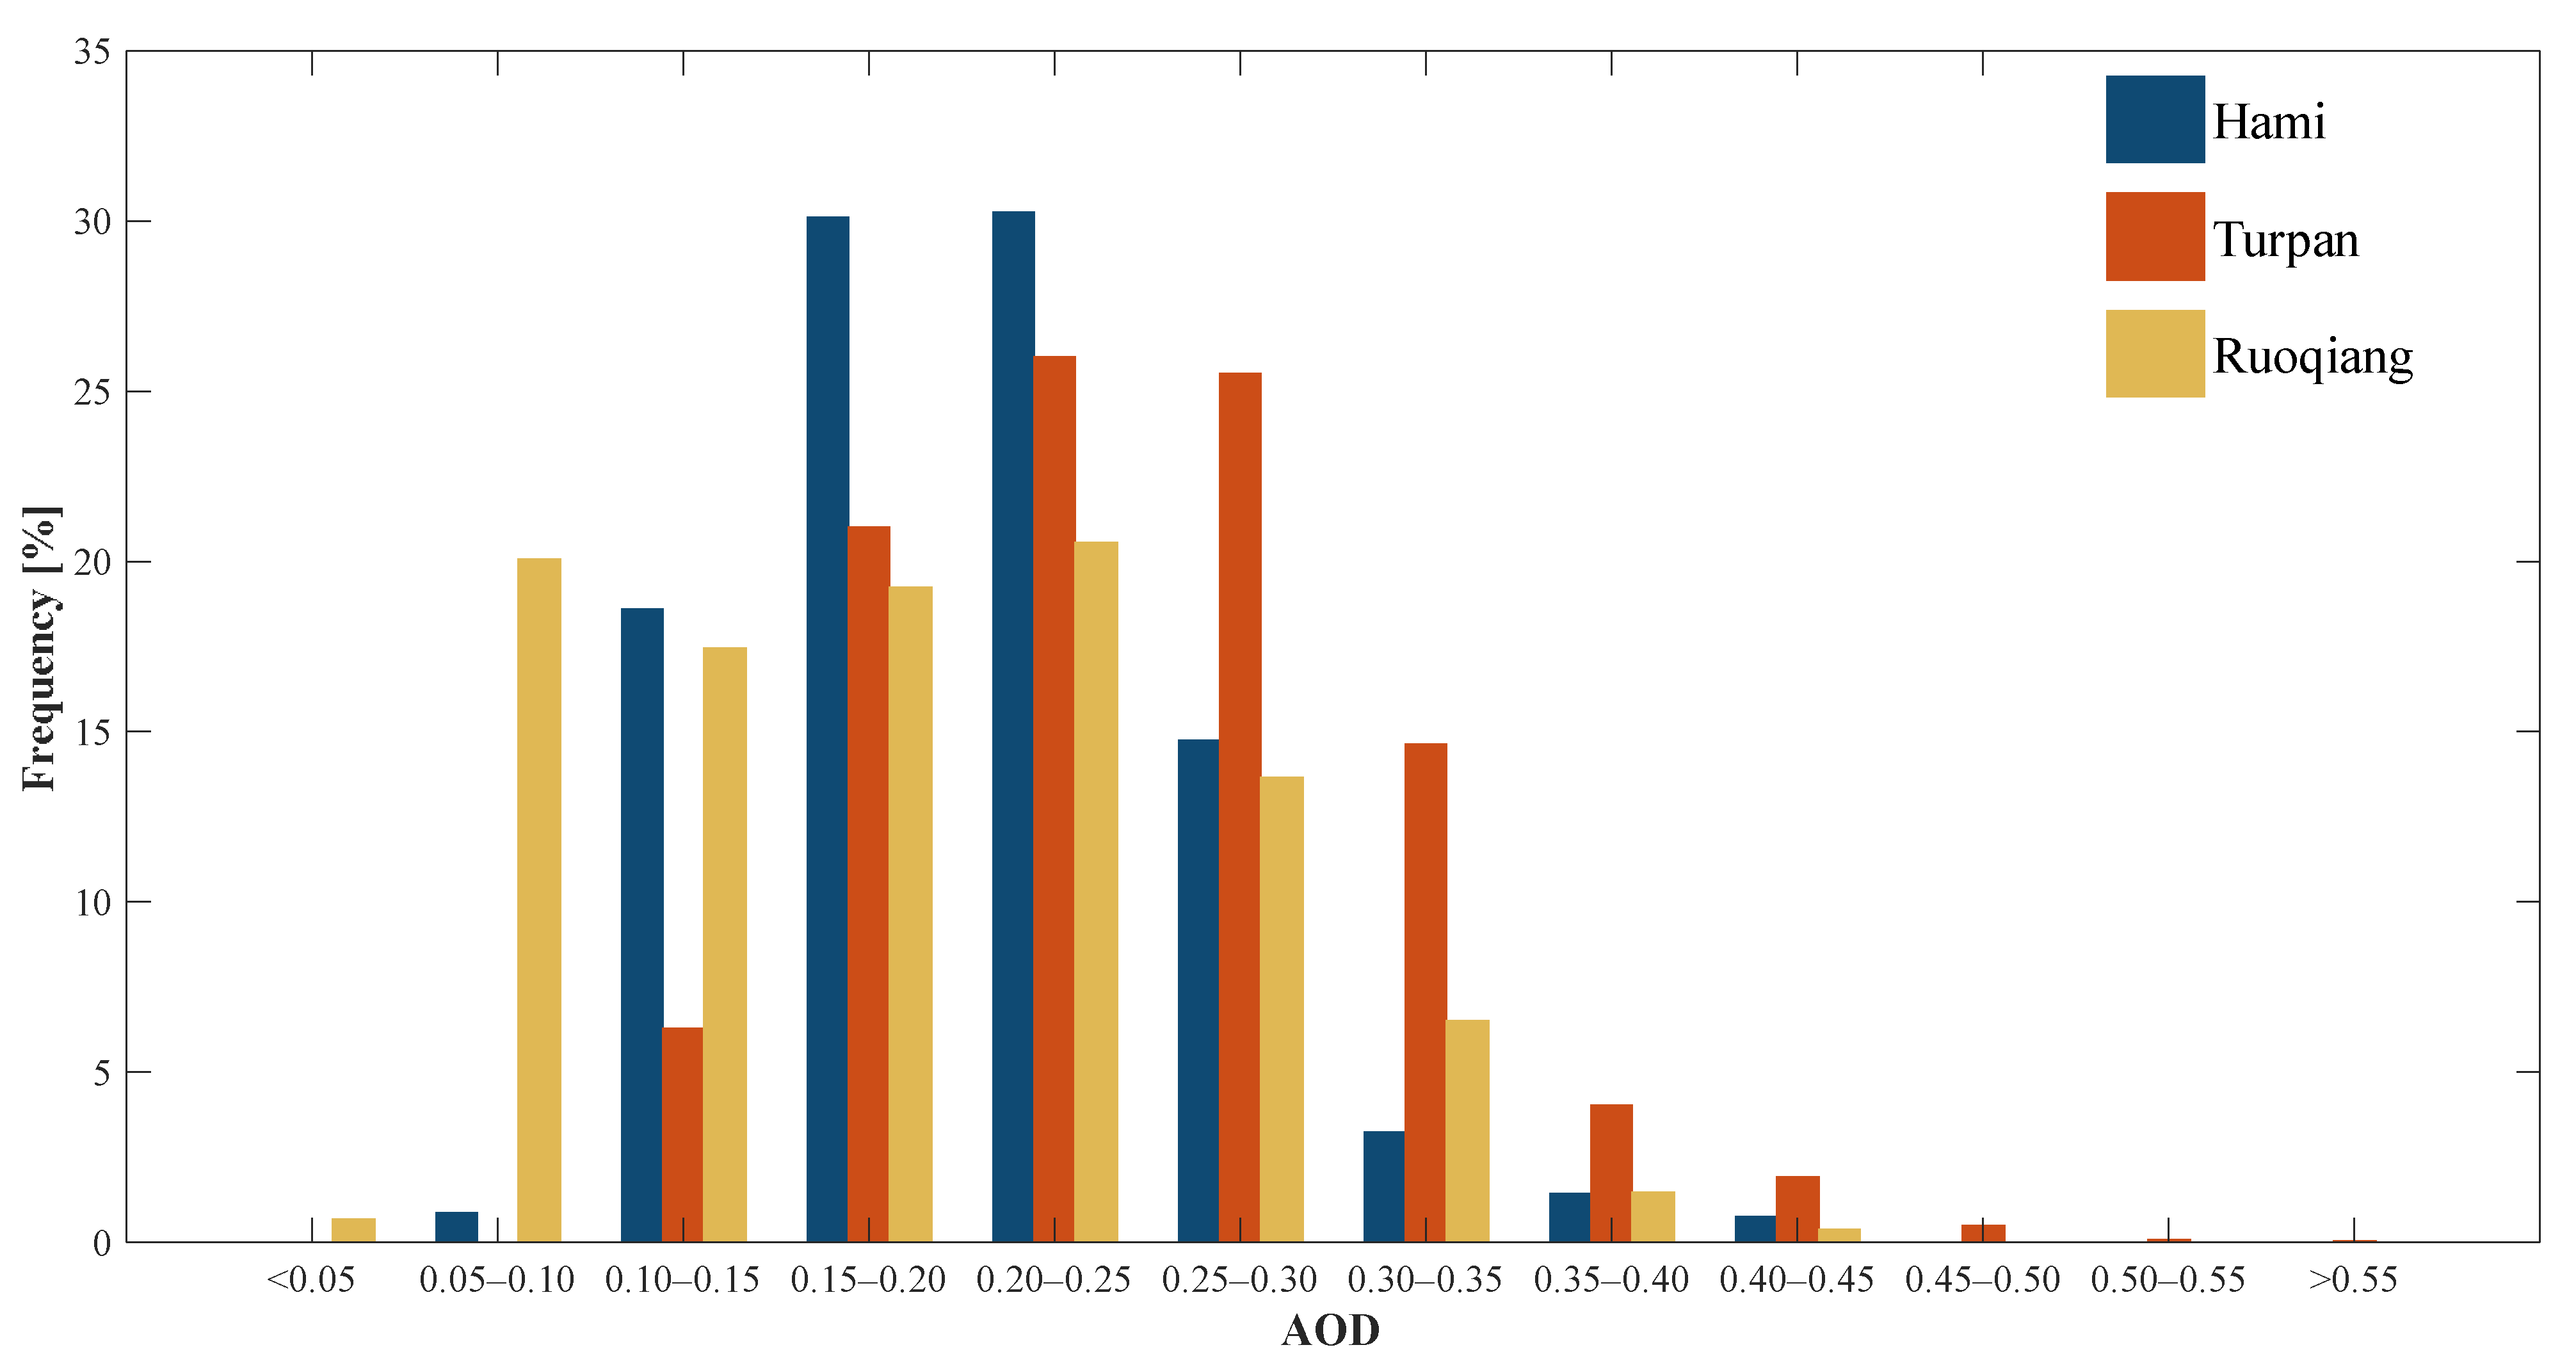
The frequency distributions of the AOD values in the three CSP project areas in the years 1980–2022 are depicted in
Figure 3. In Hami, the AOD values are mainly concentrated in the range 0.10–0.30 (accounting for about 95% of the total), with the AOD distribution frequency exceeding 60% in the range 0.15–0.25. In Turpan, over 90% of the AOD values are between 0.10 and 0.35, with a frequency distribution of over 50% for AOD values in the range 0.20–0.30. In Ruoqiang, over 90% of the AOD values are mainly distributed between 0.05 and 0.30 and compared with the other two regions, this region shows a relatively even distribution. AOD values of > 0.45 are found in Turpan but in neither Hami nor Ruoqiang. Conversely, AOD values of < 0.05 are found in Ruoqiang. Therefore, the Ruoqiang and Hami areas seem to be more suitable for CSP locations than Turpan.
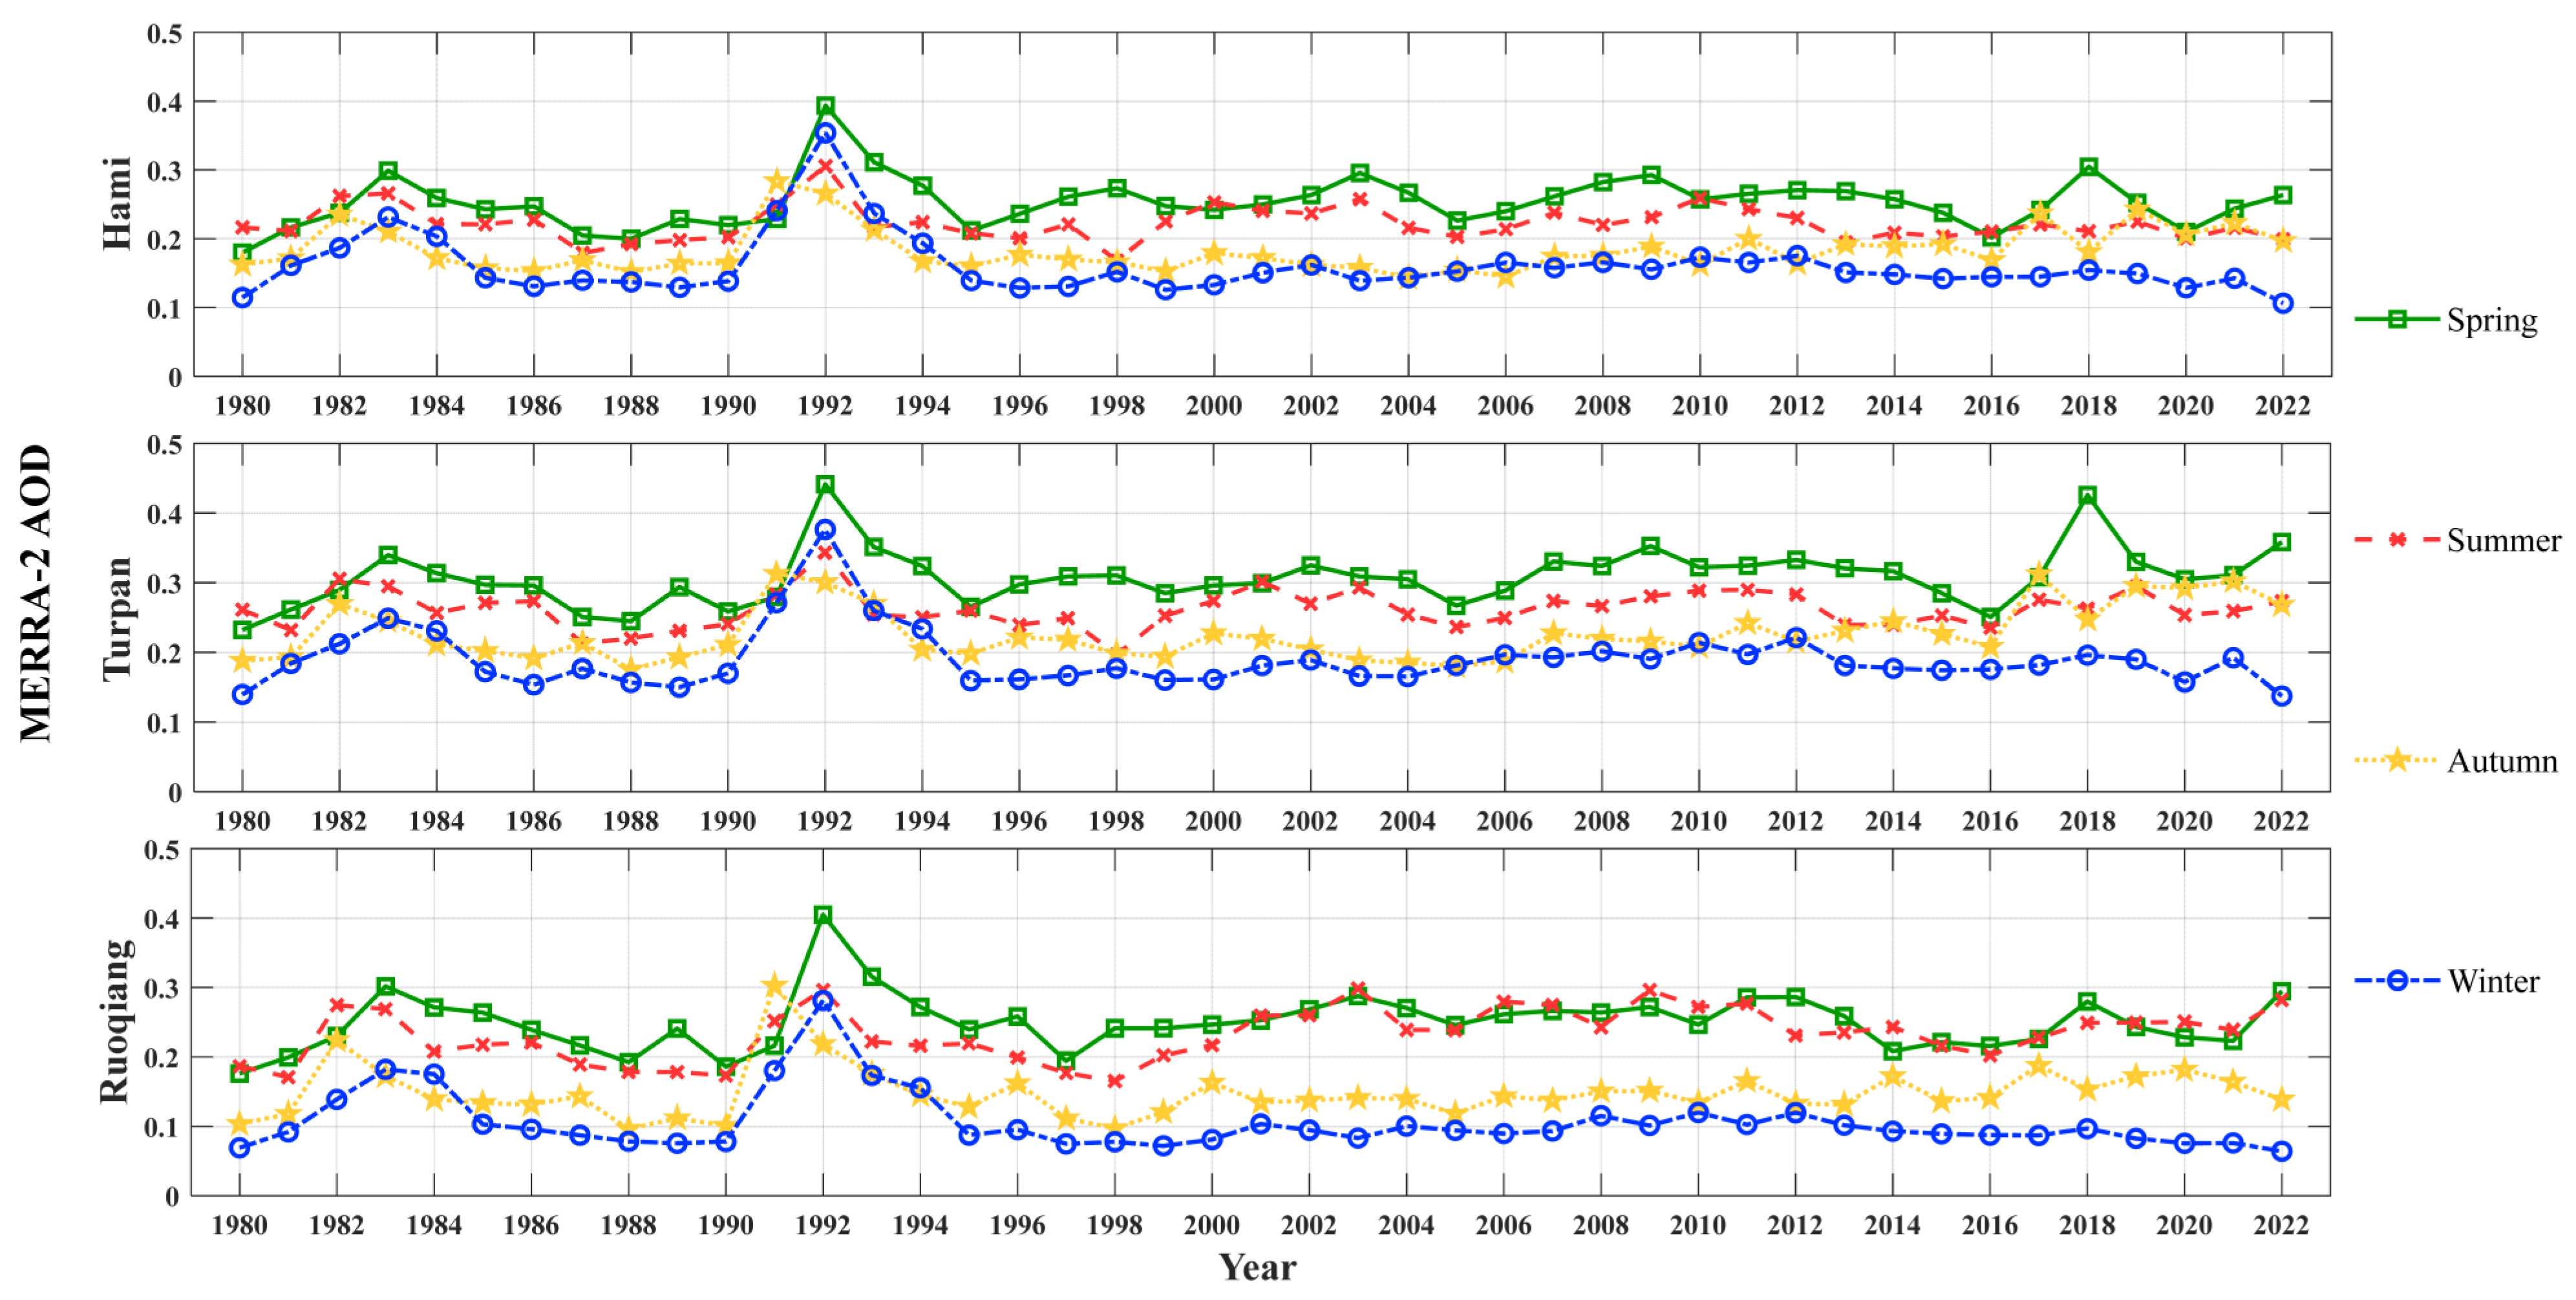
Figure 4 shows that the seasonal variation trends of the AOD in the Hami, Turpan, and Ruoqiang project areas are basically the same. In the three project areas, the AOD values in spring and summer are significantly higher than those in autumn and winter (especially in Ruoqiang). In Hami, the AOD values in spring and summer fluctuated between 0.2 and 0.3, and the AOD values in autumn and winter were mainly distributed in the range from 0.13 to 0.22, except for the special years (1983, 1991, and 1992). In Turpan, the AOD values in the warm seasons (spring and summer) are above 0.20 in each year, and over 90% of the AOD values in autumn and winter are in the range from 0.15 to 0.25. The spring and summer AOD values change mainly between 0.2 and 0.3, while the AOD values in the cold seasons (autumn and winter) are mainly distributed between 0.07 and 0.2 in Ruoqiang. For the three study areas, the spring and summer seasonal variation trends seem to be similar, and the autumn and winter seasonal variation trends seem to be similar. In winter, the behaviors of the AOD change trends in all the project areas seem to be almost identical. Among the three project areas, Turpan has AOD values in the four seasons that are significantly higher than the corresponding AOD values in the other two areas. The AOD values in the four seasons in Ruoqiang are generally low and even fall below 0.1 in winter.
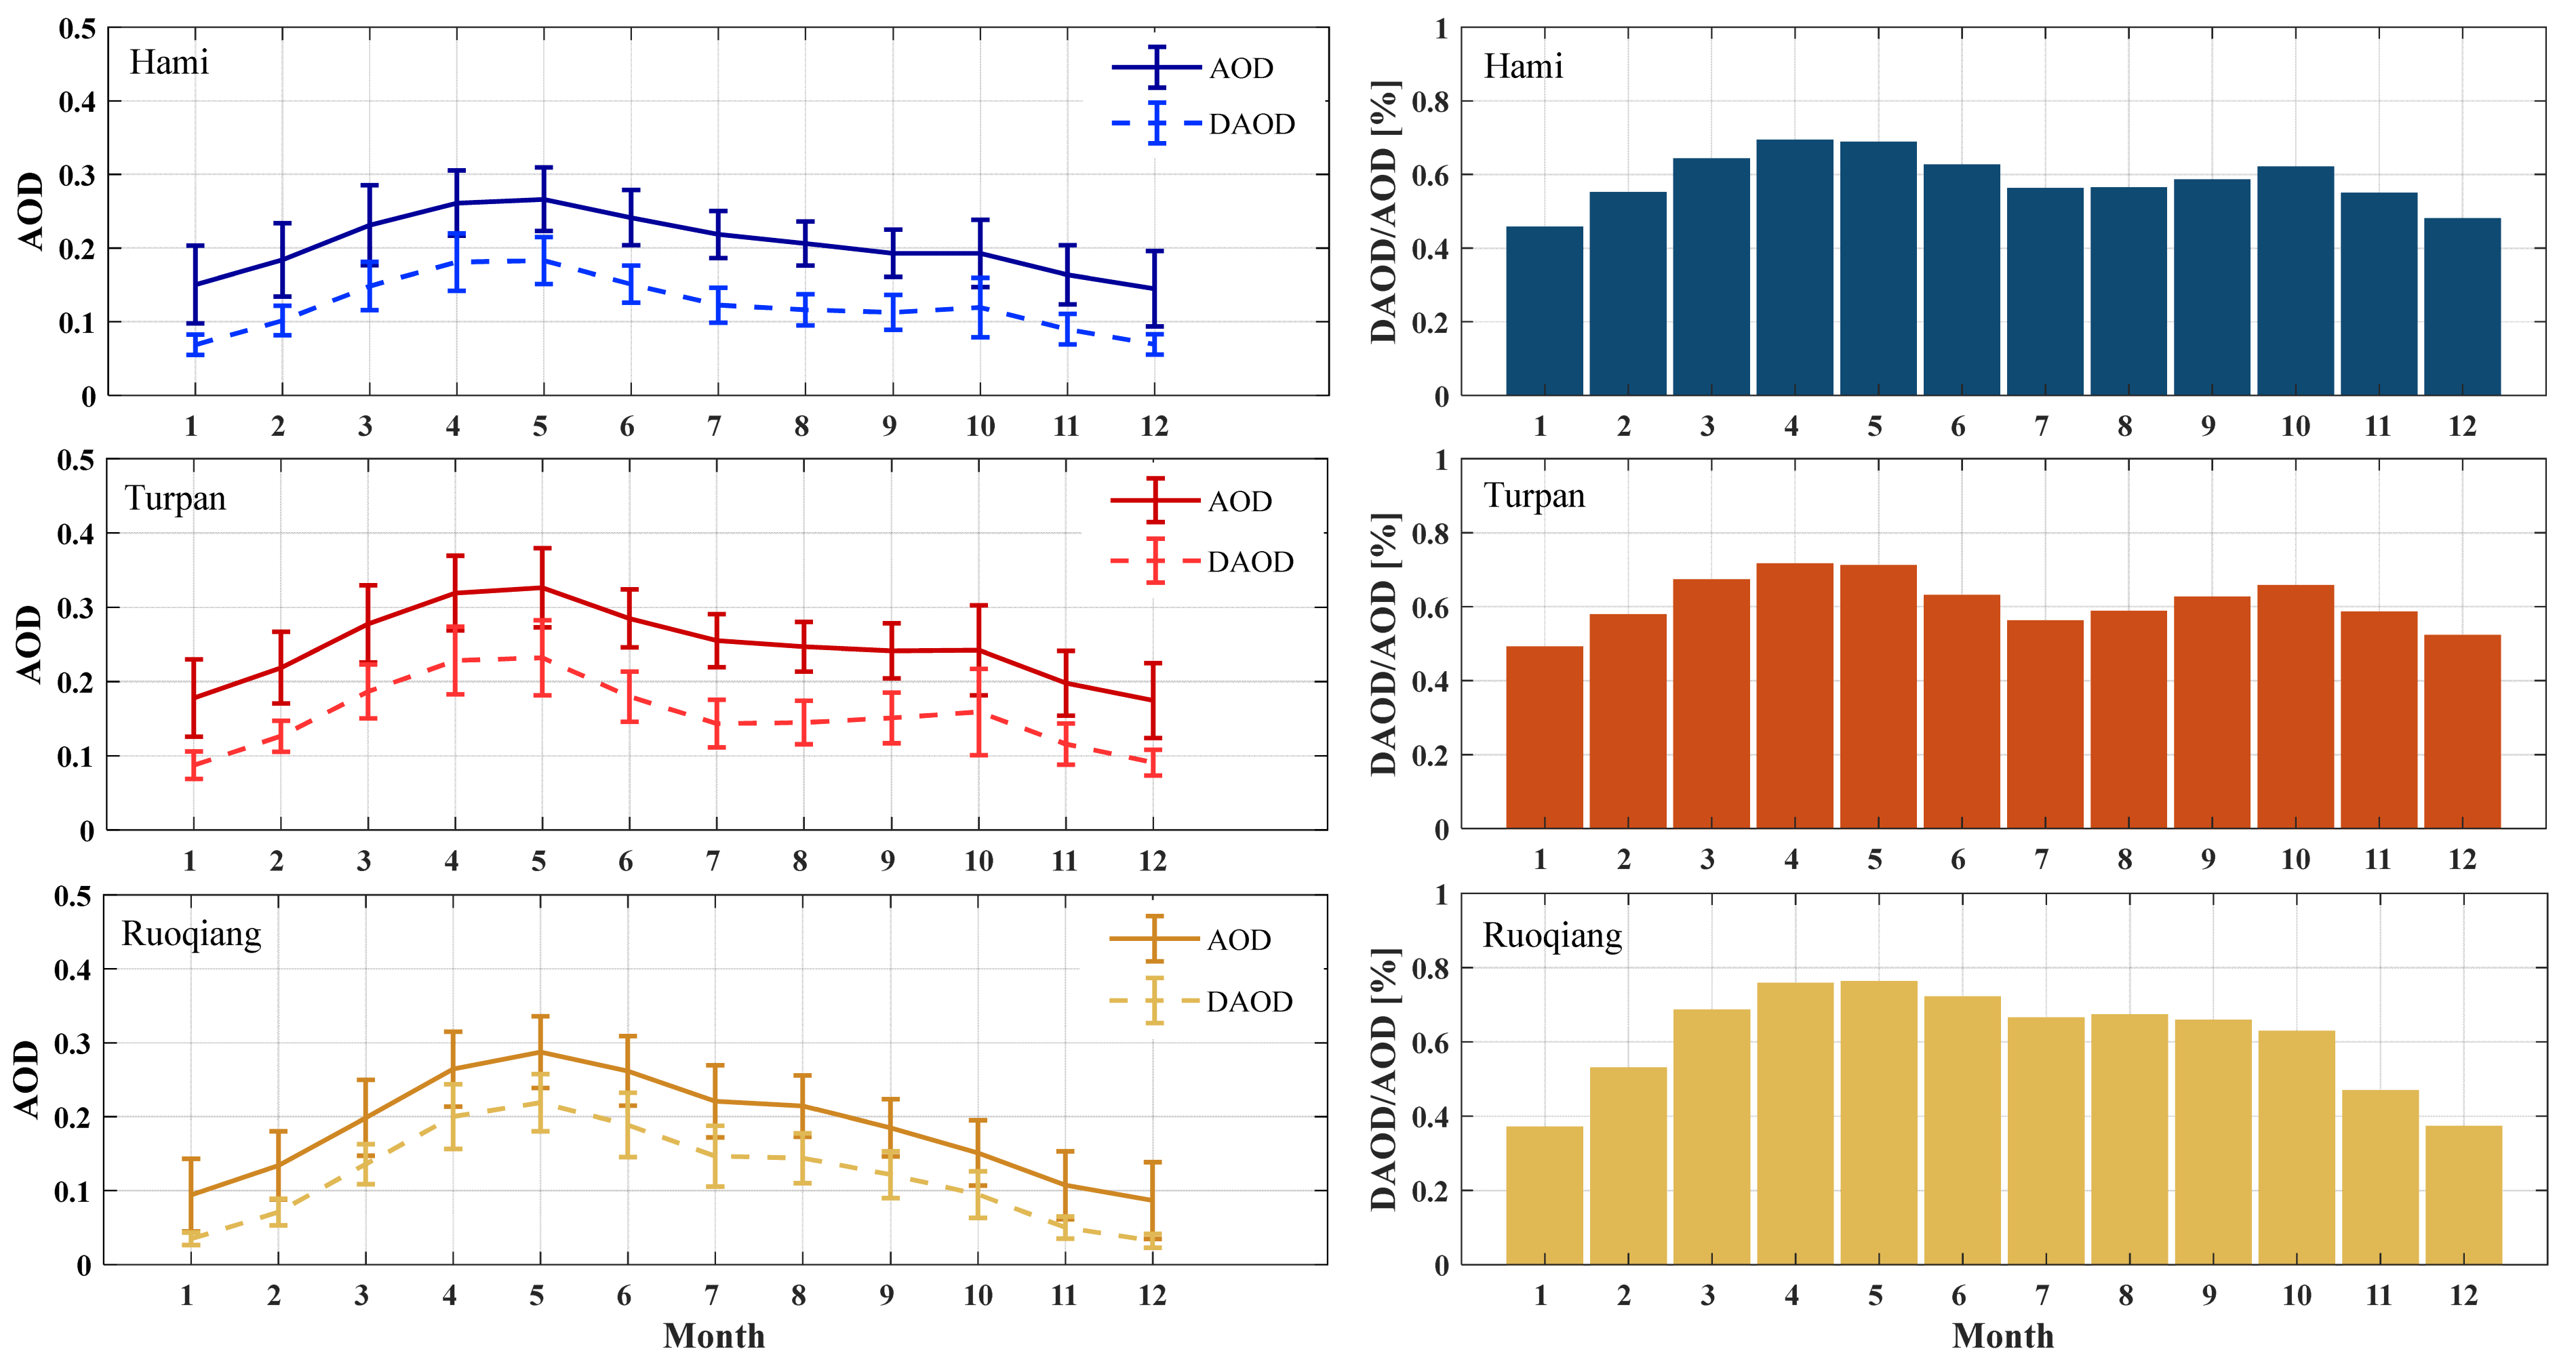
The monthly mean AOD and dust AOD values for the three regions, as well as the ratio of DAOD to AOD are shown in
Figure 5. In all the project areas, from January to May, both the AOD and dust AOD values show an increasing trend. Then, after May, the AOD values start to decrease until reaching the minimum in December. The maximum values occur in May, with AOD values of 0.27 ± 0.04 for Hami, 0.33 ± 0.05 for Turpan, and 0.29 ± 0.05 for Ruoqiang. The minimum values occur in December, with AOD values of 0.14 ± 0.05 for Hami, 0.17 ± 0.05 for Turpan, and 0.09 ± 0.05 for Ruoqiang. In spring, the proportion of the dust AOD to the AOD exceeds 64% in the Hami project area, 67% in the Turpan project area, and 69% in the Ruoqiang project area, indicating that dust is the main component of aerosols in all three regions during spring. Therefore, aerosols have a significant impact on CSP plants in spring, and more frequent cleaning of the heliostats is necessary to ensure the optimal reflectivity.
The change of AOD values with month at three research areas is displayed in
Table 3. From January to May, the monthly increase rates of AOD in Hami, Turpan, and Ruoqiang were found to be strong of 0.032, 0.040, and 0.053, respectively. From May to December, the AOD in Hami, Turpan, and Ruoqiang decreased at the lower rates of −0.017, −0.020, and −0.028 per month, respectively.
During spring and summer, the proportions of dust in the aerosol are the highest, with all three regions being above 50%. This is due to increased strong winds and more intense atmospheric convection activities, especially during spring but also in summer. In autumn and winter, the proportions of dust in the aerosol are lower, indicating weaker dust activities and weaker atmospheric convection activities [
53]. The maximum value of the AOD occurs in spring, indicating that the project area is mainly affected by the dust in aerosols during this season, leading to a significant increase in AOD values.
In spring, the AOD values are the highest throughout the year. This result is consistent with the research conducted by Li et al. [
54] in the desert of Xinjiang. The local surface temperature increases, thus enhancing the air convection activity. The sand particles in the desert and the dust on the exposed ground significantly increase the concentration of particles in the atmosphere, resulting in the maximum AOD values in the research areas during spring. On the contrary, the particle concentration gradually decreases, and the AOD reaches its lowest value in winter. Li et al. [
48] analyzed the AOD variation in Xinjiang from 2000 to 2019 and found that the seasonal variation in the AOD is quite evident: spring (0.309) > summer (0.200) > autumn (0.161) > winter (0.158). The average AOD value in Xinjiang is 0.196, which is consistent with the trend shown in this paper.
The aerosols in the arid and desert regions of Xinjiang are mainly composed of large particles of sand and reach their peak in spring [
55]. The maximum mean values of the AOD occurred in May in all three regions, with values of 0.27 ± 0.04 in Hami, 0.32 ± 0.05 in Turpan, and 0.29 ± 0.05 in Ruoqiang. In May, the mean DAOD values are 0.18 ± 0.03 (Hami), 0.23 ± 0.05 (Turpan), and 0.22 ± 0.04 (Ruoqiang), and the ratios of DAOD to AOD in May are 69%, 71%, and 76%, respectively. The highest AOD and DAOD values appear in Turpan, while Ruoqiang has the highest proportion of dust in the aerosol among the three study regions. The main dust source is distributed in Lop Nur, the Taklimakan Desert, the Turpan Basin, the Hami Basin, and the Gurbantunggut Desert; thus, dust activities mainly occur in these regions and their surrounding areas [
49]. Compared with Turpan and Hami, Ruoqiang is closer to Lop Nor and the Taklimakan Desert region, where dust storms occur relatively more frequently in three study areas [
49]. Therefore, the dust proportion in the aerosol in Ruoqiang is highest among the three study areas. The population of Turpan is much higher than that of Ruoqiang [
49], which caused more anthropogenic emissions in Turpan than in Ruoqiang and, thus, a higher AOD in Turpan than in Ruoqiang. The high AOD values are partly related to the low elevation (of the Turpan Basin), which makes it easy for dust and anthropogenic emissions to accumulate inside the basin and then leads to a high AOD value in these areas.
Wang et al. investigated the snow cover in Xinjiang from 2001 to 2020 using satellite data for study areas in Ruoqiang, where the snow usually appeared in December and ended no later than February. For the majority of the study areas in Hami and Turpan (except for the Tianshan areas), the snow usually occurred in November and ended by about February [
56]. The snow hindered the movement of the dust, which led to a decline in the AOD and DAOD values after October and caused relatively lower proportions of dust in aerosols in November, December, and January in all three regions.
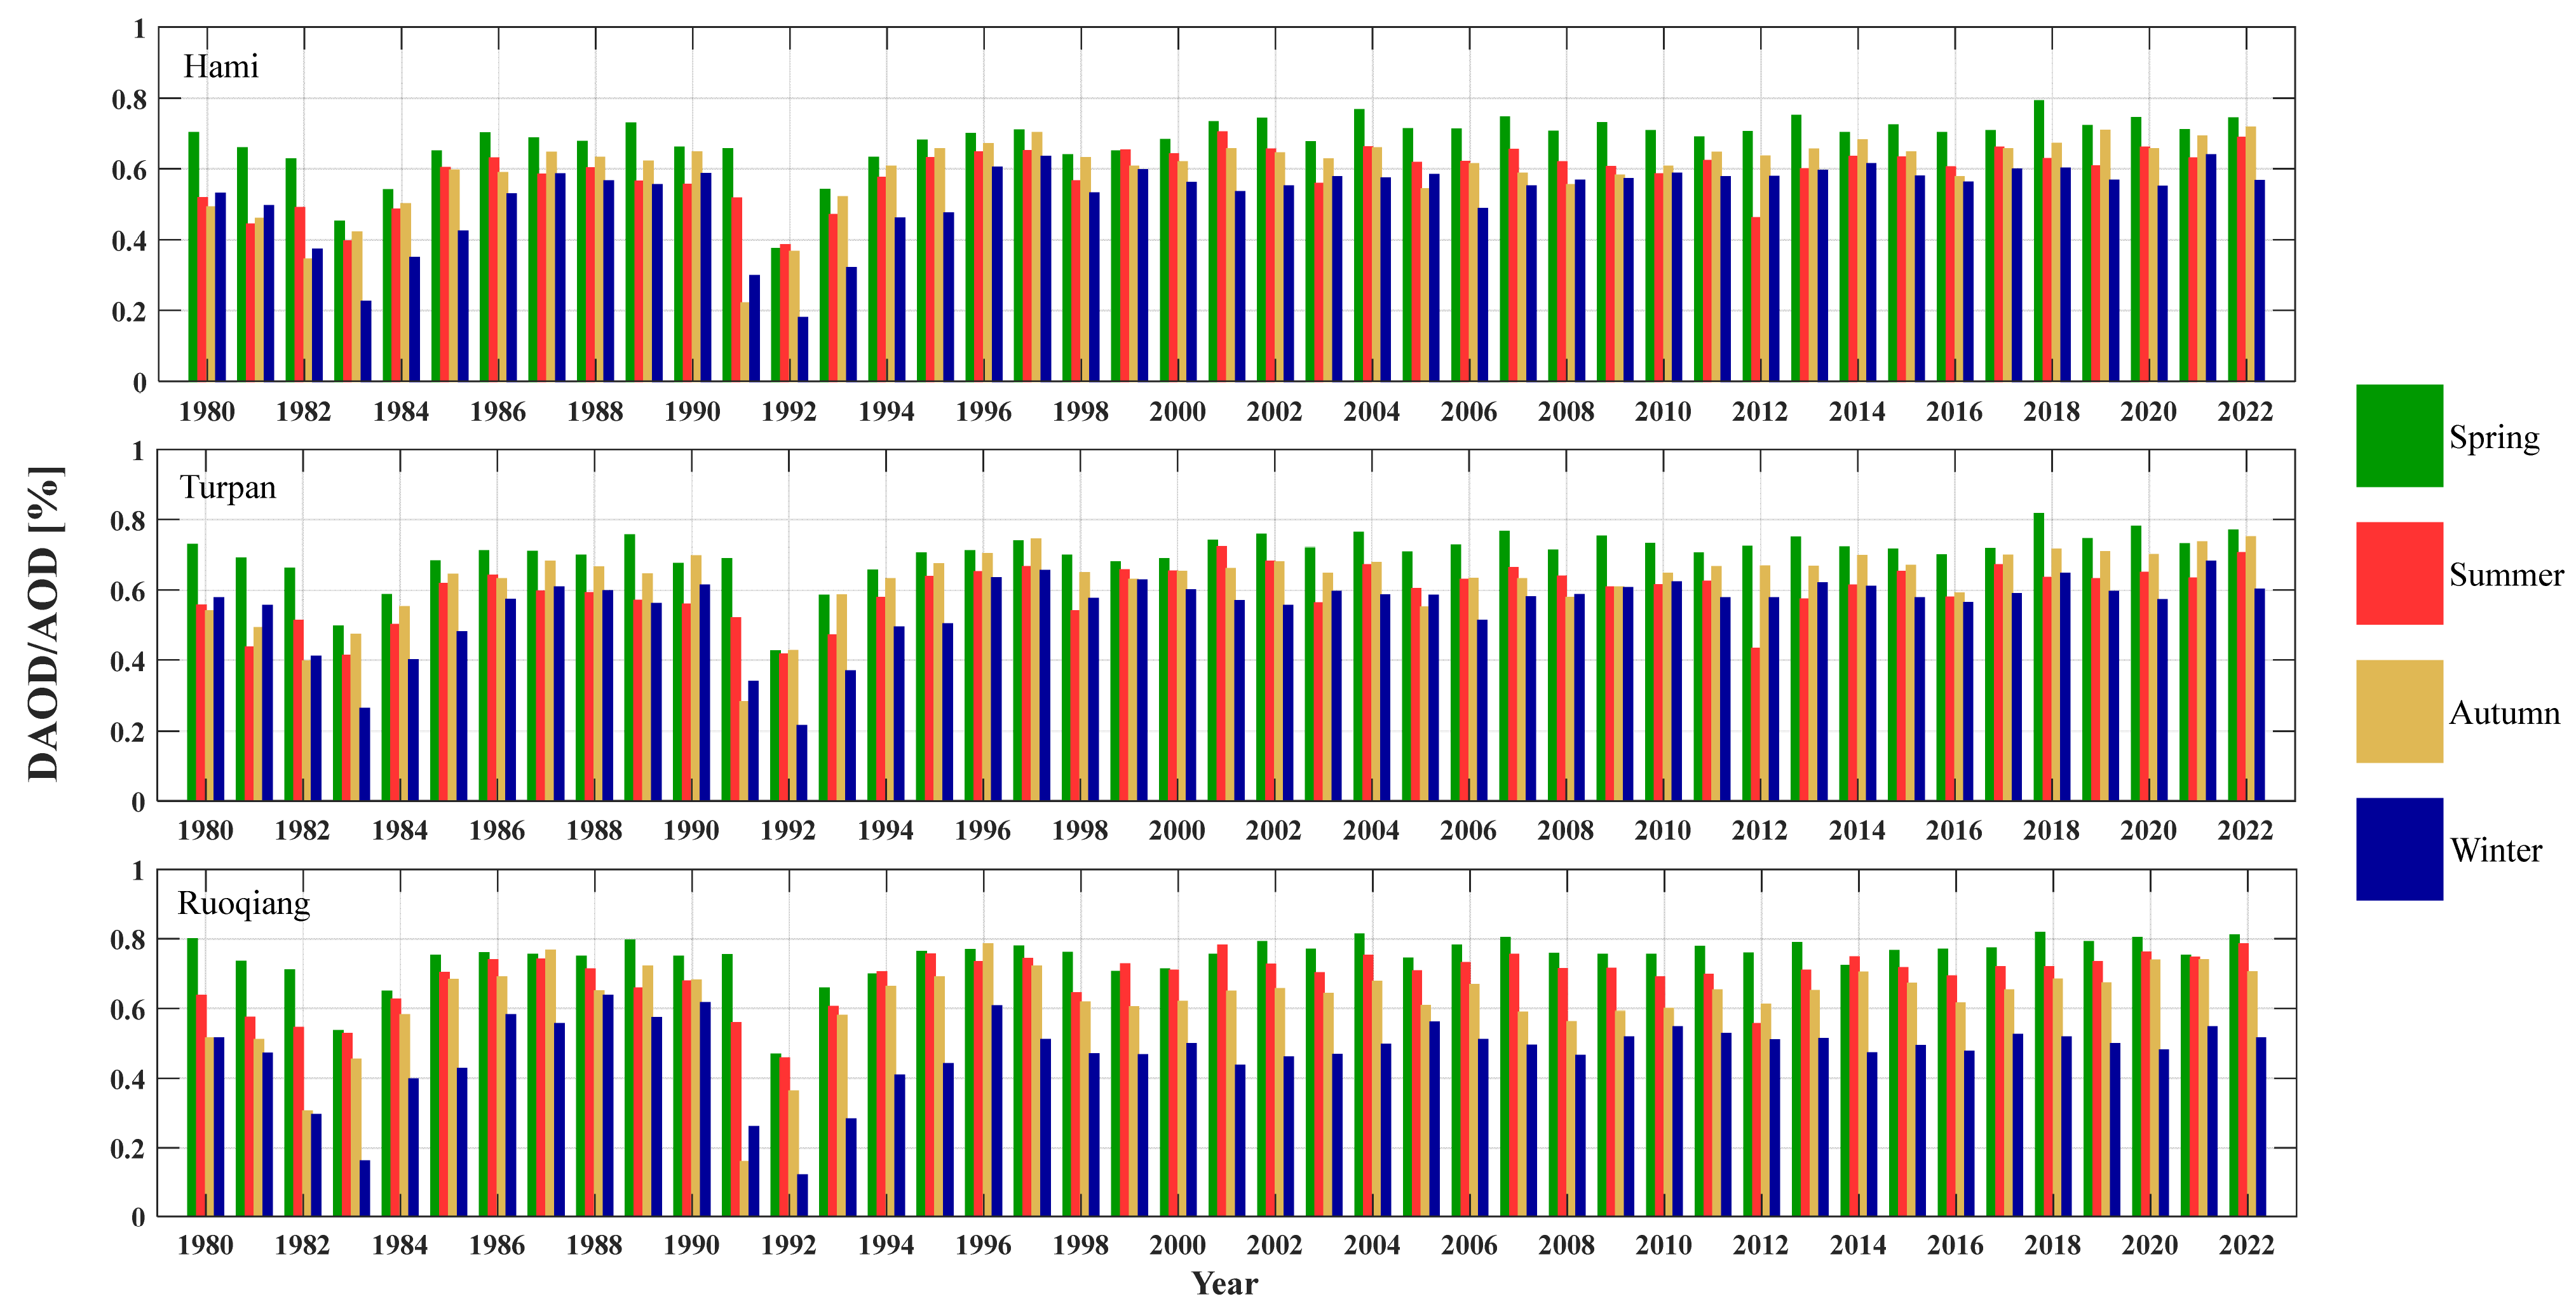
Figure 6 shows the annual variation in the ratio of DAOD to AOD (DAOD/AOD) in different seasons in the three project areas. Overall, all three regions are generally affected by dust. The proportion of the dust AOD to the AOD is the highest in spring and the lowest in winter. In 1992, China’s atmospheric aerosols were influenced by the eruption of the Philippines’ volcano in the summer of 1991, and the substances produced, amongst others, volcanic ash, which vigorously entered the atmosphere, resulting in a significantly higher proportion of this type of component than the dust in the aerosols. Therefore, from autumn 1991 to winter 1992, the proportion of the dust in the aerosols was significantly lower than in other years.
The means and standard deviations of the ratios of the dust aerosol optical depth to the total aerosol optical depth (DAOD/AOD) between 1980–1999 and 2000–2022 and their corresponding rates of increase between the two periods in the three regions and in the four seasons are given in
Table 4. In spring, Ruoqiang has the highest proportion of dust in the aerosol during the two periods (1980–1999 and 2000–2022) compared to the other two areas, with a mean value of 0.72 ± 0.08 in 1980–1999 and a mean value of 0.77 ± 0.03 in 2000–2022, and the rate of increase in the proportion of the dust in the aerosol between the two periods is 7%. The area with the fastest growth in the proportion of dust in the aerosol between the two periods is Hami, with a rate of increase of 14%. The rate of increase in DAOD/AOD in spring in Turpan is 12%. In summer, the rate of increase in the proportion of dust in the aerosol is 18% in Ruoqiang, while the rate in Hami and Turpan is 13%. In autumn, the mean DAOD/AOD in Hami changed from 0.55 ± 0.13 (1980–1999) to 0.63 ± 0.05 (2000–2022), with the highest rate of increase (15%) in the proportion of dust in the aerosol. Turpan has the second highest rate of increase (14%) in DAOD/AOD, and the rate in Ruoqiang is only 10% in autumn. In winter, the rates of increase in the proportion of dust in the aerosol between the two study periods are 21% (Hami), 18% (Turpan), and 14% (Ruoqiang).
Since 2000, for the three regions, there has been a clear increasing trend in the proportions of sand and dust in aerosols, indicating that the impact of the dust on these regions is gradually increasing. Therefore, CSP plants need to develop a strategy for cleaning the heliostats to reduce the impact of dust adhesion on the efficiency of the CSP plants.
5. Conclusions
MERRA-2 reanalysis data were used to study and analyze the characteristics, distributions, and trends of AOD and DAOD at 550 nm in the three most concentrated areas of CSP plant projects in Xinjiang (Hami, Turpan, and Ruoqiang) over 43 years.
The annual mean AOD changes in the three project areas are quite similar. Overall, the annual mean AOD in the Turpan project area is the highest (above 0.2) and in the Ruoqiang project area is the lowest (below 0.2). The annual mean AOD in the Hami project area fluctuates around 0.2. The majority of the AOD values are between 0.10 and 0.30 in Hami, range from 0.10 to 0.35 in Turpan, and range from 0.05 to 0.30 in Ruoqiang. Therefore, the Ruoqiang and Hami areas seem to be more suitable for serving as CSP plants in the long term compared to Turpan.
After 2010, the overall annual rates of change in the AOD are −0.0009, 0.0012, and −0.0005 in the Hami, Turpan, and Ruoqiang project areas. The increase in AOD values indicates that the local atmospheric environment is not conducive for improving the efficiency of solar thermal power generation. Thus, it will have the most effect on CSP plants generation efficiency in the Turpan project area among the three study regions. On the contrary, the local atmospheric environment is more beneficial for CSP plants power production in Hami and Ruoqiang.
The AOD seasonal variation trends in the three project areas are basically the same. The AOD values in spring and summer are significantly higher than those in autumn and winter, while the trends are more similar in spring and summer versus autumn and winter, which are also similar. Therefore, the negative impact of the increased AOD on the overall CSP effectiveness is expected to be higher in the two warmer seasons, especially in spring. Notably, in all four seasons, the seasonal mean AOD values in Turpan are significantly higher than those in the other study areas; therefore, this is the area that needs the most attention to ensure the high effectiveness of the CSP plants.
In the three project areas, the values of AOD and DAOD reached their maxima in May and minima in December, and these values in spring were significantly higher than in other seasons. In spring, the proportion of DAOD to AOD exceeded 64% in the Hami region, 67% in the Turpan region, and 69% in the Ruoqiang region, indicating that dust is the main component of aerosols in these areas. After 2000, the proportions of dust in the aerosols in the three areas showed an increasing trend, suggesting that the impact of the dust on these areas is gradually increasing. CSP plants need to develop corresponding cleaning schemes to ensure the power generation efficiency of the plants.
Most CSP plants are built in arid regions or the Gobi Desert. Therefore, the impact of dust aerosols on CSP plants needs to be not only assessed but also investigated continuously. In the future, the relationship between the AOD and the attenuation of heliostats’ reflectivity needs to be further analyzed to improve the accuracy for predicting heliostat reflectivity in different seasons and provide a scientific basis for formulating reasonable heliostat cleaning schemes. In addition, the relationship between the AOD and CSP generation in the project areas needs to be further studied to improve the accuracy of the DNI prediction, optimize the operation strategy of power plants, and provide technical support for the cost reduction, efficiency improvement, and enhancement of the grid-dispatching capability of CSP plants.


 ,
, 


