Abstract
The process of rainwater interception by tree organs is crucial in mitigating the impact of intense rainfall on urban drainage systems, particularly in the context of climate change. For this study, we selected ten commonly found tree species in Shanghai, and the main parts of trees, including their leaves, branches, and bark, were collected to analyze their ability to intercept rainwater. The optimized Artificial Rainfall Simulation System (ARSS) was applied to simulate rainfall. The time-changing process of rainwater interception in three organs was measured during a 180 min rainfall event under four different rainfall intensities (4, 8, 12, and 16 mm/h, respectively). Process models of rainwater interception in different organs were fitted with adsorption kinetic equations. The rainwater interception process of tree organs complied with the quasi second-order adsorption kinetic equation. The rainwater interception capacity values of the leaves, branches, and bark of the ten urban tree species ranged from 0.05 to 0.34 mm, 0.13 to 0.24 mm, and 0.29 to 1.22 mm, respectively. The rainwater interception capacity values of the three organs significantly differ (p < 0.05). The results of this study reveal that bark exhibits the greatest rainwater interception ability. Coniferous tree species have a greater ability to intercept rainwater than broad-leaved tree species. There are also differences in the rainwater interception ability of trees in urban and natural areas.
1. Introduction
Trees, as an important component of urban ecosystem function [1,2,3] and hydrological regulation, are gradually receiving more attention in the study of rainwater interception within their canopies. Due to the prevalence of isolated tree species in urban areas [4,5], numerous studies have focused on individual tree canopies and utilized the water balance method. This method assesses the rainwater interception capacity of trees by calculating the disparity between natural rainfall and the amount of rainfall that reaches the ground after being intercepted by the tree canopy [6]. Alves [7] conducted a study on the rainwater interception capacity of four urban tree canopies in Brazil. In natural rainfall events with a total rainfall of 16.70 mm, the tree crowns intercepted 8.0 mm, 7.4 mm, 7.2 mm, and 4.8 mm of rainwater, with interception rates of 47.9%, 44.30%, 43.1%, and 28.7%, respectively. Guevara [8] measured an average rainwater interception of 4.8 mm and an interception rate of 69.6% among urban trees during a 6.9 mm natural rainfall event in Queretaro, Mexico. Asadian [9] conducted a study on six urban trees in northern and western Vancouver, Canada, and found that these trees had an average rainwater interception ranging from 4.8 to 22.0 mm for natural rainfall events, with a total precipitation ranging from 1.5 to 24.3 mm. In an experiment conducted in Ljubljana, Slovenia, involving 85 natural rainfall events with a total rainfall of 488.3 mm, Zabret [10] found that the rainwater interception rates of birch (Betula pendula) and pine (Pinus sylvestris) were 40.2% and 58.3%, respectively. For the studies mentioned above, the rainwater interception values for urban tree canopies in a single rainfall event range from 0.6 mm to 24.3 mm, and the interception rates range from 1.2% to 76.5%. Previous research has mainly focused on field experiments. Due to the variability of natural rainfall and variations in tree crown structure characteristics, even within the same tree species, significant differences have been observed in different studies. In various studies, the amount of rainwater intercepted by the crown of Robinia pseudoacacia ranged from 1.9 to 6.6 mm, with interception rates ranging from 11.0% to 57.6% [11,12]. The varying interference conditions in different experiments make it difficult to compare and analyze the results across different experiments. The level of variation in these research findings poses challenges in systematically assessing the rainwater interception capacity of tree canopies. Additionally, it is also difficult to ascertain the impact mechanisms of factors such as tree structure, rainfall conditions, and climate conditions on rainwater interception.
The tree organs are the main components that intercept rainwater, and the accuracy of measuring their interception capacity affects the assessment of the canopy’s overall interception capacity. The measurement of rainwater interception in plants is primarily conducted by manually wetting the surface of the organs using methods such as immersion [4,13,14] and artificial simulated rainfall [15,16,17].
The immersion method is currently the primary method used to measure the interception of rainwater by tree organs. This method involves immersing the tree organs in rainwater or distilled water that has been collected for a specific duration. Afterward, the organs are removed, and the difference between their fresh weight and wet weight is measured [4,13,18]. This measurement represents the amount of rainwater intercepted by the organs [19].
Two main findings can be extracted from research on organ rainwater interception using the immersion method. The first is that the rainwater interception capacities of branches and trunks are significantly greater than that of leaves. Additionally, there are significant variations in the interception of rainwater by different types of vegetation [13,14]. The results of one specific study showed that the rainwater interception capacity of Herwitz [20] of branches and trunks of tropical rainforest tree species ranged from 0.12 mm to 0.72 mm [20]. Leyton [21], Crockford [14], and others have found that the rainwater interception capacity values of branches and trunks of various Eucalyptus species range from 0.07 to 0.92 mm. The rainwater interception values of broad-leaved trees, eucalyptus, and tropical rainforest trees [15,20] range from 0.07 mm to 0.11 mm. In a study on coniferous trees, the rainwater interception of branches of Picea koraiensis [22], Taxodium ascendens [13], and Pinus densiflora [4] ranged from 0.13 mm to 1.26 mm. However, studies on coniferous tree species such as Pinus elliottii [13], Taxodium ascendens [13], Pinus sylvestris [4], Pinus radiata [23], Pinus pinaster [24], and Picea sitchensis [25] have shown that leaf rainwater interception values range from 0.1 mm to 0.16 mm. The second key finding is that there are significant differences in rainwater interception capacity values between shrub and tree leaves. The rainwater interception capacity of shrubs such as Caragana korshinskii, Hedysarum scoparium, and Artemisia ordosica, as studied by Wang [26] using the immersion method, ranges from 0.39 mm to 0.61 mm. This capacity is higher than that of tree leaves in previous studies. The measurement of rainwater interception based on tree organs, particularly leaves, using the immersion method is influenced by various factors, and its value varies significantly across different studies [14,15,27]. The factors that influence this fluctuation include the growth area of the tree, immersion time [4,13,14,18,20,28,29], whether the branch section is sealed, whether the blade is calculated on one side or both sides, and whether the air flow is taken into consideration. For the same species of Eucalyptus (Eucalyptus manniferu), Aston [15] measured 0.07 mm, while Crockford [14] measured 0.01–0.04 mm. For the leaf immersion time, Liu [13] argues that a shorter time aligns better with the actual rainwater interception function of leaves. Therefore, the recommended leaf immersion time is only 3 s. On the other hand, Llorens [4] believes that for maximum rainwater interception, the leaf needs to be fully soaked, requiring a longer immersion time of 60 min. Additionally, the immersion time for branches and bark is even longer, ranging from 1 to 72 h [13,14,20,28,29]. Under windy conditions, the rainwater interception capacity of the blade is significantly reduced. Herwitz [20] studied the rainwater interception capacity of leaves from various tropical rainforest trees, including Eucalyptus [15], as well as other broad-leaved trees. This study revealed that under windy conditions, the rainwater interception per unit area of leaves from broad-leaved trees would be reduced by 64–73%. In windy conditions, the reduction would be 59–85%. The coniferous rainwater interception capacity values of Pinus sylvestris were 0.10 mm and 0.04 mm under calm and windy conditions [4].
The immersion method is used to measure the water absorption capacity of an organ’s surface under static conditions. In actual rainfall, organs are affected by factors such as rainfall intensity, rainfall duration, the dynamic impact of raindrops, and other variables. These factors can lead to dissimilation. Yu Kailiang [19] employed various techniques to assess the leaves of a single tree. Their findings revealed that the rainwater interception of the leaves, as measured using the artificial simulated rainfall method, was greater than that measured using the immersion method. It was speculated that the reason for this was that the continuous droplets formed on the surface of the leaves during the artificial simulated rainfall increased the interception of rainfall [30]. At present, artificial simulated rainfall moisture tests are generally conducted in laboratories. In these tests, the samples are placed under a simulated rainfall device, and the maximum rainwater interception capacity of trees is calculated by measuring the weight difference of the samples before and after rainfall [15,31]. The factors that affect the determination of rainwater interception include the intensity and duration of rainfall. The research object of rainwater interception using artificial simulation methods is typically the entire tree. Limited by experimental conditions, this test primarily focuses on the seedling stage of the experimental object, making it challenging to determine the characteristics of larger tree species or mature trees. In Aston’s study, eucalyptus seedlings [15,20] were selected, while in Li’s study, seedlings at an early growth stage were chosen. For the determination of rainfall intensity, current research primarily focuses on the requirements for controlling soil and water loss in natural areas. The simulated rainfall intensity is usually more than 20 mm/h [15,32] for heavy rain and rainstorm intensity [15,16,26,29]. In many artificial simulated rainfall experiments, only one rainfall intensity is set; only a few experiments have multiple rainfall intensities [32,33].
At present, related research mainly uses the methods of immersion and artificial rainfall to wet the surface of organs. The immersion method focuses on tree organs as the subject, but it does not consider specific rainfall conditions. As a result, it cannot accurately determine the rainwater interception capacity of tree organs under varying rainfall intensities and durations. Artificial simulation rainfall methods can better simulate the natural wetting process [29,32] and are more widely used. However, current research primarily focuses on small trees or immature seedlings, making it challenging to determine the rainwater interception capacity of mature tree organs. Moreover, to quickly maximize the interception of rainfall by plants, the rainfall intensity needs to be set to more than 20 mm/h. Previous studies that have utilized artificial rainfall simulations have primarily concentrated on examining the dynamics of soil erosion and water runoff during high-intensity rainfall events [15,34,35]. Furthermore, research on rainwater interception in natural forest canopies has primarily focused on heavy rainfall intensities, typically ranging from 10 to 150 mm/h [16,31,36,37,38]. However, there is a noticeable gap in the availability of artificial rainfall simulation devices capable of accurately replicating the specific rainfall patterns characteristic of urban areas.
This is significantly higher than the current natural rainfall conditions during rainstorms, which are typically greater than 16 mm/h [39,40]. This setting ignores the impact of different rainfall conditions, especially in Shanghai’s urban areas, where 90% of rainfall intensity is less than 10 mm/h [41]. Therefore, to accurately quantify the rainwater interception capacity of tree crowns under natural rainfall conditions, it is necessary to systematically establish rainfall intensity and duration conditions based on the characteristics of urban rainfall. This would allow for the implementation of artificial simulation experiments to study the wetting of organ surfaces.
In this study, we used the artificial rainfall simulation method to measure the rainwater interception process of tree organs and attempted to address the following three topics:
- The rainwater interception process of different plant life forms and tree organs.
- The differences in the rainwater interception capacity values of different tree organs.
- The rainwater interception capacity of common tree organs in Shanghai.
2. Materials and Methods
In this study, we simulated the process of rainfall to wet the surface of the organs and measured the interception of rainwater by calculating the changes in organ weight before and after the rainfall.
2.1. Research Site
The tree organ sampling points were located at the Minhang Campus of Shanghai Jiao Tong University at the following coordinates: 31°01′12″ N, 121°25′33″ E. The campus is located in the southwest of Shanghai’s Minhang District (Figure 1), spanning an area of 309.25 hectares. It has a rich variety of plant species, with 314 species belonging to 74 families and 188 species, including the main tree species that are commonly found in gardens and green spaces in Shanghai. The trees were planted more than 20 years ago under favorable environmental conditions and have been properly managed [42], resulting in robust growth. The simulated rainfall experiments were conducted in the controlled greenhouse of the School of Agriculture and Biology at Shanghai Jiao Tong University (Figure 1). The use of a controlled greenhouse prevented the influence of ambient air flow, temperature, and wind speed changes on the measurement of rainwater interception capacity.
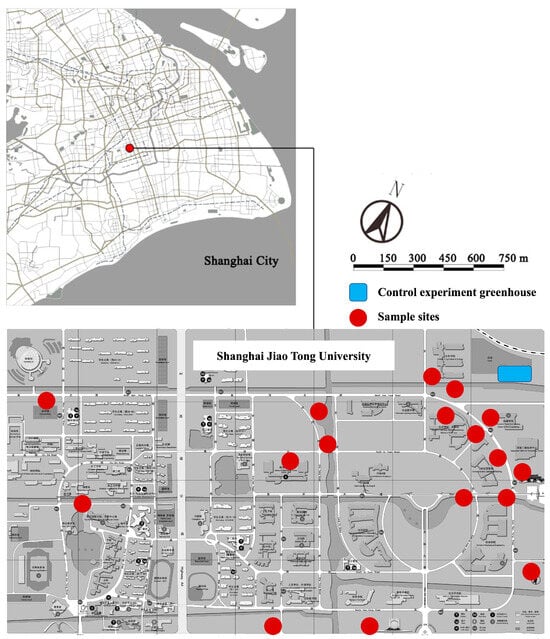
Figure 1.
The location of study area.
2.2. Tree Species
According to the results of a study on the characteristics of urban vegetation types in Shanghai [43], the plant communities in the central urban area of Shanghai mainly consist of deciduous and evergreen broad-leaved forests. The second most common vegetation types are evergreen deciduous broad-leaved mixed and evergreen coniferous forests. In this study, five species of evergreen broad-leaved, three species of deciduous broad-leaved, and two species of coniferous trees in Shanghai were selected (Table 1), including Golden Rain Tree (Koelreuteria paniculata Laxm., KOP), London Planetree (Platanus × acerifolia (Aiton) Willd., PCA), Japanese zelkova (Zelkova serrata (Thunb.) Makino, ZES), Camphor Tree (Cinnamomum camphora Nees ex Wall., CIC), Japanese blueberry tree (Elaeocarpus decipiens Hemsl., ELD), Glossy privet (Ligustrum lucidum Ait., LIL), Southern magnolia (Magnolia Grandiflora L., MAG), Fragrant tea olive (Osmanthus fragrans Lour., OSF), Deodar cedar (Cedrus deodara (Roxb. ex D. Don) G. Don, CED), Dawn redwood (Metasequoia glyptostroboides Hu & W. C. Cheng, MEG).

Table 1.
Species selected for the study.
2.3. Tree Organ Sample Collection
We selected 20 specimen trees of each species from the Minhang campus of SJTU (Figure 1). Organ samples were collected from the specimen trees before conducting the simulated rainfall experiment. The collected samples were placed in the incubator and then transferred to the greenhouse for experimentation.
2.3.1. Leaf Collection
Before conducting each rainwater interception measurement experiment, we randomly selected 100 leaves from different positions on specimen trees of a specific tree species (Figure 2) that displayed healthy growth and showed no signs of dryness, disease, or infection via insects or pests (Figure 3). A total of 4000 leaf samples were collected for 40 rainfall events in this study.
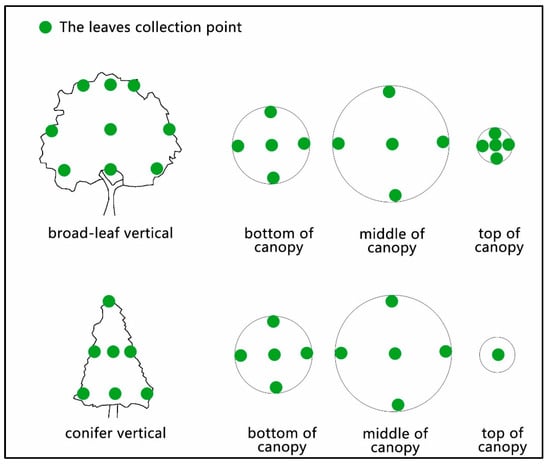
Figure 2.
Collection position of leaves. For broad-leaved tree species, leaf samples were randomly selected from 15 positions within the tree canopy. For conifer tree species, leaf samples were randomly selected from 11 positions within the tree canopy.
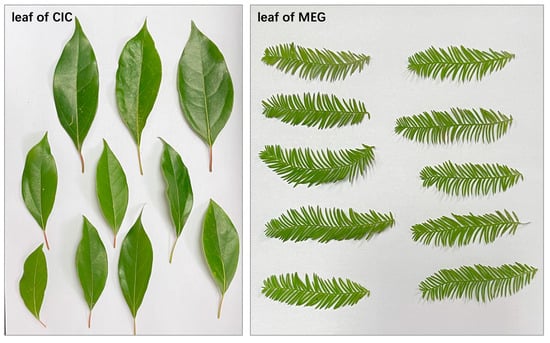
Figure 3.
Photos of organ samples. Leaf of CIC—a group of Camphor Tree leaf samples; leaf of MEG—a group of Dawn redwood leaf samples.
2.3.2. Branch Collection and Sample Preparation
The diameter of a tree’s branches significantly affects its capacity to intercept rainwater [39]. Therefore, based on the growth patterns of their branches, the trees were classified into three classes. Regarding the branches of the 10 tree species in this study, the diameter of the first class ranges from 1.38 cm to 3.68 cm, the second class ranges from 0.81 cm to 2.09 cm, and the third class ranges from 0.18 cm to 0.99 cm (Table 2).

Table 2.
Branch diameter values of the ten tree species under study.
Branch samples were collected from selected specimen trees of a specific tree species before each simulated rainfall experiment. The branch samples were sorted and cut according to their classifications after their leaves were removed. Each class of branch samples was standardized to a length of 10 cm (Figure 4), with three branches for each of the three classes, resulting in a total of 90 branch samples for each rainfall experiment. The cross sections of the branch samples were sealed with impermeable silica gel to prevent water from entering the xylem during the rainfall test. A total of 3600 branch samples were collected for 40 rainfall events in this study.
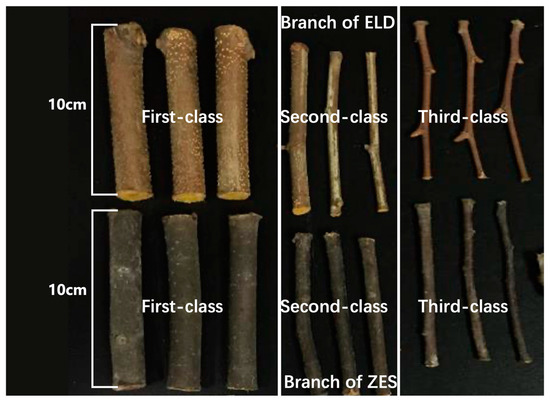
Figure 4.
Photos of branch samples. Branch of ELD—a group of Japanese blueberry tree branch samples with three first-class branches, three second-class branches, and three third-class branches; Branch of ZES—a group of Japanese zelkova branch samples with three first-class branches, three second-class branches, and three third-class branches.
2.3.3. Bark Collection and Sample Preparation
The bark samples were cut from the stem phloem of specimen trees. Each sample had a side length ranging from 3 cm to 5 cm. We collected 30 bark samples from a specific tree species for each rainfall experiment. Except for the outer surface of the bark samples, the other five surfaces were sealed with impermeable silicone to prevent water from entering the xylem during the rainfall test. A total of 1200 bark samples were collected for 40 rainfall events in this study.
2.4. Artificial Rainfall Simulation System
We designed and constructed an artificial simulation rainfall system (ARSS, Figure 5), which was established using a variable frequency water pump, nozzle, pipe, and water tank. The variable frequency water pump and nozzle controlled the water pressure and angle, enabling it to provide a range of rainfall intensities from 4 mm/h to 16 mm/h.
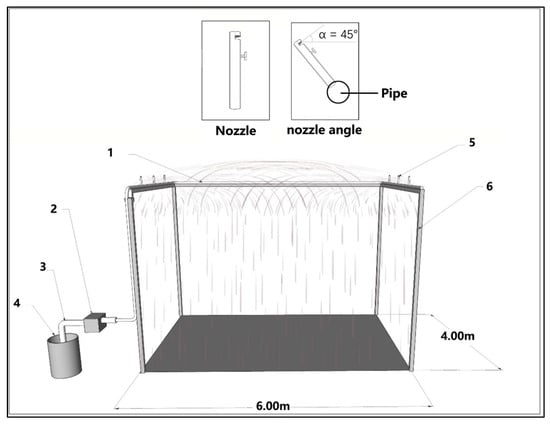
Figure 5.
Artificial rainfall simulation system (ARSS). Note: 1. Water pipe, φ = 15 mm; 2. variable frequency water pump, power 900 W; 3. suction pipe, φ = 25 mm; 4. water tank, volume = 500 L; 5. outlet nozzle; 6. outer frame of simulated rainfall, 6 m × 4 m × 10 m.
Based on an analysis of 30 years of data on rainfall in Shanghai, it was observed that approximately 90% of rainfall events had an intensity of less than 4 mm/h [44,45], and that of rainstorms was at least 16.0 mm/h [39,40]; hence, for our study, we selected rainfall intensities of 4 mm/h, 8 mm/h, 12 mm/h, and 16 mm/h.
Additionally, in order to maximize rainwater interception by tree organs, previously, some researchers [16,36,46] have conducted rainfall duration experiments ranging from 10 min to 150 min, and according to the Chinese drainage design standards [47] and the results of a study of rainfall duration in Shanghai [48], rainfall duration ranges from 10 min to 180 min. Considering the results of the above-mentioned study and the Chinese standards, to ensure that every organ reached its peak of rainwater interception, we set the rainfall duration to 180 min.
Rainfall, along with its uniformity, was measured using a rainfall gauge (Davis 7825, CA, USA). The actual evenness of the 40 rainfall events ranged from 90.4% to 94.4%. The average actual rainfall intensities of 4 mm/h, 8 mm/h, 12 mm/h, and 16 mm/h were 4.23 ± 0.32 mm, 8.26 ± 0.17 mm, 12.09 ± 0.59 mm, and 16.25 ± 0.46 mm, respectively (Table 3). The results showed that the distribution of rainfall was uniform and that it met the test requirements.

Table 3.
Simulated rainfall information.
2.5. Experimental Design
We conducted 40 simulated rainfall experiments using ARSS, considering 4 rainfall intensities for each tree species. To minimize the chances of the tree organs being affected by wilting and/or sunburn during in vitro sampling, the sampling and experiments were conducted in late summer and early autumn. The specific time was from September to November in 2018 and 2019.
For each rainfall experiment, we prepared 10 groups of leaves, with each group containing 10 leaf samples. We also prepared 10 groups of branches, with each group containing 9 branch samples. Additionally, we prepared 10 groups of bark, with each group containing 3 bark samples.
The experimental procedure for testing rainwater interception process and capacity involves a series of steps. First, the average fresh weight (FW, g) and area (A) of each sample group were measured. Secondly, a predetermined rainfall intensity was established, and 10 groups of leaves, 10 groups of branches, and 10 groups of bark were placed in ARSS. Thirdly, the ARSS was activated and remained in operating mode. We extracted one group of leaves, one group of branches, and one group of bark at each rainfall time interval (5, 10, 20, 30, 50, 70, 90, 120, 150, and 180 min, respectively). Then, the weight of organ samples with rainwater (RW, g) was measured immediately after extraction. The organ rainwater interception at rainfall time t (It, mm) was calculated as follows:
where:
It represents the rainwater interception of organ at time t (mm), RWt represents the organ weight with rainwater at time t (g), FW represents the flesh weight of organ sample (g), A represents the area of organ surface, and t represents the rainfall time (min).
The capacity of rainwater interception will increase with the duration of rainfall. However, it is not clear what the maximum capacity of rainwater interception is because the value continues to rise even after the experiment ended [14,15,20]. This study introduces an adsorption kinetic equation to address this issue. The equation accurately predicts rainwater interception via a calculation.
The specific analysis methods are as follows: Origin 2018 software was used to fit curves. Firstly, we input the It value into Origin. Then, we used the pseudo-first-order adsorption kinetic equation (Formula (2)) and the pseudo-second-order adsorption kinetic equation (Formula (3)) as our curve fitting functions in the Origin software, respectively. Lastly, we executed the calculation in the software and waited for the result to be generated. The results concluded the following parameters: rainwater interception capacity (Ie), the rate constant of the pseudo-first-order adsorption kinetic equation (K1), the rate constant of the pseudo-second-order adsorption kinetic equation (K2). The pseudo-first-order kinetic model assumes that rainwater interception is controlled by diffusion steps, while the pseudo-second-order kinetic model assumes that rainwater interception is controlled by a chemical adsorption mechanism.
The pseudo-first-order adsorption kinetic equation is as follows:
The pseudo-second-order adsorption kinetic equation is as follows:
where:
Ie represents the rainwater interception capacity (mm), It represents the rainwater interception at time t (mm), K1 represents the rate constant of the pseudo-first-order adsorption kinetic equation, K2 represents the rate constant of the pseudo-second-order adsorption kinetic equation, t represents the rainfall time (min).
After the fitting curves, we obtained the value of the correlation coefficient (R2) of the pseudo-first-order and pseudo-second-order adsorption kinetic equation. The correlation coefficient (R2) has a value ranging from 0 to 1. The closer the value of R2 is to 1, the better the equation explains the process of rainwater interception by organs. According to the correlation coefficient (R2), we could select the most appropriate fitting equation, and the rainwater interception capacity of organs could be calculated by the better equation.
2.6. Statistical Analysis
An analysis of variance (ANOVA) was used to compare the average rainwater interception of different organs, and this analysis was conducted using SPSS 26.0 (Microsoft, Redmond, DC, USA). If the significance value (p) was less than 0.05, that meant that there were significant differences between the three organs.
3. Results
3.1. Dynamic Analysis of Rainwater Interception Process of Tree Organs
The fitting lines of the pseudo-first-order adsorption kinetic equation and the pseudo-second-order adsorption kinetic equation for organ rainwater interception are shown in Figure 6, Figure 7 and Figure 8. The fitting lines of the pseudo-second-order adsorption kinetic equation are more consistent with the process of rainwater interception. In the first 50 min, the interception of rainwater increased rapidly; after that, the rate of increase gradually slowed down and eventually reached a state of equilibrium.
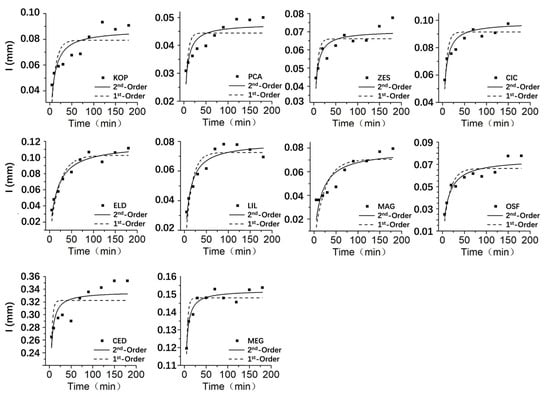
Figure 6.
Leaf rainwater interception process fitting. Note: I—rainwater interception (mm); 1st-order—the pseudo-first-order adsorption kinetic equation; 2nd-order—the pseudo-second-order adsorption kinetic equation; KOP—Golden Rain Tree; PCA—London Planetree; ZES—Japanese zelkova; CIC—Camphor Tree; ELD—Japanese blueberry tree; MAG—Southern magnolia; OSF—Fragrant tea olive; CED—Deodar cedar; MEG—Dawn redwood.
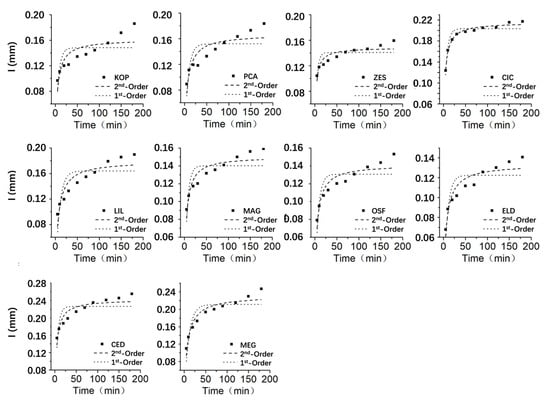
Figure 7.
Branch rainwater interception process fitting. Note: I—rainwater interception (mm); 1st-order—the pseudo-first-order adsorption kinetic equation; 2nd-order—the pseudo-second-order adsorption kinetic equation; KOP—Golden Rain Tree; PCA—London Planetree; ZES—Japanese zelkova; CIC—Camphor Tree; ELD—Japanese blueberry tree; MAG—Southern magnolia; OSF—Fragrant tea olive; CED—Deodar cedar; MEG—Dawn redwood.
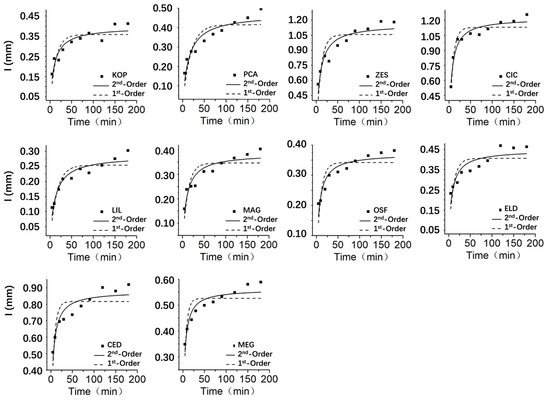
Figure 8.
Bark rainwater interception process fitting. Note: I—rainwater interception (mm); 1st-order—the pseudo-first-order adsorption kinetic equation; 2nd-order—the pseudo-second-order adsorption kinetic equation; KOP—Golden Rain Tree; PCA—London Planetree; ZES—Japanese zelkova; CIC—Camphor Tree; ELD—Japanese blueberry tree; MAG—Southern magnolia; OSF—Fragrant tea olive; CED—Deodar cedar; MEG—Dawn redwood.
3.2. Analysis of Dynamic Parameters of Rainwater Interception by Tree Organs
To analyze the variation in rainwater interception among different types of leaves over time, we calculated the average values for four simulated rainfall events based on 10 time intervals. Each average value was based on 40 leaves, 36 branches, and 12 bark samples. The fitting of the curves for rainwater interception and time of leaves was carried out using pseudo-first-order and pseudo-second-order dynamic equations. The results are shown in Table 4, Table 5 and Table 6.

Table 4.
Leaf rainwater interception adsorption kinetic fitting parameters of different tree species. Ie represents the rainwater interception at equilibrium (mm); K1 represents the rate constant of the pseudo-first-order adsorption kinetic equation; K2 represents the rate constant of the pseudo-second-order adsorption kinetic equation; R2 represents the coefficient of determination (ranging from 0 to 1). The closer R2 is to 1, the better the fitting equation can explain the changes in rainwater interception.

Table 5.
Branch rainwater interception adsorption kinetic fitting parameters of different tree species. Ie represents the rainwater interception at equilibrium (mm); K1 represents the rate constant of the pseudo-first-order adsorption kinetic equation; K2 represents the rate constant of the pseudo second-order adsorption kinetic equation; R2 represents the coefficient of determination (ranging from 0 to 1). The closer R2 is to 1, the better the fitting equation can explain the changes in rainwater interception.

Table 6.
Bark rainwater interception adsorption kinetic fitting parameters of different tree species. Ie represents the rainwater interception at equilibrium (mm); K1 represents the rate constant of the pseudo-first-order adsorption kinetic equation; K2 represents the rate constant of the pseudo-second-order adsorption kinetic equation; R2 represents the coefficient of determination (ranging from 0 to 1). The closer R2 is to 1, the better the fitting equation can explain the changes in rainwater interception.
The fitting results indicate that the pseudo-second-order kinetic model has a higher correlation coefficient (R2) compared to the pseudo-first-order kinetic model when fitting the process of organ rainwater interception. This suggests that the process of organ rainwater interception and adsorption aligns better with the pseudo-second-order kinetic equation, indicating that the adsorption process is similar to chemical adsorption [49].
3.3. Rainwater Interception in Different Tree Organs
In this section, we analyze the differences in average organ rainwater interception values among the ten trees that were tested. The aim was to characterize the variations in rainwater interception capacity among different organs of common trees in urban areas, as well as to compare and analyze the differences in rainwater interception among the ten tree species.
According to the calculation results of the pseudo-second-order adsorption kinetic equation (Table 4, Table 5 and Table 6), the rainwater interception capacity of the leaves from the ten urban trees ranged from 0.05 mm to 0.34 mm. The Deodar cedar leaves exhibited the highest rainwater interception capacity, whereas the London planetree leaves showed the lowest capacity. The rainwater interception capacity of two coniferous trees was greater than that of broad-leaved trees. The rainwater interception capacity of 10 urban tree branches ranged from 0.13 mm to 0.24 mm. The branches of the Deodar cedar had the highest rainwater interception capacity, while the branches of the Japanese blueberry tree had the lowest rainwater interception capacity. The rainwater interception capacity of two coniferous tree branches was higher than that of broad-leaved tree branches. The rainwater interception capacity of ten urban tree barks ranged from 0.29 mm to 1.22 mm. The Camphor tree bark exhibited the highest rainwater interception capacity, whereas the Glossy privet bark had the lowest capacity.
The mean rainwater interception values in different organs of the ten tested trees were significantly different (p < 0.05). Additionally, there were significant differences between the bark and leaf, as well as between the bark and branch (p < 0.05). The rainwater interception in bark was significantly greater than that in the leaves and branches, but there was no significant difference between the leaves and branches. Specific to each tree species, the results of our analysis of variance regarding the rainwater interception in different organs (Figure 9) showed that, for Deodar cedar, the order of rainwater interception in the organs was as follows: bark > leaves > branches. For the other nine tree species, the order of rainwater interception was as follows: bark > branches > leaves. Duncan’s multiple comparison results showed that there were two types of differences in rainwater interception among the ten tree organs. One finding was that there was no significant difference in rainwater interception between leaves and branches, but there were significant differences between them and bark (p < 0.05). This was observed in various tree species, including Golden rain Tree, Japanese blueberry tree, and Deodar cedar. The other reason was that there were significant differences in rainwater interception among the leaves, branches, and bark (p < 0.05), including for London planetree, Japanese zelkova, Camphor tree, Glossy privet, Fragrant tea olive, and Dawn redwood.
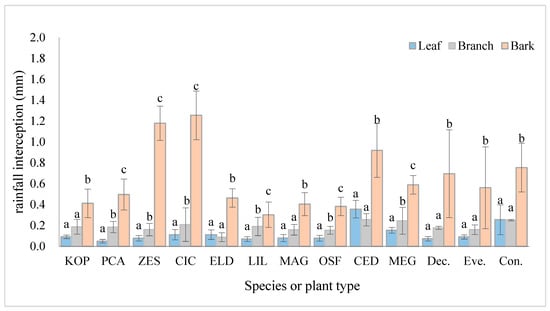
Figure 9.
Mean rainwater interception values in different organs of ten species. Note: a, b, c—the same letter indicates no significant difference, and different letters indicate a significant difference. KOP—Golden Rain Tree; PCA—London Planetree; ZES—Japanese zelkova; CIC—Camphor Tree; ELD—Japanese blueberry tree; MAG—Southern magnolia; OSF—Fragrant tea olive; CED—Deodar cedar; MEG—Dawn redwood; Dec.—Deciduous broad-leaved; Eve.—Evergreen broad-leaved; Con.—Coniferous.
The results of our analysis of variance (Figure 9) showed that the order of leaf rainwater interception capacity was as follows: coniferous > evergreen broad-leaved > deciduous broad-leaved. The rainwater interception capacity of coniferous trees was significantly higher than that of deciduous broad-leaved and evergreen broad-leaved trees (p < 0.05). However, there was no significant difference between deciduous broad-leaved and evergreen broad-leaved trees (p > 0.05). The order of rainwater interception capacity was as follows: coniferous > deciduous broad-leaved > evergreen broad-leaved. The rainwater interception capacity of coniferous trees was significantly higher than that of deciduous broad-leaved and evergreen broad-leaved trees (p < 0.05). However, there was no significant difference between the rainwater interception capacity of deciduous broad-leaved and evergreen broad-leaved trees (p > 0.05). The order of bark rainwater interception capacity was as follows: coniferous > deciduous broad-leaved > evergreen broad-leaved. The rainwater interception capacity of coniferous branches was significantly higher than that of deciduous broad-leaved and evergreen broad-leaved trees (p < 0.05). There was no significant difference in bark rainwater interception capacity among the three life forms.
4. Discussion
The capacity of tree organs to intercept rainwater is a result of the long-term evolutionary process, which is influenced by rainfall characteristics and the tree’s living environment. This capacity reflects how effectively tree organs utilize rainwater and emphasizes the role of trees in the water cycle.
4.1. Differences in Rainwater Interception Capacity among Tree Species’ Organs
In this study, significant variations were observed in the rainwater interception capacity of organs among the different tree species that were tested. The rainwater interception capacity of leaves from 10 tree species ranged from 0.05 mm (London planetree) to 0.34 mm (Deodar cedar). The rainwater interception of branches ranged from 0.13 mm (Japanese blueberry tree) to 0.24 mm (Deodar cedar). The rainwater interception capacity of bark ranged from 0.29 mm (Glossy privet) to 1.22 mm (Camphor tree). This is similar to the findings of previous studies on the rainwater interception capacity of leaves and branches in different tree species, such as slash pine (Taxodium ascendens), blue fruit tree [13], Pinus densiflora [4], and Eucalyptus [15,20]. There are three reasons for the variation in rainwater interception capacity among the different trees. Firstly, the surface characteristics of organs in different tree species can cause differences in rainwater interception capacity. Bark and branches are thicker than leaves, providing more space for water storage to intercept rainfall [13]. Additionally, the rough surface of the bark and branches helps to retain water. In contrast, the leaf surface is smoother, and the petiole cannot hold the leaf when there is excessive water on the leaf surface. These two reasons allow water droplets to slip off the leaf surface [16,26]. Secondly, the use of different measurement methods can also lead to discrepancies. Some studies have shown that the amount of rainwater interception capacity, as measured using artificial simulated rainfall, is higher than that measured using the immersion method [19,27,29,32,50]. Additionally, different intensities of artificially simulated rainfall can also yield varying measurement results [39,51,52].
4.2. Differences in Rainwater Interception Capacity among Different Tree Organs
In this study, the results regarding the rainwater interception of different organs of 10 trees were as follows: the average rainwater interception of leaves was 0.12 mm (±0.08), the average rainwater interception of branches was 0.18 mm (±0.05), and the average rainwater interception of bark was 0.64 mm (±0.33). The order of the rainwater interception ability of the leaves, branches, and bark was as follows: bark > branches > leaves. There was no significant difference in rainwater interception between leaves and branches. However, there were significant differences between bark and leaves (p < 0.05), as well as between bark and branches (p < 0.05). Additionally, the rainwater interception of bark was significantly greater than that of the leaves and branches, consistent with previous research findings. In the studies of Liu [13], Herwitz [20], Aston [15], Llorens [4], the rainwater interception of leaves ranged from 0.01 mm to 0.10 mm, and in the studies of Liu [13] and Llorens [4], the rainwater interception of branches and bark ranged from 0.48 mm to 1.26 mm. These results showed that the rainwater interception of rainwater in branches and bark was higher than that in leaves [53] because the rainwater interception of rainwater in branches and bark was higher than that in leaves [4,13] in terms of unit area and crown surface area [20]. Regarding the results of the present study, there are two laws for the rainwater interception values of the different organs of the ten specific tree species: The first is that there is no significant difference in rainwater interception between leaves and branches, and there are significant differences between leaves and bark and between branches and bark (p < 0.05), and the rainwater interception of bark is significantly greater than that of leaves and branches, including in Golden rain tree, Japanese blueberry tree, Southern magnolia, Deodar cedar. The second law pertains to rainwater interception. The order of rainwater interception was as follows: bark > branches > leaves. These results held true for Platanus acerifolia, Zelkova, Deodar cedar, Glossy privet, Fragrant tea olive, and Dawn redwood. The latter law is similar to the findings reported in the existing research. Herwitz [20] conducted a study on mature Eucalyptus in similar areas. The results of the study showed that the rainwater interception capacity of branches was significantly greater than that of leaves. Previous research on coniferous trees has also shown that the rainwater interception capacity of branches and bark is significantly greater than that of leaves [4,13].
4.3. Differences in Rainwater Interception Capacity of Different Life Forms of Tree Species
Among the ten tree species tested in this study, the order of rainwater interception based on trees’ leaves, branches, and bark was as follows: coniferous trees > broad-leaved trees. There was a significant difference in the rainwater interception of leaves among tree species of different life forms [4,13,23,24,25]. This finding is consistent with previous studies reporting that coniferous tree species have a greater ability to intercept rainwater compared to broad-leaved tree species. However, there was no significant difference in rainwater interception between broad-leaved forests and coniferous forests [4,13,14,20,22]. The reasons why coniferous leaves have a stronger rainwater interception ability compared to broad-leaved trees are as follows: Firstly, coniferous leaves have been found to have a stronger rainwater interception ability. The reason for this is that coniferous leaves have less surface area than broad leaves, so they intercept more rainwater per unit area. Another reason is that coniferous trees, such as the Deodar cedar, have 10–15 needle-like leaves growing together and in a funnel-like shape; this unique structure allows them to hold water droplets, enabling coniferous leaves to intercept more rainwater [14,15,27]. Secondly, the growth structure of coniferous leaves is mostly clustered, which leads to raindrops being trapped between two or more coniferous needles [4], thereby increasing their rainwater interception capacity.
4.4. Differences between the Rainwater Interception Capacity Values of Tree Organs in Urban and Natural Areas
In this study, the interception of rainwater by the leaves of broad-leaved trees ranged from 0.05 mm to 0.12 mm, which is consistent with the findings of Aston [15] and Herwitz [20], who studied the rainwater interception of tropical broad-leaved trees (0.01 mm–0.18 mm). In this study, the leaf rainwater interception of coniferous tree species ranged from 0.15 mm to 0.36 mm. The results of previous studies on the leaf rainwater interception of various coniferous tree species, including Slash pine (Pinus elliottii) [13], Bald cypress (Taxodium ascendens) [13], Scots pine (Pinus sylvestris) [4], Monterey Pine (Pinus radiata) [23], Maritime pine (Pinus pinaster) [24], and Sitka spruce (Picea sitchensis) [25], show that leaf rainwater interception for the aforementioned trees ranges from 0.10 mm to 0.16 mm.
According to the research findings on selected tree species, urban common coniferous trees have a higher rainwater interception capacity compared to natural coniferous trees. This finding aligns with previous research that shows that urban tree species have a higher overall rainwater interception rate compared to natural areas [6,54]. According to the results of this experiment and existing research, we can explain the differences in the rainwater interception capacity and natural area of urban tree organs in this study from two aspects. One aspect is the difference in the morphological structures of the tree organs. In response to changes in urban air quality and rainfall patterns, as well as the impact of artificial pruning, urban trees undergo various changes in plant physiology, morphological structure, and even the surface structure of their organs. These changes result in alterations in their capacity to intercept rainwater. Another factor is the variability in rainfall conditions, which varies across different studies. In this study, rainfall intensity was simulated to mimic urban rainfall characteristics. However, in studies on rainwater interception by trees in natural environments, due to experimental limitations and varying objectives, most studies use a higher rainfall intensity. Nonetheless, there are only slight differences in the results. The findings of this study indicate that increasing or decreasing rainfall intensity to a certain extent can affect the rainwater interception of trees. This is one of the reasons why the rainwater interception values reported in this study differ from those of studies on trees in natural areas.
5. Conclusions
The results of this study demonstrate that significant variation exists among the rainwater interception capabilities of different tree species. In our study, bark exhibited the greatest rainwater interception ability, while there was no significant difference in rainwater interception ability between the branches and leaves of the ten selected species. Coniferous tree species have a greater ability to intercept rainwater than broad-leaved tree species. There are also differences in terms of rainwater interception ability between trees in urban areas and those in natural areas, which may be attributed to the differences in the physiological and morphological characteristics of these areas’ trees.
To gain a deeper understanding of the mechanisms and functions of tree rainwater interception, future research should focus on the rainwater interception strategies employed by various tree species in different habitats. Additionally, it is important to examine the internal and external factors that influence rainwater interception.
Author Contributions
Conceptualization, B.W. and J.G.; methodology, J.G.; validation, Y.Z.; formal analysis, Y.Z.; investigation, J.G.; data curation, J.G.; writing—original draft preparation, B.W. and J.G.; writing—review and editing, J.G.; visualization, Y.Z. All authors have read and agreed to the published version of the manuscript.
Funding
This research article was funded by the Shanghai Engineering Research Center of Urban Trees Ecological Application (grant number: 17DZ2252000) and the 2023 Shanghai Botanical Garden Youth Project (grant number: ZWQ202304).
Institutional Review Board Statement
Not applicable.
Informed Consent Statement
Not applicable.
Data Availability Statement
The data presented in this study are available on request from the corresponding author. The data are not publicly available due to further studies will use the data which presented in this article.
Conflicts of Interest
The authors declare no conflict of interest.
References
- Wang, L.; Ge, M.; Chen, N.; Ding, J.; Shen, X. An Evaluation Model of Riparian Landscape: A Case in Rural Qingxi Area, Shanghai. Land 2022, 11, 1512. [Google Scholar] [CrossRef]
- Shen, X.; Sun, Q.; Mosey, G.; Ma, J.; Wang, L.; Ge, M. Benchmark of plant-based VOCs control effect for indoor air quality: Green wall case in smith campus at Harvard University. Sci. Total Environ. 2023, 906, 166269. [Google Scholar] [CrossRef] [PubMed]
- Shen, X.; Ge, M.; Handel, S.N.; Wang, W.; Jin, Z.; Kirkwood, N.G. Advancing environmental design with phytoremediation of brownfield soils using spontaneous invasive plants. Sci. Total Environ. 2023, 883, 163635. [Google Scholar] [CrossRef] [PubMed]
- Llorens, P.; Gallart, F. A simplified method for forest water storage capacity measurement. J. Hydrol. 2000, 240, 131–144. [Google Scholar] [CrossRef]
- Shen, X.; Chen, M.; Ge, M.; Padua, M.G. Examining the conceptual model of potential urban development patch (PUDP), VOCs, and food culture in urban ecology: A case in Chengdu, China. Atmosphere 2022, 13, 1369. [Google Scholar] [CrossRef]
- Crockford, R.; Richardson, D. Partitioning of rainfall in a eucalypt forest and pine plantation in southeastern Australia: IV The relationship of interception and canopy storage capacity, the interception of these forests, and the effect on interception of thinning the pine plantation. Hydrol. Process. 1990, 4, 169–188. [Google Scholar] [CrossRef]
- Alves, P.L.; Formiga, K.T.M.; Traldi, M.A.B. Rainfall interception capacity of tree species used in urban afforestation. Urban. Ecosyst. 2018, 21, 697–706. [Google Scholar] [CrossRef]
- Guevara-Escobar, A.; Edwards, W.R.N.; Morton, R.H.; Kemp, P.D.; MacKay, A.D. Tree water use and rainfall partitioning in a mature poplar-pasture system. Tree Physiol. 2000, 20, 97–106. [Google Scholar] [CrossRef] [PubMed]
- Asadian, Y.; Weiler, M. A New Approach in Measuring Rainfall Interception by Urban Trees in Coastal British Columbia. Water Qual. Res. J. Can. 2009, 44, 16–25. [Google Scholar] [CrossRef]
- Zabret, K.; Sraj, M. Rainfall interception by deciduous and coniferous trees in an urban area. In Proceedings of the EGU General Assembly Conference Abstracts, Vienna, Austria, 12–17 April 2015; p. 745. [Google Scholar]
- Campellone, S.V. An Investigation into the Factors Affecting Street Tree Rainfall Interception; Drexel University. Ph.D. Thesis, Drexel University, Philadelphia, PA, USA, 2018. [Google Scholar]
- Wang, Y. The rainfall characters under canopy of several tree species. Sci. Silvae Sin. 2001, 37, 2–9. [Google Scholar] [CrossRef]
- Liu, S. Estimation of rainfall storage capacity in the canopies of cypress wetlands and slash pine uplands in North-Central Florida. J. Hydrol. 1998, 207, 32–41. [Google Scholar] [CrossRef]
- Crockford, R.; Richardson, D. Partitioning of rainfall in a Eucalypt forest and Pine plantation in southeastern Australia: III Determination of the canopy storage capacity of a dry sclerophyll Eucalypt forest. Hydrol. Process. 1990, 4, 157–167. [Google Scholar] [CrossRef]
- Aston, A. Rainfall interception by eight small trees. J. Hydrol. 1979, 42, 383–396. [Google Scholar] [CrossRef]
- Li, X.; Xiao, Q.; Niu, J.; Dymond, S.; van Doorn, N.S.; Yu, X.; Xie, B.; Lv, X.; Zhang, K.; Li, J. Process-based rainfall interception by small trees in Northern China: The effect of rainfall traits and crown structure characteristics. Agric. For. Meteorol. 2016, 218, 65–73. [Google Scholar] [CrossRef]
- Calder, I.R. Rainfall interception and drop size—Development and calibration of the two-layer stochastic interception model. Tree Physiol. 1996, 16, 727–732. [Google Scholar] [CrossRef] [PubMed]
- Wang, J. Redistribution of Rainfall and Chemical Characteristics of Rainfall Components in Evergreen Broad-Leaved Forest in Tiantong. Doctoral Dissertation, East China Normal University, Shanghai, China, 2008. [Google Scholar]
- Yu, K.; Chen, N.; Yu, S.; Wang, G. Effects of species composition on canopy rainfall storage capacity in an alpine meadow, China. Acta Ecol. Sin. 2011, 31, 5771–5779. [Google Scholar]
- Herwitz, S.R. Interception storage capacities of tropical rainforest canopy trees. J. Hydrol. 1985, 77, 237–252. [Google Scholar] [CrossRef]
- Leyton, L.; Reynolds, E.; Thompson, F. Rainfall interception in forest and moorland. In Proceedings of the International Symposium on Forest Hydrology; Pergamon: Oxford, UK, 1967; p. 168. [Google Scholar]
- Hutchings, N.; Milne, R.; Crowther, J. Canopy storage capacity and its vertical distribution in a Sitka spruce canopy. J. Hydrol. 1988, 104, 161–171. [Google Scholar] [CrossRef]
- Kelliher, F.; Whitehead, D.; Pollock, D. Rainfall interception by trees and slash in a young Pinus radiata D. Don stand. J. Hydrol. 1992, 131, 187–204. [Google Scholar] [CrossRef]
- Lankreijer, H.; Hendriks, M.; Klaassen, W. A comparison of models simulating rainfall interception of forests. Agric. For. Meteorol. 1993, 64, 187–199. [Google Scholar] [CrossRef]
- Teklehaimanot, Z.; Jarvis, P.; Ledger, D. Rainfall interception and boundary layer conductance in relation to tree spacing. J. Hydrol. 1991, 123, 261–278. [Google Scholar] [CrossRef]
- Wang, X.P.; Zhang, Y.F.; Hu, R.; Pan, Y.X.; Berndtsson, R. Canopy storage capacity of xerophytic shrubs in Northwestern China. J. Hydrol. 2012, 454, 152–159. [Google Scholar] [CrossRef]
- Monson, R.K.; Grant, M.C.; Jaeger, C.H.; Schoettle, A.W. Morphological causes for the retention of precipitation in the crowns of alpine plants. Environ. Exp. Bot. 1992, 32, 319–327. [Google Scholar] [CrossRef]
- Ilek, A.; Kucza, J.; Morkisz, K. Hydrological properties of bark of selected forest tree species. Part 2: Interspecific variability of bark water storage capacity. Folia For. Pol. Ser. A 2017, 59, 110–122. [Google Scholar] [CrossRef][Green Version]
- Garcia-Estringana, P.; Alonso-Blazquez, N.; Alegre, J. Water storage capacity, stemflow and water funneling in Mediterranean shrubs. J. Hydrol. 2010, 389, 363–372. [Google Scholar] [CrossRef]
- Beysens, D.; Steyer, A.; Guenoun, P.; Fritter, D.; Knobler, C. How does dew form? Phase Transit. 1991, 31, 219–246. [Google Scholar] [CrossRef]
- Dunkerley, D.L.; Booth, T.L. Plant canopy interception of rainfall and its significance in a banded landscape, arid western New South Wales, Australia. Water Resour. Res. 1999, 35, 1581–1586. [Google Scholar] [CrossRef]
- Keim, R.; Skaugset, A.; Weiler, M. Storage of water on vegetation under simulated rainfall of varying intensity. Adv. Water Resour. 2006, 29, 974–986. [Google Scholar] [CrossRef]
- Li, X.; Niu, J.; Zhang, L.; Xiao, Q.; McPherson, G.E.; Van Doorn, N.; Yu, X.; Xie, B.; Dymond, S.; Li, J. A study on crown interception with four dominant tree species: A direct measurement. Hydrol. Res. 2016, 47, 857–868. [Google Scholar] [CrossRef]
- Li, J.; Tang, Y.; Li, B. The influence of indoor simulated rainfall intensity on the stability of gravel soil slope. Gansu Water Res. Hydropower Technol. 2013, 49, 21–23. [Google Scholar]
- Meyer, L.; Harmon, W. Multiple-intensity rainfall simulator for erosion research on row sideslopes. Trans. ASAE 1979, 22, 0100–0103. [Google Scholar] [CrossRef]
- Huo, Y.; Bi, H.; Zhu, Y.; Xu, H.; Wang, X.; Chang, Y. Characteristics of artificial rainfall produced by QYJY-503C simulation system. Sci. Soil. Water Conserv. 2015, 13, 31–36. [Google Scholar] [CrossRef]
- Liu, Y.; Peng, H.; Meng, W.; Bie, Q.; Wang, Y.; Zhao, C. Artificial rainfall interception characteristics in alpine meadows under different grazing scenarios in the upper reach of Heihe River. J. Lanzhou Univ. Nat. Sci. 2013, 6, 799–806. [Google Scholar]
- Müller, C.; Riederer, M. Plant surface properties in chemical ecology. J. Chem. Ecol. 2005, 31, 2621–2651. [Google Scholar] [CrossRef]
- Peng, H.; Zhao, C.; Feng, Z.; Xu, Z.; Wang, C.; Zhao, Y. Canopy interception by a spruce forest in the upper reach of Heihe River basin, Northwestern China. Hydrol. Process. 2014, 28, 1734–1741. [Google Scholar] [CrossRef]
- Koch, K.; Bhushan, B.; Barthlott, W. Multifunctional surface structures of plants: An inspiration for biomimetics. Prog. Mater. Sci. 2009, 54, 137–178. [Google Scholar] [CrossRef]
- Fang, G.; Gao, Y.; Xu, L.; Hu, L.; Zhang, S. Analysis of precipitation change and the characteristics of disaster rainfalls in shanghai. Res. Environ. Yantze Basin 2012, 21, 1270–1273. [Google Scholar]
- DJ/TJ 08-19-2011; Technical Specification of Landscape Gardening. Shanghai Landscaping & City Appearance Administrative Bureau: Shanghai, China, 2011.
- Fang, H. Study and Assessment on the Artificial PlantCommunity in Urban Spaces of Shanghai City. Master’s Thesis, East China Normal University, Shanghai, China, 2006. [Google Scholar]
- Ning, J.; Li, T. Statistics of rainfall characteristics and calculation of rainwater storage tank volume in Shanghai. China Water Wastewater 2006, 22, 48–51. [Google Scholar] [CrossRef]
- Gao, J.; Qi, L. Characteristics and influence of short duration heavy rainfall in Shanghai. Meteorol. Environ. Res. 2015, 38, 52–60. [Google Scholar] [CrossRef]
- Xiao, Q.; McPherson, E.G. Surface water storage capacity of twenty tree species in Davis, California. J. Environ. Qual. 2016, 45, 188–198. [Google Scholar] [CrossRef]
- GB50014-2021; Outdoor Drainage Design Standards. Ministry of Housing and Urban-Rural Development of the People’s Republic of China: Beijing, China, 2021.
- Ning, J. Study on the Intensity Formula and Design Rain Pattern of Short Duration Rainstorm in Shanghai. Master’s Thesis, Tong Ji University, Shanghai, China, 2006. [Google Scholar]
- Wan, D.; Liu, H.; Zhao, X.; Qu, J.; Xiao, S.; Hou, Y. Role of the Mg/Al atomic ratio in hydrotalcite-supported Pd/Sn catalysts for nitrate adsorption and hydrogenation reduction. J. Colloid. Interface Sci. 2009, 332, 151–157. [Google Scholar] [CrossRef]
- Wohlfahrt, G.; Bianchi, K.; Cernusca, A. Leaf and stem maximum water storage capacity of herbaceous plants in a mountain meadow. J. Hydrol. 2006, 319, 383–390. [Google Scholar] [CrossRef]
- Klaassen, W.; Bosveld, F.; De Water, E. Water storage and evaporation as constituents of rainfall interception. J. Hydrol. 1998, 212, 36–50. [Google Scholar] [CrossRef]
- Bassette, C.; Bussiere, F. Partitioning of splash and storage during raindrop impacts on banana leaves. Agric. For. Meteorol. 2008, 148, 991–1004. [Google Scholar] [CrossRef]
- Hancock, N.; Crowther, J. A technique for the direct measurement of water storage on a forest canopy. J. Hydrol. 1979, 41, 105–122. [Google Scholar] [CrossRef]
- Livesley, S.J.; Baudinette, B.; Glover, D. Rainfall interception and stem flow by eucalypt street trees—The impacts of canopy density and bark type. Urban. For. Urban. Green. 2014, 13, 192–197. [Google Scholar] [CrossRef]
Disclaimer/Publisher’s Note: The statements, opinions and data contained in all publications are solely those of the individual author(s) and contributor(s) and not of MDPI and/or the editor(s). MDPI and/or the editor(s) disclaim responsibility for any injury to people or property resulting from any ideas, methods, instructions or products referred to in the content. |
© 2023 by the authors. Licensee MDPI, Basel, Switzerland. This article is an open access article distributed under the terms and conditions of the Creative Commons Attribution (CC BY) license (https://creativecommons.org/licenses/by/4.0/).