
Accelerated Glacier Mass Loss over Svalbard Derived from ICESat-2 in 2019–2021


Abstract
:1. Introduction
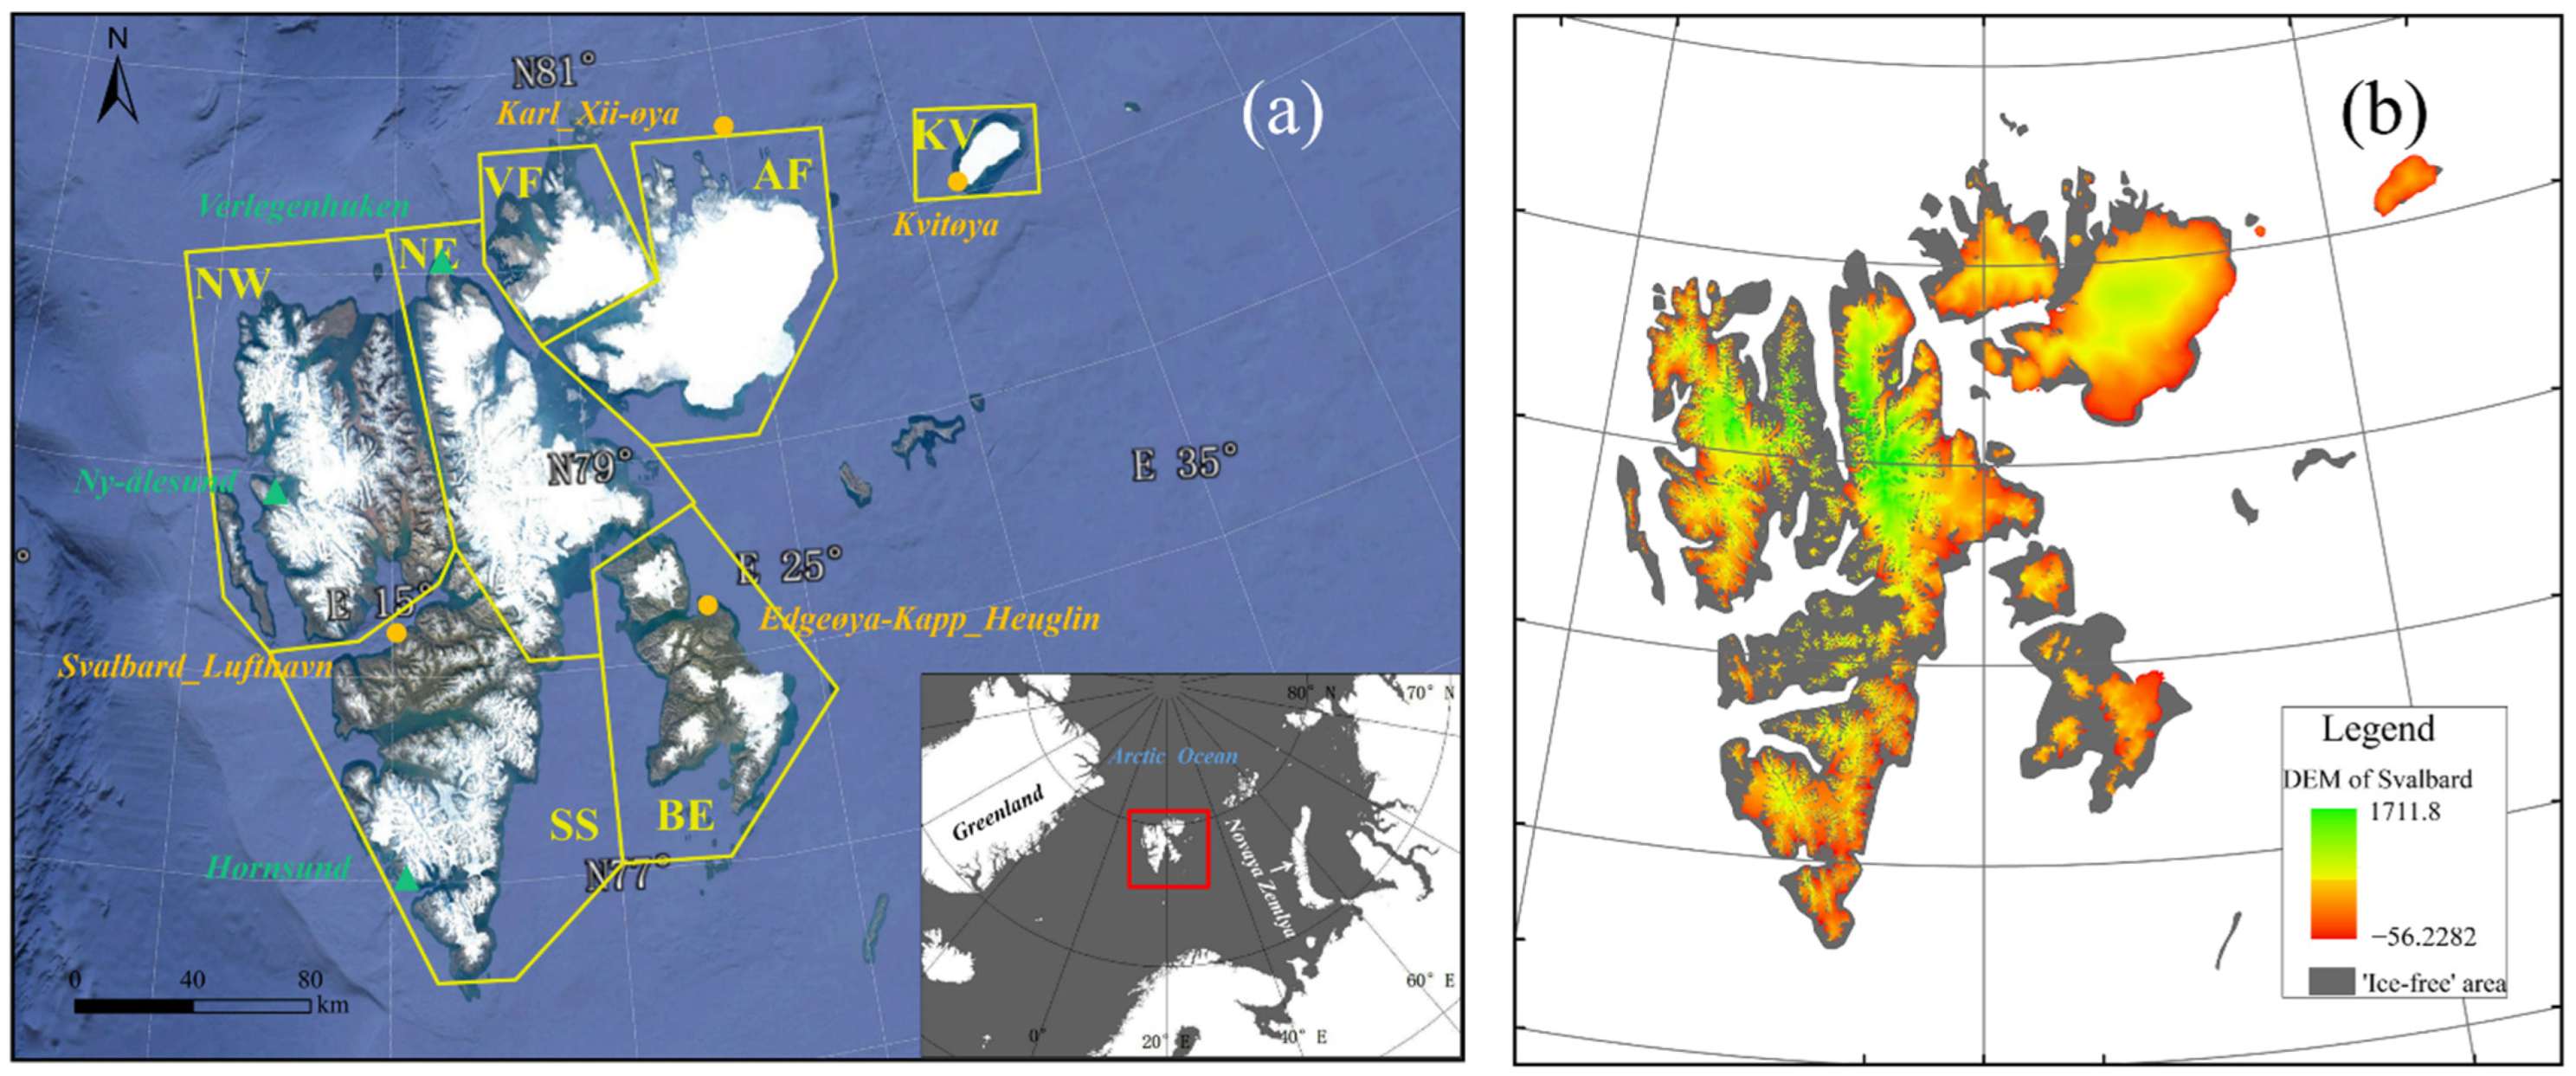
2. Study Area
3. Materials and Methods
3.1. Data
3.1.1. ICESat-2 Laser Altimetry
3.1.2. Auxiliary Data
3.2. Methods
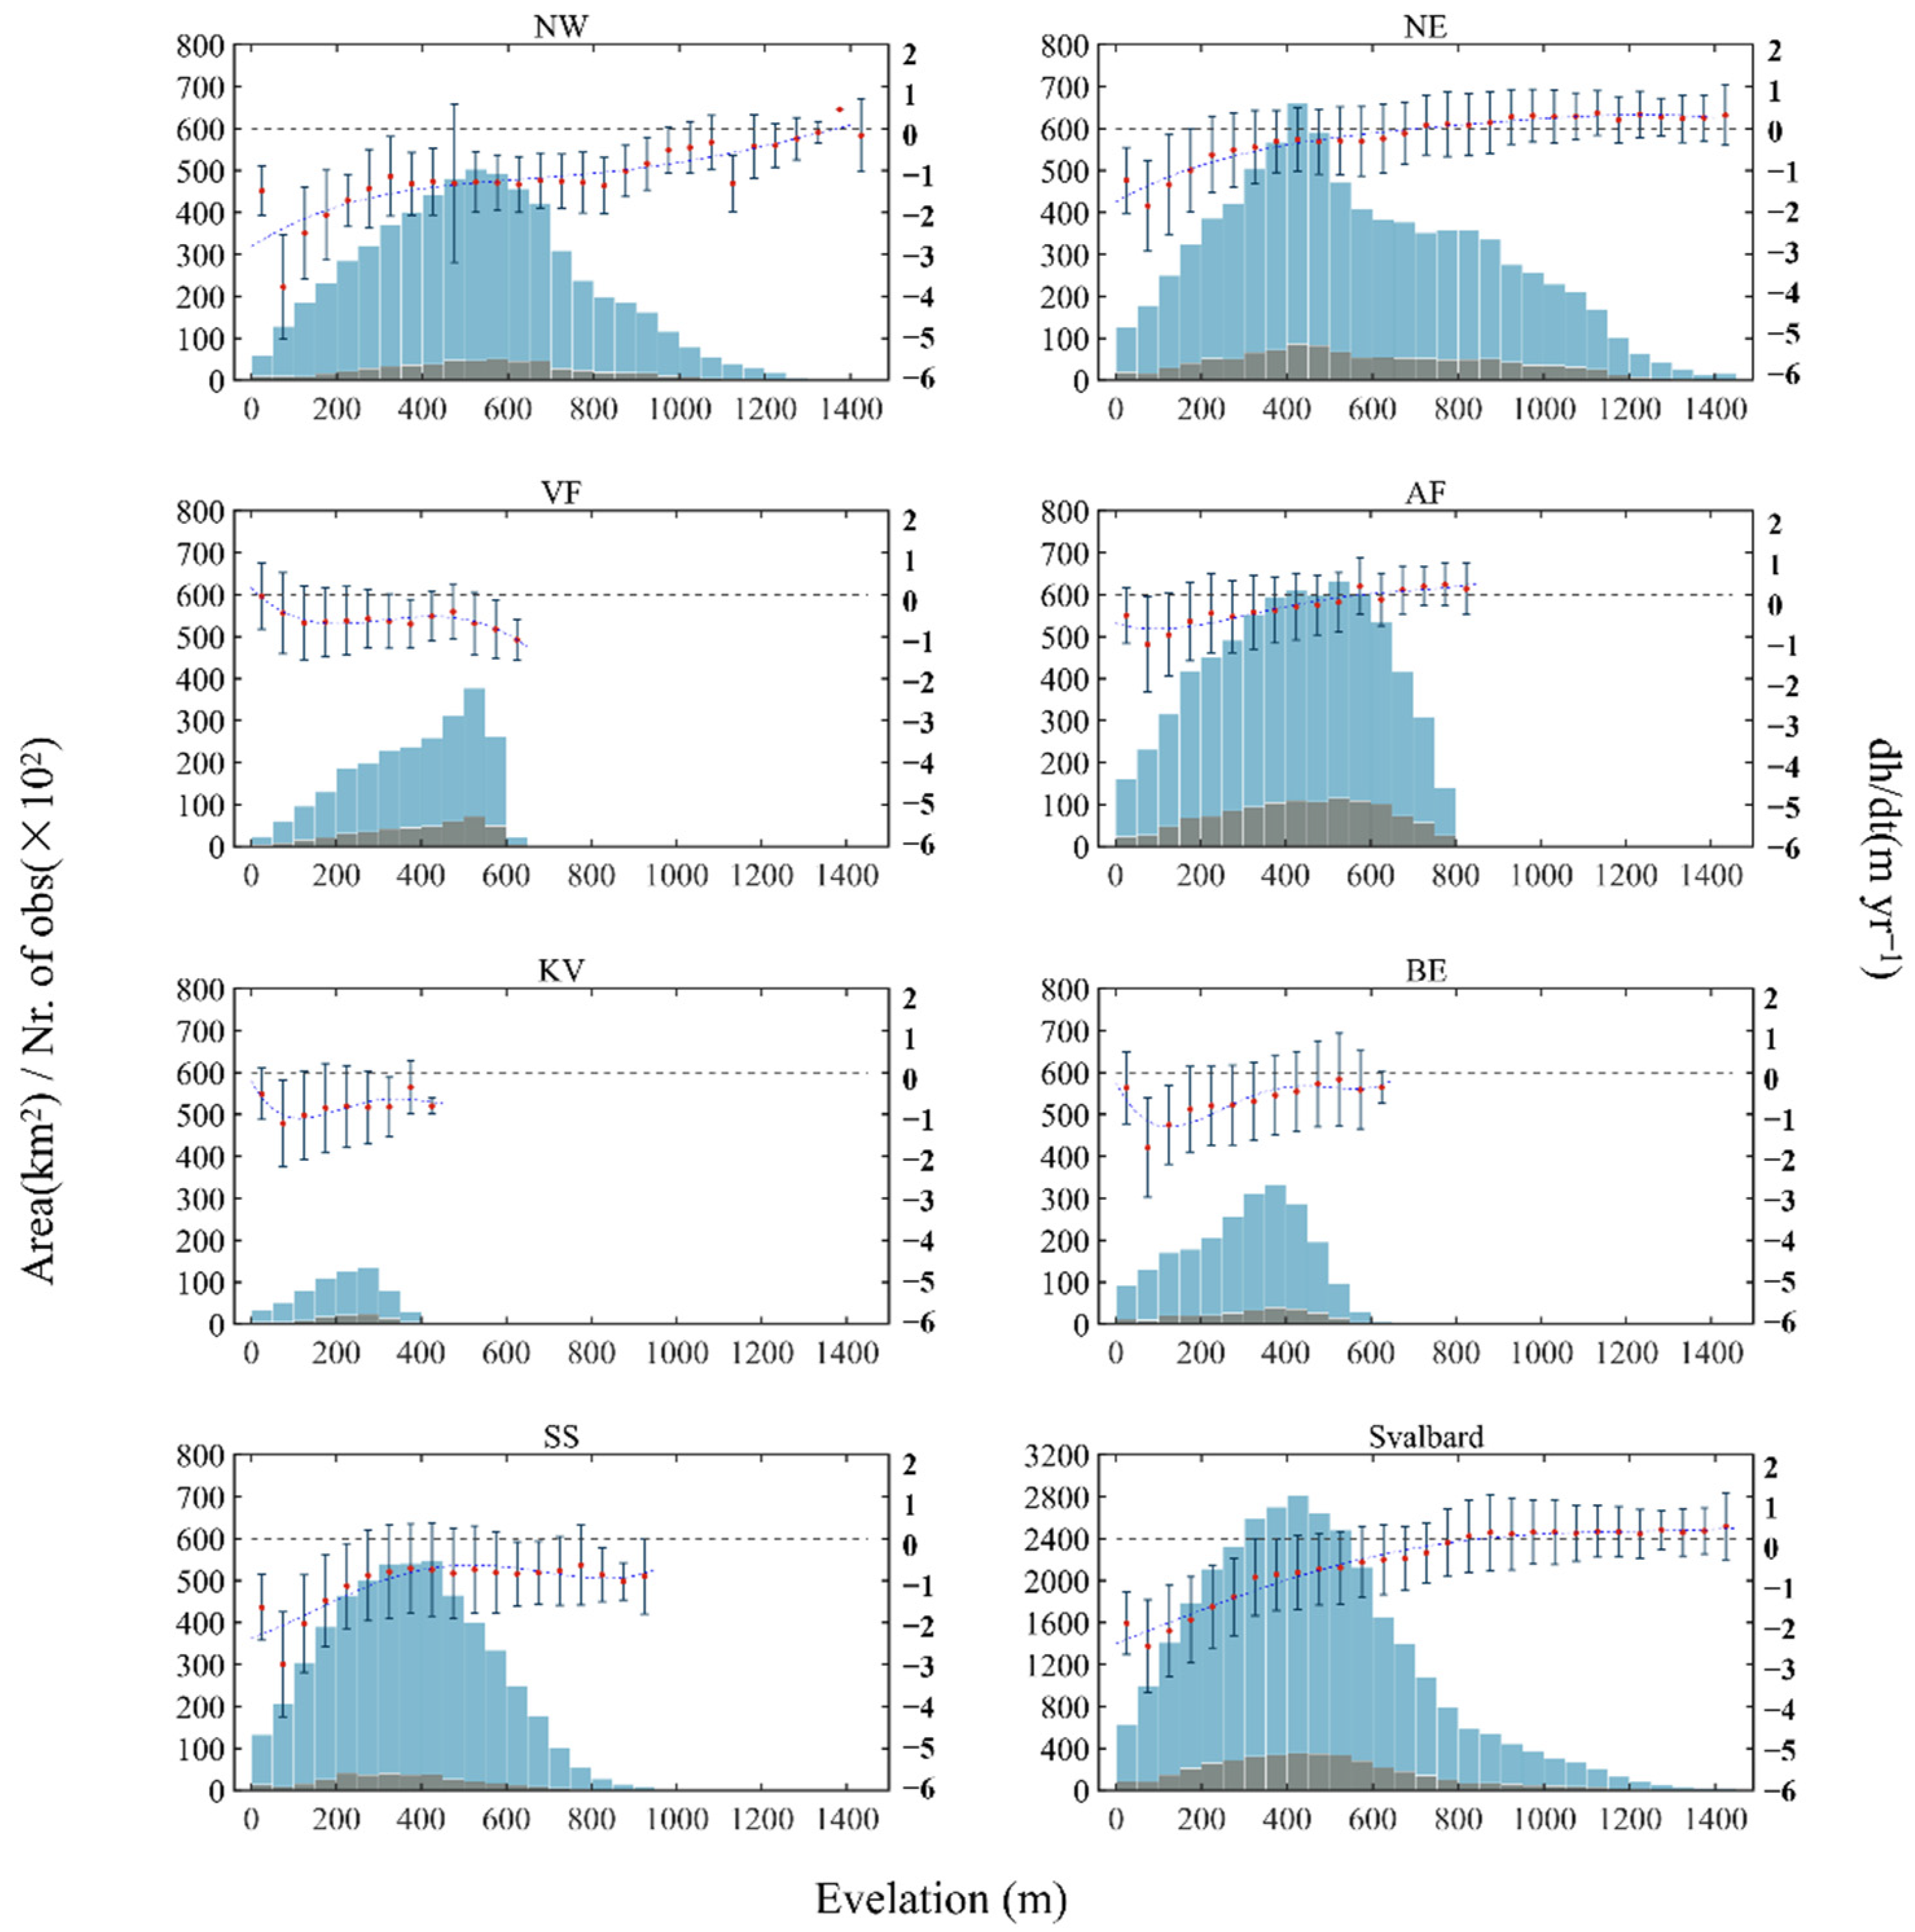
3.2.1. Elevation Change Calculation
- Data outside the Svalbard glacier range were eliminated;
- Data flagged by the on-product quality summary (“quality_summary is 0”) were deleted;
- Data with high along-track height variability (adjacent segment height differences >6 m) were removed;
- Data, where the corrected height was >10,000 m due to atmospheric scattering, were removed;
- Segments where the value of corrected height was NaN for more than four cycles and the standard deviation greater than 10 m were excluded.
- The bin was defined by 50 m elevation bands according to the altitudes from the DEM. For example, the 50–100 m bin was defined as the locations with the altitude between 50 and 100 m. Meanwhile, the areas of each bin were calculated;
- There were n points in a certain bin, and the dh/dt of each point was firstly calculated. Then, all dh/dt values were averaged. Hence, we formed a dh/dt data series varying with elevation. To fill the data gap of bins due to lack of points, a fourth order polynomial curve was used to fit data series;
- To calculate the dh/dt over a certain region, a weighted average was used where the area was taken as weight.
3.2.2. Mass Balance Estimate
3.2.3. Error Assessment
4. Results
4.1. Elevation Change of Svalbard
4.2. Volume Change and Mass Balance
5. Discussion
5.1. Acceleration of Elevation and Mass Change
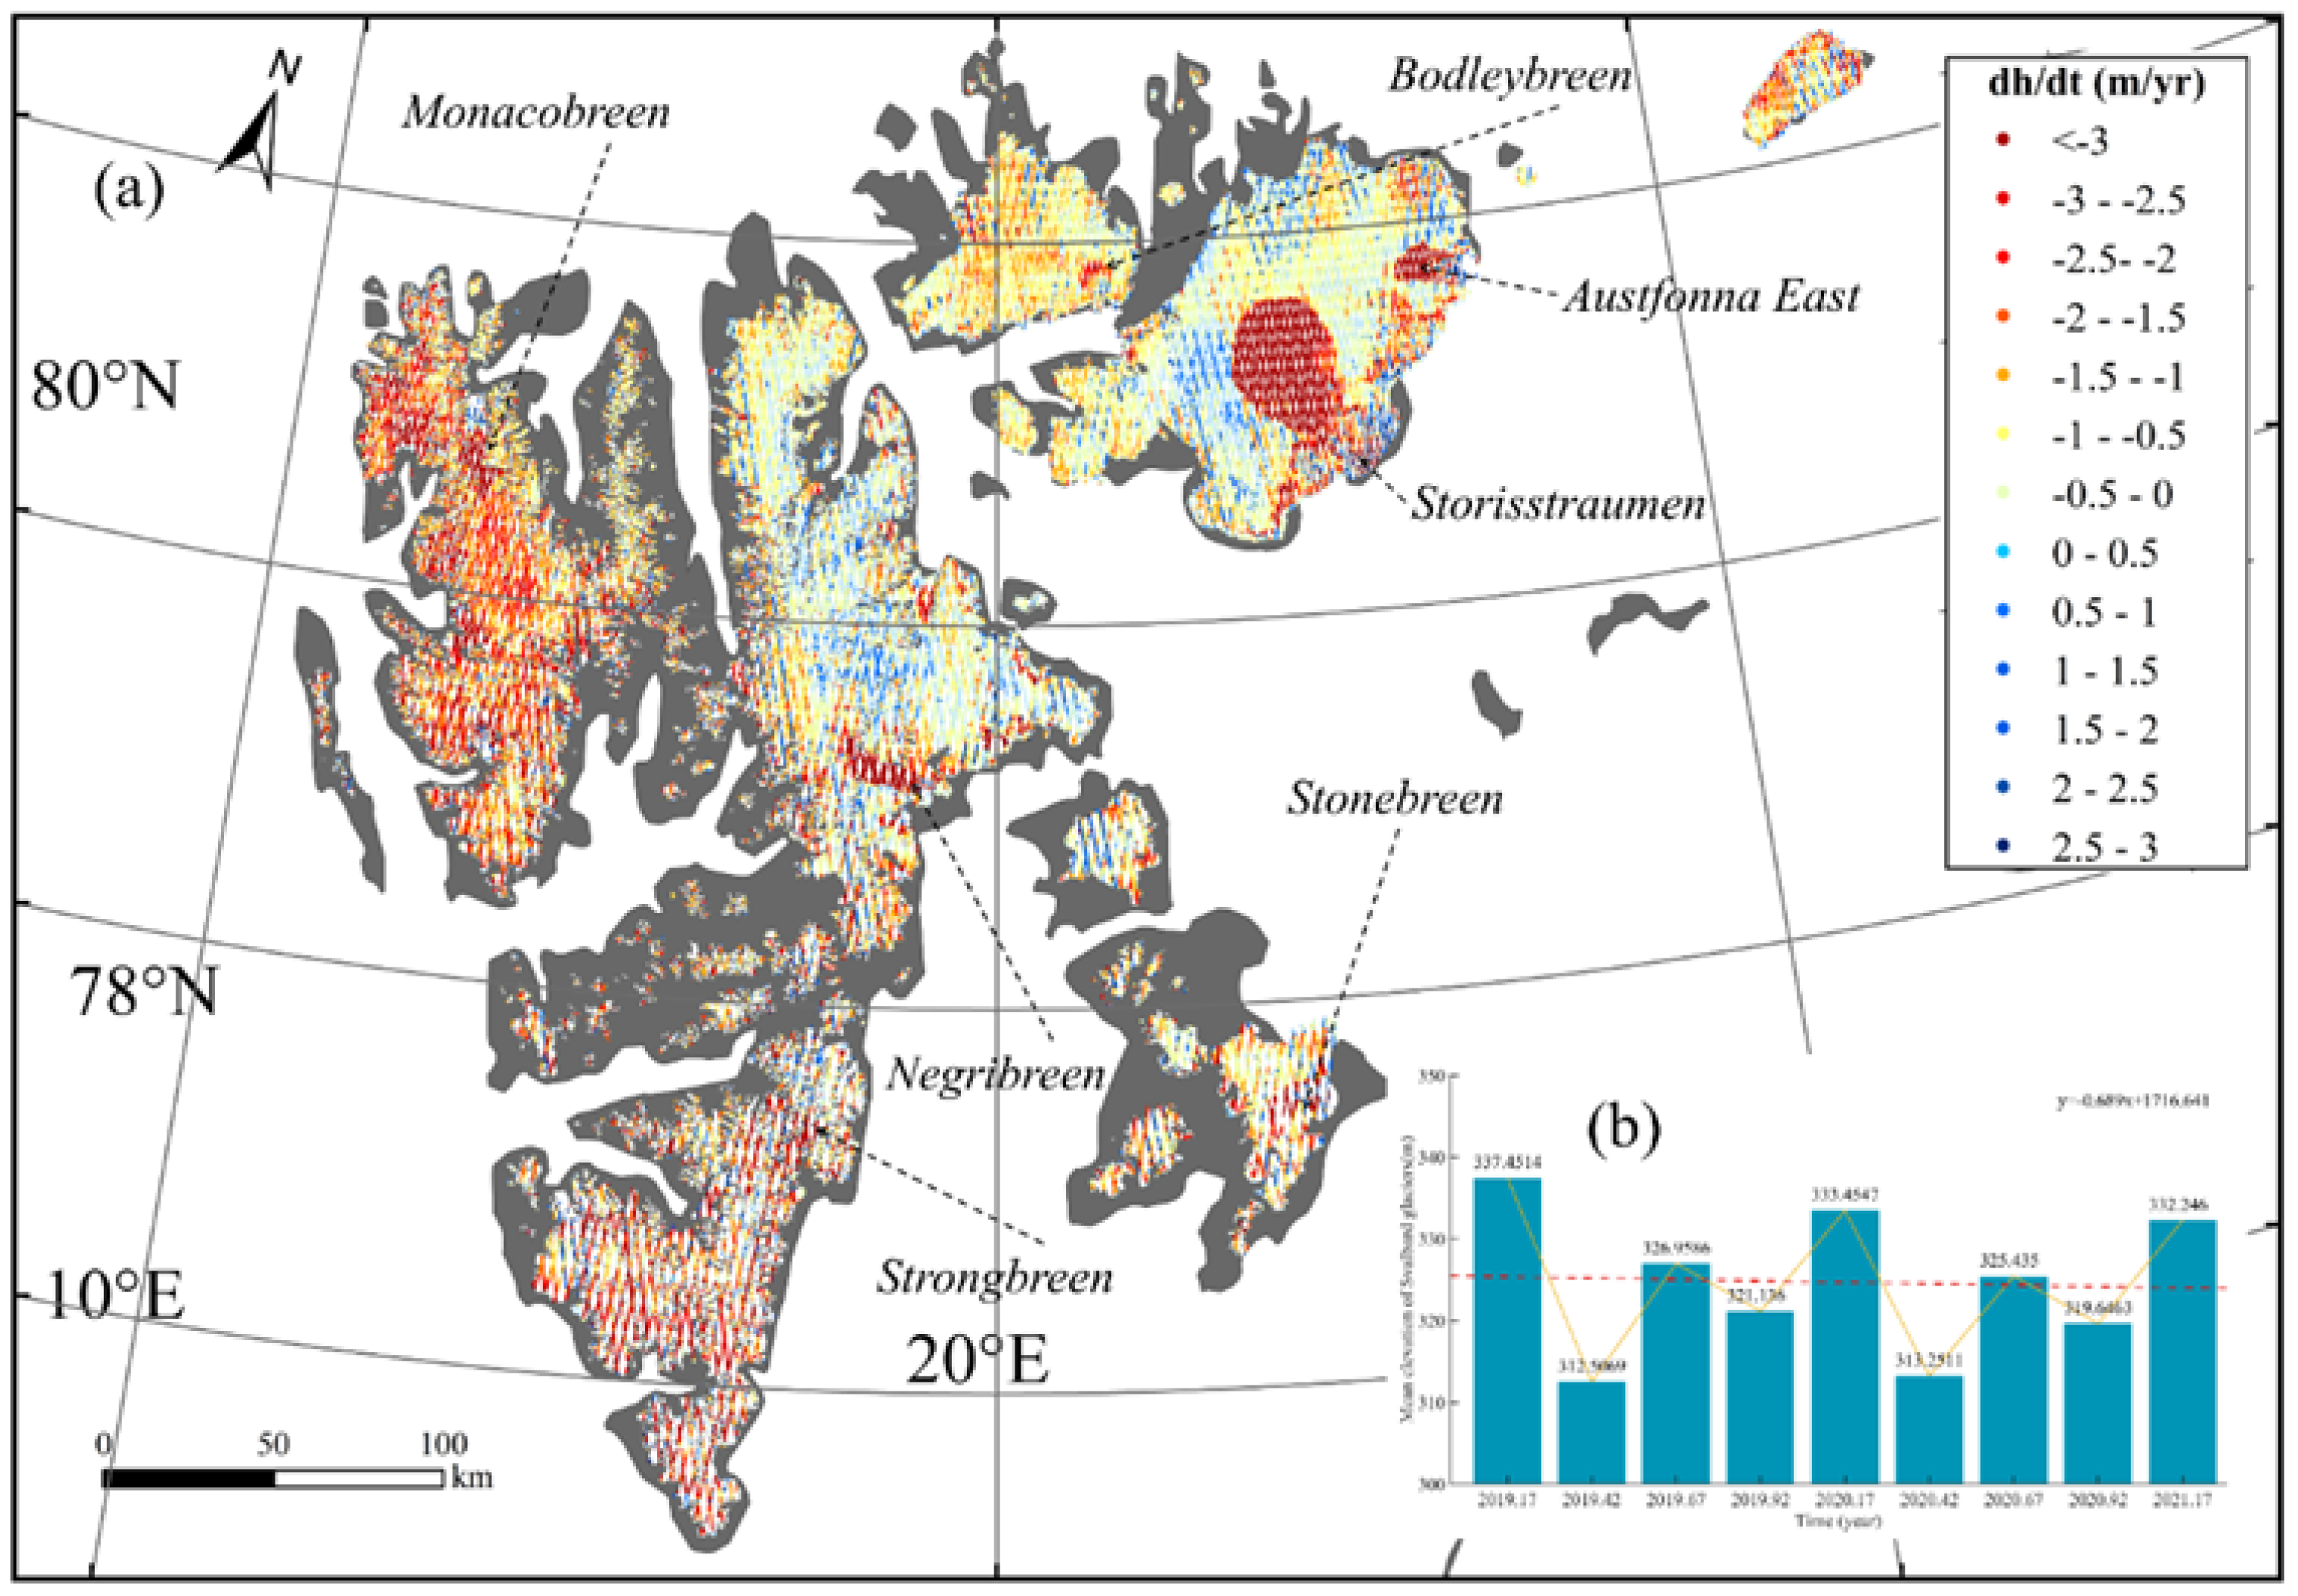
5.2. Contribution of Surge Events
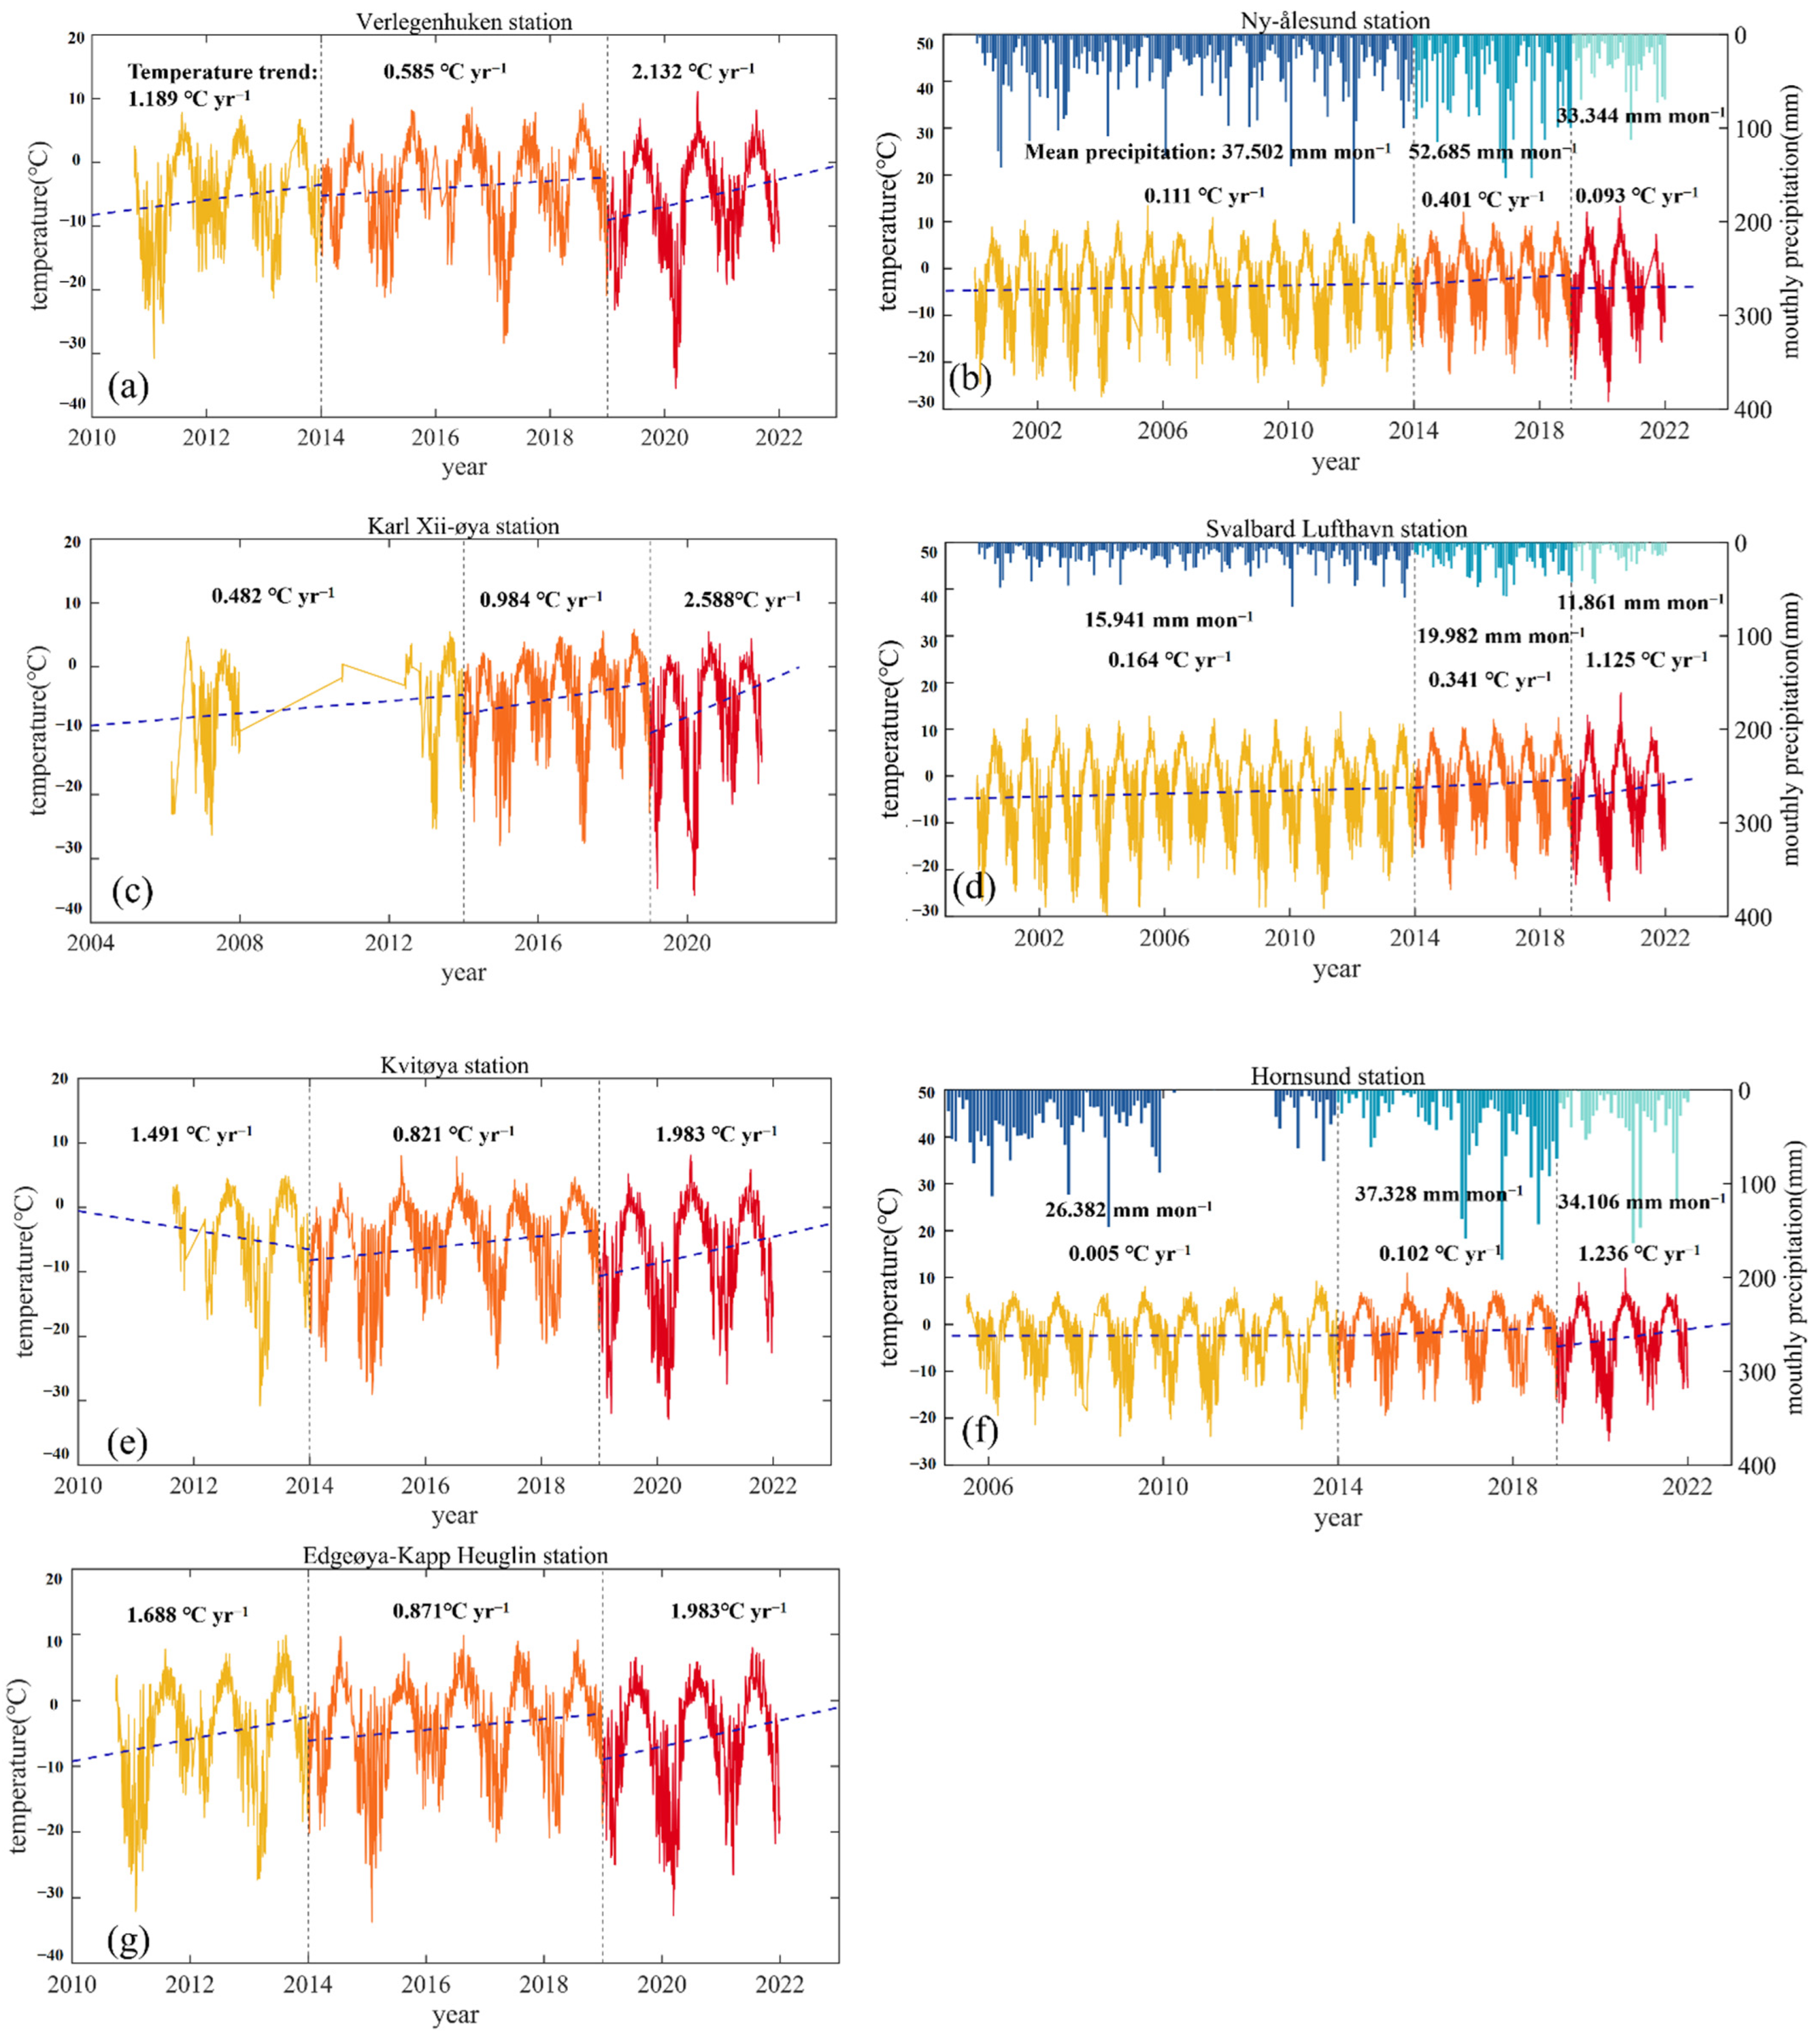
5.3. Links to Climate Change
6. Conclusions
Author Contributions
Funding
Acknowledgments
Conflicts of Interest
References
- Bojinski, S.; Verstraete, M.; Peterson, T.C.; Richter, C.; Simmons, A.; Zemp, M. The Concept of Essential Climate Variables in Support of Climate Research, Applications, and Policy. Bull. Am. Meteorol. Soc. 2014, 95, 1431–1443. [Google Scholar] [CrossRef]
- Małecki, J. Elevation and volume changes of seven Dickson Land glaciers, Svalbard, 1960–1990–2009. Polar Res. 2013, 32, 18400. [Google Scholar] [CrossRef]
- Meier, M.F.; Dyurgerov, M.B.; Rick, U.K.; O’Neel, S.; Pfeffer, W.T.; Anderson, R.S.; Anderson, S.P.; Glazovsky, A.F. Glaciers Dominate Eustatic Sea-Level Rise in the 21st Century. Science 2007, 317, 1064–1067. [Google Scholar] [CrossRef] [PubMed] [Green Version]
- Nuth, C.; Moholdt, G.; Kohler, J.; Hagen, J.O.; Kaab, A. Svalbard glacier elevation changes and contribution to sea level rise. J. Geophys. Res. Earth Surf. 2010, 115, F01008. [Google Scholar] [CrossRef] [Green Version]
- Noel, B.; Jakobs, C.L.; van Pelt, W.J.J.; Lhermitte, S.; Wouters, B.; Kohler, J.; Hagen, J.O.; Luks, B.; Reijmer, C.H.; van de Berg, W.J.; et al. Low elevation of Svalbard glaciers drives high mass loss variability. Nat. Commun. 2021, 11, 4597. [Google Scholar] [CrossRef] [PubMed]
- Wang, Z.M.; Yan, B.Y.; Ai, S.T.; Holmen, K.; An, J.C.; Ma, H.M. Quantitative analysis of Arctic ice flow acceleration with increasing temperature. Acta Oceanal. Sin. 2021, 40, 22–32. [Google Scholar] [CrossRef]
- Ai, S.; Ding, X.; Tolle, F.; Wang, Z.; Zhao, X. Latest Geodetic Changes of Austre Lovénbreen and Pedersenbreen, Svalbard. Remote Sens. 2019, 11, 2890. [Google Scholar] [CrossRef] [Green Version]
- Ai, S.; Wang, Z.E.D.; Holmén, K.; Tan, Z.; Zhou, C.; Sun, W. Topography, ice thickness and ice volume of the glacier Pedersenbreen in Svalbard, using GPR and GPS. Polar Res. 2014, 33, 18533. [Google Scholar] [CrossRef] [Green Version]
- Moholdt, G.; Nuth, C.; Hagen, J.O.; Kohler, J. Recent elevation changes of Svalbard glaciers derived from ICESat laser altimetry. Remote Sens. Environ. 2010, 114, 2756–2767. [Google Scholar] [CrossRef]
- Farinotti, D.; Huss, M.; Furst, J.J.; Landmann, J.; Machguth, H.; Maussion, F.; Pandit, A. A consensus estimate for the ice thickness distribution of all glaciers on Earth. Nat. Geosci. 2019, 12, 168–173. [Google Scholar] [CrossRef] [Green Version]
- Geyman, E.C.; van Pelt, W.J.J.; Maloof, A.C.; Aas, H.F.; Kohler, J. Historical glacier change on Svalbard predicts doubling of mass loss by 2100. Nature 2022, 601, 374–379. [Google Scholar] [CrossRef] [PubMed]
- Elagina, N.; Kutuzov, S.; Rets, E.; Smirnov, A.; Chernov, R.; Lavrentiev, I.; Mavlyudov, B. Mass Balance of Austre Grønfjordbreen, Svalbard, 2006–2020, Estimated by Glaciological, Geodetic and Modeling Aproaches. Geosciences 2021, 11, 78. [Google Scholar] [CrossRef]
- Małecki, J. Accelerating retreat and high-elevation thinning of glaciers in central Spitsbergen. Cryophere 2016, 10, 1317–1329. [Google Scholar] [CrossRef] [Green Version]
- Brenner, A.C.; DiMarzio, J.R.; Zwally, H.J. Precision and Accuracy of Satellite Radar and Laser Altimeter Data Over the Continental Ice Sheets. IEEE Trans. Geosci. Remote Sens. 2007, 45, 321–331. [Google Scholar] [CrossRef]
- Zwally, H.J.; Brenner, A.C.; Major, J.A.; Bindschadler, R.A.; Marsh, J.G. Growth of Greenland Ice Sheet: Measurement. Science 1989, 246, 1587–1589. [Google Scholar] [CrossRef]
- Wingham, D.J.; Ridout, A.J.; Scharroo, R.; Arthern, R.J.; Shum, C.K. Antarctic Elevation Change from 1992 to 1996. Science 1998, 282, 456–458. [Google Scholar] [CrossRef]
- Wang, Q.; Yi, S.; Sun, W. Continuous Estimates of Glacier Mass Balance in High Mountain Asia Based on ICESat-1, 2 and GRACE/GRACE Follow-On Data. Geophys. Res. Lett. 2021, 48, e2020GL090954. [Google Scholar] [CrossRef]
- Shen, C.; Jia, L.; Ren, S. Inter-and Intra-Annual Glacier Elevation Change in High Mountain Asia Region Based on ICESat-l&2 Data Using Elevation-Aspect Bin Analysis Method. Remote Sens. 2022, 14, 1630. [Google Scholar] [CrossRef]
- Morris, A.; Moholdt, G.; Gray, L. Spread of Svalbard Glacier Mass Loss to Barents Sea Margins Revealed by CryoSat-2. J. Geophys. Res. Earth Surf. 2020, 125, e2019JF005357. [Google Scholar] [CrossRef]
- Li, R.X.; Li, H.W.; Hao, T.; Qiao, G.; Cui, H.T.; He, Y.Q.; Hai, G.; Xie, H.; Cheng, Y.; Li, B.F. Assessment of ICESat-2 ice surface elevations over the Chinese Antarctic Research Expedition (CHINARE) route, East Antarctica, based on coordinated multi-sensor observations. Cryosphere 2021, 15, 3083–3099. [Google Scholar] [CrossRef]
- Sochor, L.; Seehaus, T.; Braun, M.H. Increased Ice Thinning over Svalbard Measured by ICESat/ICESat-2 Laser Altimetry. Remote Sens. 2021, 13, 2089. [Google Scholar] [CrossRef]
- Millan, R.; Mouginot, J.; Rabatel, A.; Morlighem, M. Ice velocity and thickness of the world’s glaciers. Nat. Geosci. 2022, 15, 124–129. [Google Scholar] [CrossRef]
- Hugonnet, R.; McNabb, R.; Berthier, E.; Menounos, B.; Nuth, C.; Girod, L.; Farinotti, D.; Huss, M.; Dussaillant, I.; Brun, F.; et al. Accelerated global glacier mass loss in the early twenty-first century. Nature 2021, 592, 726–731. [Google Scholar] [CrossRef] [PubMed]
- Nordli, O.; Wyszynski, P.; Gjelten, H.M.; Isaksen, K.; Lupikasza, E.; Niedzwiedz, T.; Przybylak, R. Revisiting the extended Svalbard Airport monthly temperature series, and the compiled corresponding daily series 1898–2018. Polar Res. 2020, 39, 3614. [Google Scholar] [CrossRef]
- Blaszczyk, M.; Jania, J.A.; Hagen, J.O. Tidewater glaciers of Svalbard: Recent changes and estimates of calving fluxes. Pol. Polar Res. 2009, 30, 85–142. [Google Scholar]
- Ostby, T.I.; Schuler, T.V.; Hagen, J.O.; Hock, R.; Kohler, J.; Reijmer, C.H. Diagnosing the decline in climatic mass balance of glaciers in Svalbard over 1957–2014. Cryosphere 2017, 11, 191–215. [Google Scholar] [CrossRef] [Green Version]
- Farnsworth, W.R.; Ingolfsson, O.; Retelle, M.; Schomacker, A. Over 400 previously undocumented Svalbard surge-type glaciers identified. Geomorphology 2016, 264, 52–60. [Google Scholar] [CrossRef]
- NASA. Algorithm Theoretical Basis Document (ATBD) For Land-Ice Along-Track Products Part 2: Land-Ice H(t)/ATL11. Maryland, USA. 2021. Available online: https://icesatiimis.gsfc.nasa.gov/ (accessed on 6 August 2022).
- Aas, H.F.; Moholdt, G. Merged NPI-ArcticDEM Svalbard Digital Elevation Model; Norwegian Polar Institute: Tromsø, Norway, 2020. [Google Scholar] [CrossRef]
- RGI Consortium. Randolph Glacier Inventory—A Dataset of Global Glacier Outlines: Version 6.0: Technical Report, Global Land Ice Measurements from Space. Colorado, USA. 2017. Available online: http://www.glims.org/RGI/randolph60.html (accessed on 6 August 2022).
- Felikson, D.; Urban, T.J.; Gunter, B.C.; Pie, N.; Pritchard, H.D.; Harpold, R.; Schutz, B.E. Comparison of Elevation Change Detection Methods from ICESat Altimetry Over the Greenland Ice Sheet. IEEE Trans. Geosci. Remote Sens. 2017, 55, 5494–5505. [Google Scholar] [CrossRef]
- Smith, B.; Fricker, H.A.; Gardner, A.S.; Medley, B.; Nilsson, J.; Paolo, F.S.; Holschuh, N.; Adusumilli, S.; Brunt, K.; Csatho, B.; et al. Pervasive ice sheet mass loss reflects competing ocean and atmosphere processes. Science 2020, 368, 1239–1248. [Google Scholar] [CrossRef]
- Taubenberger, C.J.; Felikson, D.; Neumann, T. Brief communication: Preliminary ICESat-2 (Ice, Cloud and land Elevation Satellite-2) measurements of outlet glaciers reveal heterogeneous patterns of seasonal dynamic thickness change. Cryosphere 2022, 16, 1341–1348. [Google Scholar] [CrossRef]
- Huss, M. Density assumptions for converting geodetic glacier volume change to mass change. Cryosphere 2013, 7, 877–887. [Google Scholar] [CrossRef] [Green Version]
- Morris, A.; Moholdt, G.; Gray, L.; Schuler, T.V.; Eiken, T. CryoSat-2 interferometric mode calibration and validation: A case study from the Austfonna ice cap, Svalbard. Remote Sens. Environ. 2022, 269, 112805. [Google Scholar] [CrossRef]
- Banerjee, D.; Garg, V.; Thakur, P.K. Geospatial investigation on transitional (quiescence to surge initiation) phase dynamics of Monacobreen tidewater glacier, Svalbard. Adv. Space Res. 2022, 69, 1813–1839. [Google Scholar] [CrossRef]
- Haga, O.N.; McNabb, R.; Nuth, C.; Altena, B.; Schellenberger, T.; Kaab, A. From high friction zone to frontal collapse: Dynamics of an ongoing tidewater glacier surge, Negribreen, Svalbard. J. Glaciol. 2020, 66, 742–754. [Google Scholar] [CrossRef]
- Strozzi, T.; Kaab, A.; Schellenberger, T. Frontal destabilization of Stonebreen, Edgeøya, Svalbard. Cryosphere 2017, 11, 553–566. [Google Scholar] [CrossRef] [Green Version]
- Schuler, T.V.; Kohler, J.; Elagina, N.; Hagen, J.O.M.; Hodson, A.J.; Jania, J.A.; Kaab, A.M.; Luks, B.; Malecki, J.; Moholdt, G.; et al. Reconciling Svalbard Glacier Mass Balance. Front. Earth Sci. 2020, 8, 156. [Google Scholar] [CrossRef]
- Dobler, A.; Lutz, J.; Landgren, O.; Haugen, J.E. Circulation Specific Precipitation Patterns over Svalbard and Projected Future Changes. Atmosphere 2021, 11, 1378. [Google Scholar] [CrossRef]
- Lang, C.; Fettweis, X.; Erpicum, M. Stable climate and surface mass balance in Svalbard over 1979–2013 despite the Arctic warming. Cryophere 2015, 9, 83–101. [Google Scholar] [CrossRef] [Green Version]


| Region | Area (km2) | dh/dt (m yr−1) | (m) | (m) |
|---|---|---|---|---|
| NW | 6223 | −1.264 ± 0.254 | −1.688 ± 0.035 | 0.319 ± 0.154 |
| NE | 8462 | −0.358 ± 0.219 | −0.948 ± 0.184 | 0.430 ± 0.148 |
| VF | 2393 | −0.676 ± 0.147 | −0.931 ± 0.297 | 0.287 ± 0.200 |
| AF 1 | 7062 | −0.338 ± 0.182 | −0.876 ± 0.124 | 0.355 ± 0.145 |
| Storisstraumen | 1226 | −2.703 ± 0.182 | −2.597 ± 0.124 | −0.374 ± 0.145 |
| KV | 646 | −0.769 ± 0.108 | −0.715 ± 0.053 | 0.078 ± 0.136 |
| SS | 5465 | −0.844 ± 0.193 | −1.574 ± 0.127 | 0.631 ± 0.304 |
| BE | 2294 | −0.622 ± 0.212 | −1.103 ± 0.446 | 0.625 ± 0.149 |
| Svalbard | 33771 | −0.775 ± 0.225 | −1.006 ± 0.205 | 0.393 ± 0.178 |
| Region | dV/dt (km3 yr−1) | dM1/dt (Gt yr−1) | dM2/dt (Gt yr−1) | dM3/dt (Gt yr−1) |
|---|---|---|---|---|
| NW | −7.869 ± 1.580 | −7.216 ± 1.449 | −4.013 ± 0.945 | −5.032 ± 1.214 |
| NE | −3.037 ± 1.853 | −2.785 ± 1.699 | −1.549 ± 0.945 | −1.916 ± 1.439 |
| VF | −1.618 ± 0.352 | −1.484 ± 0.323 | −0.825 ± 0.180 | −0.885 ± 0.217 |
| AF | −2.387 ± 1.285 | −2.189 ± 1.178 | −1.217 ± 0.655 | −1.347 ± 0.743 |
| Storisstraumen | −3.314 ± 0.223 | −3.041 ± 0.204 | −1.690 ± 0.114 | −2.141 ± 0.149 |
| KV | −0.498 ± 0.070 | −0.456 ± 0.064 | −0.254 ± 0.036 | −0.273 ± 0.041 |
| SS | −4.610 ± 1.055 | −4.228 ± 0.967 | −2.351 ± 0.538 | −2.535 ± 0.655 |
| BE | −1.426 ± 0.486 | −1.308 ± 0.446 | −0.727 ± 0.248 | −0.733 ± 0.308 |
| Svalbard | −24.759 ± 7.598 | −22.704 ± 6.968 | −12.627 ± 3.875 | −14.843 ± 4.024 |
| Region | Nuth et al., 2010 [4] | Moholdt et al., 2010 [9] | Sochor et al., 2021 [21] | Morris et al., 2020 [20] | This Study |
|---|---|---|---|---|---|
| period | DEM&ICESat, 1965–1990 to 2005 | ICESat, 2003–2008 | ICESat/ICESat-2, 2003–2008 to 2019 | CryoSat-2, 2011–2017 | ICESat-2, 2019–2021 |
| NW | −0.41 ± 0.02 | −0.54 ± 0.10 | −0.63 ± 0.21 | −0.56 | −1.264 ± 0.237 |
| NE | −0.25 ± 0.06 | 0.06 ± 0.06 | −0.07 ± 0.16 | −0.15 | −0.358 ± 0.193 |
| VF | 0.05 ± 0.15 | −0.16 ± 0.08 | −0.09 ± 0.12 | −0.23 | −0.676 ± 0.108 |
| AF | −0.19 ± 0.06 | 0.11 ± 0.04 | −0.07 ± 0.09 | −0.62 | −0.338 ± 0.110 |
| Storisstraumen | – | – | −2.35 ± 0.09 | −2.44 | −2.703 ± 0.110 |
| KV | – | −0.46 ± 0.11 | −0.74 ± 0.09 | – | −0.769 ± 0.081 |
| SS | −0.55 ± 0.03 | −0.15 ± 0.16 | −0.80 ± 0.18 | −0.96 | −0.844 ± 0.177 |
| BE | −0.50 ± 0.05 | −0.17 ± 0.11 | −0.54 ± 0.13 | −1.14 | −0.622 ± 0.132 |
| Elevation change of Svalbard (dh/dt) | −0.36 ± 0.02 | −0.12 ± 0.04 | −0.3 ± 0.15 | −0.54 ± 0.10 | −0.775 ± 0.197 |
| Mass change of Svalbard (dM/dt) | – | −3.40 ± 1.60 | −12.21 ± 4.28 | −16.00 ± 3.00 | −14.843 ± 4.024 |
Publisher’s Note: MDPI stays neutral with regard to jurisdictional claims in published maps and institutional affiliations. |
© 2022 by the authors. Licensee MDPI, Basel, Switzerland. This article is an open access article distributed under the terms and conditions of the Creative Commons Attribution (CC BY) license (https://creativecommons.org/licenses/by/4.0/).
Share and Cite
Wang, J.; Yang, Y.; Wang, C.; Li, L. Accelerated Glacier Mass Loss over Svalbard Derived from ICESat-2 in 2019–2021. Atmosphere 2022, 13, 1255. https://doi.org/10.3390/atmos13081255
Wang J, Yang Y, Wang C, Li L. Accelerated Glacier Mass Loss over Svalbard Derived from ICESat-2 in 2019–2021. Atmosphere. 2022; 13(8):1255. https://doi.org/10.3390/atmos13081255
Chicago/Turabian StyleWang, Junhao, Yuande Yang, Chuya Wang, and Leiyu Li. 2022. "Accelerated Glacier Mass Loss over Svalbard Derived from ICESat-2 in 2019–2021" Atmosphere 13, no. 8: 1255. https://doi.org/10.3390/atmos13081255
APA StyleWang, J., Yang, Y., Wang, C., & Li, L. (2022). Accelerated Glacier Mass Loss over Svalbard Derived from ICESat-2 in 2019–2021. Atmosphere, 13(8), 1255. https://doi.org/10.3390/atmos13081255