Abstract
This article deals with methods and measurements related to environmental pollution and analysis of particle distribution in urban and suburban landscapes. Therefore, an already-invented sampling method for tyre road wear particles (TRWP) was used to capture online emission factors from the road. The collected particles were analysed according to their size distribution, for use as an input for particle distribution simulations. The simulation model was a main traffic intersection, because of the high vehicle dynamic related to the high density of start–stop manoeuvres. To compare the simulation results (particle mass (PM) and particle number (PN)) with real-world emissions, measuring points were defined and analysed over a measuring time of 8 h during the day. Afterwards, the collected particles were analysed in terms of particle shape, appearance and chemical composition, to identify the distribution and their place of origin. As a result of the investigation, the appearance of the particles showed a good correlation to the vehicle dynamics, even though there were a lot of background influences, e.g., resuspension of dust. Air humidity also showed a great influence on the recorded particle measurements. In areas of high vehicle dynamics, such as heavy braking or accelerating, more tyre and brake particles could be found.
1. Introduction
Environmental concerns in relation to vehicles are now an everyday topic of discussion. With ever-stricter regulations, and reductions in tail pipe emissions [1], non-exhaust emissions are gaining more public focus. As more and more cars are driving on the roads, non-exhaust emissions, in particular tyre emissions—which are, for example, common with higher vehicle mass, such as sports utility vehicles [2] and battery electric vehicles—become an ever-more important concern. As brake emissions and their distribution in the environment have been well-studied to date [3,4], tyre emissions are now becoming more prevalent in environmental discussions. Due to their chemical composition and physical properties, tyre particles may cause health issues, and are therefore a focus of current research [5,6,7,8,9]. Particle pollution not only appears near the road surface; it also spreads in the environment, for various reasons. Above all, particles thrown up and carried by the wind have critical effects on passers-by in inner cities, who breathe in the polluted air [10]. Precipitation [11] and meltwater [12] are also responsible for the distribution of particles, by which means, tyre components find their way into water, where they have a damaging effect on the organisms living there [13].
While some studies have already dealt with the dispersion of tyre and road particles from different size levels, evaluated on the basis of particle samples collected from the environment or estimated on the basis of traffic volumes [14], there have been hardly any studies—based on real, measured environmental data—of highly dynamic traffic events, and their influence on dispersion, particle formation and particle composition. As environmental measurements are often very complex, due to constantly changing environmental conditions—such as wind speed, humidity and temperature—simulations are mainly used to evaluate influencing variables [15]. The tracking of particle dynamics requires the injection of model particles, which have only limited real-world relevance. The methodological approaches for integrating real emissions into a simulation are described in [16]; these approaches were slightly modified for the present study, and were applied to the urban scenario of Ilmenau (Thuringia, Germany).
In order to understand the importance of traffic emissions in everyday life, studies on particle dispersion were carried out on a simulative and experimental basis, to take a closer look at the situation. The chemical and physical composition of airborne particles was thereby revealed, along with the influences under which the composition and shape of the particles changed. To conclude, the intention of the study was to evaluate the extent to which particle emissions and resuspension from the tyres cause health issues, especially in urban environments with high traffic density. The first step was therefore to characterise tyre-induced emissions’ influences on, and correlations with, environmental pollution. Particle spread was then investigated, to understand its distribution in the environment, and any related health issues affecting people in the vicinity.
2. Materials and Methods
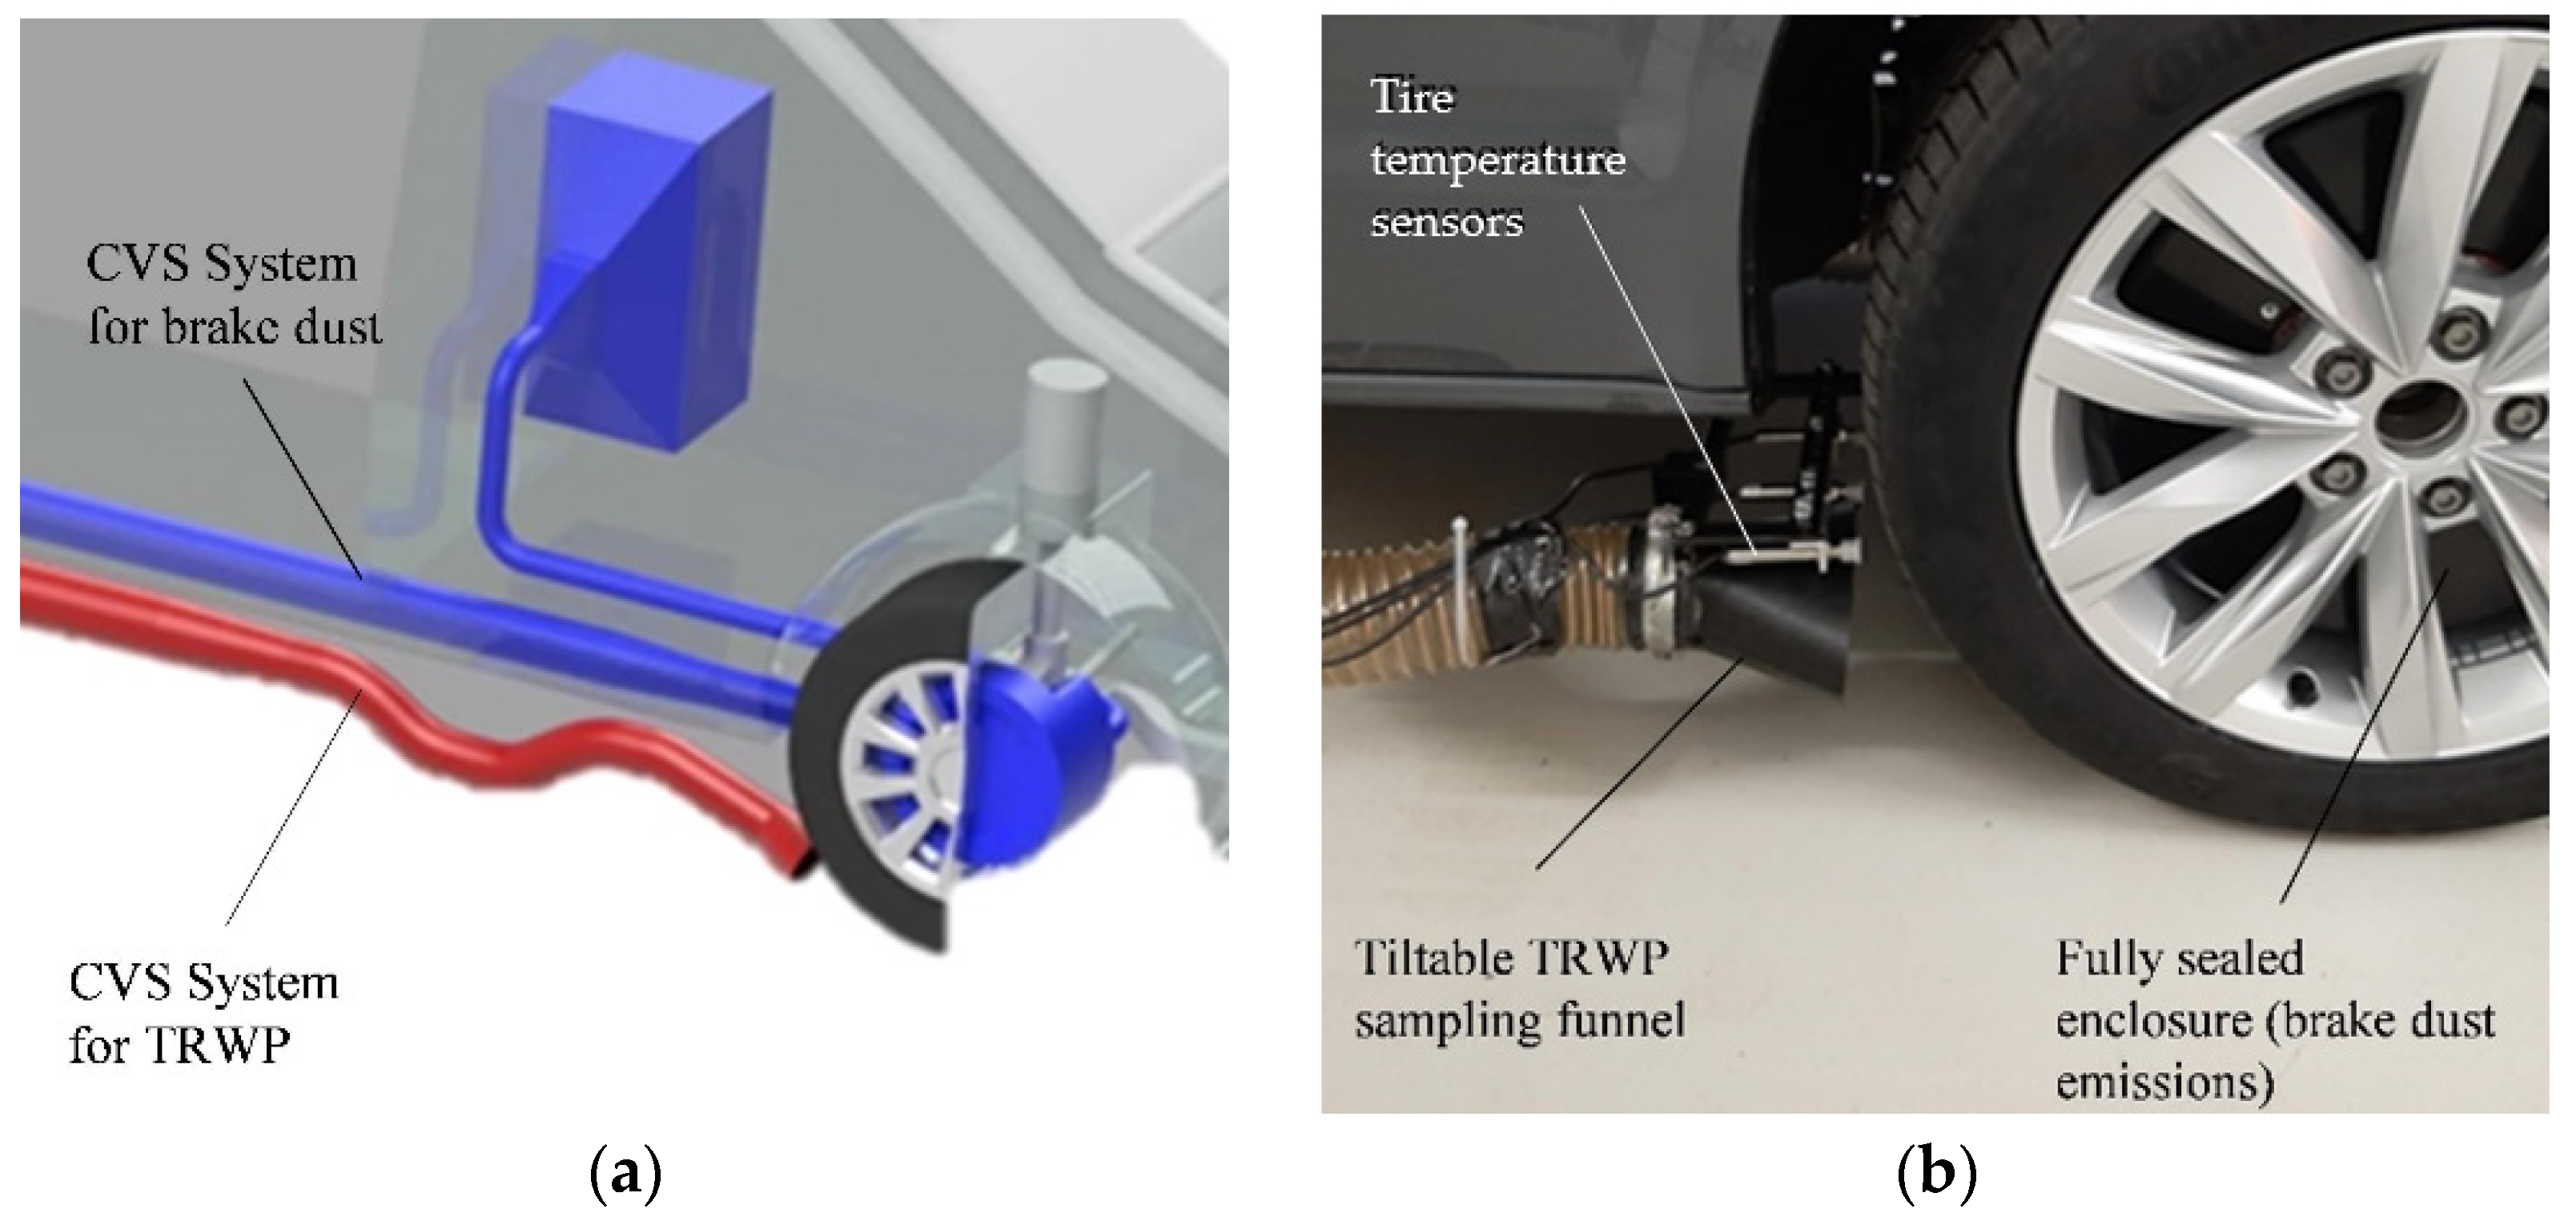
To simulate real particle dispersion in urban areas, knowledge of the vehicle’s emissions was indispensable. This included not only the wear particles emitted by the tyre, but also those that were carried along and detached by the tyre rotation. A particular challenge here was the recording of emission values with which real particle injection could be simulated, as these were strongly dependent on ambient and road conditions. With the help of a test vehicle and a suitable sampling system (see Figure 1), emission characteristics could be recorded while driving, and evaluated afterwards.
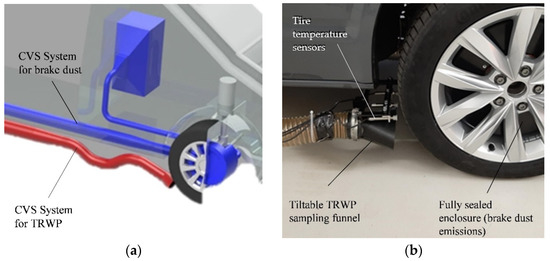
Figure 1.
(a) Assembled sampling system on vehicle with brake enclosure; (b) implemented tyre sampling system with inlet funnel and temperature sensors.
To this end, an oval inlet funnel was mounted isoaxially (in the alignment of the wheel centre plane) behind the tyre–road contact, which moved along with the steering movement of the wheel. This was ensured by the corresponding attachment to the track lever of the wheel suspension. The downstream measuring channel consisted of a flexible suction hose with a metal spiral to follow the movement of the wheel without stressing the measuring channel, and a rigid spiral tube in which the measuring probes were positioned. These were positioned centrally in the duct, and they directed the aerosol to the measuring devices via 90° measuring probes, with nozzle diameters adapted according to the sampling volume flow for isokinetic sampling. The entire measuring volume introduced by the inlet funnel was sucked in by means of a fan at the end of the measuring section, which allowed the present system to be classified as a CVS (constant volume sampling) measuring system. As the air flow changed according to the driving speed, the isokinetic sampling could only be implemented in the measuring tunnel itself. Due to this restriction, the sampling efficiency of the funnel decreased with higher vehicle speed. Another challenge was the decoupling of disturbance variables which, in this case, were mainly caused by particulate emissions from the brake. To prevent such emissions from being recorded, a brake enclosure had been previously developed, which discharged the particles produced in a separate measuring channel, so that they could no longer contaminate the measurement of the tyre emissions.
The emission characteristics were recorded on an RDE-compliant (real driving emissions) test cycle, in accordance with regulation EU 2018/1832, to represent and record real emissions in road traffic. Therefore, the cycle consisted of an urban part (driving speed < 60 km/h), an inter-urban part (driving speed 60–90 km/h) and a motorway part (driving speed 90–145 km/h).
2.1. Particle Sample Analysis
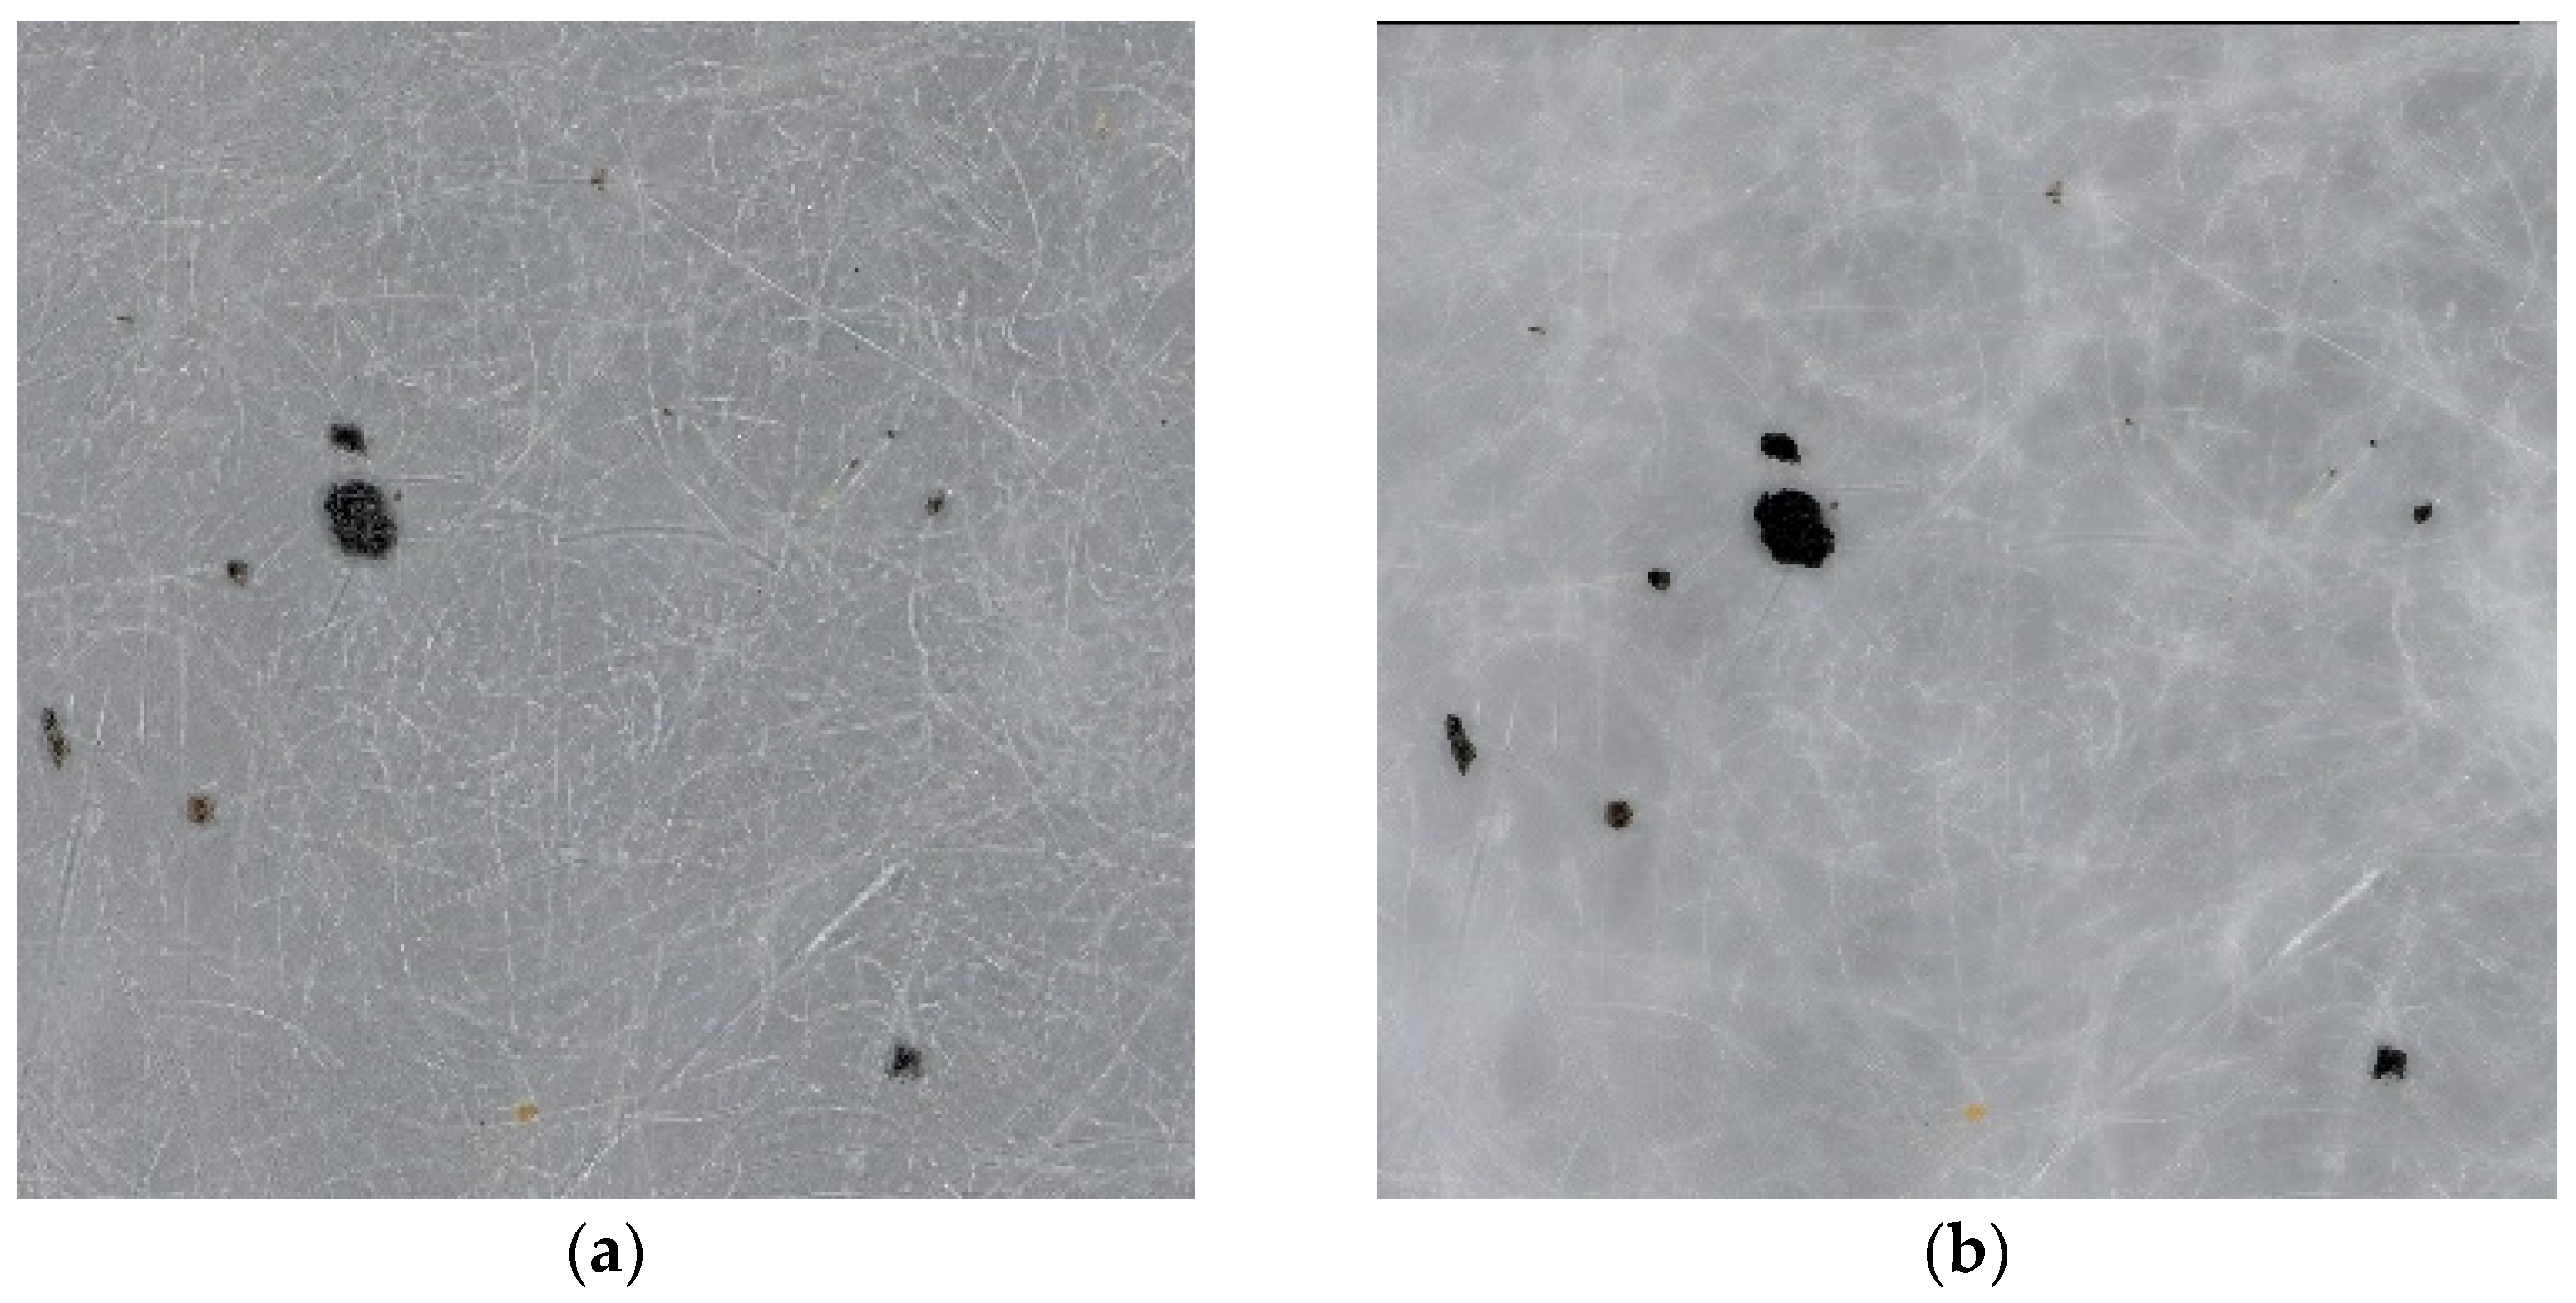
After the measurements had been carried out on the RDE cycle, the results had to be analysed and evaluated. The particles recorded by the measurement technology were deposited on sampling pads (glass fibre filter pads), and could thus be analysed under a microscope, with regard to their physical properties. To record the size distribution of the particles deposited on the filter pad, 3 images per filter were taken at different locations. Each image was a composite of several smaller images, so that an image area of 800 × 600 µm² was captured. For a better evaluation of the images, the image was recorded as HDR (high dynamic range image), which allowed for subsequent adjustment of the image, in terms of brightness, texture, contrast and colour tone, as shown in Figure 2.
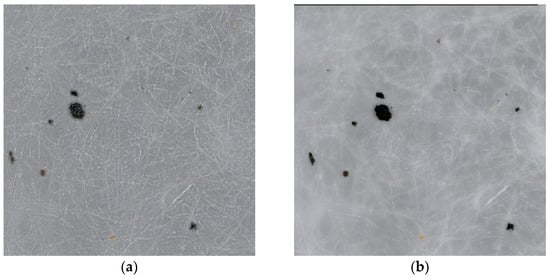
Figure 2.
(a) Microscope image of a filter area of the RDE cycle, original; (b) edited image with HDR.
This made it possible to clearly highlight particles to be evaluated, and improved the evaluation via image processing software. The magnification of the microscope also had an influence. When a high magnification was selected, then small particles were better detected, but this resulted in poorer visibility of the larger particles. If, on the other hand, a low magnification was chosen, then small particles could no longer be detected, and were therefore not taken into account in the evaluation of the size distribution. After several comparative tests were carried out, a medium magnification of ×1000 was chosen as a compromise, with which both small and large particles could be detected sufficiently well. Using these parameters, it was possible to reliably detect particles down to 300 nanometres; allowing for error, in the case of very small particles, due to reflections and structural irregularities.
After the particles had been captured with the microscope from several image sections of a filter pad, they could be converted into a size distribution density with the help of image processing software. To this end, the threshold values of light and dark areas for detection were set in such a way that, if possible, only particles were detected, and not the components of the glass fibre filter, which could also contain dark areas due to shadowing and refraction of the illumination. The measurement data thus obtained indicated the counted particles with their corresponding circle-equivalent diameters, which could be reproduced as a size distribution. It was critical to consider, at this point, all losses that occurred as a result of particles that were not detected. For example, as mentioned above, very small particles (smaller than 300 nm) were not recorded, and thus were not taken into account in the measurement. Furthermore, there were overlaps of particles in the analyses, that were evaluated as one large particle when captured by the image processing software. A final but decisive fact was that the filter load was never homogeneous, and that therefore the particle distribution on different areas of the filter was different.
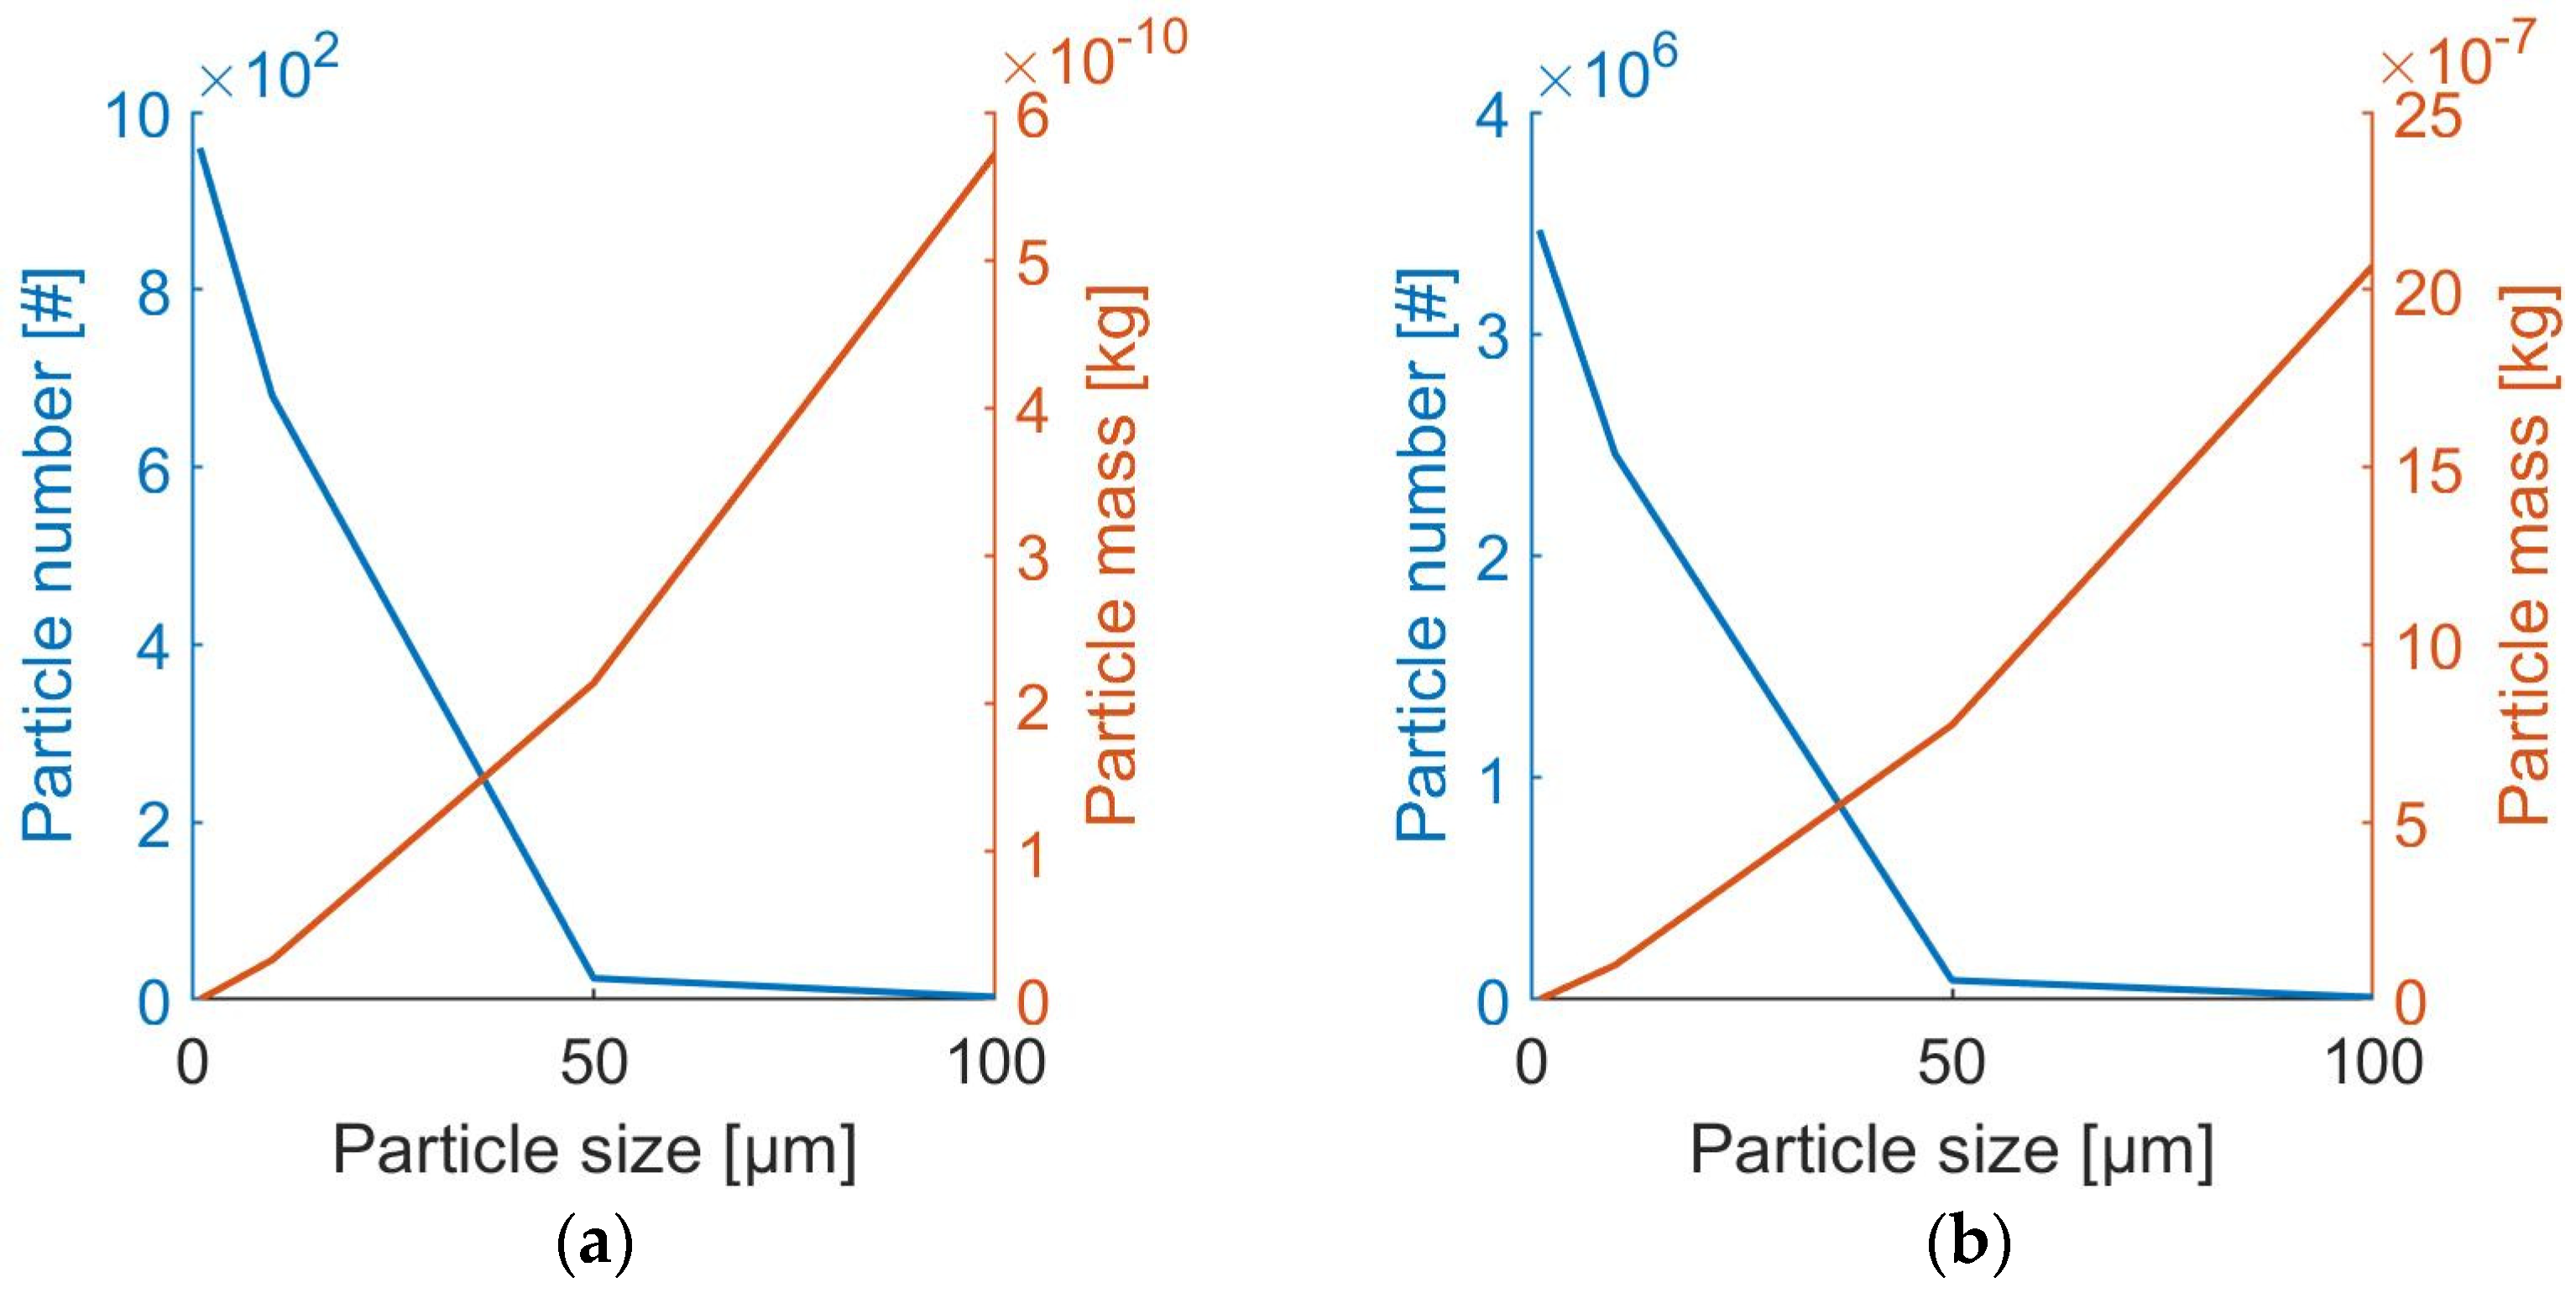
In order to obtain a more general statement about the size distribution of the entire filter, the arithmetic mean was formed over all recorded image sections. As the size distribution evaluated in this way only referred to a small area (averaged over 3 images with an area of 800 × 600 µm²) of the filter, the averaged particle size distribution (PSD) was extrapolated to the entire filter pad size. The filter pad was circular, with a diameter of 47 mm. Relating the total area to the area under consideration resulted in a factor of approximately 3614, which then had to be multiplied by the size distribution. Here in Figure 3 is shown, that the size distribution changed only quantitatively and not qualitatively.
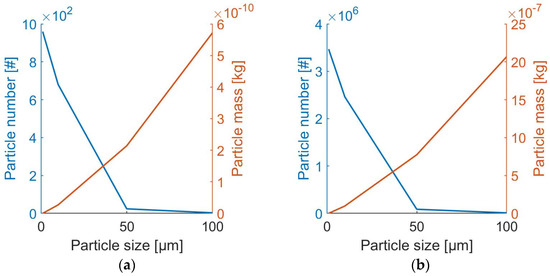
Figure 3.
(a) PSD of section (800 × 600 µm²); (b) PSD of total area of the filter.
As the particle mass for injection was required for the simulation, the recorded particle number needed to be converted via the particle density, in accordance with Equation (1):
m = π/6⋅d³⋅ρ
Though the collected particles were not only pure tread particles, the assumed density for conversion here referred to the density of rubber tread particles with a numerical value of 1.2 g/cm³ [17], and the particles were viewed simplified as circles; likewise the circle-equivalent diameter of the particles specified by the image processing software. These simplifications had to be made, due to the complex form of the collected particles, and the highly varied density of the sample, which consisted of several different materials. This provided the size-fractionated particle mass to be injected for the simulation.
2.2. The Simulation Model
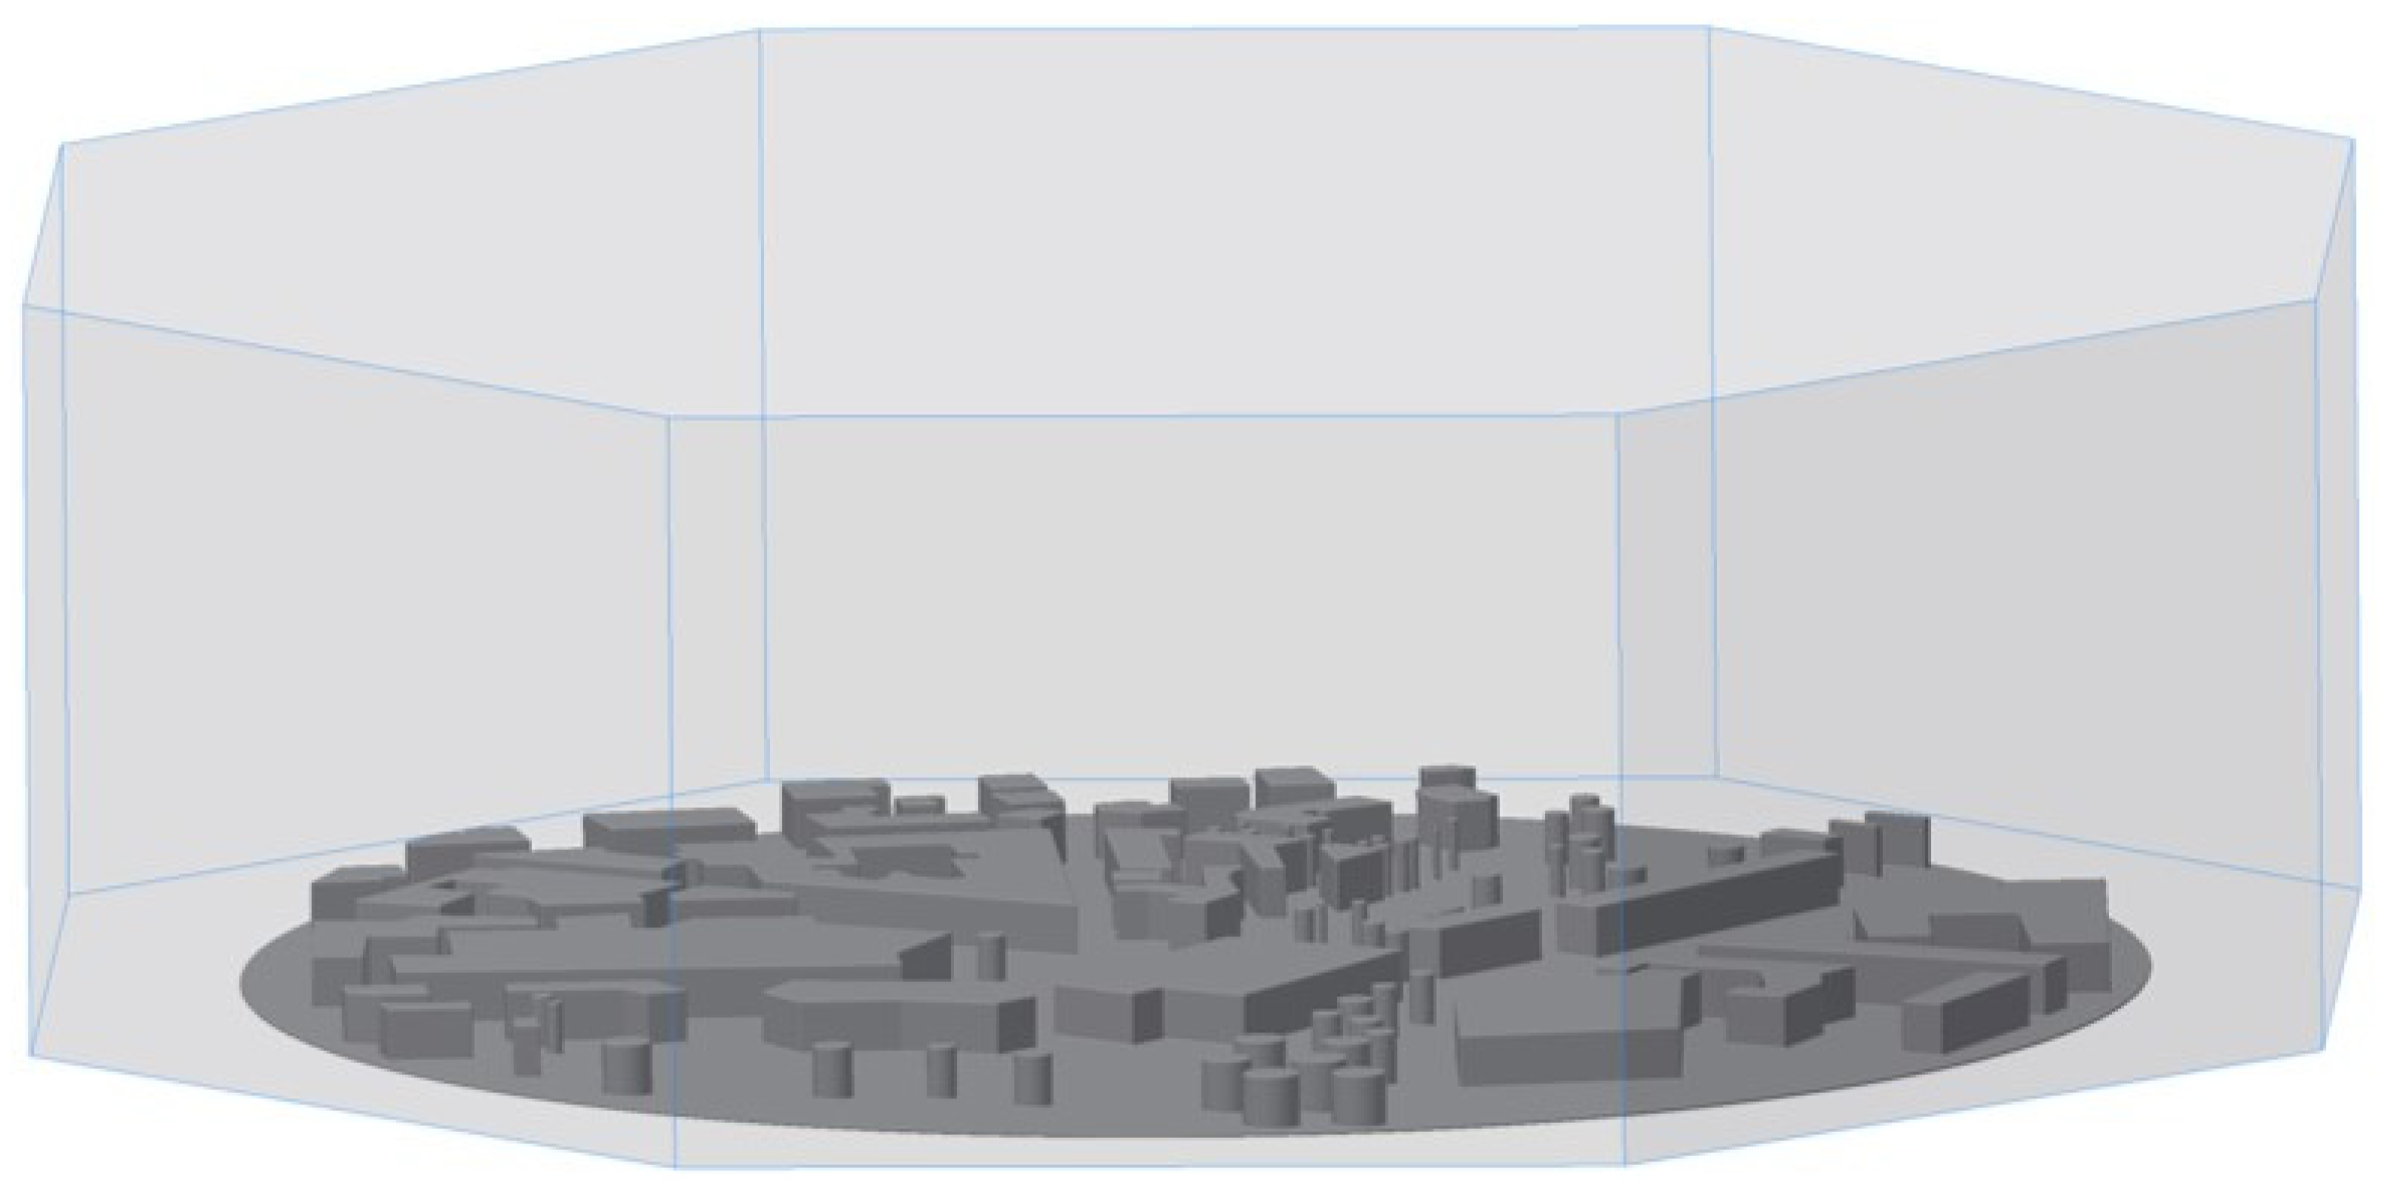
A suitable model then had to be built as a simulation. To this end, a CAD (computer-aided design) model of the object to be considered was created, which was then transferred into a CFD (computational fluid dynamics) model by integrating a flow body, subtracting the solid CAD model. To take into account the main and intermediate wind directions, the fluid body was modelled as an octagon. This made it possible to simulate wind from several directions. The main traffic intersection at the university location, Ilmenau (Thuringia, Germany), was chosen as the starting point for the model, and a corresponding CAD model with a diameter of 500 m was simulated, as can be seen in Figure 4. Due to the shopping mall in the vicinity, and the high traffic volume, the influence and impact of particulate emissions or swirls was considered most critical here. In the modelling, simplifications had to be made, with regard to building geometries and the representation of objects, such as trees and streets. Furthermore, an exact modelling of the object height was not applicable, as this information was not available, and the high level of detail would have affected the robustness of the simulation. The height would have had to be measured by hand, or estimated for each object itself. Due to this fact, a uniform object height of 14 m was defined for all modelled objects, and the buildings were modelled as a polygon with a flat top, as shown in Figure 4.
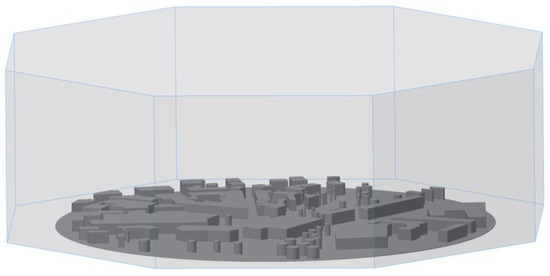
Figure 4.
City model for flow simulation and analysis of particle dynamics.
In addition, all walls and floors in the simulation were set to be reflective, so that impinging particles re-entered the flow with the same kinetic energy. The k-ω-SST model was used as the flow model, because it combined the advantages of near-wall and far-wall flow descriptions, and the model also achieved good results in other investigations. Other flow models were not considered in these investigations.
The wind direction and wind speed were obtained from external weather data, and integrated into the simulation. Thus, the simulation was carried out with south–west wind, with an average annual flow velocity of 15 km/h (corresponding to about 4 m/s). The injection of the particles was carried out in two different ways in these investigations: firstly, injection was carried out aerially on the intersection, to study the dispersion of emissions when vehicles accelerated on the intersection; secondly, injection was carried out along the major and minor roads, to assess the dispersion and impact on the immediate vicinity of the road. In addition, the study of particle pollution was also conducted at different height positions. This was because not only adults (at a height of 1.5 to 2 m) are affected by emissions, but also children and pets much closer to the ground, where particle concentrations may be even higher. The particles were launched into the calculated flow field without initial velocity. The reason for this was that vehicles passed the intersection or traffic roads from different directions, and thus no uniform emission trajectory could be defined.
2.3. Environmental Measurements by Means of a Certified Measuring Station
In order to be able to compare the simulation with reality, environmental measurements were carried out after the simulations, using a certified measuring station. The particles were recorded during the measurement, using an optical measuring method, and were divided into different fine-dust classes (particulate matter−PM1, PM2.5, PM4 and PM10). In addition, all of the particles that were sucked in were deposited on a glass fibre filter, which enabled a subsequent analysis of the physical and chemical properties of the particles. As the simulations were spatially limited due to their extent, only the measurement positions within the simulated environment could be used for comparison and validation of the simulation. Further measurement positions, with their measurement data from the measurement station, should provide information about the particle dynamics, size distribution and type of particles (morphology and chemical composition), which are located at different places with different traffic loads and different load collectives. The measurements were carried out on several days, each for an entire working day (approximately 7 to 8 h). To compare the environmental influences, measurements were carried out at high and low humidity. In addition to air humidity, the wind direction and wind speed were also recorded, and they too showed an influence on the particle dynamics.
To analyse the physical particle properties, a digital microscope was used to examine individual particles, by enlarging and characterising conspicuous particles. The size distribution was determined on the filters by using the same principle as previously described for injection. The chemical properties were determined by EDX analysis (energy-dispersive X-ray spectroscopy), using a scanning electron microscope (SEM). In EDX analysis, the sample is bombarded with an electron beam, which releases electrons from the atoms; electrons from higher shells then take the place of the released electrons, and emit energy in the form of a characteristic X-ray radiation. The wavelength of the emitted radiation can then be assigned to a chemical element. An EDX map (an analysis of the larger filter area, with a breakdown of the chemical components) was created for each filter (i.e., for each measuring position), so that the chemical composition of the filter area could be viewed, to obtain information about the individual components.
3. Results
3.1. Flow Simulation and Particle Injection
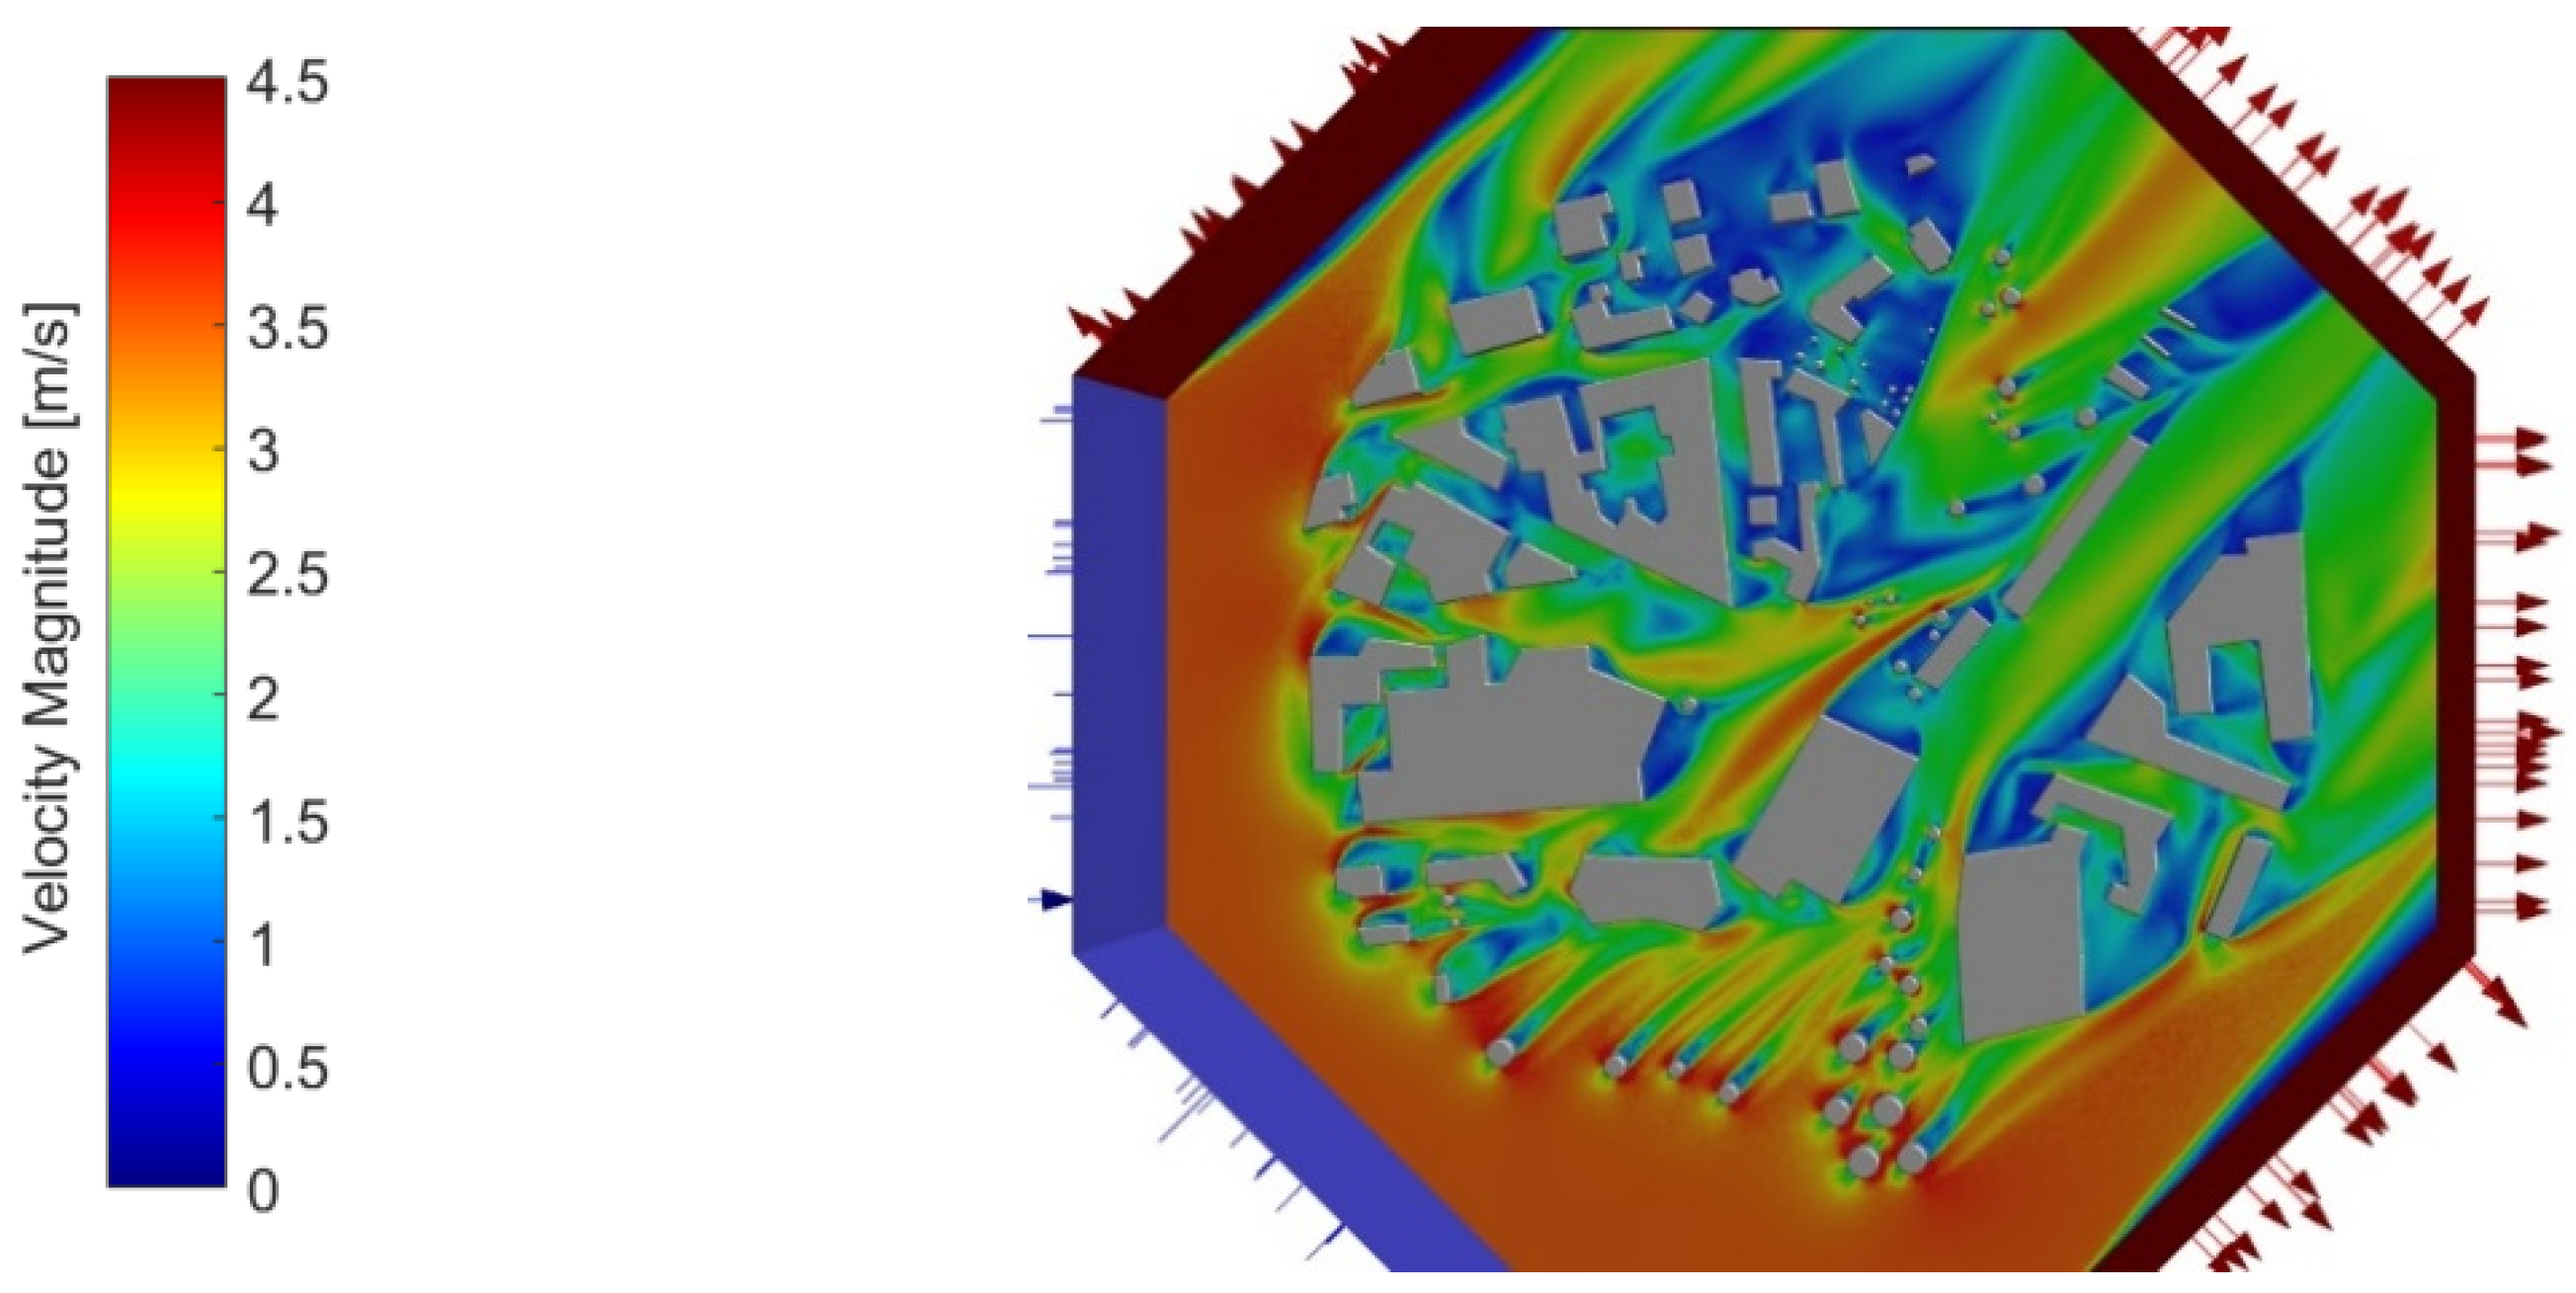
This study began with a flow simulation (see Figure 5) of the busy main traffic intersection in Ilmenau (Thuringia, Germany), in which particles were injected in a second step, in order to track the particle dynamics.

Figure 5.
Calculated flow with south–west wind.
The simulation of the flow conditions showed that the inflowing air masses accumulated at objects, and consequently flowed around them. In these accumulation areas, as well as in the flowed-around areas, a low flow velocity was shown, which favoured the deposition or accumulation of free-flying particles. Angled building corners, in particular, showed high potential for flow shadowing. The more the building faced into the wind, the greater the shadowing.
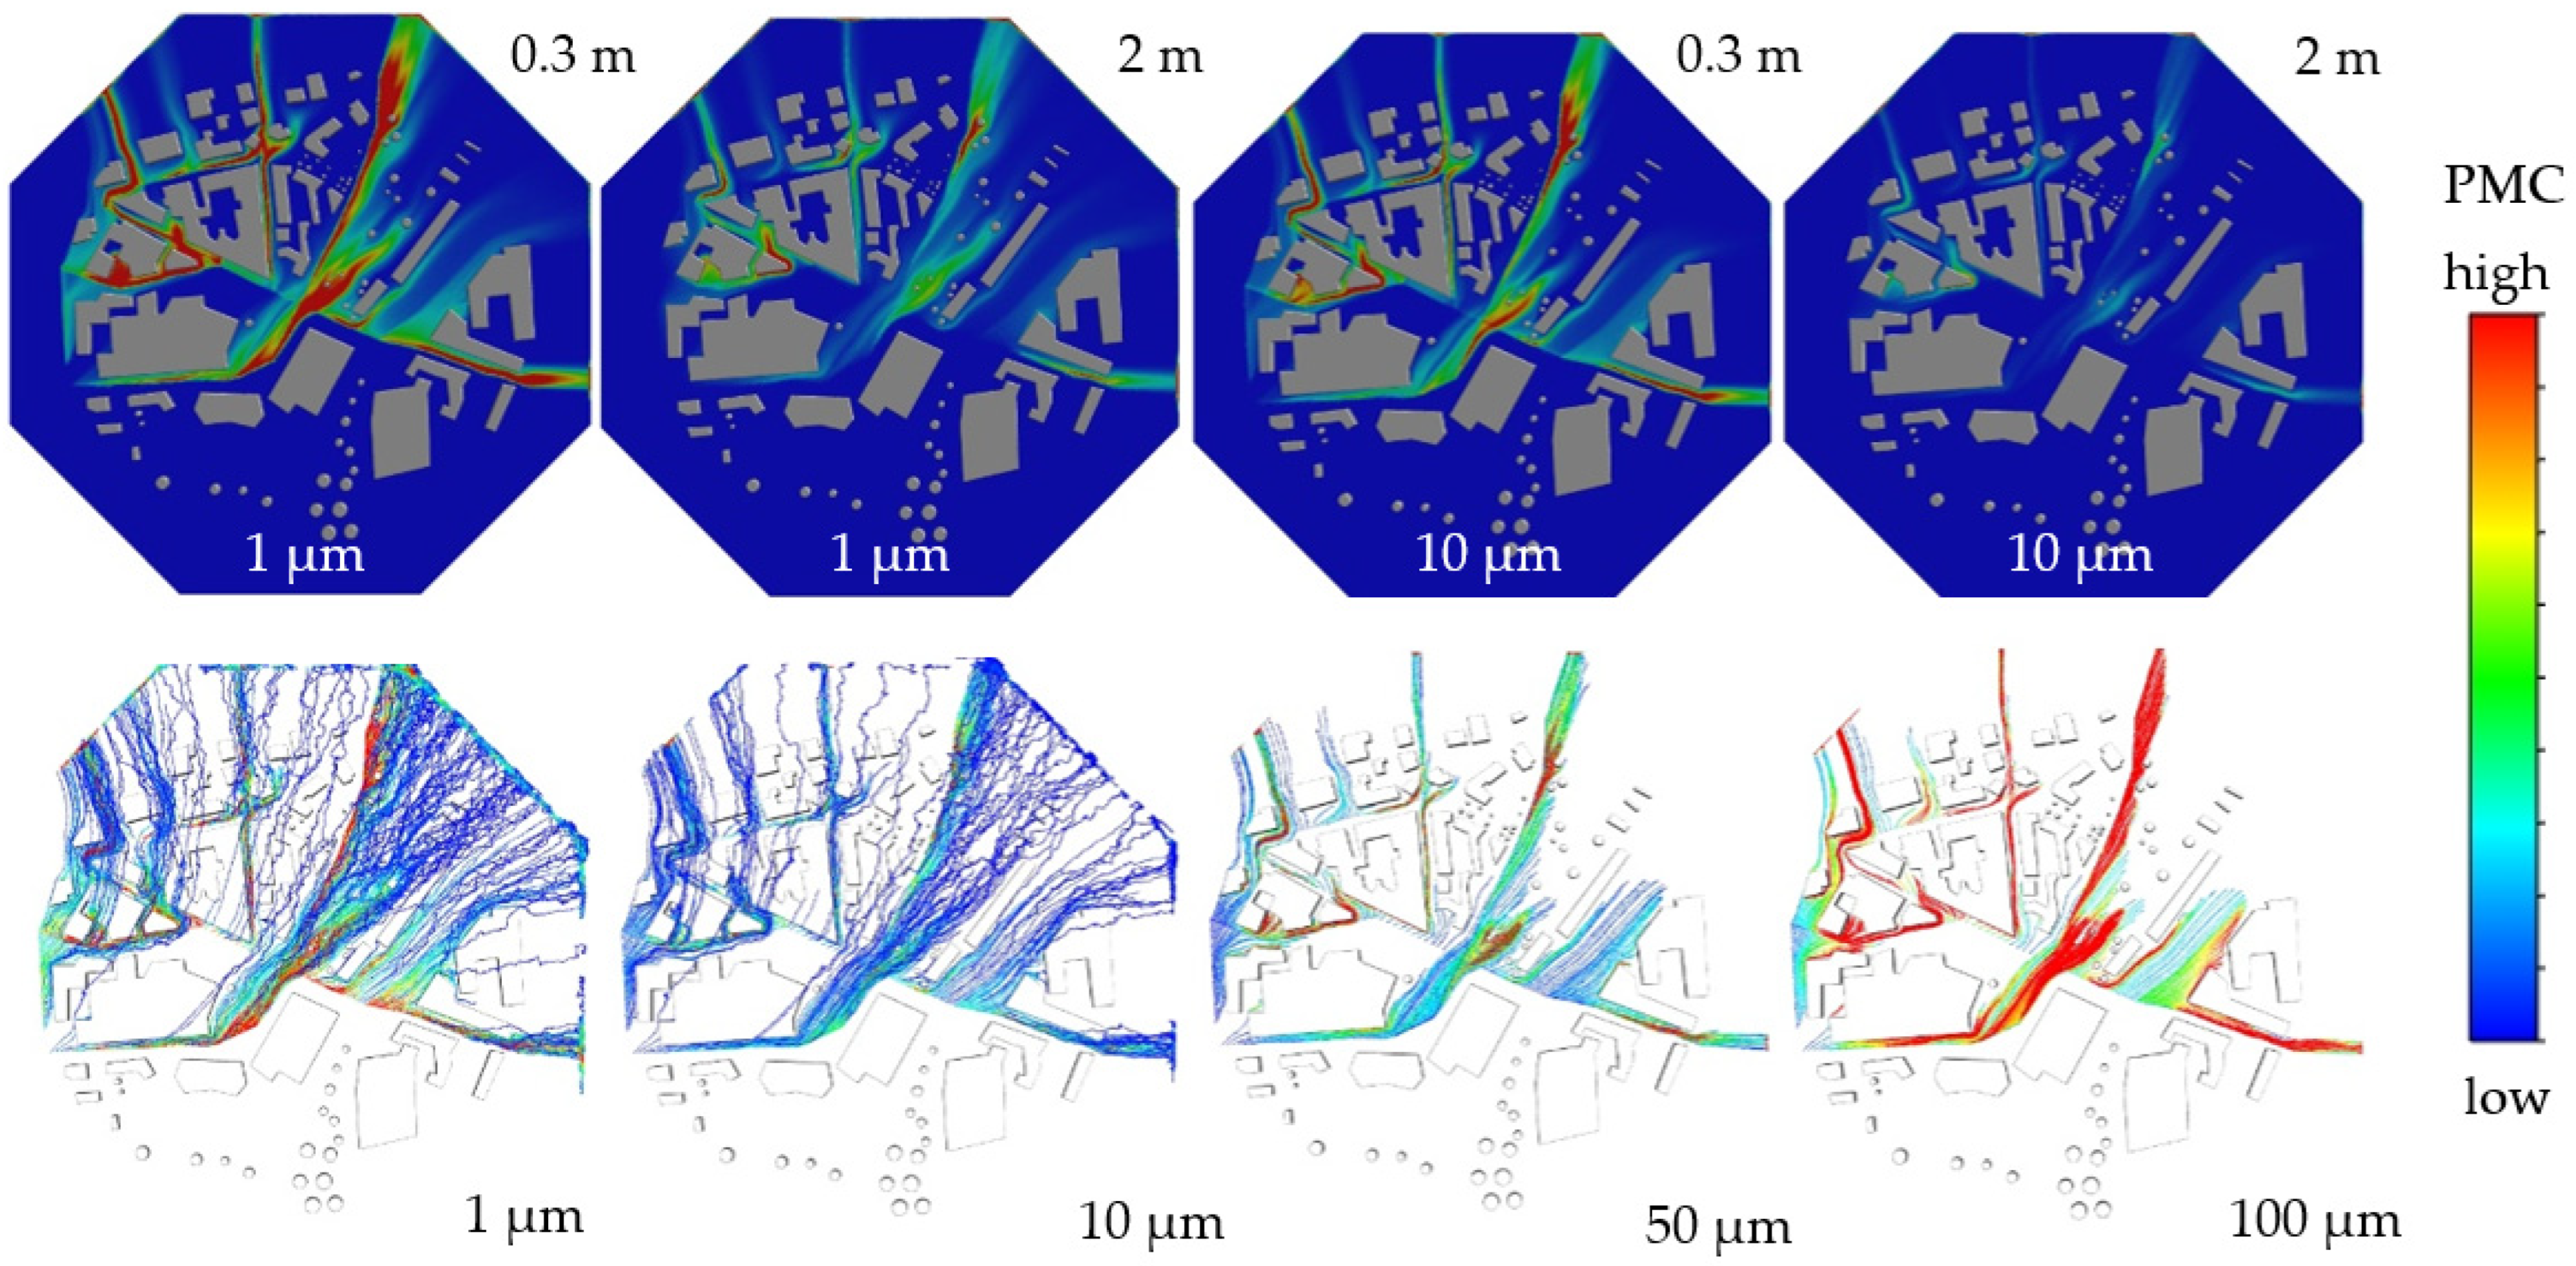
Let us first look at the injections along the traffic roads. The simulations showed large differences in the dispersion dynamics, depending on the particle diameter, cf. Figure 6.
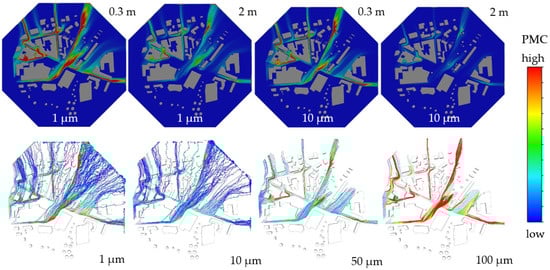
Figure 6.
Particle dispersion after injection on the roadways. Above: particle trajectories according to the viewing height coloured by PMC (particle mass concentration). Below: particle trajectories according to the particle size coloured by PMC.
Small particles, with an aerodynamic diameter of 1 µm, dispersed further in the environment, because they followed the air flow due to their low weight, and could thus avoid obstacles upwards or to the side. Larger particles sank after a certain distance, or settled on obstacles such as buildings. This was shown in the simulation by the particle transport paths becoming shorter. The dispersion in height decreased with larger particle diameter, because the influence of the weight force, and thus also the influence of the particle mass, increased more and more. In addition, the flow velocity decreased in the immediate vicinity of objects, so that particles in the flow experienced less deflection, which favoured the deposition of large particles in particular.
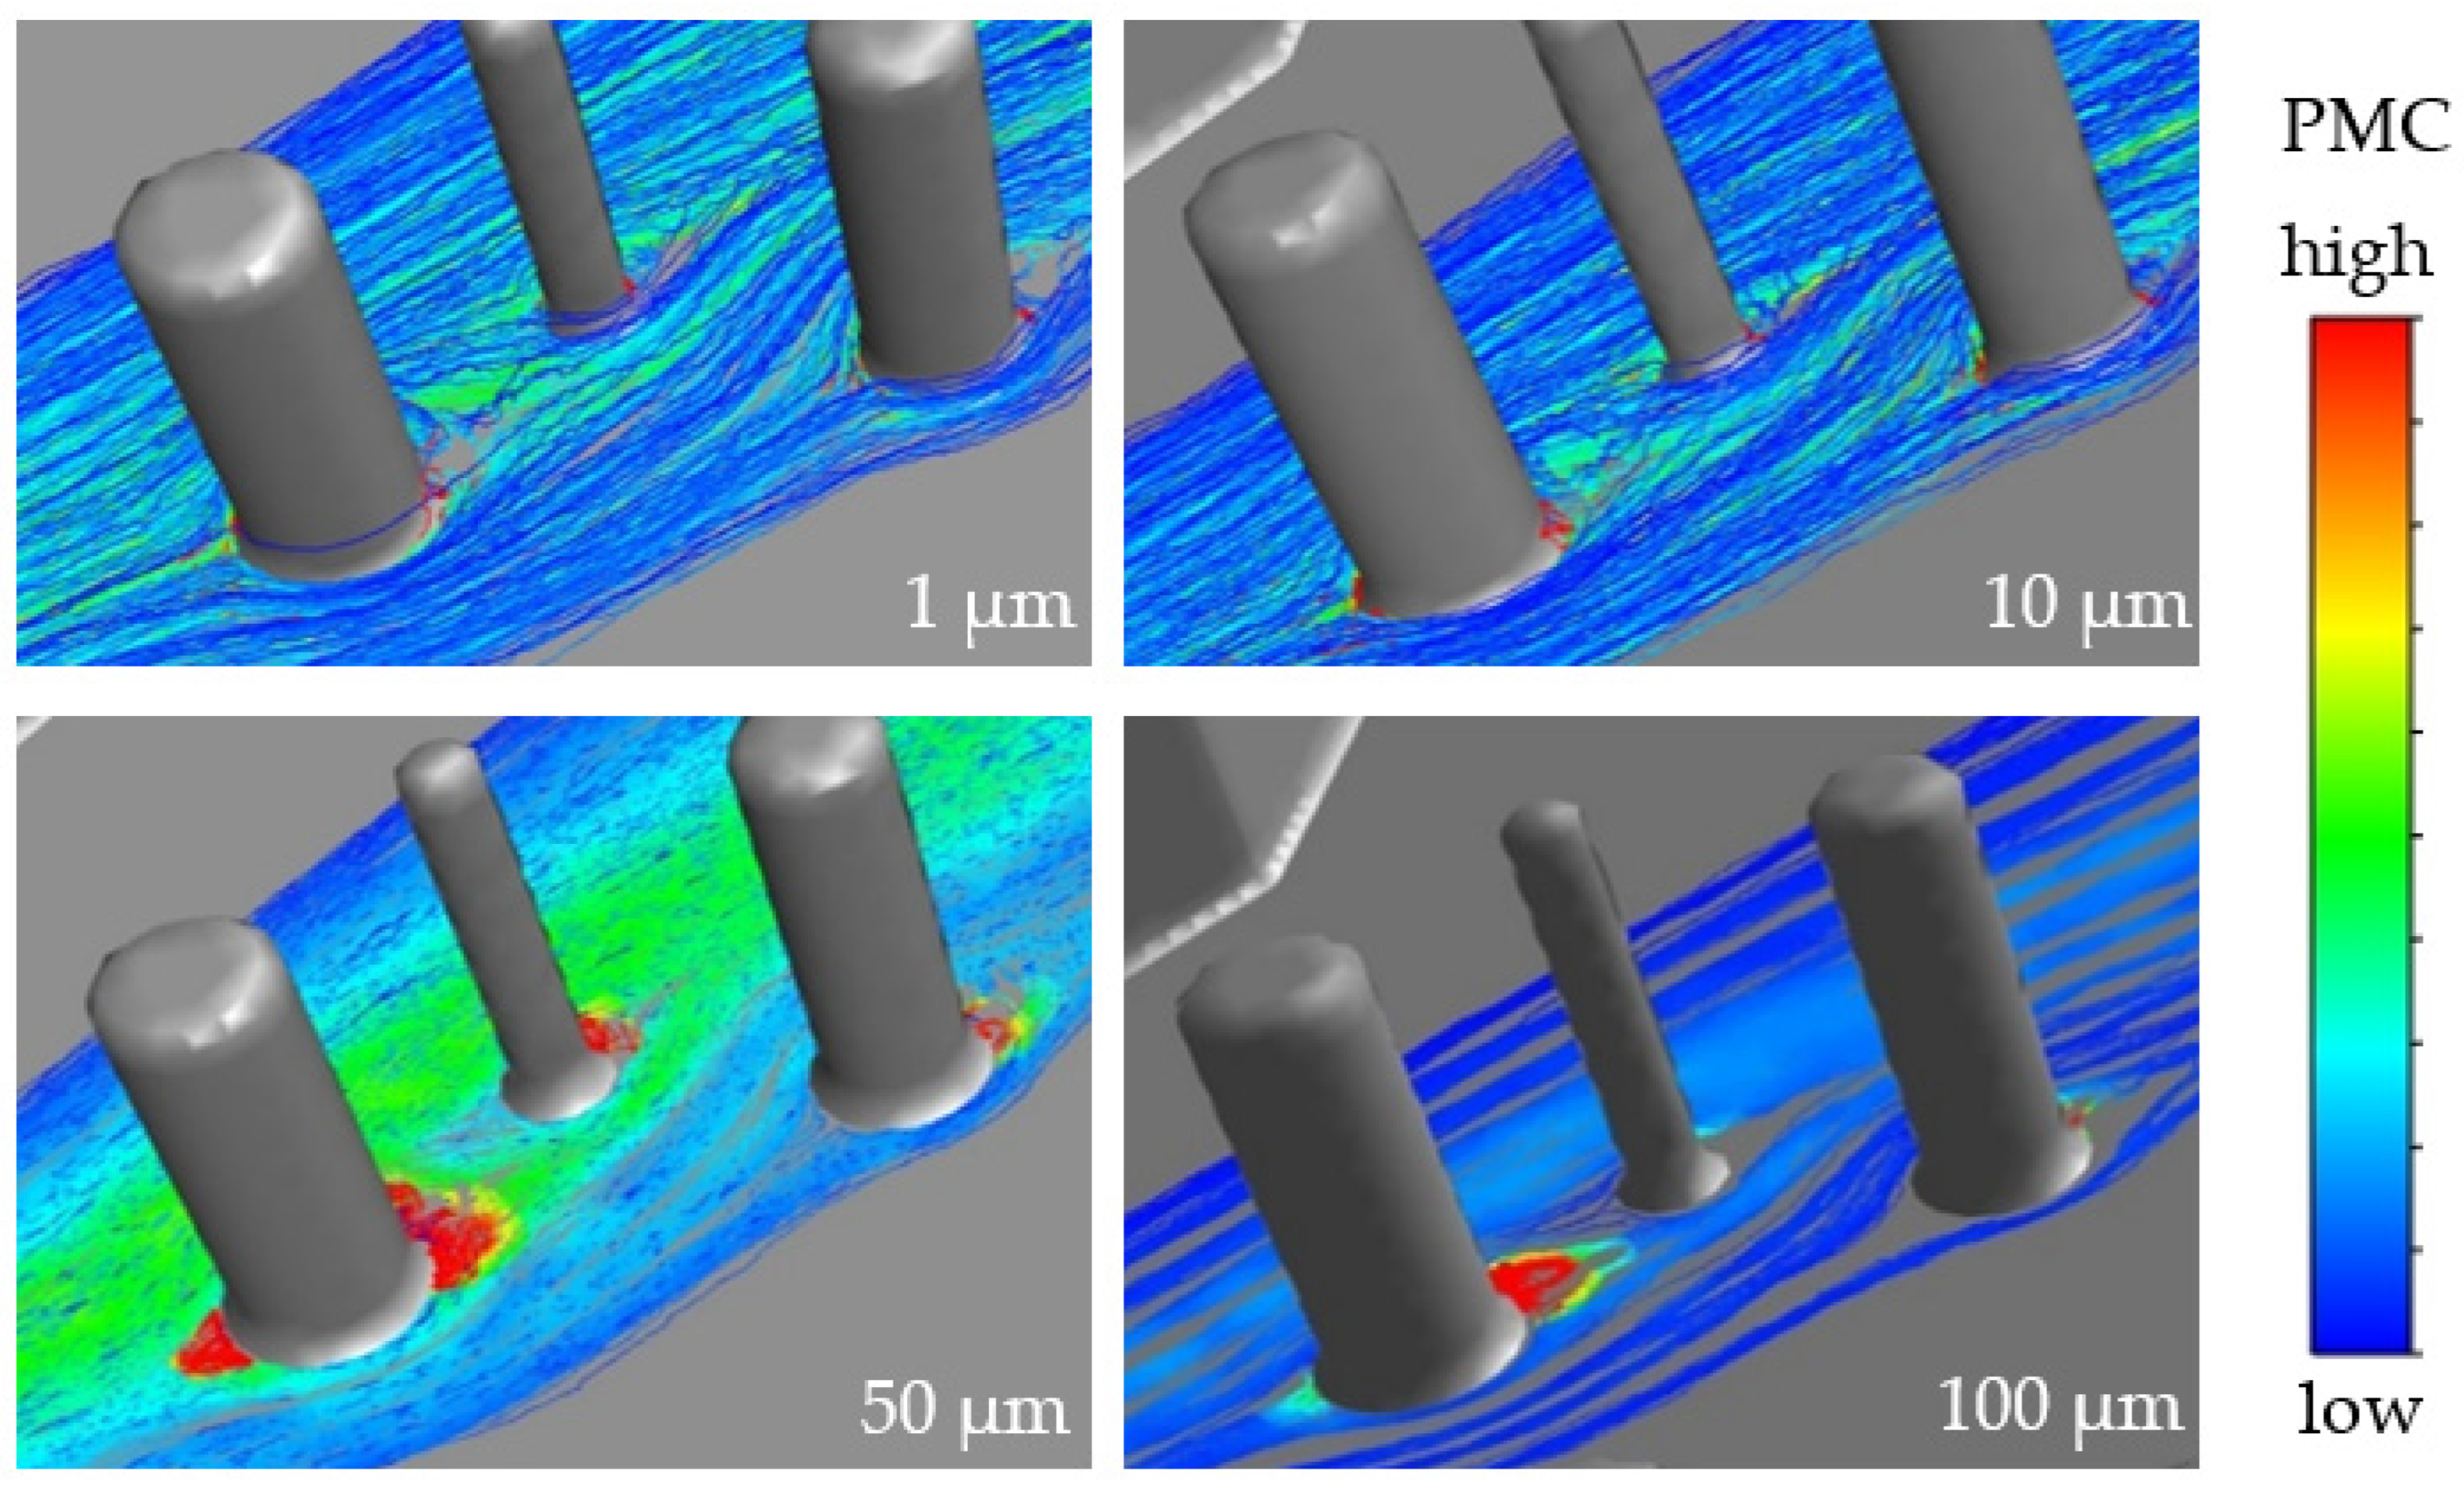
In the second type of injection, the particles were launched flat into the flow at the intersection, and then the movement in the flow field was observed.
Here, too, larger particles sank with increasing distance from the injection site, so that particle dispersion decreased. Because of the higher particle density—due to the concentrated injection of the same number of particles—the areas of accumulation and the dead water areas were also clearly visible here. Both upstream and downstream of the obstacles, areas of low flow velocity were formed where the particle concentration was very high (see Figure 7) and particles were consequently deposited.
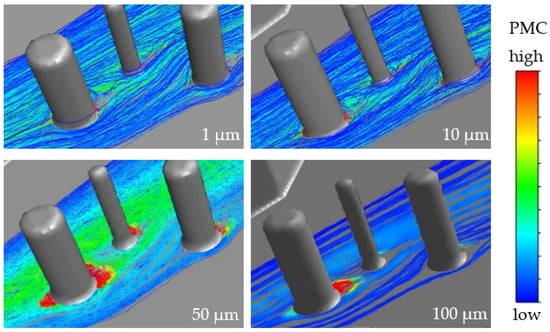
Figure 7.
Flow-around and deposition of particles as a function of particle diameter.
It was noticeable that mainly large particles accumulated in the dead water area behind objects, whereas particles up to 10 µm first accumulated behind objects, and then re-entered the flow, and were rarely deposited.
3.2. Real Measurements by Means of a Measuring Station
Since several simplifications had to be made in the simulations, that deviated from reality, measurements were carried out by means of a certified measuring station for comparison. The measurement positions defined for this purpose differed in terms of their ambient and traffic conditions, which made it possible to differentiate the influences on the particle load and composition.
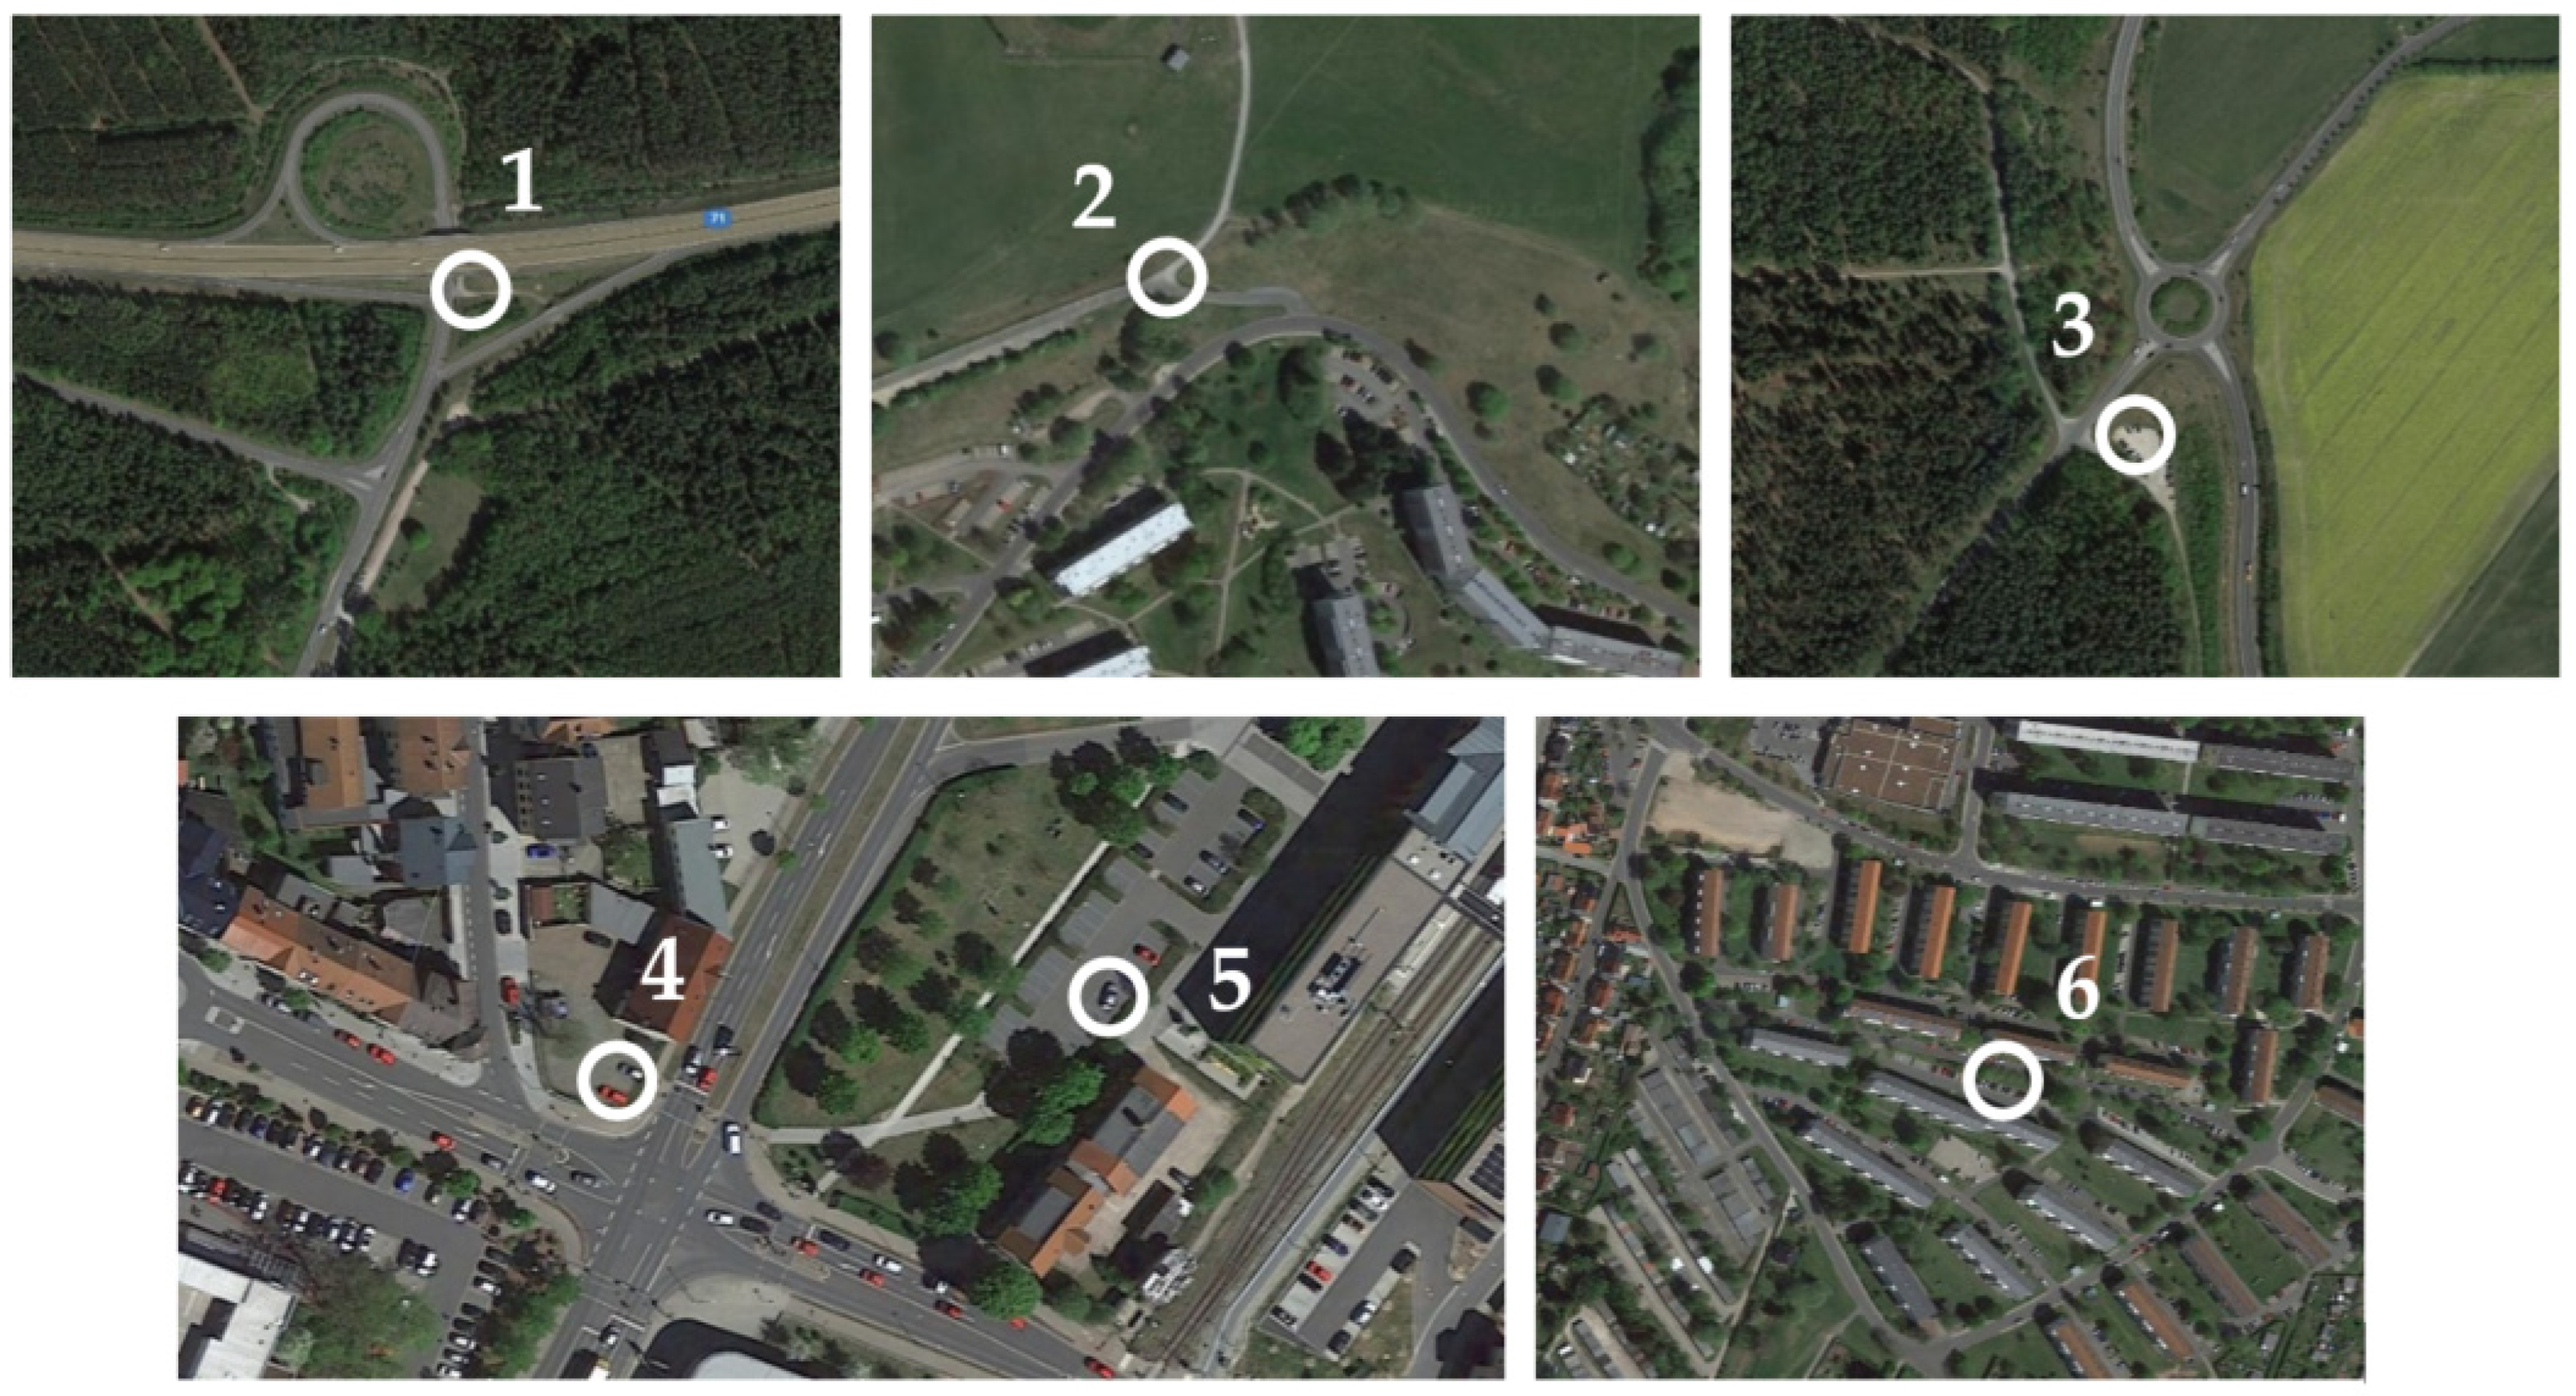
Six different measurement positions were defined for the measurements: (1) in the alignment of a motorway exit; (2) somewhat rural location (free-flowing air masses, low traffic volume, background pollution); (3) near a roundabout; (4) at the main traffic intersection; (5) near the main traffic intersection at the railway station (comparison with simulation); (6) in a residential area. Figure 8 shows the measurement positions on a map. The evaluation of the different measurement positions clearly showed the influence of the high traffic volume, and thus the increased particle pollution by vehicles.
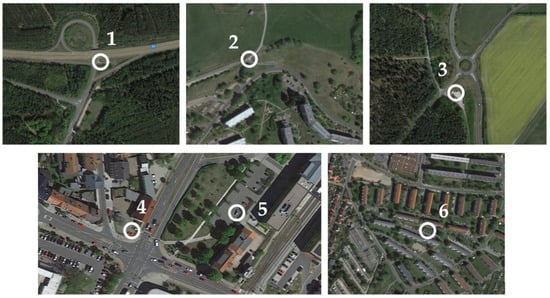
Figure 8.
Defined measurement positions for assessing particle pollution in different environments [Source: Google Earth, GeoBasis-DE/BKG (©2009)].
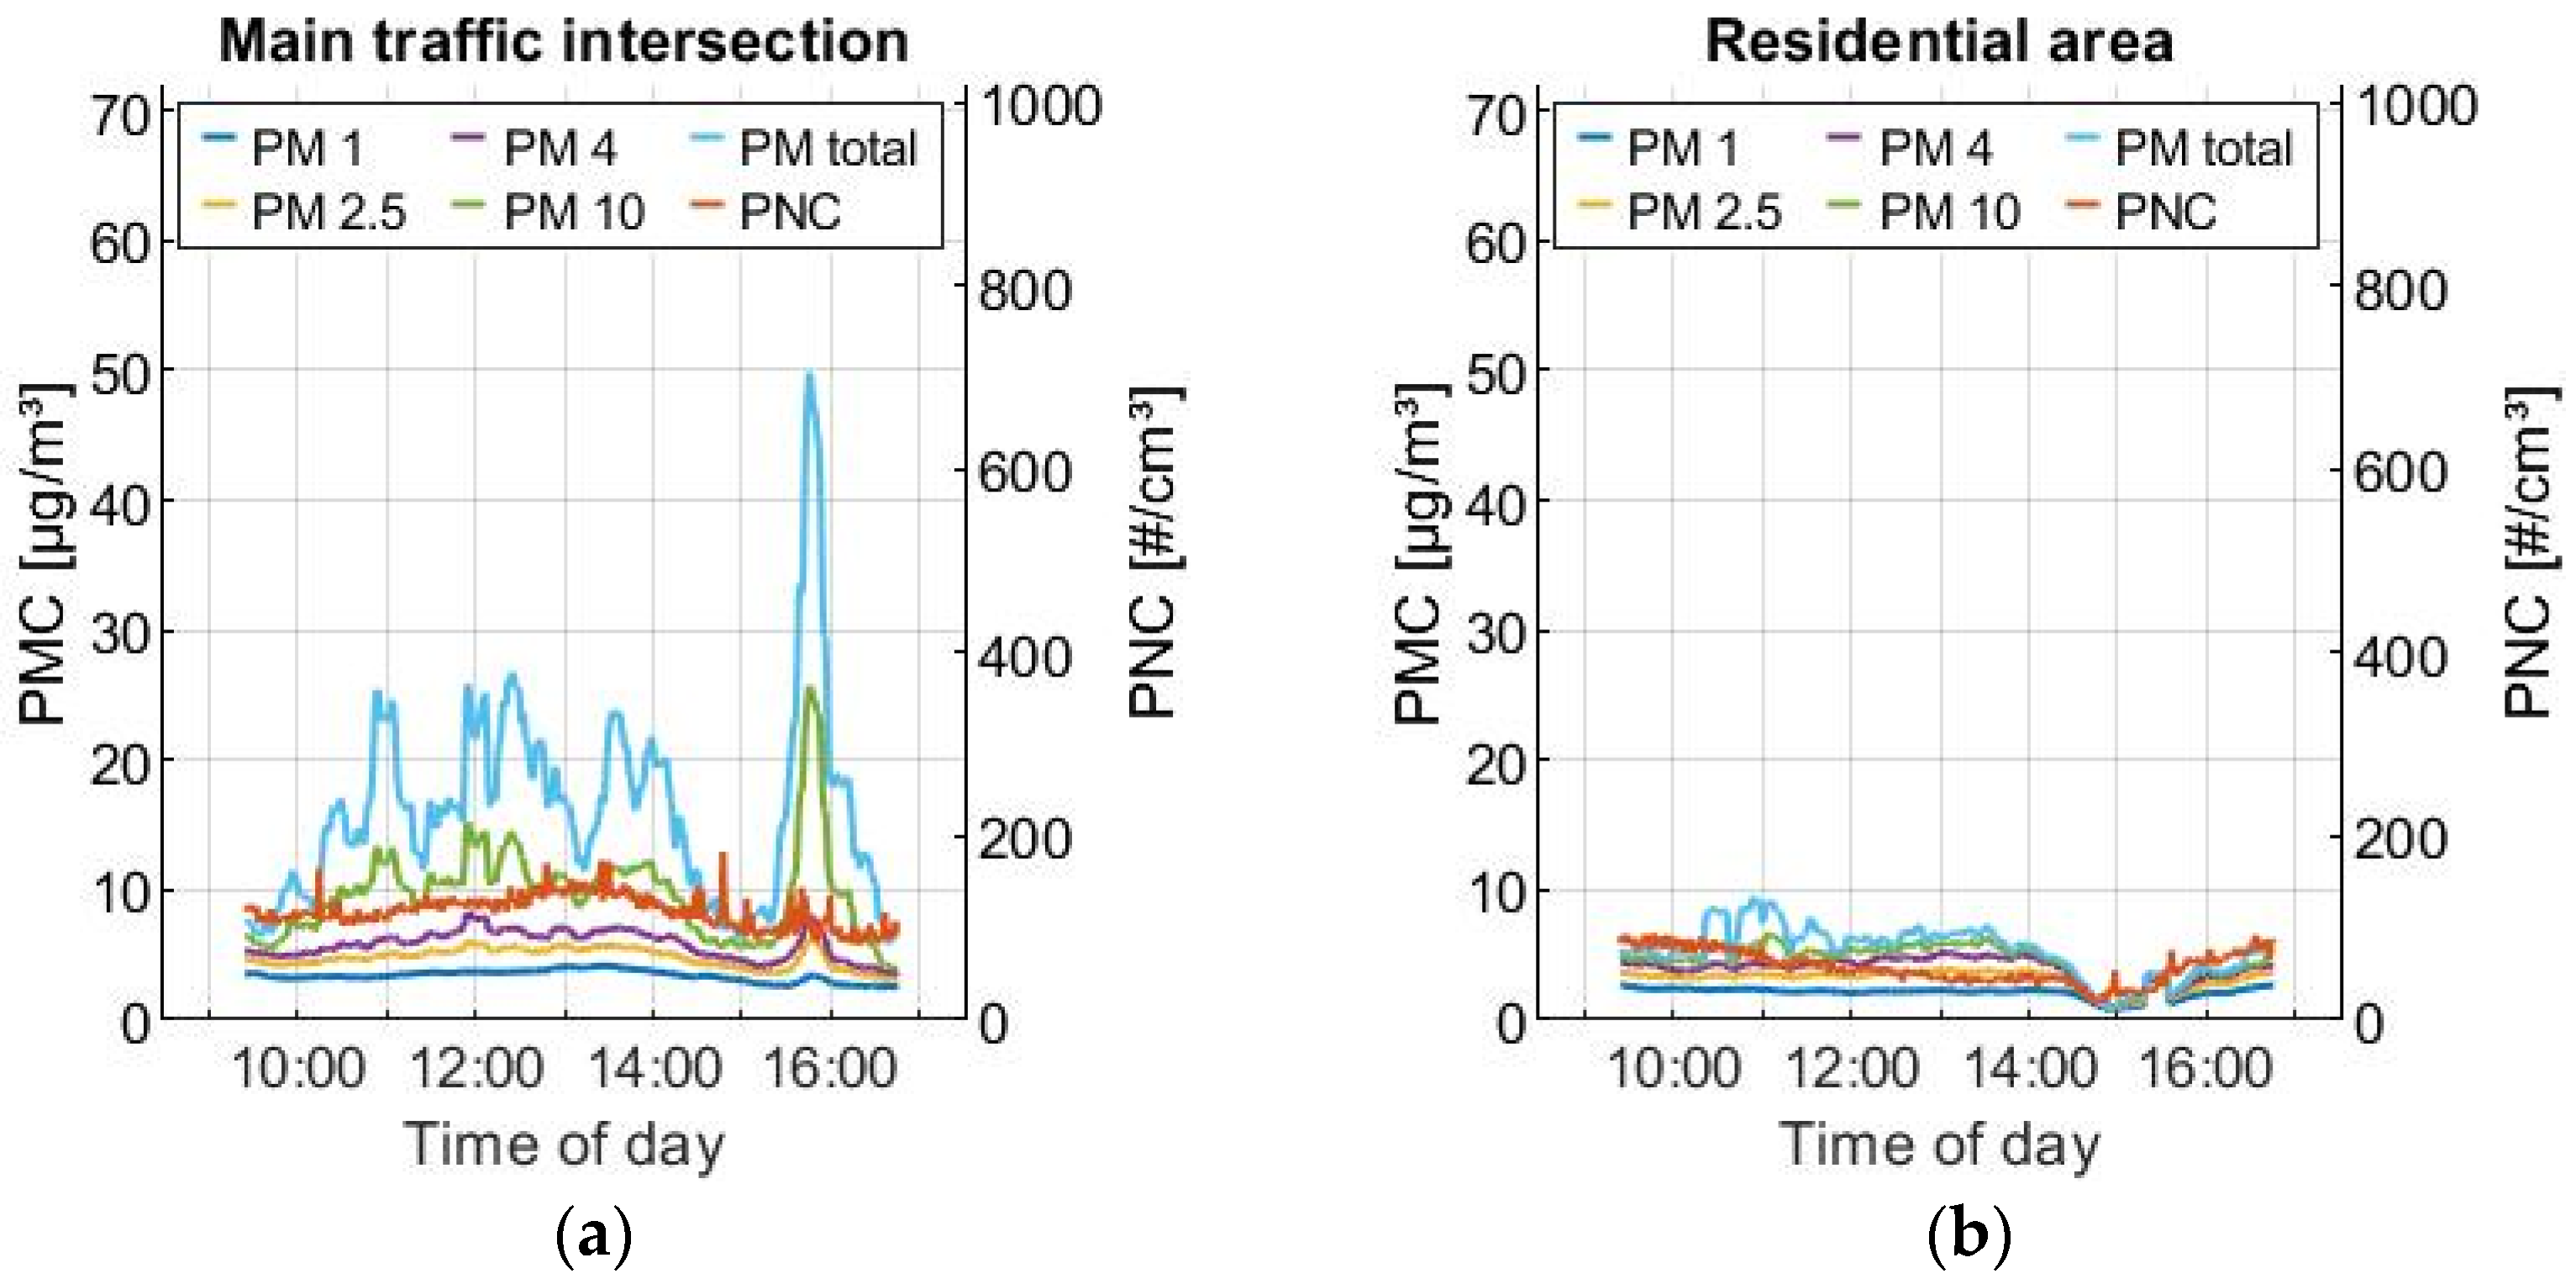
Comparing the measured values of the main traffic intersection—where the measuring station was positioned directly behind the pavement—with those in the residential area—where the measuring station was located at the roadside between the residential buildings—a clearly increased PNC (particle number concentration) and PMC, due to a high traffic volume, was detected, as shown in Figure 9.
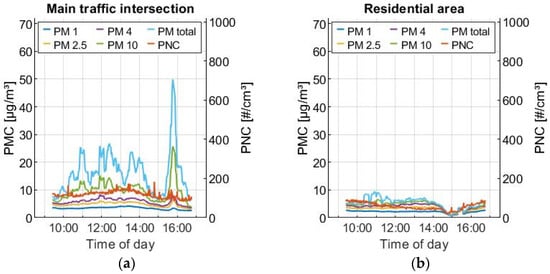
Figure 9.
(a) high traffic volume (main traffic intersection); (b) low traffic volume (residential area).
The dynamics of the vehicles also had an influence: high density of acceleration and deceleration manoeuvres at traffic lights was another reason for the high particle pollution. This was reflected in recurring PMC peaks, which could be largely attributed to these manoeuvres.
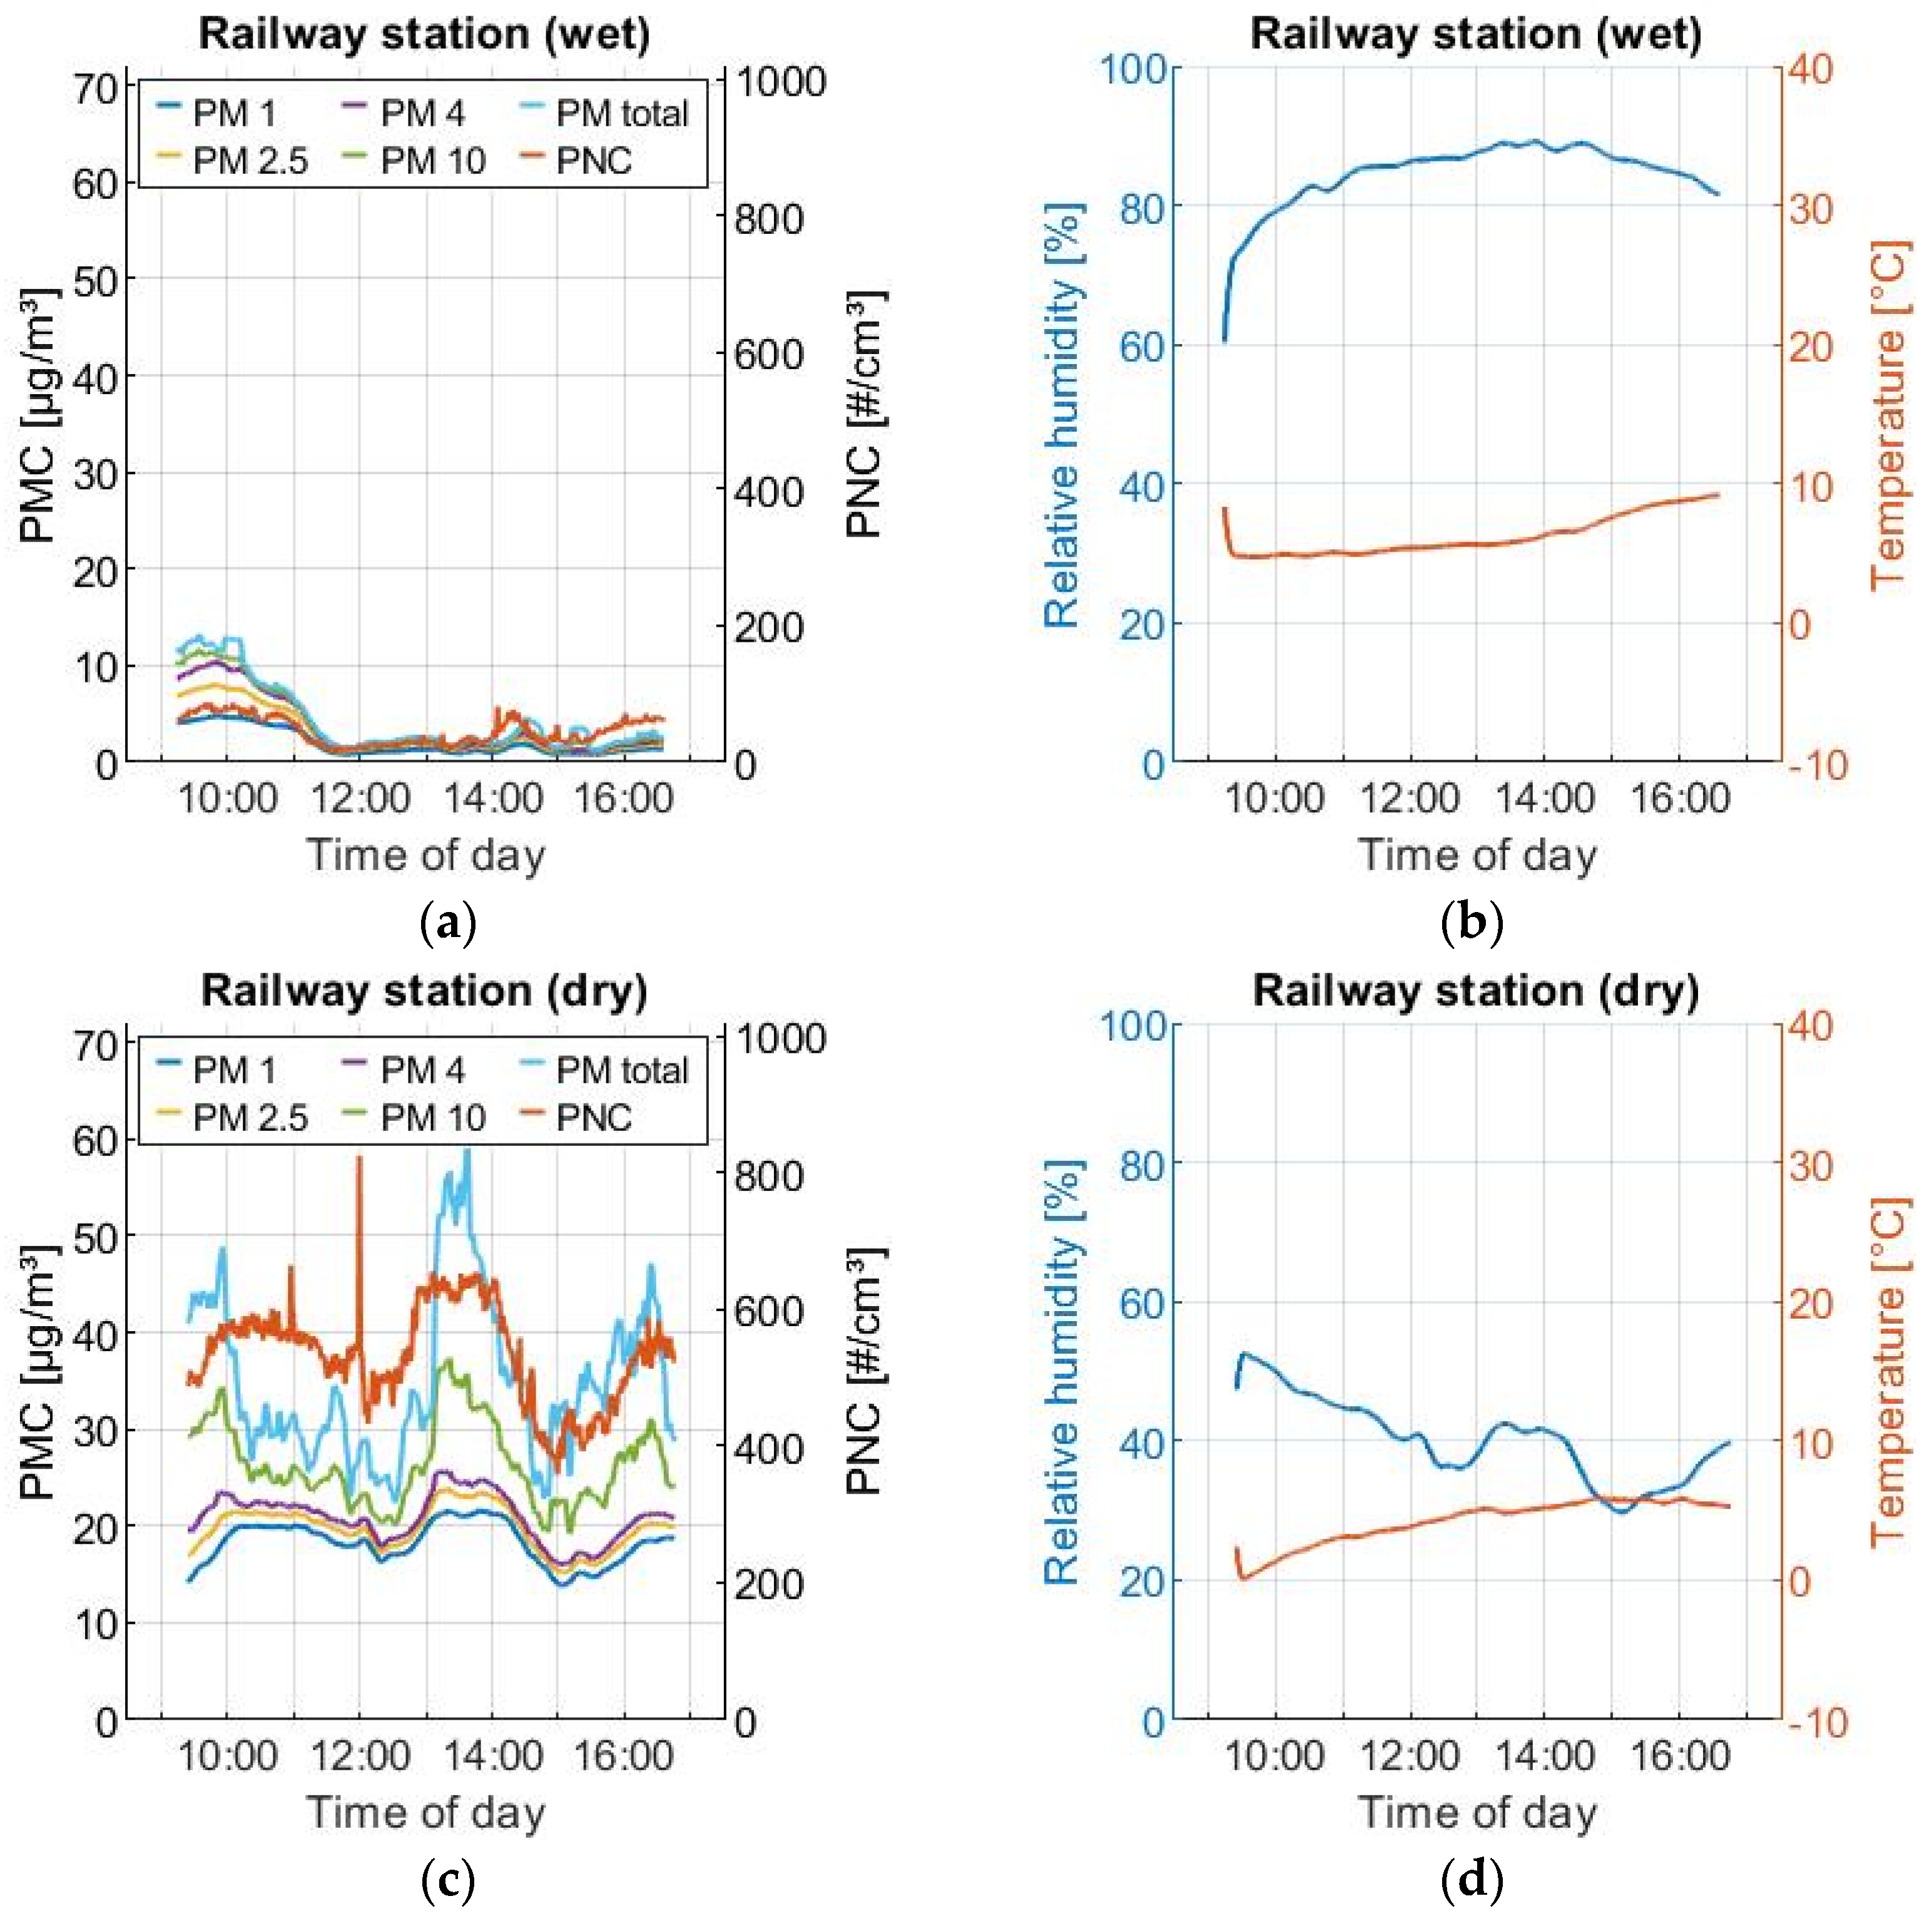
Investigations have shown that air humidity and precipitation also have a strong effect on the particle concentrations recorded (in terms of number and mass). At high humidity and wetness, only very low particle concentrations are found, because free-floating particles are bound to water droplets, and thus sink to the ground. According to the same principle, the resuspension of road or tyre particles is also greatly reduced. Particles that have been resuspended rarely enter the airflow, and instead either settle on objects or sink quickly to the ground, so that they cannot remain free-floating in the air. In dry weather with low humidity, the particle load is immensely high compared to that of an environment with high humidity.
The PNCs and PMCs were thus higher by a factor of 10, as can be seen in Figure 10. Furthermore, the PMC for the different particle size ranges was barely separated at high humidity, whereas particles larger than 4 µm in particular stood out clearly from the other size ranges at low humidity, as they were stirred up by the vehicle dynamics, and so were able to enter the airflow. Above all, these particles had a higher particle mass.

Figure 10.
Comparison of the influence of air humidity on PMC and PNC: (a,b) influence of high humidity; (c,d) influence of low humidity.
As noted above, the loaded filters of the measuring station were collected after the measuring days, and then analysed under a digital microscope. As it was very difficult to classify the particles unambiguously by optical observation, it was only possible to draw conclusions about the presumed emission sources of some particles. Nevertheless, this analysis showed a varying occurrence of different particles at the measurement positions, in that certain surfaces, structures and colours allowed an approximate classification. For example, a higher particle density of large tyre particles, which characteristically have an elongated, bead-like shape, could be seen on roads with heavy traffic, or at measuring positions with high vehicle dynamics. Furthermore, particles of road salt or sand could be detected in the tyre particles. Examples of this are shown in Figure 11.
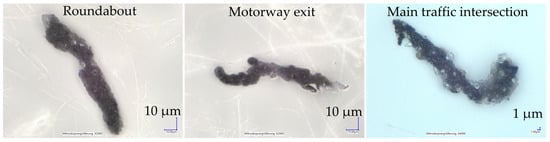
Figure 11.
Microscopy of particles on the filter of the measuring station.
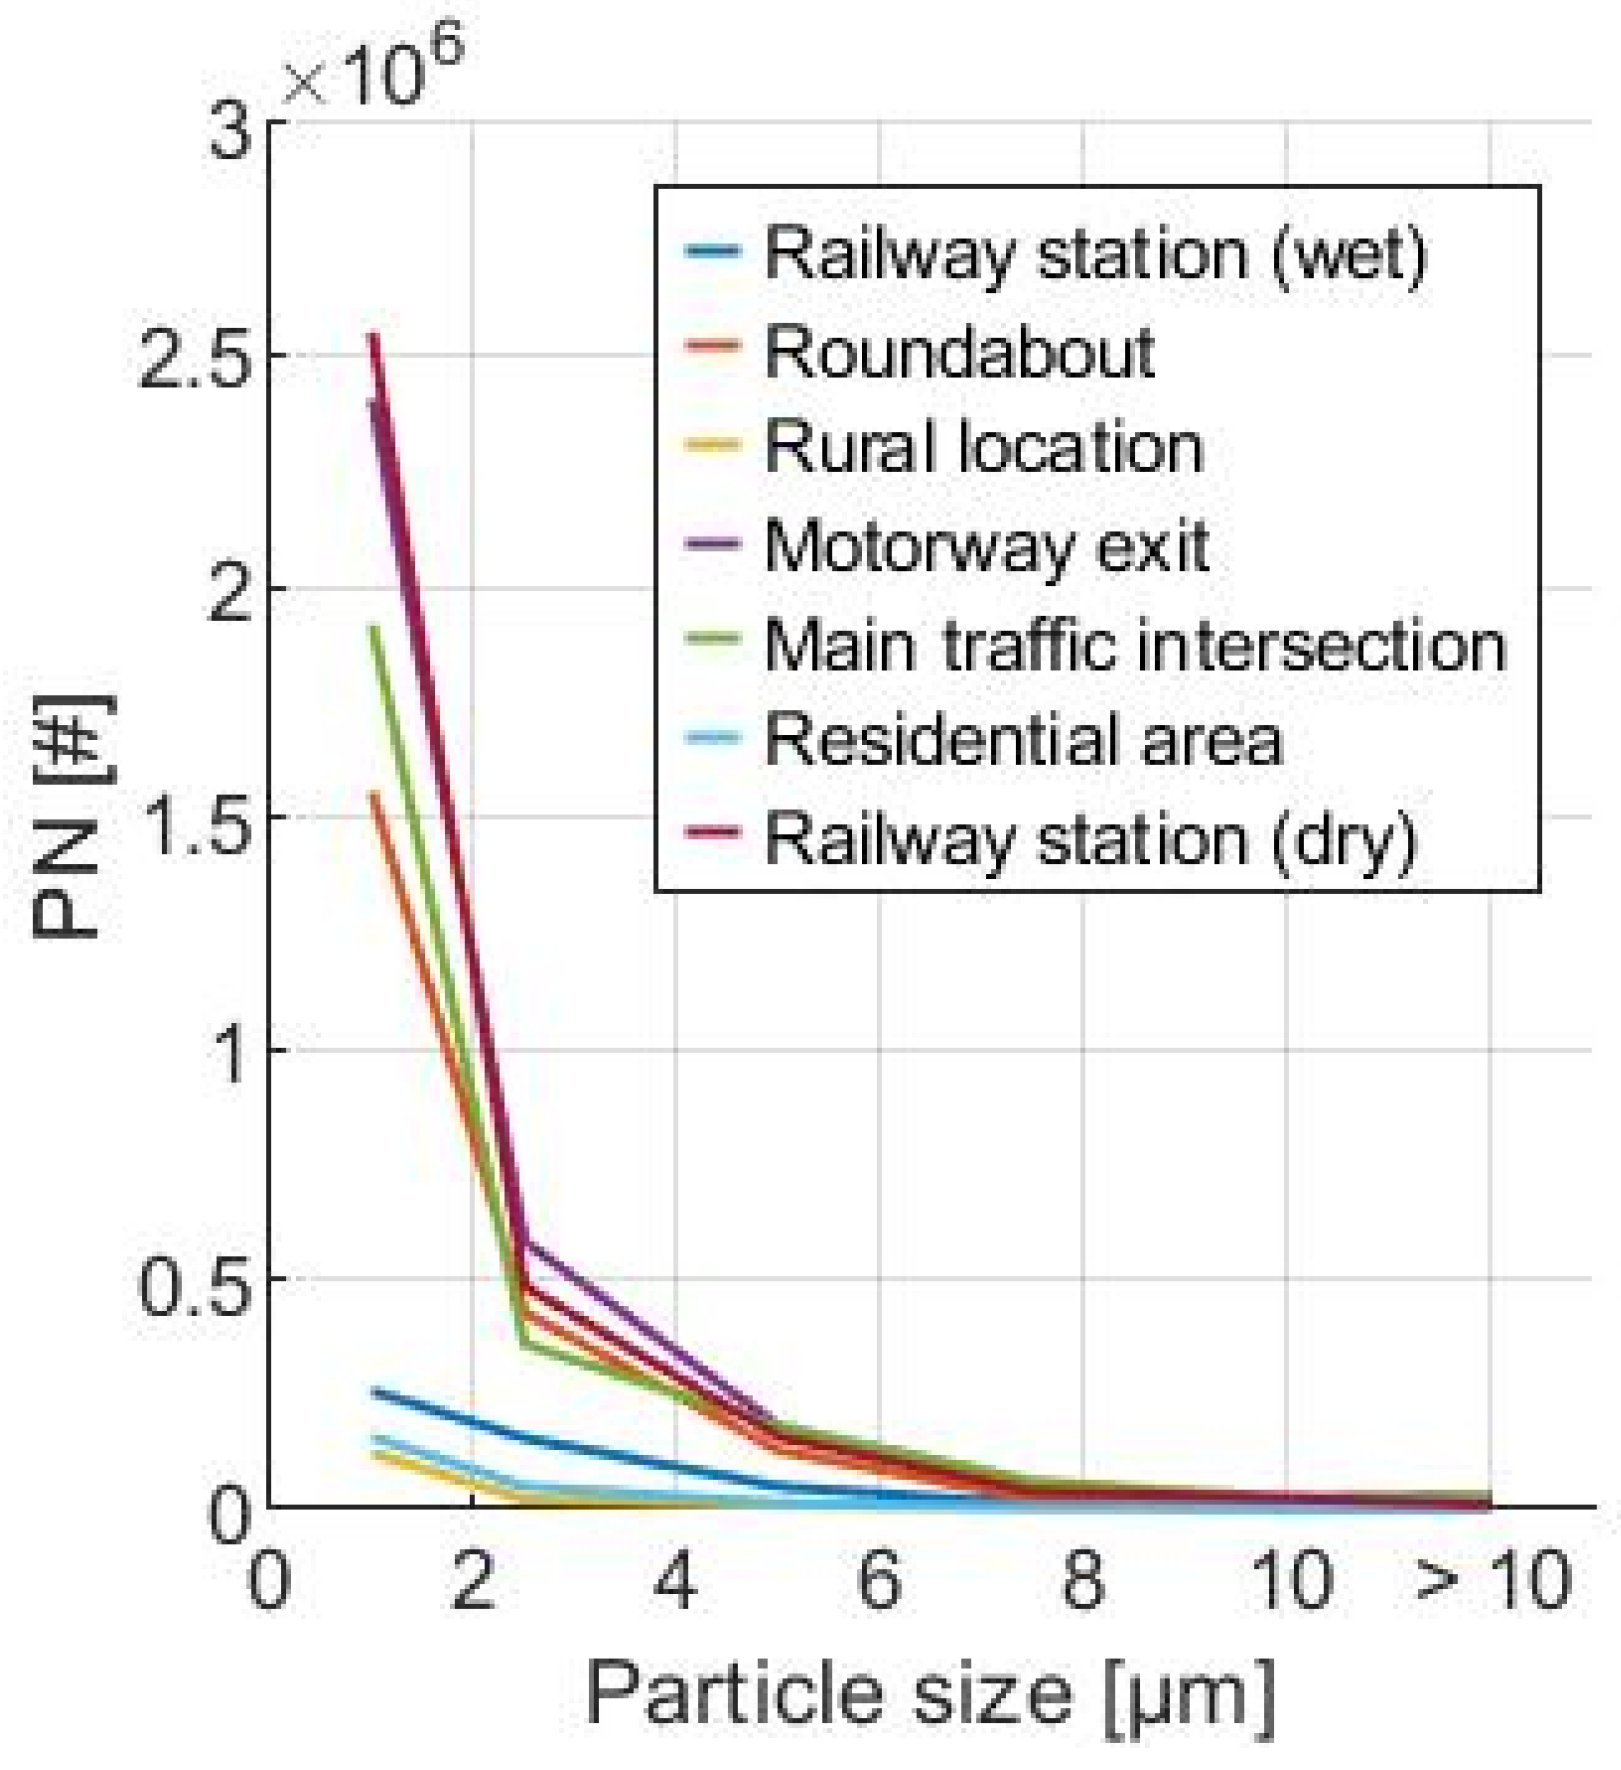
Other particles, such as sand constituents or combustion particles, were also detected. It is striking that in the size distribution recorded via the filters, all measuring positions showed an almost linear (logarithmic y-axis) course. Only the number of particles recorded varied between the measuring positions, and the occurrence of particles larger than 10 µm deviated from the linear course. However, it was noticeable that the number of particles larger than 10 µm only increased at the measuring positions with high traffic volume or with high vehicle dynamics. This meant that these particle sizes were mainly generated during high vehicle dynamics, and were distributed in the immediate vicinity. The size distribution densities of the measurement positions are shown in Figure 12.
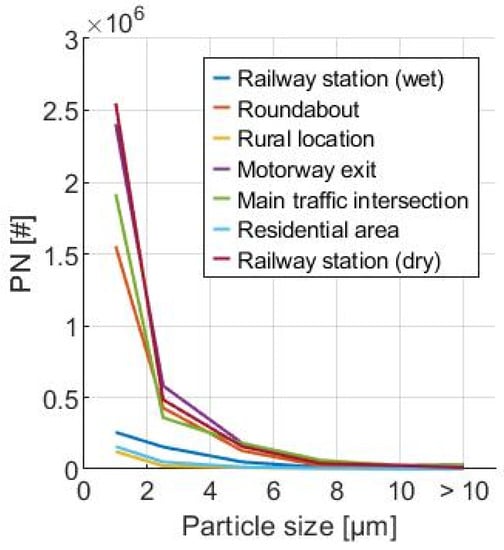
Figure 12.
Size distribution densities of the measuring positions of the measuring station.
3.3. Comparison of Simulation and Real Measurements
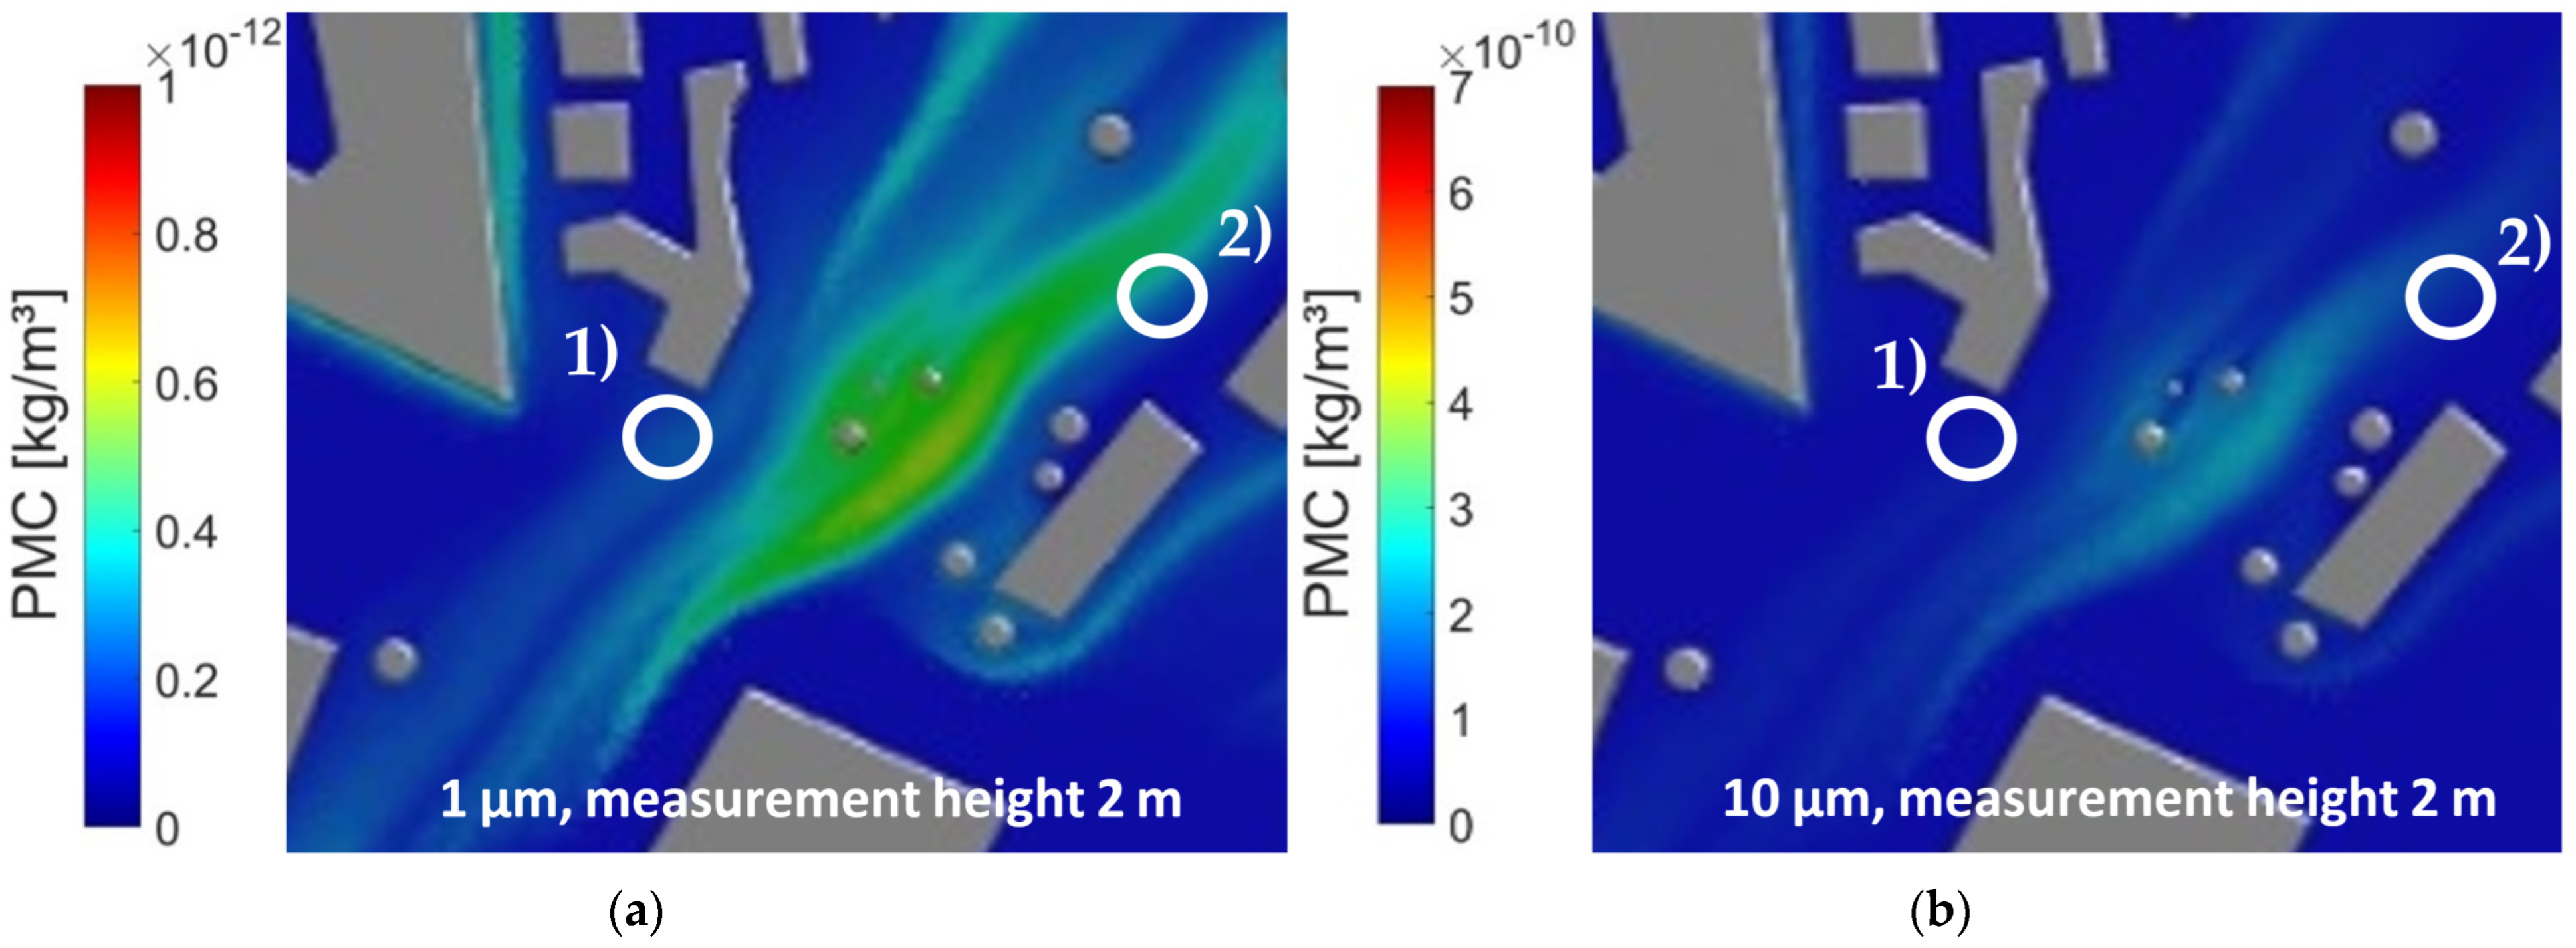
The simulation was compared with the real measurements at a viewing height of 2 m, as the measuring station was located in the test vehicle for the measurements, so as to ensure a location-independent power supply for the measuring station and to protect the measuring station from theft.
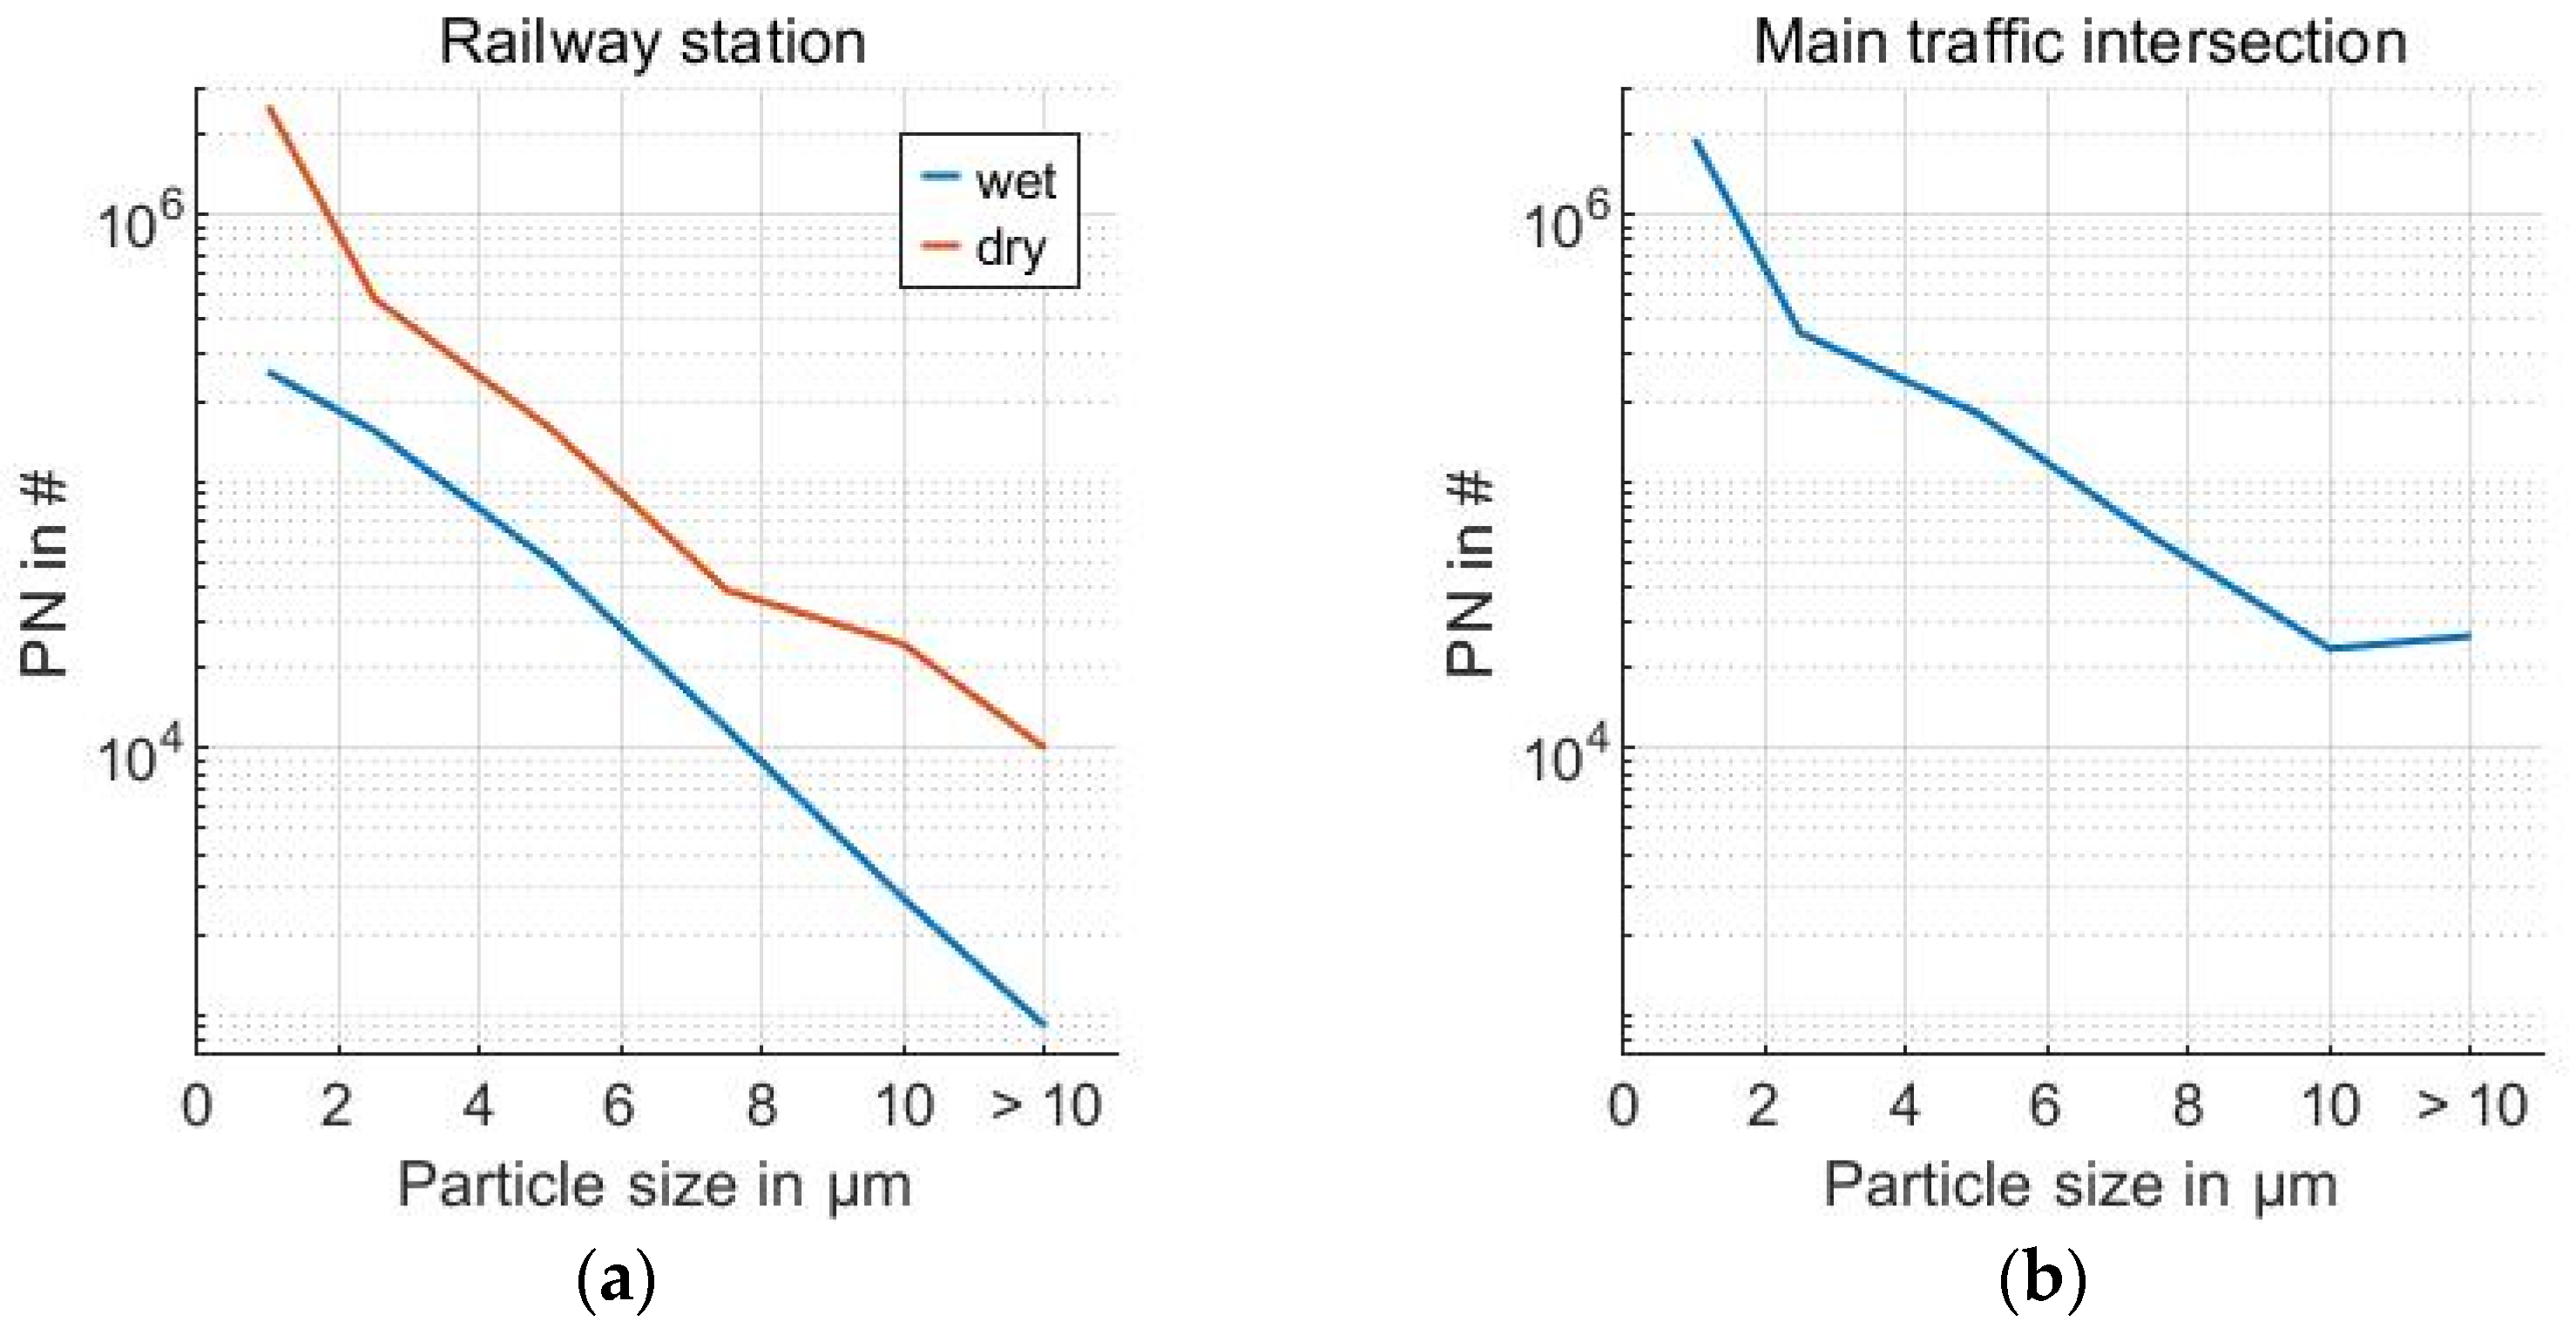
Both in the simulation and in the real measurements, particles of 1 µm had the highest concentration, as these were most influenced by the air movement. There were a comparable number of 10 µm particles at the intersection and at the measurement position near the intersection in the real measurements. Particles larger than 10 µm were mainly present at the main intersection. This could not be accurately represented in the simulation. The reason for this was the lack of modelling of the vehicle dynamics, and the fact that the particles were launched into the flow without initial velocity, which had a considerable influence on the particle movement. This meant that the turbulence behaviour could not be reproduced in the simulation, and that larger particles (larger than 10 µm with a higher particle mass) dropped down and spread around the floor. Another difference was that no environmental changes could be taken into account in the simulation, whereas the real flow medium was constantly changing, in terms of humidity, temperature and air pressure. As shown in Figure 13 and Figure 14, and as was also clearly visible in the evaluation beforehand, humidity and precipitation, in particular, had a significant influence on the particle dynamics, and thus also on the particle concentrations at the measurement positions.
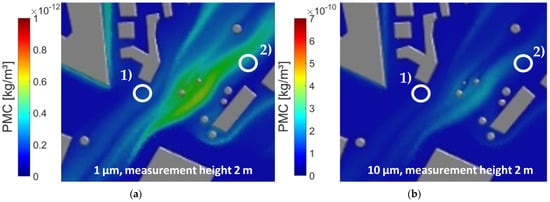
Figure 13.
Simulated PMC of (1) main traffic intersection and (2) railway station for: (a) 1 µm particles; (b) 10 µm particles.
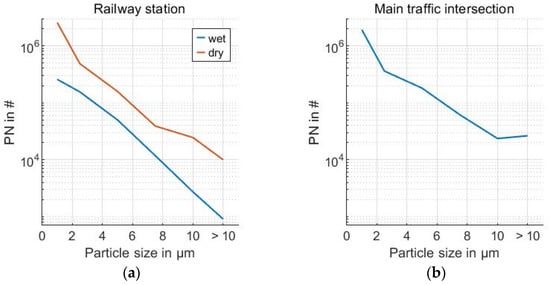
Figure 14.
Comparing PSD of the real measurements: (a) railway station; (b) main traffic intersection.
3.4. Chemical Analysis of the Filters by Means of EDX
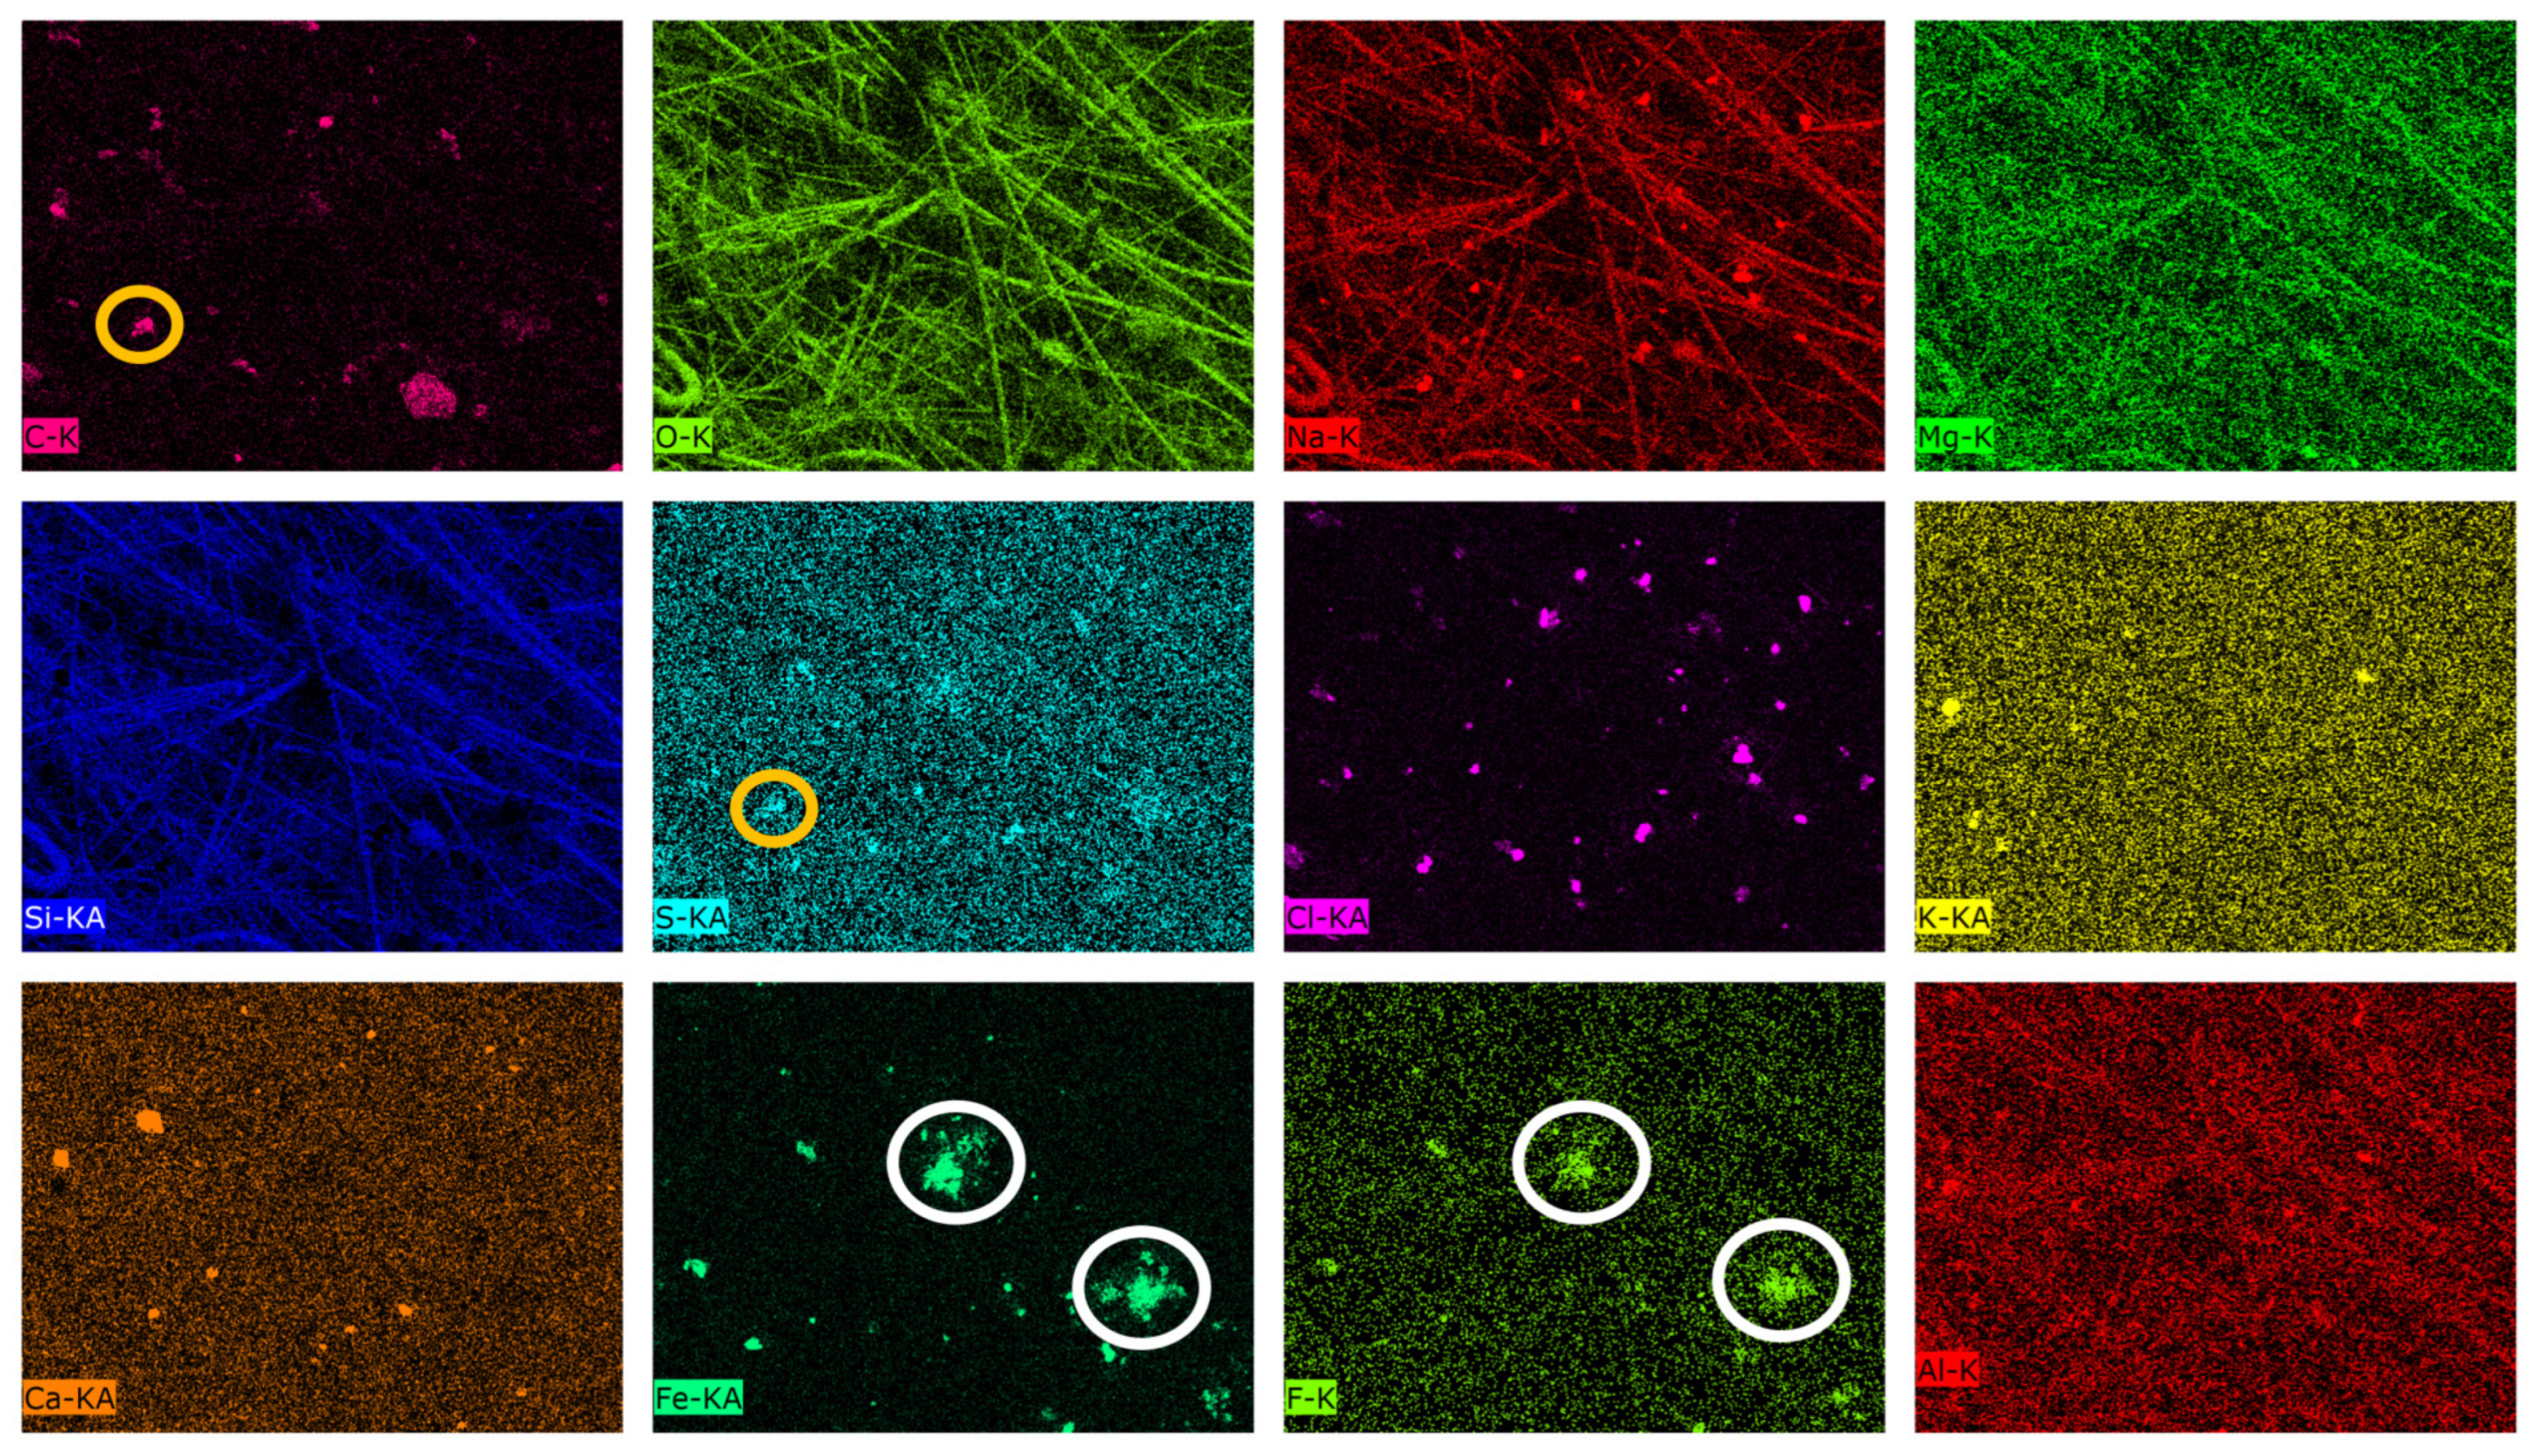
In addition to the physical analysis of the deposited particles, chemical analysis was also carried out using EDX. To evaluate the chemical composition of the deposited particles, a reference was first established by analysing an unloaded filter for its chemical components. The filters were borosilicate glass filters, which have a high proportion of silicon oxide. In addition, borosilicate glass consists of other compounds such as boron trioxide, alkali oxides, aluminium oxide and alkaline earth oxides. Most of the components can also be confirmed by elemental analysis in that, in addition to silicon and oxygen, sodium, magnesium, aluminium, potassium (very low proportion) and calcium are also found. Due to low loading of the filters, in most cases no clear assignment to specific emission groups could be made, which meant that the recorded emissions—e.g., near the intersection during rain, at the rural measurement position or in the residential area—were more likely to be assigned to the background concentration. At the measuring positions of higher vehicle dynamics, on the other hand, a larger loading of the filters could be determined, whereby a rough classification of the particle components could be made. Thus, in the element analysis of a filter area at the main traffic intersection (Figure 15), it can be seen that elements such as iron, fluorine and sulphur occurred. Iron components, in particular, were attributed to brake emissions. If one compares the uptake of particles of fluorine and iron, it can be seen that these elements occurred congruently. Thus, iron and fluorine components were present here, which can also occur in brake-lining components, as fluorine is used as a damping agent. Sulphur is an indicator for tyre particles, as it is used as a vulcanising agent. However, in the EDX analysis, this component could only be approximately associated with carbon particles, as the sulphur was very strongly distributed on the filter. Nevertheless, some particles could be shown to have a carbon-sulphur compound, and could thus be assigned to tyre particles. As the tests were carried out at a cold time of year (the end of February), the presence of sodium chloride on the road was clearly evident, which could be identified as road salt. Other components could not be clearly assigned, as elements of particles also represented filter components, and the exact composition of all particles on the roadway could not be discerned. Nevertheless, it was evident that a rough classification was possible with sufficient particle loading.

Figure 15.
EDX-Map—Elemental analysis of a filter area at the main traffic intersection, with brake particles (white) and tyre particles (yellow) marked; subfigures show individual chemical elements.
4. Discussion
4.1. Evaluation and Classification of the Results
The investigations listed show a first methodology for integrating realistic emissions into a simulation. In this way, their dispersion can be examined more closely without carrying out a great deal of work with different measuring devices at different measuring positions, even though the methodology will need to be improved, on account of the several simplifications. At the beginning of the investigations, particle measurement data were recorded with a measurement vehicle and suitable sampling, on an RDE-compliant test cycle, which represented the swirl and emission behaviour of vehicle tyres in everyday traffic. The collected particles were then analysed, to establish their size distribution under a digital microscope. Here, attention had to be paid to the correct settings of the magnification of the microscope, and to the threshold values for particle detection in the image processing for counting the particles. Once the size distribution had been determined, it was converted into a particle mass using an estimated particle density of 1.2 g/cm³ (for rubber), which served as the basis of the injection for the simulation. In this way, size-selective mass flows could be injected, which enabled a realistic evaluation of the particle concentration of the individual fine dust classes. The specified flow was based on the annual mean value of approximately 4 m/s coming from the south–west.
A city model was built to show the particle dynamics and the effects on passers-by. The restrictions that were made, due to the limitations of the simulation and its complexity, are briefly described below. The diameter of the city model was 500 m, which meant that some streets were cut off. In addition, building geometries had to be simplified, in order to be able to mesh the model. All objects had been modelled to a height of 14 m, as no height data was available. Furthermore, particles hitting the ground or other objects, were reflected in the simulation, which meant that they did not experience any energy loss due to deformation or other effects. These aspects should be rendered closer to reality in the future, so as to be able to describe the particle dynamics even more realistically. The flow simulation showed a low flow velocity near objects, and a dead water area behind objects. Also, the flow was partially deflected by obstacles, which also had an effect on the particles’ movement, by changing their direction of movement. The particle simulations showed that large particles (larger than 10 µm) travelled a short distance from the emission point, before sinking to the bottom, due to their higher particle mass. Consequently, the particle concentration of large particles also decreased towards the top, or was hardly present, while small particles up to 10 µm followed the flow, and thus also flowed over the 14 m high objects. In the dead water areas, due to accumulation at or shading behind objects, particles larger than 10 µm were predominantly deposited, as the weight force was predominant here, and the particles could no longer be taken up by the flow.
After the simulative investigation of particle movement and dispersion, measurements were taken at different positions with different traffic loads. Wind speed, wind direction, humidity and ambient temperature were also recorded, in addition to the particle measurements. It was found that high humidity or precipitation, in particular, strongly reduced the particle number and particle mass concentration. This was attributed to the fact that the free-floating particles became bound to the water, and consequently sank to the ground. The binding of the particles to the water also prevented the swirling-up of particles deposited on the road surface. Furthermore, it was shown that the particle load was about a factor of 10 higher in dry ambient conditions. At measurement locations with high traffic density, an increased particle load was also recorded. The measurements at the main traffic intersection showed the highest particle loads. Here, in addition to high traffic density, a high manoeuvre density was present, due to vehicles starting and braking at the traffic lights. This was also shown by microscopy of the filters, due to the occurrence of large tyre particles. Interestingly, the determination of the size distribution density of the measurement positions demonstrated that all the measurement positions showed an exponential increase (linear increase in the logarithmic axis) of small particles. Only the measurement positions with high traffic and manoeuvre density showed an increase of particles larger than 10 µm, which deviated from the trend of the other measurement positions.
The comparisons between simulation and real measurements showed that the approximate trend could be shown in the simulation, despite the many simplifications. However, this was only true for particles smaller than 10 µm, which were mainly influenced by the flow. As the particle dynamics of larger particles were mainly influenced by vehicle and swirl dynamics, which were not represented in the simulation, a larger discrepancy was shown in the comparison of the results.
The methodology used to create a realistic simulation could be used for different problems to evaluate the particle distribution in the environment. It would be possible, using a proper particle sampling method and particle analysis, to create a close-to-reality simulation, even though sampling efficiency has a large role in the accuracy of the simulation results. For environmental analysis, according to this first methodology, the sampling of real driving emissions was connected to several influencing parameters, such as humidity, road surface composition and vehicle dynamics: this, and the inhomogeneous distribution of particles on the filter pads, led to unavoidable differences in the analysed injected particle mass for the simulation.
Finally, a chemical analysis (EDX) of the loaded filters from the different measurement positions was carried out, to identify possible or predominant emission sources at the respective measurement positions. Due to the elemental composition of the filters (borosilicate glass), it was often difficult to clearly assign the particle origin, as the borosilicate glass was already composed of many different components. For the identification of the particle components, it had been shown that a certain loading of the filters was necessary, in order to achieve evaluability. Nevertheless, on some filters—especially on those of the measurement positions with high traffic volume (e.g., main traffic intersection)—particles could be assigned to an emission source. For example, elements such as iron and fluorine showed up on the same location of the filter, which allowed them to be characterised as brake particles. Sulphur was considered an indicator for tyre particles, but was usually strongly distributed on the filters. This may have been due to other constituents in the ambient air, or to released and atomised constituents from the road, brake or tyres. In some places, sulphur and carbon could be recorded congruently, which allowed an assignment to tyre particles. However, this type of evaluation was very time-consuming and could vary greatly depending on the filter area considered, as the particles were distributed inhomogeneously on the filters. In addition, the individual particle types rarely occurred separately from each other, as agglomerates formed, or different particles stuck together and merged.
4.2. Limitations of the Methodology
This investigation methodology was only a starting point in characterising and classifying particle emissions and their behaviour, and it should be improved in the future. Due to the complex system of particle emissions from vehicles, the methodology involved several simplifications, that were necessary in order to focus on the problem itself and to point out the major influences on particle emissions and particle distribution in the environment.
The sampling of real road emissions was very difficult to handle, because the sampling itself had a variety of influencing parameters, that led to bad efficiency of particle sampling, notably the sampling efficiency of the funnel, and the transport efficiency inside the CVS tunnel. The sampling efficiency of the funnel decreased with higher vehicle speed, due to stronger cross flows (called P-shoulder swirl), that appeared behind the tyre and pushed the particles to traverse to the inlet funnel. The transport efficiency inside the CVS tunnel was limited by turbulence and particle mass where, caused by the low air flow from around 4 m/s compared to the tunnel diameter of 100 mm, some particles may not have reached the sampling nozzle positioned in the centre of the tunnel. Changing air flow conditions due to vehicle speed also complicated the idea of a CVS system.
The subsequent particle analysis, using a digital microscope and image processing software, also had its limitations. As mentioned before, not all particles could be detected on the basis of overlapping particles, and particle size and errors occurred due to reflexions and shadowing of the optical fibre properties. An accurate error could not be specified, because the total particle loading of the filter could not be indicated. Within the methodology of particle detection, particles from 300 nm could be detected properly. The determination of particle size distribution also had its limitations. The filter was never homogeneously loaded, so that the distribution was highly dependant on the section under consideration. Therefore, multiple sections were analysed and averaged to minimize the error of the recorded particle size distribution.
Analysing the simulation methodology, there are some improvements that could be implemented. Firstly, the CFD model could be more detailed, including kerbs and other smaller objects near the streets that influence particle behaviour, in respect of air flow. This was abstracted due to computing time and robustness of the simulation. The same applied to the level of detail of the buildings and trees, which were modelled as polygons with flat top and cylinders. Nevertheless, the simplifications still enabled a general evaluation of the particle flow in these first investigations. The fixed parameters of the fluid were also a limitation that had to be taken into account when interpreting the results of this study. The real environment was changing every second, which made it difficult to implement into the simulation, and it was therefore simplified as fixed parameters in this investigation.
The subsequent chemical analysis through EDX was challenging, because the borosilicate glass fibre filters consisted of many different elements, which also occurred in the particles that had been analysed. For that reason, the origin of particular particles could only be assumed. Furthermore, some particles appeared as agglomerates, that could not be clearly separated from one another, so an assignment could only be suspected.
4.3. Recommendations for Further Investigations
With regard to further investigations, the chemical analysis could be improved by using quartz glass filters, as it was only composed of silicon dioxide (SiO2). With this improvement, it should be possible to detect the elements of particles more clearly, and it may be easier to point out their respective origin. In addition, it may also be possible to use artificial intelligence to characterise particles in the image processing software, and chemical analysis to classify the appearance and composition of the collected samples. This could minimise detection of the wrong particles, and deliver a more suitable particle distribution. By optimising this, the simulation would also become even better, and provide a more realistic particle distribution in the environment. Furthermore, the particles could be injected with their respective trajectories as they were released from the tyre. In addition, real car models could be included in the simulation, to evaluate the particle behaviour of such disturbance of the air flow.
While the presented methodology shows a starting point for these investigations, it is recommended that the methodology be improved, due to all the simplifications that have been made and mentioned in Section 4.2. above. Furthermore, the sampling of particles could be improved, to maximize sampling efficiency in higher vehicle speeds, so that the basis of particle injection would become more accurate.
5. Conclusions
In terms of particle measurement from tyres, it is difficult to distinguish between the percentage of pure tyre emissions, on the one hand, and particles coming from the environment and other influencing sources, on the other. To be clear, most results from on-road measurements seem to detect more background particles and resuspension than tyre particles. Nevertheless, it is necessary to take these data to evaluate the particle distribution through the air flow. Connecting them to a simulation gives a clearer intake, and is a valid tool for demonstrating how non-exhaust particles behave. The simulation showed a wide travelling range for particles, especially small particles from about 10 µm in diameter, which than affected the surrounding environment. Bigger particles from 10 to 100 µm had a short travel distance, and were mostly deposited in areas of small air flow velocity.
Furthermore, these investigations showed that it is difficult to clearly assign the emission sources, since both the optical and chemical analysis only allowed assumptions about the particle origin. Within the framework of these investigations, no clear statement could be made on the weighting of different emission sources, as they could not be clearly separated. The measurement position considered, and the filter area analysed, also had a major influence on the general interpretation of the composition of particle emissions. The most accurate statement that could be made for the influencing parameters was that a high volume of traffic and a high manoeuvre density favoured the emission of brake, tyre and asphalt particles, which could also be detected to some extent on filters. In addition, environmental conditions had a strong influence on the particle dynamics, and thus also on the prevailing particle concentrations.
Author Contributions
Conceptualization, M.K., T.F., D.H. and S.G.; methodology, M.K. and T.F.; validation, M.K.; formal analysis, M.K.; investigation, M.K.; resources, V.I., T.B. and S.G.; data curation, M.K.; writing—original draft preparation, M.K.; writing—review and editing, M.K.; visualization, M.K.; supervision, T.F., V.I., D.H. and S.G.; project administration, V.I., D.H. and S.G.; funding acquisition, M.K. All authors have read and agreed to the published version of the manuscript.
Funding
We acknowledge support for the publication costs by the Open Access Publication Fund of the Technische Universität Ilmenau.
Institutional Review Board Statement
Not applicable.
Informed Consent Statement
Not applicable.
Conflicts of Interest
The authors declare no conflict of interest.
References
- Pant, P.; Harrison, R.M. Estimation of the Contribution of Road Traffic Emissions to Particulate Matter Concentrations from Field Measurements: A Review. Atmos. Environ. 2013, 77, 78–97. [Google Scholar] [CrossRef]
- Oroumiyeh, F.; Zhu, Y. Brake and tire particles measured from on-road vehicles: Effects of vehicle mass and braking intensity. Atmos. Environ. X 2021, 12, 100121. [Google Scholar] [CrossRef]
- Hesse, D.; Hamatschek, C.; Feißel, T.; Sachse, H.; Augsburg, K.; Gramstat, S. Investigations on the Deposition Behaviour of Brake Wear Particles on the Wheel Surface; SAE Technical Paper 2021-01-1301; SAE: Ilmenau, Germany, 2021. [Google Scholar] [CrossRef]
- Hesse, D.; Hamatschek, C.; Augsburg, K.; Weigelt, T.; Prahst, A.; Gramstat, S. Testing of Alternative Disc Brakes and Friction Materials Regarding Brake Wear Particle Emissions and Temperature Behavior. Atmosphere 2021, 12, 436. [Google Scholar] [CrossRef]
- Hicks, W.; Beevers, S.; Tremper, A.H.; Stewart, G.; Priestman, M.; Kelly, F.J.; Lanoisellé, M.; Lowry, D.; Green, D.C. Quantification of Non-Exhaust Particulate Matter Traffic Emissions and the Impact of COVID-19 Lockdown at London Marylebone Road. Atmosphere 2021, 12, 190. [Google Scholar] [CrossRef]
- Charron, A.; Polo-Rehn, L.; Besombes, J.-L.; Golly, B.; Buisson, C.; Chanut, H.; Marchand, N.; Guillaud, G.; Jaffrezo, J.-L. Identification and Quantification of Particulate Tracers of Exhaust and Non-Exhaust Vehicle Emissions. Atmos. Chem. Phys. Discuss 2019, 19, 5187–5207. [Google Scholar] [CrossRef] [Green Version]
- Wik, A.; Dave, G. Occurrence and Effects of Tire Wear Particles in the Environment—A Critical Review and an Initial Risk Assessment. Environ. Pollut. 2009, 157, 1–11. [Google Scholar] [CrossRef] [PubMed]
- Sathicq, M.B.; Sabatino, R.; Cesare, A.D.; Eckert, E.M.; Fontaneto, D.; Rogora, M.; Corno, G. PET particles raise microbiological concerns for human health while tyre wear microplastic particles potentially affect ecosystem services in waters. J. Hazard. Mater. 2022, 429, 128397. [Google Scholar] [CrossRef] [PubMed]
- Gkoutselis, G.; Rohrbach, S.; Harjes, J.; Obst, M.; Brachmann, A.; Horn, M.A.; Rambold, G. Microplastics accumulate fungal pathogens in terrestrial ecosystems. Sci. Rep. 2021, 11, 13214. [Google Scholar] [CrossRef] [PubMed]
- Amato, F.; Dimitropoulos, A.; Farrow, K.; Oueslati, W. Non-exhaust Particulate Emissions from Road Transport: An Ignored Environmental Policy Challenge; OECD Publ.: Paris, France, 2020; pp. 8–10. [Google Scholar] [CrossRef]
- Gnecco, I.; Berretta, C.; Lanza, L.G.; La Barbera, P. Storm water pollution in the urban environment of Genoa, Italy. Atmos. Res. 2005, 77, 60–73. [Google Scholar] [CrossRef]
- Rødland, E.S.; Lind, O.C.; Reid, M.J.; Heier, L.S.; Okoffo, E.D.; Rauert, C.; Thomas, K.V.; Meland, S. Occurrence of tire and road wear particles in urban and peri-urban snowbanks, and their potential environmental implications. Sci. Total Environ. 2022, 824, 153785. [Google Scholar] [CrossRef] [PubMed]
- Cunningham, B.; Harper, B.; Brander, S.; Harper, S. Toxicity of micro and nano tire particles and leachate for model freshwater organisms. J. Hazard. Mater. 2022, 429, 128319. [Google Scholar] [CrossRef] [PubMed]
- Fraunhofer-Institut für Umwelt-, Sicherheits- und Energietechnik UMSICHT; iMA Richter & Röckle KmbH & Co. KG.; Ingenieursgesellschaft Prof. Dr. Sieker mbH. Digitales Planungs- und Entscheidungsinstrument zur Verteilung, Ausbreitung und Quantifizierung von Reifenabrieb in Deutschland—TyreWearMapping. Final Rep. 2020, 19F2050A-C, 10–45. Available online: https://www.umsicht.fraunhofer.de/content/dam/umsicht/de/dokumente/kompetenz/prozesse/tyrewearmapping-schlussbericht.pdf (accessed on 21 July 2022).
- Ji, W.; Zhao, B. Numerical study of the effects of trees on outdoor particle concentration distributions. Build. Simul. 2014, 7, 417–427. [Google Scholar] [CrossRef]
- Müller, R. Entwicklung Einer Methode Zur Einbindung Real Gemessener Non-Exhaust Partikelemissionen in Ein CFD-Modell Eines Innenstadtszenarios. Bachelor’s Thesis, Technical University Ilmenau, Thuringia, Germany, 2020. [Google Scholar]
- Vogelsang, C.; Lusher, A.L.; Dadkhah, M.E.; Sundvor, I.; Umar, M.; Ranneklev, S.B.; Eidsvoll, D.; Meland, S. Microplastics in road dust—Characteristics, pathways and measures. Nor. Inst. Water Res. Res. Rep. 2020, 7526-2020, 34. Available online: http://hdl.handle.net/11250/2493537 (accessed on 21 July 2022).

Publisher’s Note: MDPI stays neutral with regard to jurisdictional claims in published maps and institutional affiliations. |
© 2022 by the authors. Licensee MDPI, Basel, Switzerland. This article is an open access article distributed under the terms and conditions of the Creative Commons Attribution (CC BY) license (https://creativecommons.org/licenses/by/4.0/).