Article

Black Carbon Personal Exposure during Commuting in the Metropolis of Karachi

by
Javeria Javed
1,
Erum Zahir
1,
Haider Abbas Khwaja
2,3,*,
Muhammad Kamran Khan
1 and
Saiyada Shadiah Masood
4
1
Department of Chemistry, University of Karachi, Karachi 75270, Pakistan
2
Department of Environmental Health Sciences, School of Public Health, University at Albany, State University of New York, 1 University Place, Rensselaer, NY 12144, USA
3
Wadsworth Center, New York State Department of Health, Albany, NY 12201, USA
4
Department of Chemistry, Jinnah University for Women, Karachi 74600, Pakistan
*
Author to whom correspondence should be addressed.
Atmosphere 2022, 13(11), 1930; https://doi.org/10.3390/atmos13111930
Submission received: 18 October 2022 / Revised: 15 November 2022 / Accepted: 16 November 2022 / Published: 19 November 2022
(This article belongs to the Section Air Quality and Human Health)

Abstract

:
Black carbon (BC) exposure and inhalation dose of a commuter using four traffic modes (car, bus, auto-rickshaw, and motorbike) were monitored in Karachi, Pakistan. The real-time exposure concentrations in office-peak and off-peak hours were recorded during the winter season using microAeth® AE51 BC monitors. Exposure concentrations were higher in peak hours and were reduced to half in the off-peak time. The inclination levels of the inhaled dose were similar, and this trend was observed with all four modes of commute. The motorbike was found to be the most exposed mode of transportation, followed by auto-rickshaws, cars, and buses, respectively. However, the order was reversed when accounting for inhaled doses, e.g., the inhalation dose for auto rickshaws was highest, followed by the bus, motorbike, and car, respectively. Spatiotemporal analysis reveals that driving roads with lower traffic intensity and fewer intersections resulted in lower exposures. Therefore, traffic intensity, road topology, the timing of the trip, and the degree of urbanization were found to be the major influences for in-vehicle BC exposure.

1. Introduction

Urban air pollution is a global public health issue [1]. With increasing numbers of motor vehicles, e.g., >23 million in 2018 [2], traffic-related air pollution has become a major environmental concern in Pakistan. People living in densely populated megacities such as Karachi are closed to traffic and are more exposed to vehicular exhaust and non-exhaust emissions [3]. Black carbon (BC) is one of the major groups of pollutants present in urban ambient air, which contributes to air pollution through direct emissions from primary sources, e.g., combustion engines (especially diesel) and industrial processes, or by indirect or secondary processes such as residential and field burning of coal, wood and agricultural waste, and forest and vegetation fires as well as power stations that use coal and heavy oil [4,5]. BC, being a constituent of particulate matter (PM), can accumulate deep into the lungs when inhaled, consequently causing respiratory disorders. Moreover, it is also found to trigger cardiovascular diseases after short or long-term exposures [6,7].
Among various other daily activities, commuting is regarded as the activity with the highest exposure period, especially in urban cities (e.g., Karachi) with high vehicular intensity [8]. Studies suggest that up to 30% of a person’s daily inhalation dose of BC is received from their routine trips [9]. Since pollutant concentrations are higher in the transport microenvironment, commuters may obtain a considerable contribution to their daily BC exposure while traveling in such an environment for even 1.5–2 h per day [8,10,11]. Hence, exposure-based studies prefer real-time monitoring for personal exposure to a pollutant. For this purpose, commuters are equipped with portable real-time monitors to evaluate personal exposure in a particular environment [9,12]. Most of these studies have been conducted in urbanized areas of developed countries [12], whereas investigations based on personal exposure to BC are limited in Pakistan. The studies investigating the emission of BC in Karachi are mostly based upon fixed site monitoring, e.g., research by Malashock et al. (2018) [6], who found associations between BC exposure and cardiovascular diseases (CVD) among residents of Karachi. Other researchers, e.g., Bibi et al. (2017) [13] and Dutkiewicz et al. (2009) [14], reported BC concentrations to be associated with vehicular traffic and meteorological variables, along with seasonal and diurnal variations. In view of the limited information about this important air quality issue, we commenced an in-vehicle monitoring study of personal exposure to BC concentrations along the roadways in Karachi-Pakistan. A comprehensive evaluation of BC emissions in Karachi is especially significant as it is one of the largest pollution hotspots in the country. Pakistan’s largest and most densely populated city, with a population growth rate of 2.27% [15]. Karachi has been subjected to substantial growth of heavy industries and immense utilization of coal. This has resulted in the levels of fine particulate matter averaging 5–7 fold higher than the WHO guidelines [16]. Moreover, Karachi is an overcrowded city of more than 20 million people [3,17] and as of 2013, had an annual traffic circulation of about 6.3 billion commuters in the city’s public transport system [3].
Travel modes in Karachi are largely comprised of private cars, taxis, buses, auto rickshaws, and motorbikes [18]. According to a report by the World Bank [19], an average of 450 new vehicles are added daily to the total 3.6 million vehicles that existed in Karachi as of 2015. Therefore, air quality within the urban traffic environment of the city may have a significant effect on many commuters. The growing vehicular and commuter populations prompted us to evaluate the pollution exposure attributes of commuters in the centralized part of the city. To our knowledge, this study is the first of its kind to monitor the real-time personal exposure and inhalation dose of BC along with spatial and temporal variations in the transport microenvironment of Karachi using different commuting modes (car, bus, auto rickshaws, and motorbike). Moreover, the study investigates the factors responsible for the in-vehicle exposure of BC so that measurements can be taken to reduce pollutant exposure and promote a harmless computing environment. The outcomes of this study will provide a reference to estimate the health risk of the urban population and to set traffic control policies in the mega city of Karachi.

2. Materials and Methods

2.1. Site Description

Karachi (24°51′36″ N and 67°00′36″ E) is situated on the coast of the Arabian Sea (Figure 1); the mega city is divided into 18 towns and is the largest city in Pakistan. Karachi is also a premier hub for industrial and trade activities of the country.
Gulshan Town and Jamshed Town, two towns in the eastern district of the city with the highest socioeconomic levels, were chosen as our study areas. Most of Jamshed Town is residential, covering around 70% of the urbanized area. However, about 30% of the area is comprised of informal settlements and commercial and mixed land use. Gulshan Town has a large working-class residential area (covering 40% of the urbanized area) and a commercial area. It is featured as the university town of the city since eight universities are located within the town [20]. The area is connected to neighboring towns by major roads, channels, and highways, including University Road, Sehba Akhtar Road, Rashid Minhas Road, Karachi-Hyderabad Highway, Lyari Expressway, and Shahrah-e-Pakistan, which makes Gulshan district a significant transport corridor connecting the downtown areas of Karachi with other districts and towns, e.g., Gadap Town to the north, the Faisal and Malir Cantonments to the east, Jamshed Town to the southwest, and Gulberg and Liaquatabad to the west (Town municipal administration, Gulshan-e-Iqbal) [21].
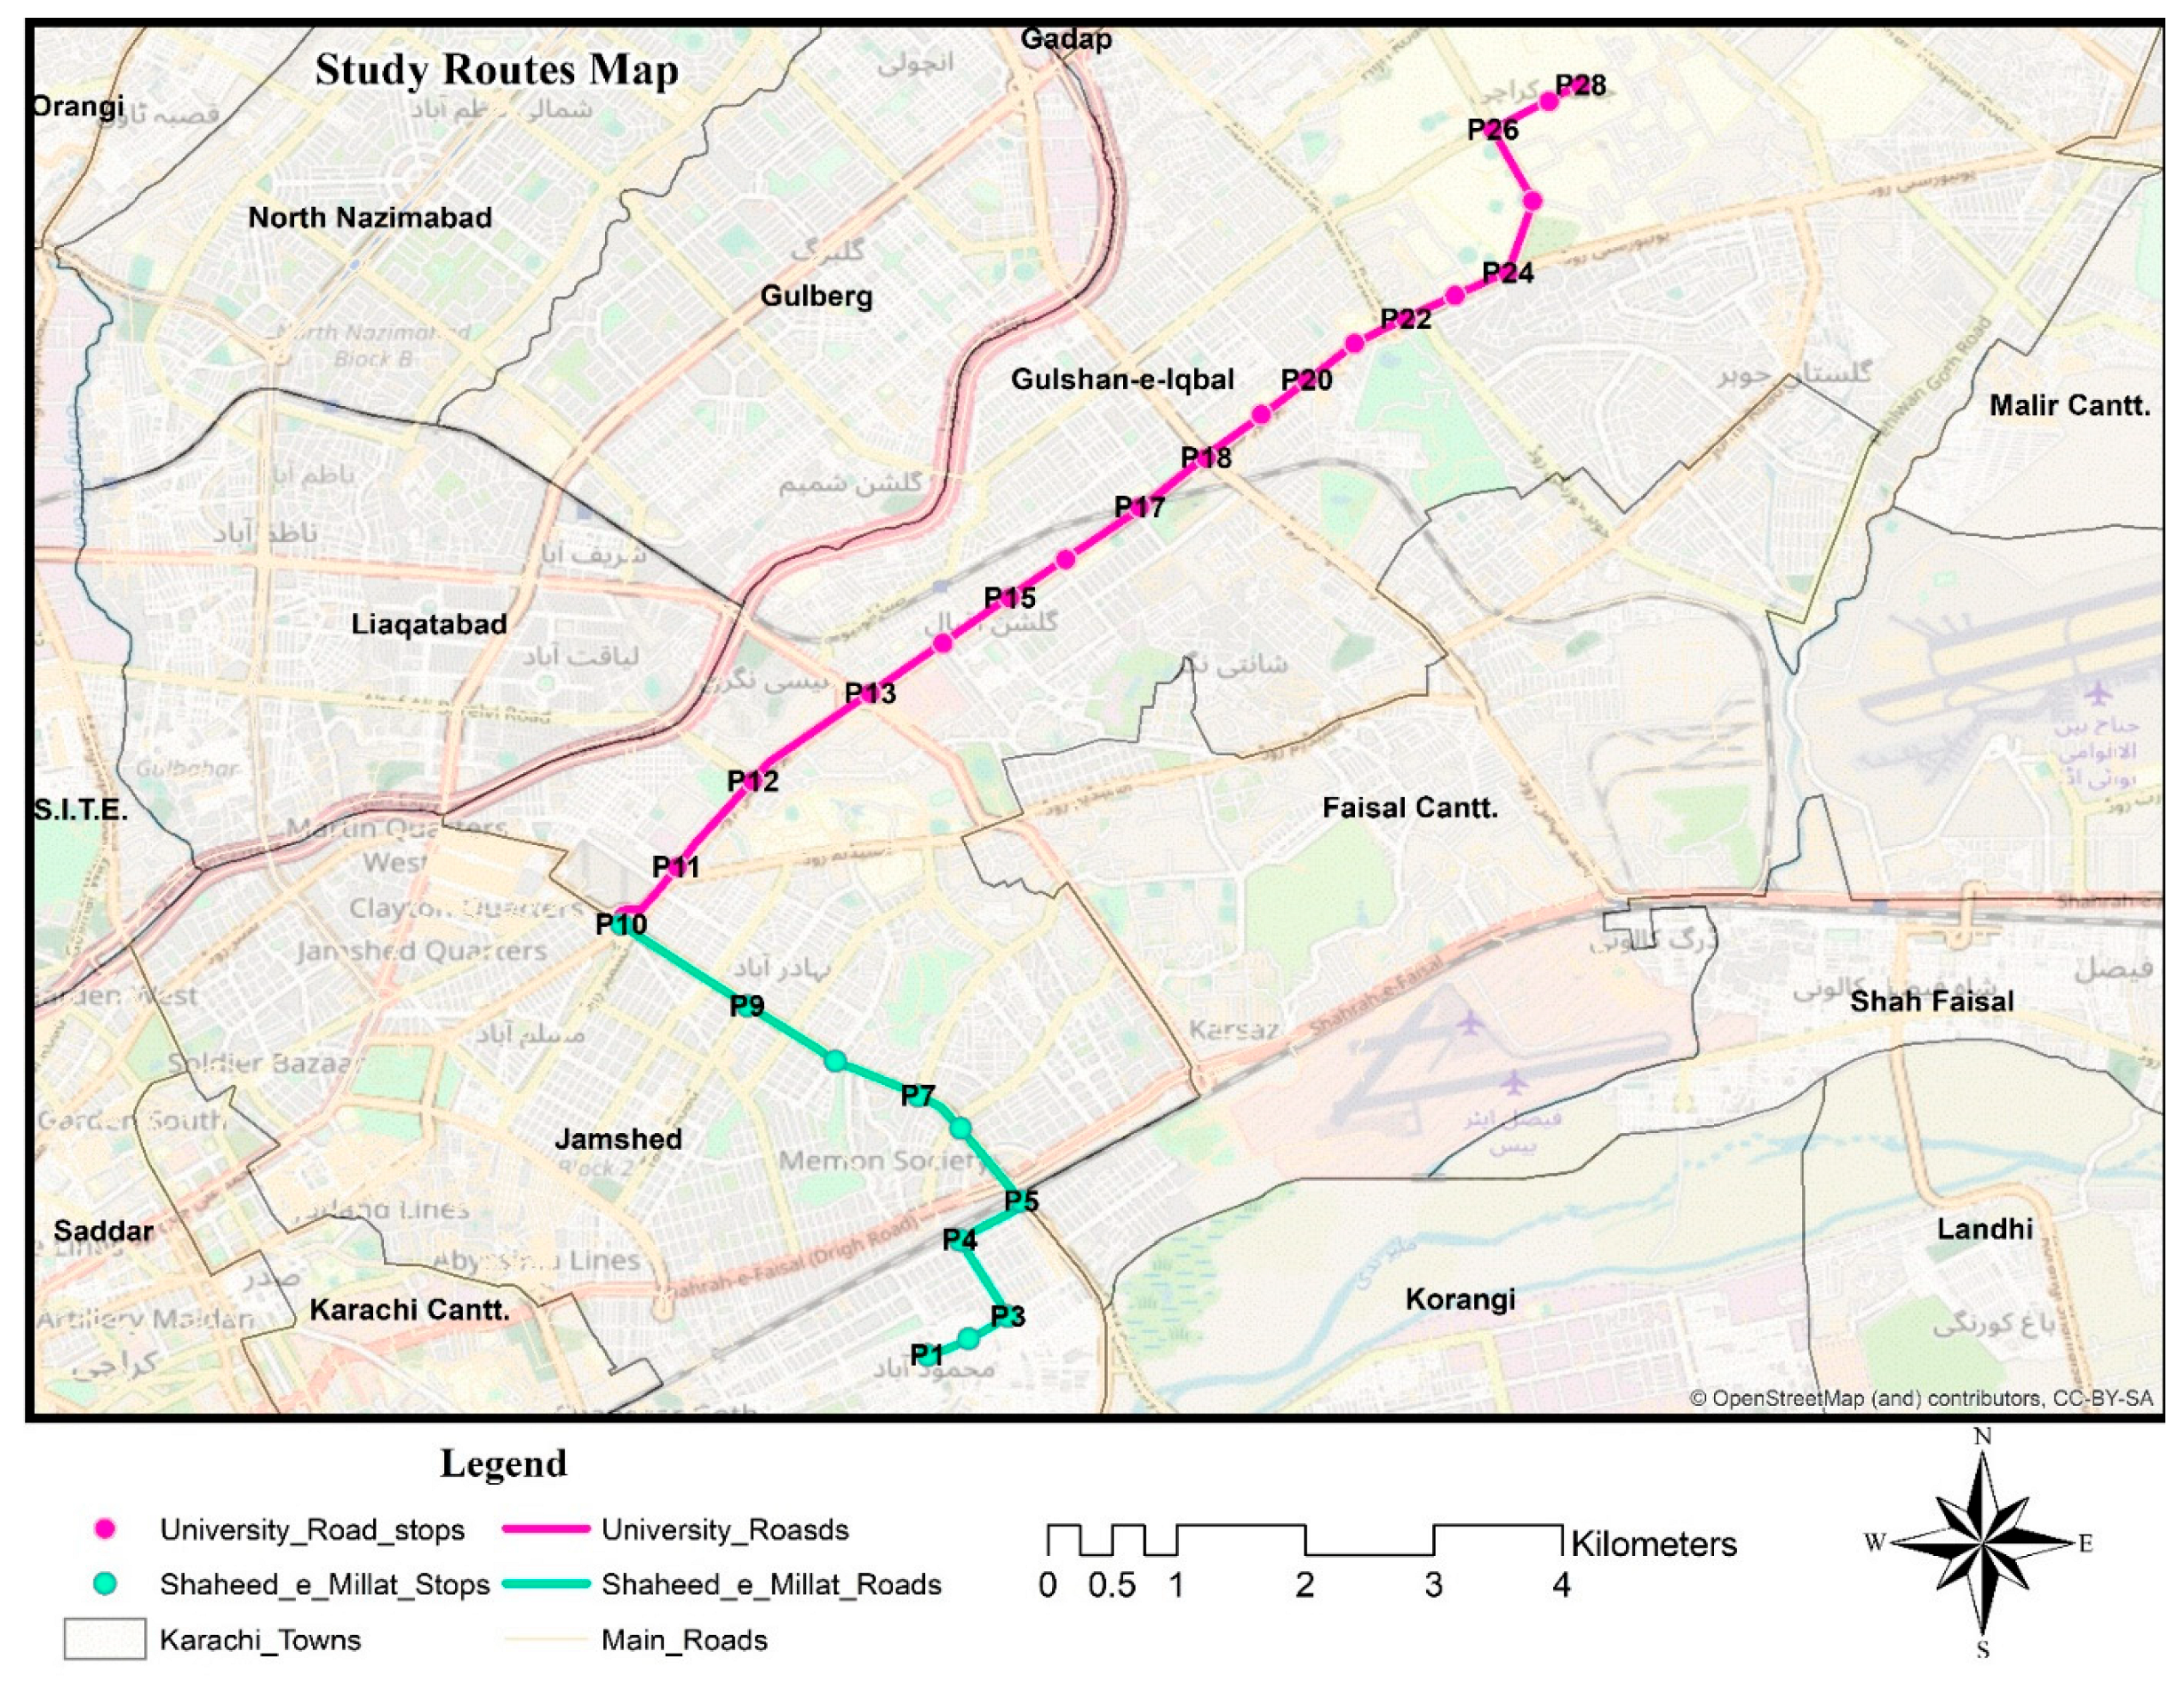
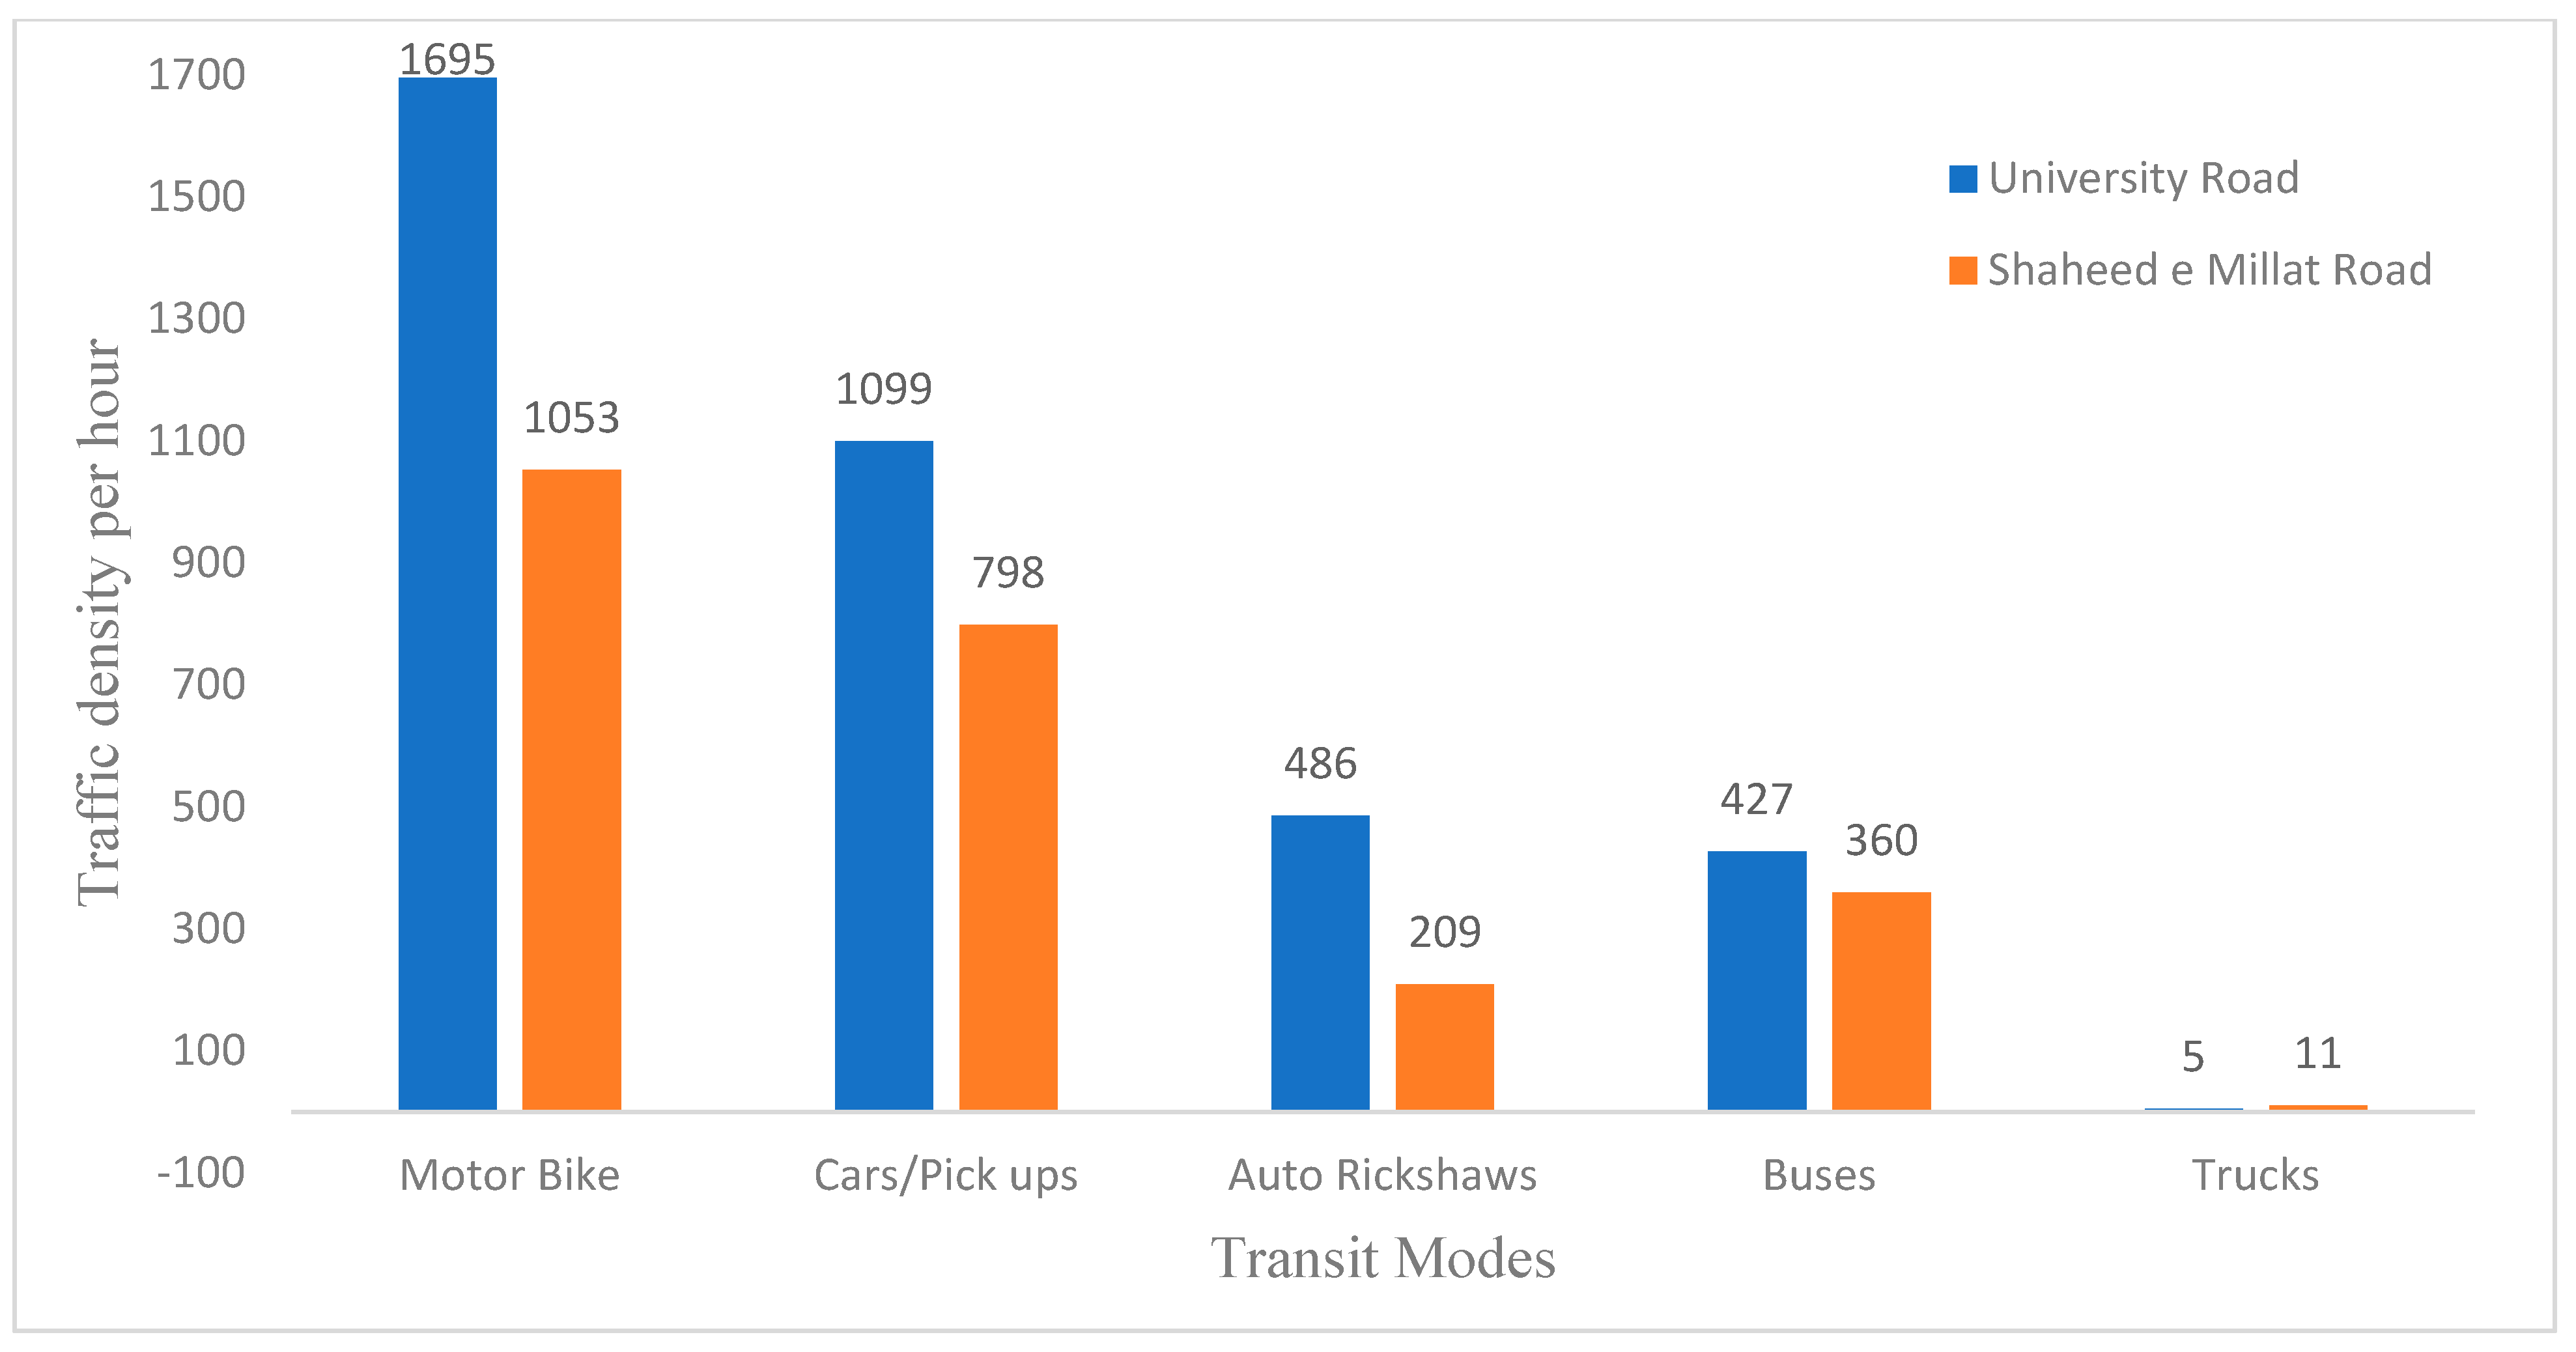
The routes selected for this study (Figure 2) included a common road connecting the two towns (Shaheed-e-Millat road) along with one of the major arterial and signal-free roads of Karachi (main University Road). Together, these roads are part of an important transport corridor and link many prestigious schools, colleges, educational centers, hospitals, and universities, as well as a chain of restaurants and food streets. These areas (especially Gulshan) also serve as a hub for many sports complexes, parks, playgrounds, gyms, markets, and shopping centers, as well as small-scale industries. These sites are prominent traffic attracters, making these routes one of the most frequently traveled in Karachi and warranting their significance as mass transit routes. Traffic emission was the major source of BC in the study areas during the daytime, as there were no other apparent combustion sources apart from some hotels and eateries along the roads, which usually operate late in the evening. Demographic specifications of the selected routes are summarized in Table 1. Figure 3 represents the average traffic flow rates along the two routes.

2.2. Instrumentation

BC is detected on the basis of light absorption in the visible region of the spectrum [4]. MicroAeth® AE51 BC monitors (AE51; AethLabs, San Francisco, CA, USA) were used to record the real-time BC concentrations. The instrument monitors light absorption in the visible region by both BC collected on the filter strip and a clean segment of the filter not subjected to exposure. The light attenuation corresponds to the change in mass of BC that accumulates on the filter [23]. Instrument calibration and zero-point setting were performed prior to the study. Battery power was regularly monitored before starting and during each measurement. The instrument was used in the breathing zone of the commuter. We used a cyclone separator with a 2.5 µm of uppercut point to protect the unit against optical interference due to coarse particles [24]. A flow rate of 100 mL/min and a 60 s logging interval were selected. At the selected flow rate, the instrument can run for about 24 h on a single battery charge and can store up to 4 MB of data in its internal flash memory for a period of 1 week. Internal data files were retrieved using microAeth PC software and stored on local disks in MS Excel files. A GPS module (QStarz model BT-1000XT, Taipei, Taiwan) was also used to record the location and speed of the commuter at 60 s-time intervals.

2.3. Sampling

Our study ran from November 2018 to February 2019, the winter season in Karachi. Morning peak hours ranged between 7 to 10 a.m., whereas afternoon or off-peak hours were between 12 p.m. till 3 p.m. Sampling trips ranged between 30 to 60 min, depending upon the speed of the commute used and traffic intensity of the roads. Measurements were conducted during weekdays.
The spatial and temporal distribution of BC concentrations during peak and off-peak hours along the selected routes was monitored using a BC monitor and a GPS logger. The monitoring was conducted using four different modes of commuting, i.e., car, bus, auto-rickshaw, and motorbike. Exposure measurements were conducted consecutively and in quick succession on the same day for each of the commute modes. Each day, the commuter started the trip at the same place and time with the same mode of commute. Four measurements for each mode of transit (car, bus, auto-rickshaw, and motorbike) were taken in the morning (in-peak time), and the four similar measurements taken in the afternoon (off-peak time) along the same route constituted a round of measurement. The measurements were repeated for four weeks.
During the commute by car and motorbike, the researcher was the driver and was wearing the BC monitor near the breathing zone. With other commuting modes (e.g., bus and auto rickshaw), the researcher was the passenger, sitting beside or behind the driver. All the vehicles (car, bus, and auto rickshaw) were CNG (compressed natural gas) driven, excluding the motorbike, which used petroleum as fuel. The vehicles were usually driven with open windows and fanned ventilation while the air conditioning was kept off.

2.4. Data Analysis

Recorded measurements were immediately downloaded, reviewed and stored after each sampling session. Aethalometer measurements often require some basic post-processing. This usually happens when sampling is performed at higher time resolution or at lower concentrations which incorporates negative values in the data sets obtained [25]. However, we used the manufacturer’s recommended guidelines for personal exposure monitoring (100 mL/min flow rate with 60 s-logging time interval). Therefore, the data did not contain any negative values, which subsequently eliminated the requirement of post-processing the data. Sometimes the instrument also suffers from a loading effect that decreases the sensitivity of the instrument to ambient BC levels; as the aerosol accumulation on the filter strip is increased, the actual ambient BC levels are underestimated [26]. Hence, filter strips were changed every day prior to sampling to prevent this “loading effect.”
The primary meteorological parameters (i.e., temperature, relative humidity, wind speed, wind direction, barometric pressure, and precipitation) for the established sampling site were obtained from a fully automated climatological station of the city located at the Jinnah International Airport, using Weather Underground (www.wunderground.com/global/stations accessed on 30 November 2018).
Bivariate correlation analysis was used to determine the relationships between the concentrations of BC and primary meteorological parameters. The associations were tested using Pearson correlations with 95% confidence intervals around the point estimates. The strength of correlation was classified based on the following ranges, <0.1 no or very weak correlation, 0.5–0.7 strong correlation, and >0.7 very strong correlation.
Analysis of the variance (ANOVA) was performed on the experimental data, and means were compared using Minitab 18 software. ANOVA is a statistical test that evaluates the means of two or more groups of variables in terms of their significance with each other. In this study, a significance level of 5% was adopted (p < 0.05) to test the significance of each parameter for different modes of commute.

2.5. Inhalation Dose

In order to explain the input of each activity in terms of dose, exposure was converted to inhaled dose by means of the average concentration of pollutant inhaled during a trip and minute ventilation per activity for each mode of commute, considering the age and gender of commuters. The inhalation dose was calculated using the following equation:
Dose   ( µ g / km ) = C i ×   VE   ×   t   km
where:
Ci = average concentration of BC measured in a trip (µg/m3).
VE = minute ventilation (m3/min).
t = time spent on a trip (min); and
km = distance of the route (km).
“VE” values used in the estimation of inhaled dose were 0.0139 m3/min as recommended by EPA [27,28].

3. Results and Discussion

3.1. BC Exposure Concentrations

Table 2 represents the summary statistics and BC exposure concentrations along with the timing of the trips for each mode of commute in peak and off-peak hours. The time fractions of vehicular trips varied as per the condition of the roads and traffic volume. The average in-peak travel time ranged between 0.5–1.16 h, while average off-peak sampling trips ranged between 0.42–0.83 h. The sampling routes together were approximately 18 km long. The motorbike was the fastest mode of transit at such a distance in both peak and off-peak hours, while public buses were the slowest mode of commute for the same distance.
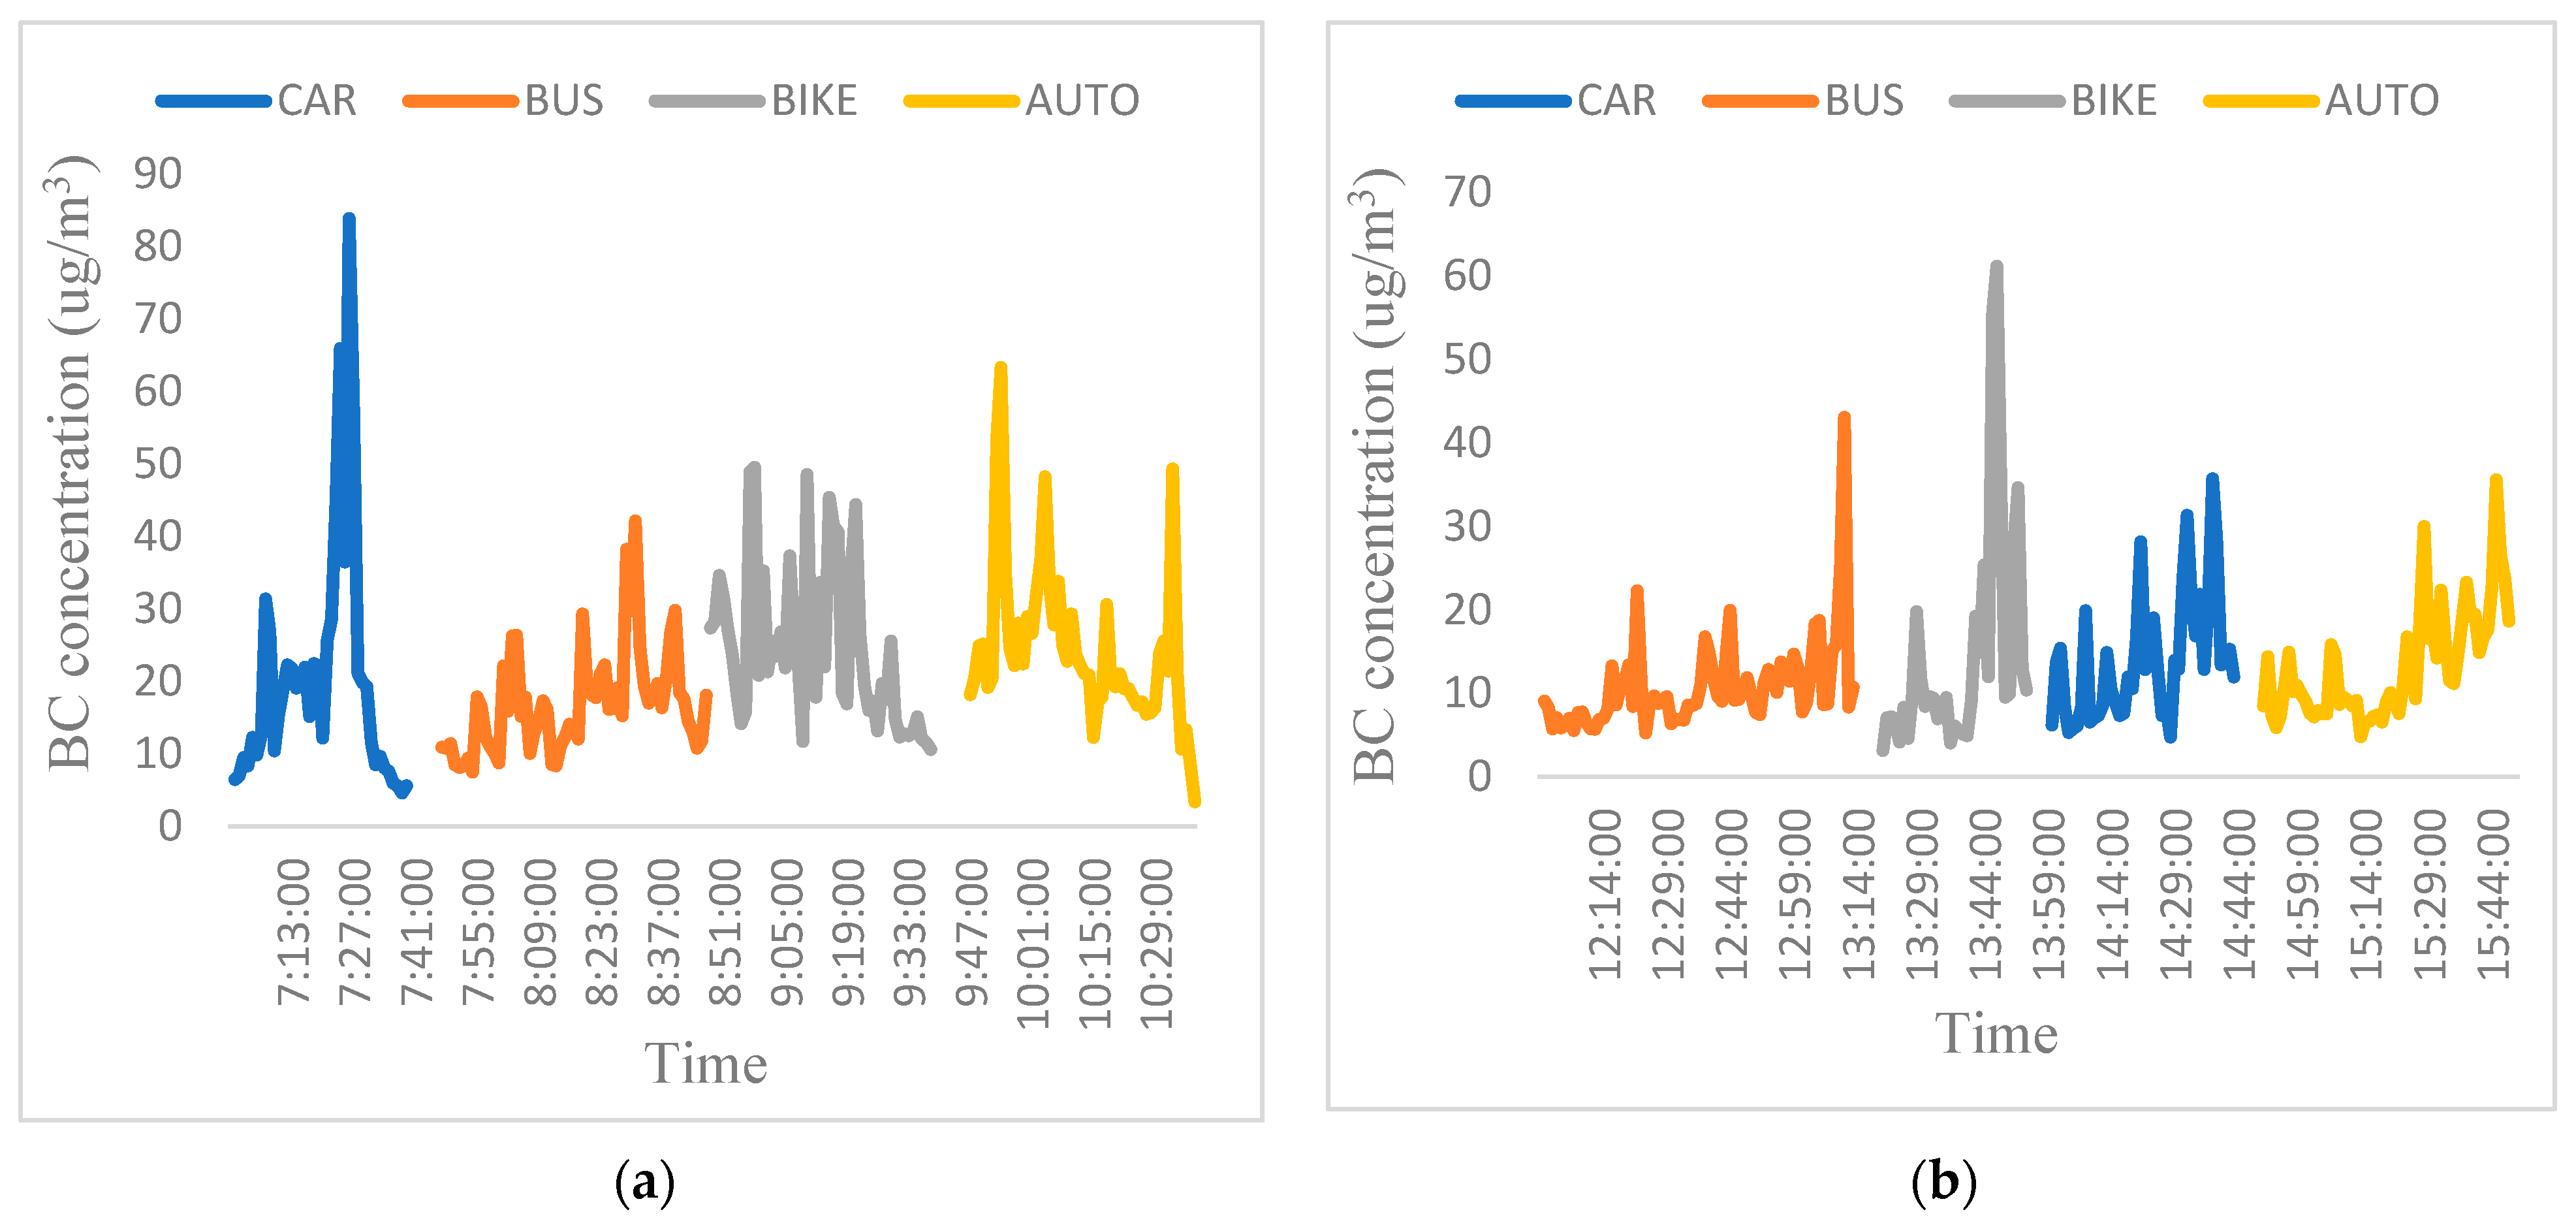
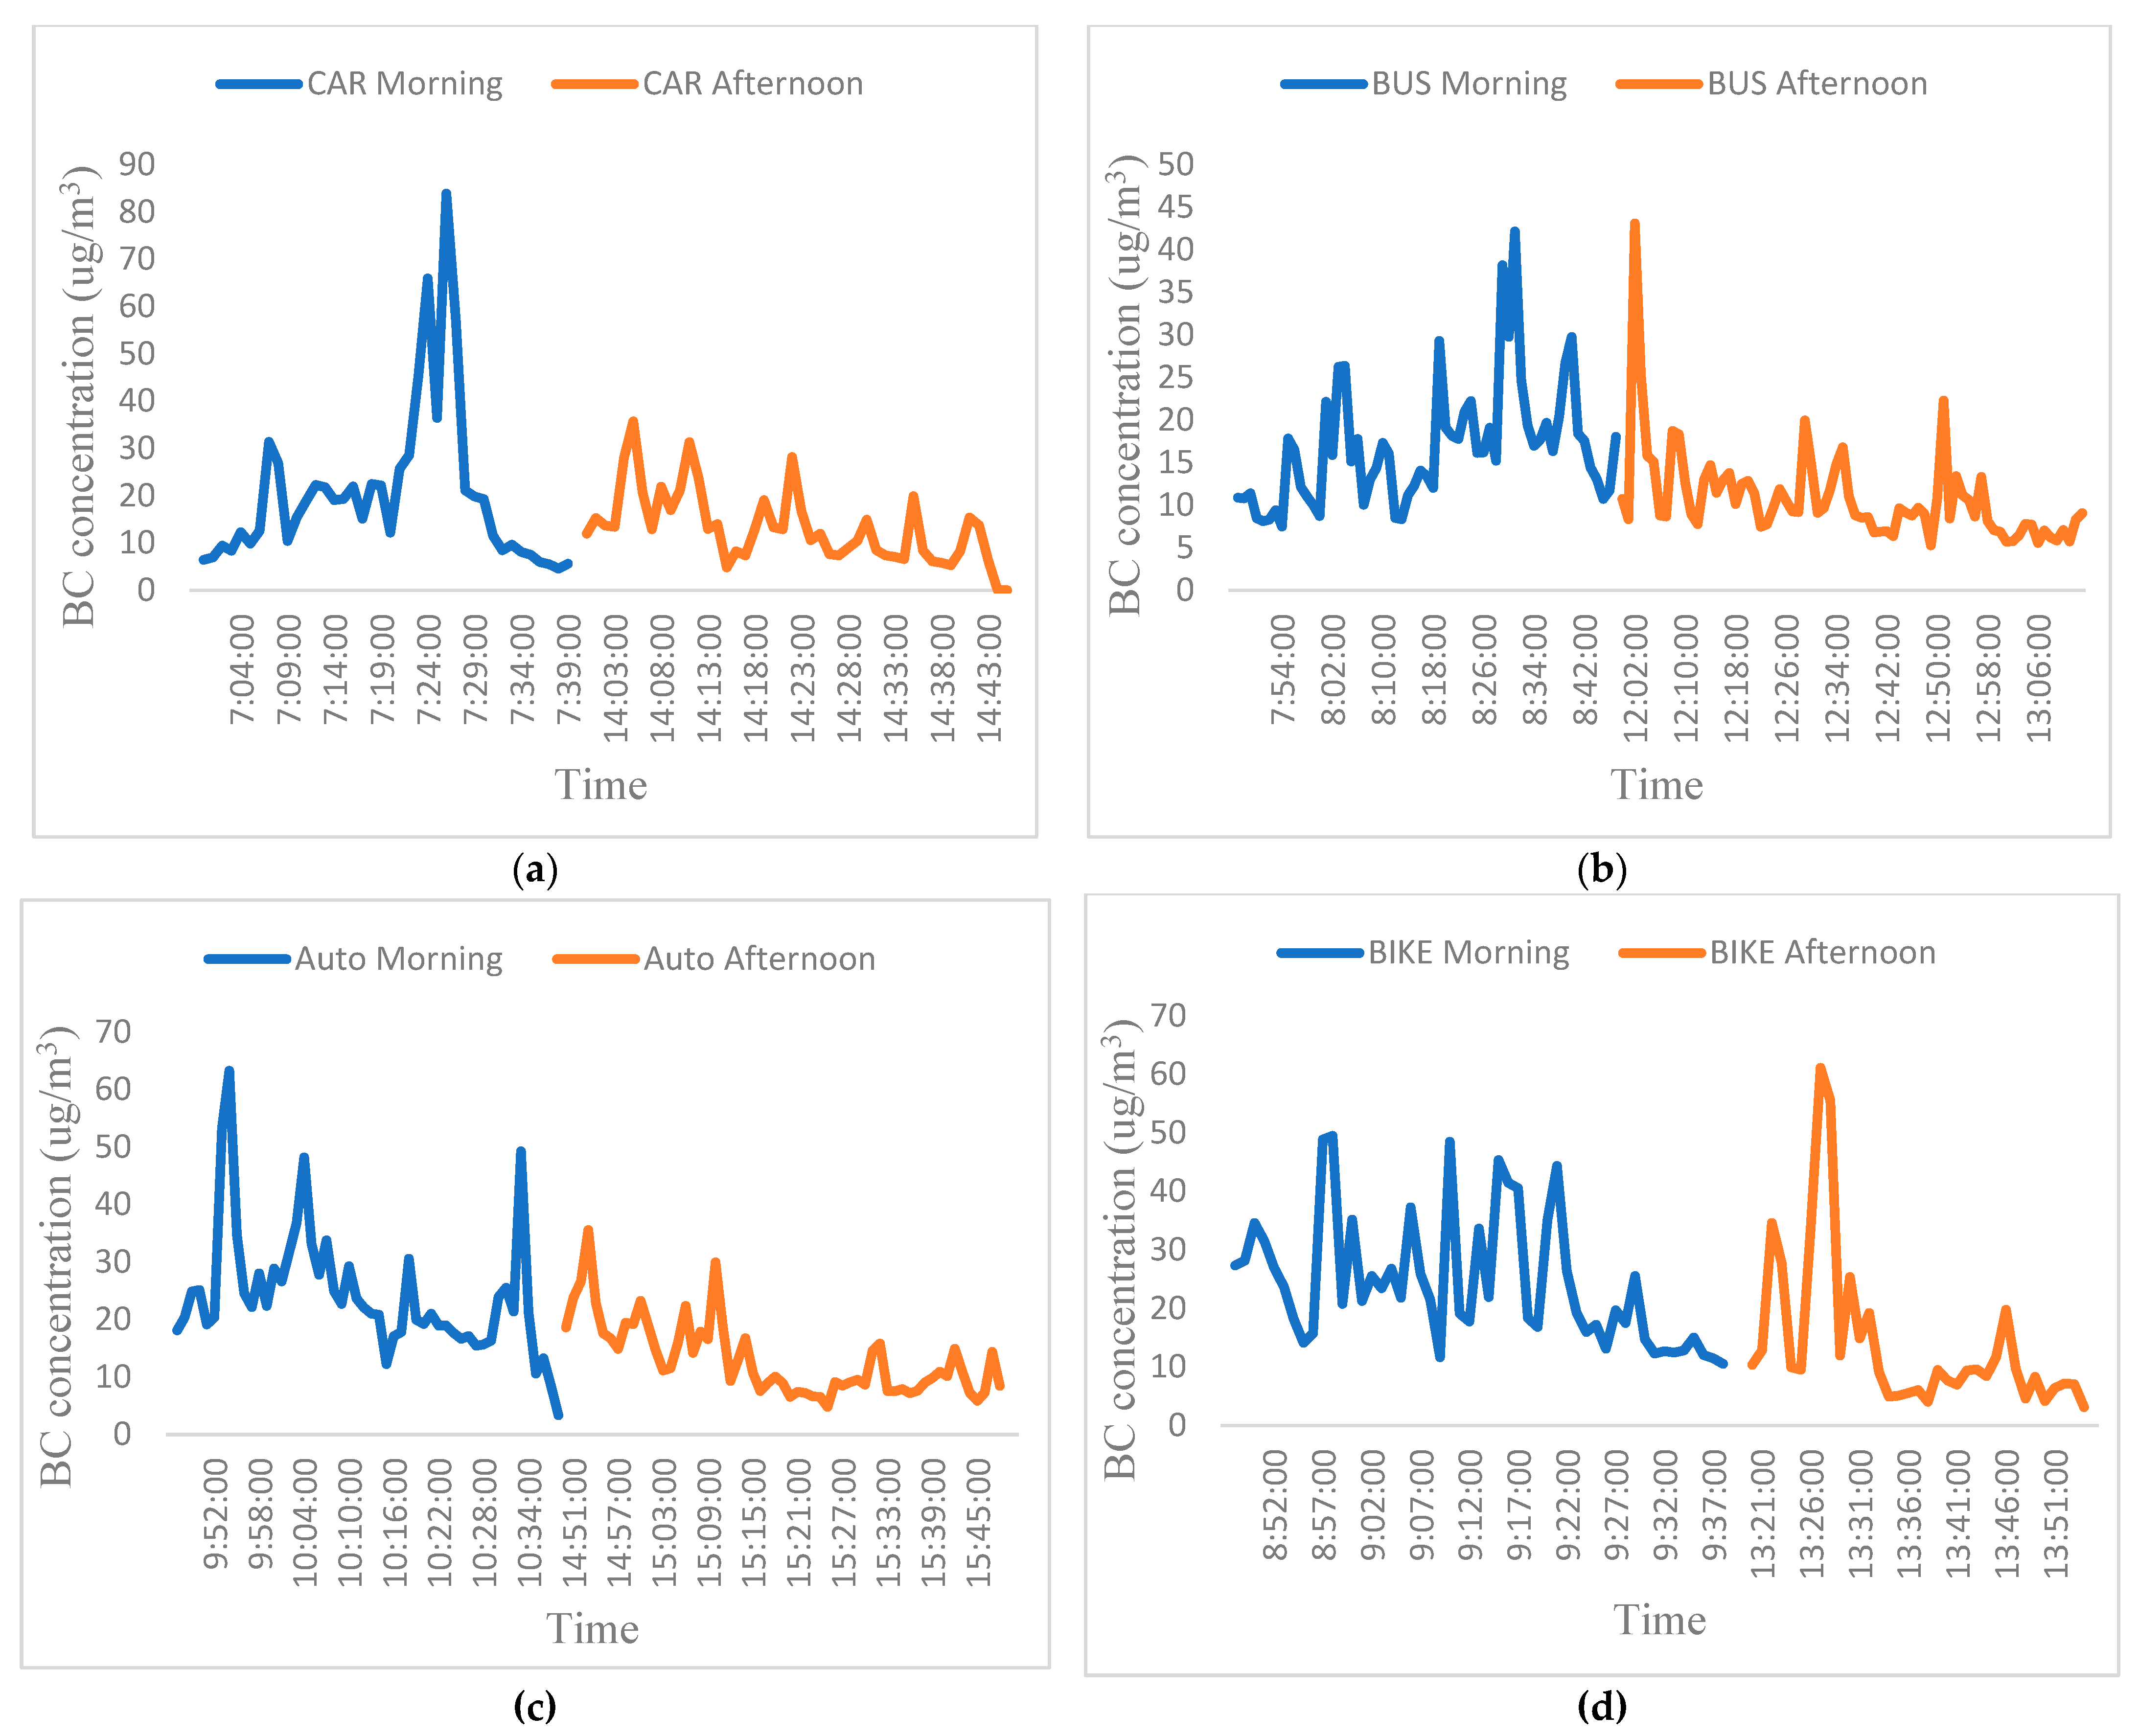
The highest in-vehicle exposure concentrations for all modes of commute were observed during morning rush hours (Figure 4 and Figure 5). Moreover, in-peak sampling (Figure 4a) showed a greater number of higher concentration peaks than the off-peak sampling (Figure 4b). Likewise, BC morning peak hour exposure levels were almost double the levels measured during the afternoon hours. This may be due to high vehicular density, traffic congestion, and less pollutant dispersion in the peak hours, Li et al. (2015) [29] also reported similar trends in their study conducted in Shanghai.

3.2. Spatial and Temporal Distributions of BC Concentrations

To understand the spatial distribution and levels of BC concentrations along the two roads, we subdivided the roads into three prominent categories based on their land use, e.g., residential (P1–P9, Figure 2), commercial-cum residential (P10–P18, Figure 2) and commercial (P18–P28, Figure 2), designated as Route-1 (6.5 km), Route-2 (5.6 Km) and Route-3 (5.2 km) respectively.
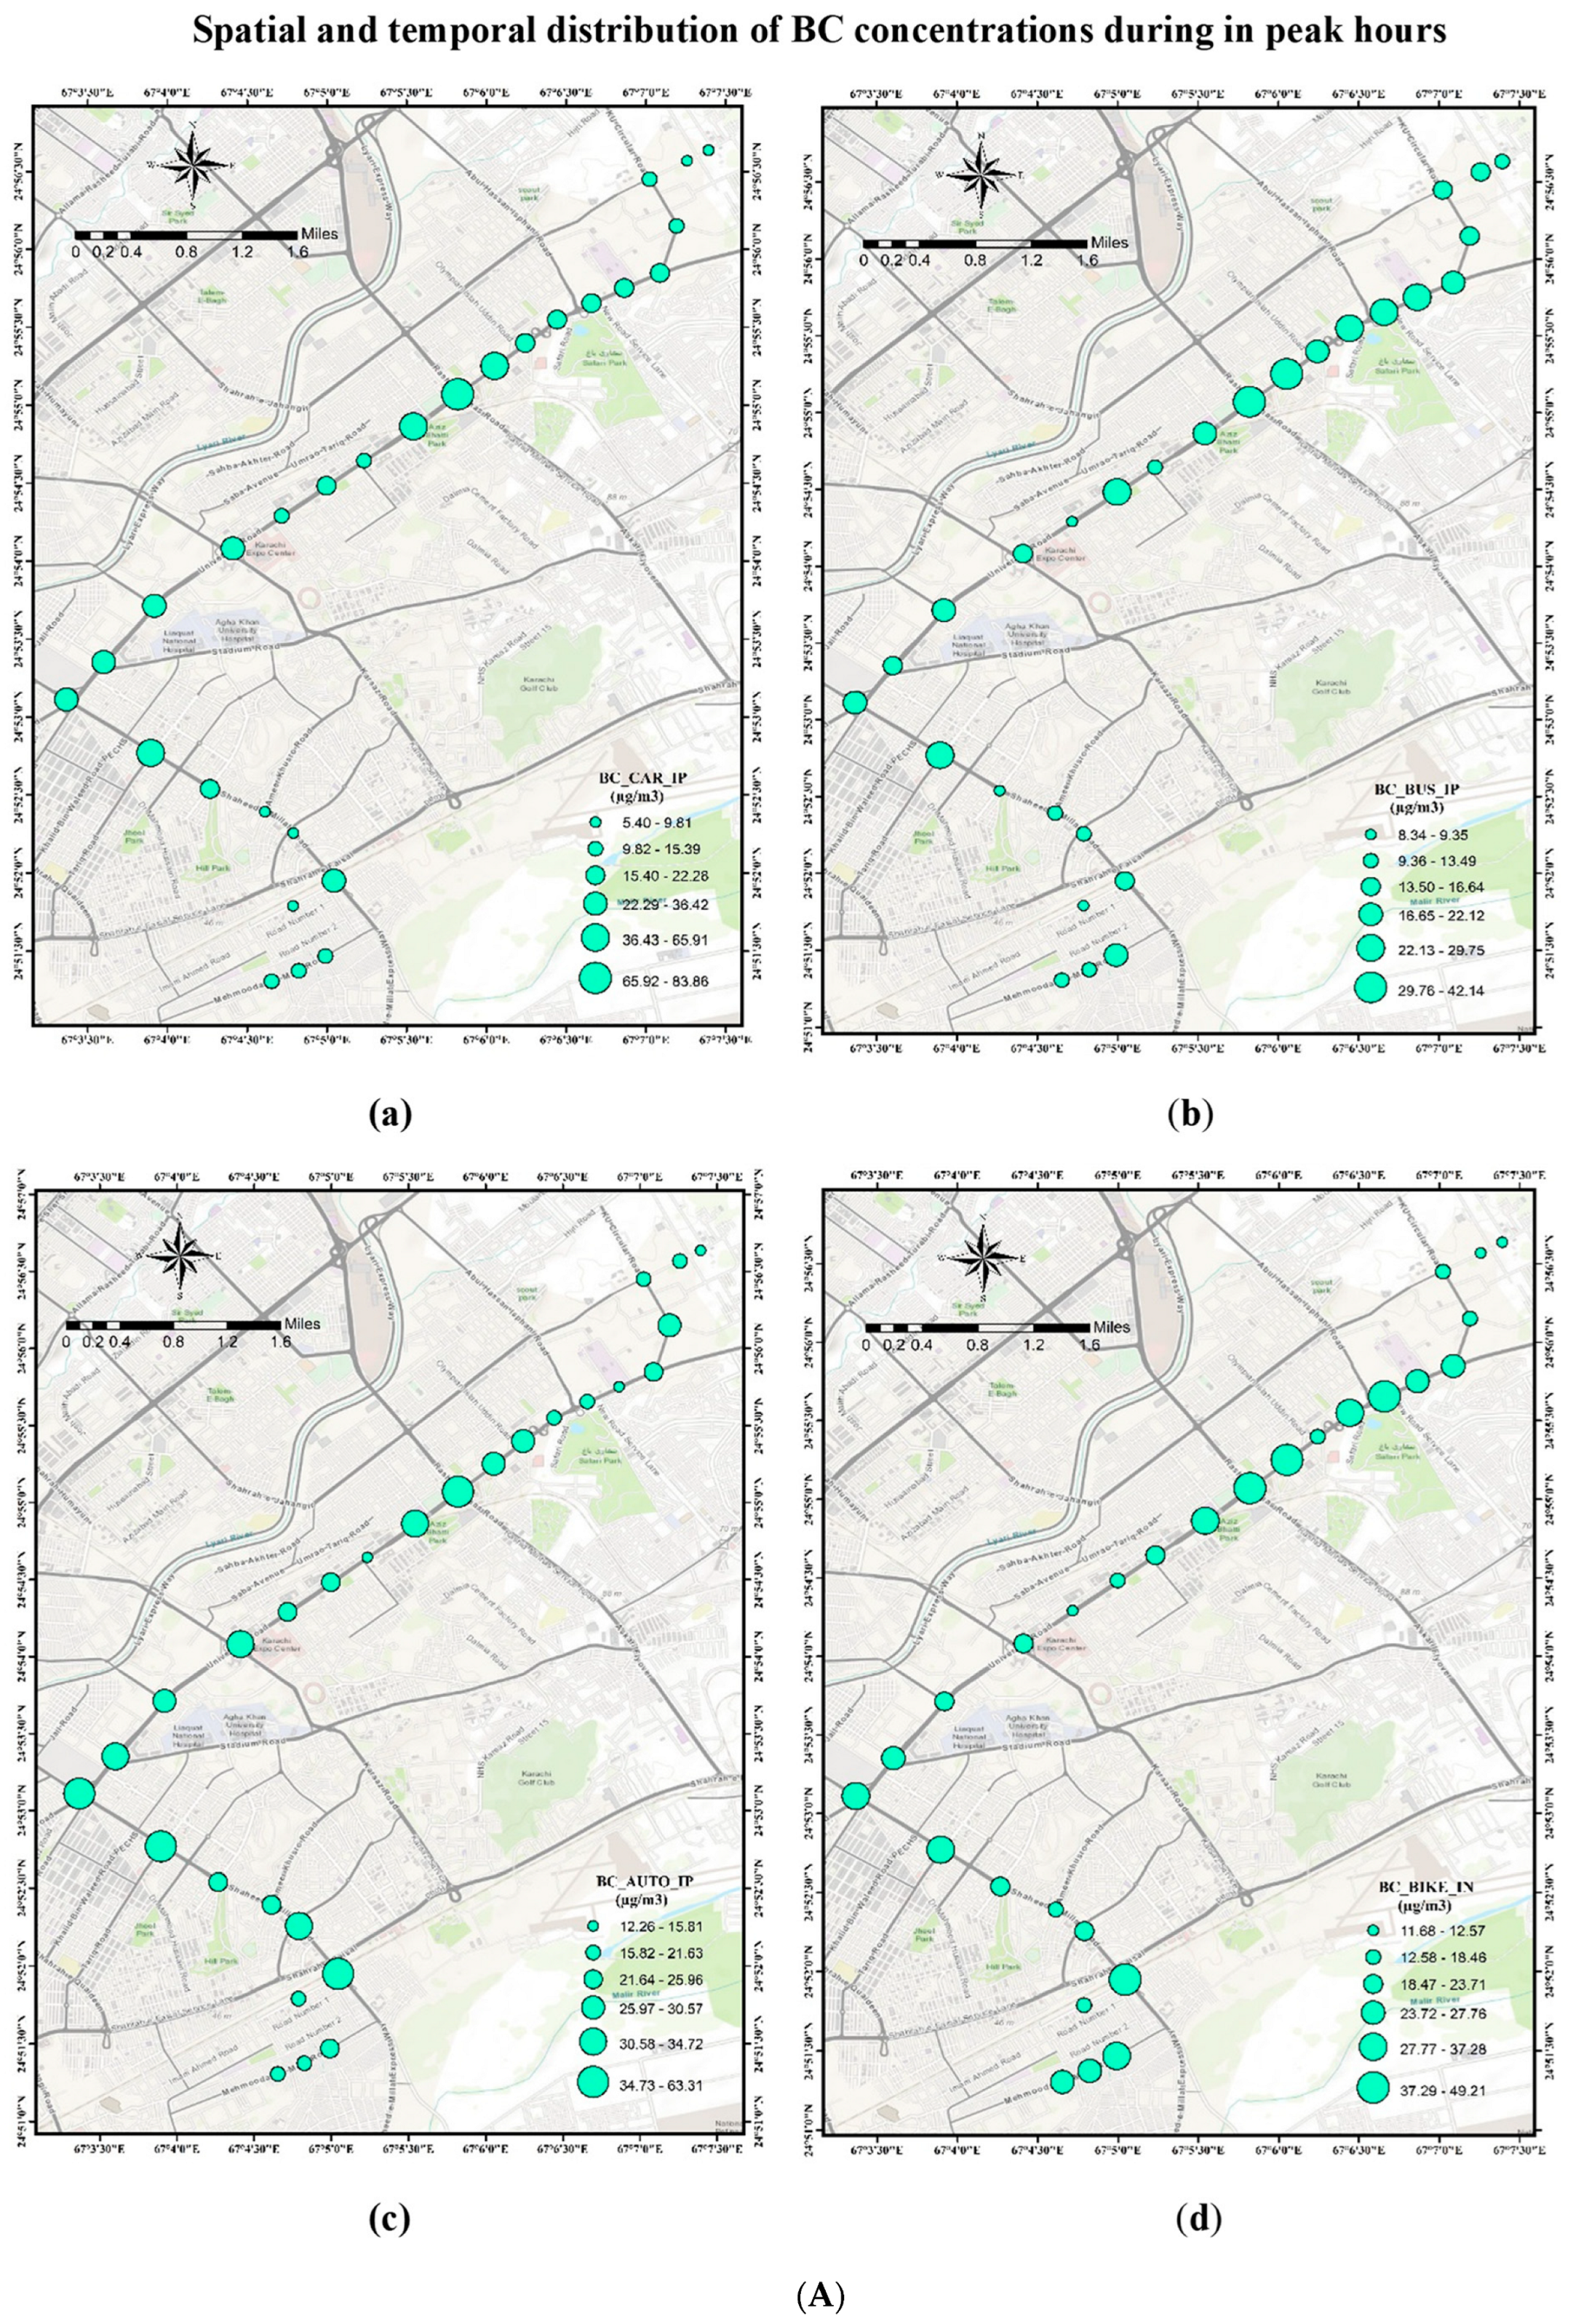
Figure 6 depicts the spatial and temporal distributions of BC concentrations along the routes during office peak (Figure 6A) and off-peak hours (Figure 6B). Spatial variance maps were constructed for locations with considerable changes in exposure values, i.e., repeating or resembling exposure values were not shown in the final maps. The geographical point locations (designated as P1–P28, Figure 2) were 3–5 min apart, depending upon the mode of commute used. Each circular point with different color gradients corresponds to a specific average BC concentration at that location, representing the spatial variation of BC levels at different geographical locations of the routes. Figure 6A reveals the in-peak spatial distribution level of BC, which is higher than the off-peak spatial distribution (Figure 6B); this variation is mainly due to the increased vehicular intensity levels, road congestion, and more frequent traffic jams during peak hours.
Mahmoudabad, the initial part of route-1 (P1-P4), experienced lower- to moderate levels of BC concentrations (Figure 6A,B) as it is purely a residential area but has poor road conditions, causing traffic congestion and increasing the pollutant exposure from lower to moderate levels. BC concentrations were drastically increased after leaving Mahmoudabad at the very first interchange, Baloch flyover (P5). The bridge leads to one of the largest industrial areas of the city (Korangi Industrial. Area—Figure 2) and is a passageway for many heavy-duty vehicles going to and from industries. Route-1 passes through Tariq Road (P7–P9), which is a residential cum- commercial area as well as a well-known cloth market of the city. This area accrues high BC emissions from vehicles coming from different areas of the city. Route-1 ends at the Jail Road interchange (P10). which is the second large interchange linking Route-1(Shaheed-e-Millat road) to Rout-2 (University Road). BC concentrations were again markedly elevated at this point (Figure 6).
BC peak points increased from Route-1 to Route-2 because of the higher vehicular densities and street canyon effect along Route-2. This route (P10–P18) is fenced with schools, shopping centers, food streets, universities, hospitals, parks, and small-scale industries. Therefore, it experiences heavy vehicular emissions and is the most exposed route of the two roads. The route is also surrounded by high rise buildings on both sides of the roads. The highest BC exposure levels were also observed along this route at the Nipa interchange (P18, Figure 2), which is the busiest interchange throughout the day. This interchange also connects Route-2 with Route-3.
Most of the higher BC peak concentrations in both peak and off-peak hours were observed on University Road along Route-2, as it has the highest number of trips and a greater number of vehicles passing by compared to Shaheed-e-Millat road (Table 1). Shaheed-e-Millat Road (Route-1) received lesser BC peak concentrations despite the fact that it passes through an industrial area with a higher flow rate of diesel-fueled trucks than University Road. The reason for this is the restriction on heavy-duty diesel vehicles′ operation during the daytime (6 am–11 pm), as they are only allowed to move freely after 11 p.m. at night. Therefore, the concentrations were lower than the University Road.
Despite being linked to highly exposed and polluted roads, University Road along Route-3 showed a gradual decrease in BC levels when heading towards the end (P18–P28) since the entire route is comprised of universities, hospitals, and parks. The roads are wide open with comparatively few tall buildings, lower traffic volume, and less congestion, so the pollutant dispersion is wide-ranging. As a result, BC concentrations were diluted and decreased with distance compared to concentrations in the initial sections of the road (Figure 6A,B). Due to this, University Road along Route-3 did not show any (or very few) higher BC peak concentrations. The trend was the same in peak and off-peak hours; however, in-peak concentrations were always higher for this route than the corresponding off-peak exposure concentrations. Street topology also accounted for spatial variations of BC levels as the exposure levels were higher at the intersections and on narrow, congested, and damaged roads, which caused vehicles to lower speed, creating traffic congestion. This resulted in increased emission of BC from incomplete fuel combustion.

3.3. BC Exposure in Different Modes of Commute

The BC variations among different transport modes were large because of differences in ventilation status, trip timing, vehicular fuel types, traffic volumes, and pollutant dispersion or congestion by the surrounding environment.
Results in Table 2 suggest that the lowest exposure levels were observed while commuting with public buses, e.g., 21.0 ± 2.17 µg/m3, while commuters traveling by motorbike (26.9 ± 3.02 µg/m3) and auto rickshaw (26.0 ± 1.89 µg/m3) were exposed to similar but comparatively higher BC levels than public transport. Similar observations were made by Quang et al. (2021) [30] for motorbikes. Private cars, on the other hand, were found to be moderately exposed, with an average exposure of 22.2 ± 4.31 µg/m3, which was intermediate to the levels of all other commuting modes. The concentrations were close to each other since they were measured along the same roads and at the same time. Nevertheless, there was a clear difference in the concentrations, which was mainly due to the mode of commute used and traffic intensities.
Maximum exposed BC concentrations during in-peak (and off-peak) for cars, buses, auto-rickshaw, and motorbikes were 83.9 (35.7) µg/m3, 42.1 (43.1) µg/m3, 63.3 (35.6) µg/m3 and 49.5 (61.2) µg/m3, respectively, whereas minimum exposed BC levels were 4.59 (4.78) µg/m3, 7.48 (5.26) µg/m3, 3.39 (4.81) µg/m3 and 10.6 (3.15) µg/m3 respectively. The highest in-peak concentrations for the car (83.9 µg/m3) and auto rickshaw (63.3 µg/m3) were observed at the interchanges Nipa (P18) and Baloch (P5), respectively. Exposure by car was higher because the windows were kept open during the study; this agrees with the results of Li et al. (2015) [29] observed while commuting in a taxi with open windows. Similarly, maximum off-peak exposure levels for a motorbike (61.2 µg/m3) and bus (43.1 µg/m3) were also observed at the Nipa Interchange (P18). Public buses stay at this interchange for 10–15 min to wait for passengers, which increases the exposure of passengers sitting inside the bus. It also creates traffic congestion for other commuters.
For all modes, more peak concentrations were observed during morning rush hours (Figure 6A), while in off-peak hours (Figure 6B), peak concentrations were seen at the interchanges only. Exposure patterns for all modes of commute showed consistency in off-peak hours (Figure 6B) compared to the peak hours. Li et al. (2015) [29] reported good consistency between cars (taxis) and buses, while in our study, exposure patterns for buses resembled that of a motorbike. Concentrations were higher for motorbikes than buses in similar observations discussed by Quang et al. (2021) [30].
Figure 3 shows the average density of different modes of commute along the two roads. As can be seen from the figure, the average traffic flow for all modes was always higher along University Road than on Shaheed-e-Millat Road, except for the heavy- diesel vehicles (e.g., trucks, etc.), which were higher on the Shaheed-e-Millat road. Still, the average BC concentrations were higher along University Road than Shaheed-e-Millat Road. Other researchers, such as Song et al. (2013) [31] and Wang et al. (2011) [32], reported heavy-duty diesel vehicles to be the major contributor to BC exposure on roads. However, the relatively lower numbers of these vehicles on the two roads observed in our study reduced the possible impact on BC concentrations they might otherwise have had.
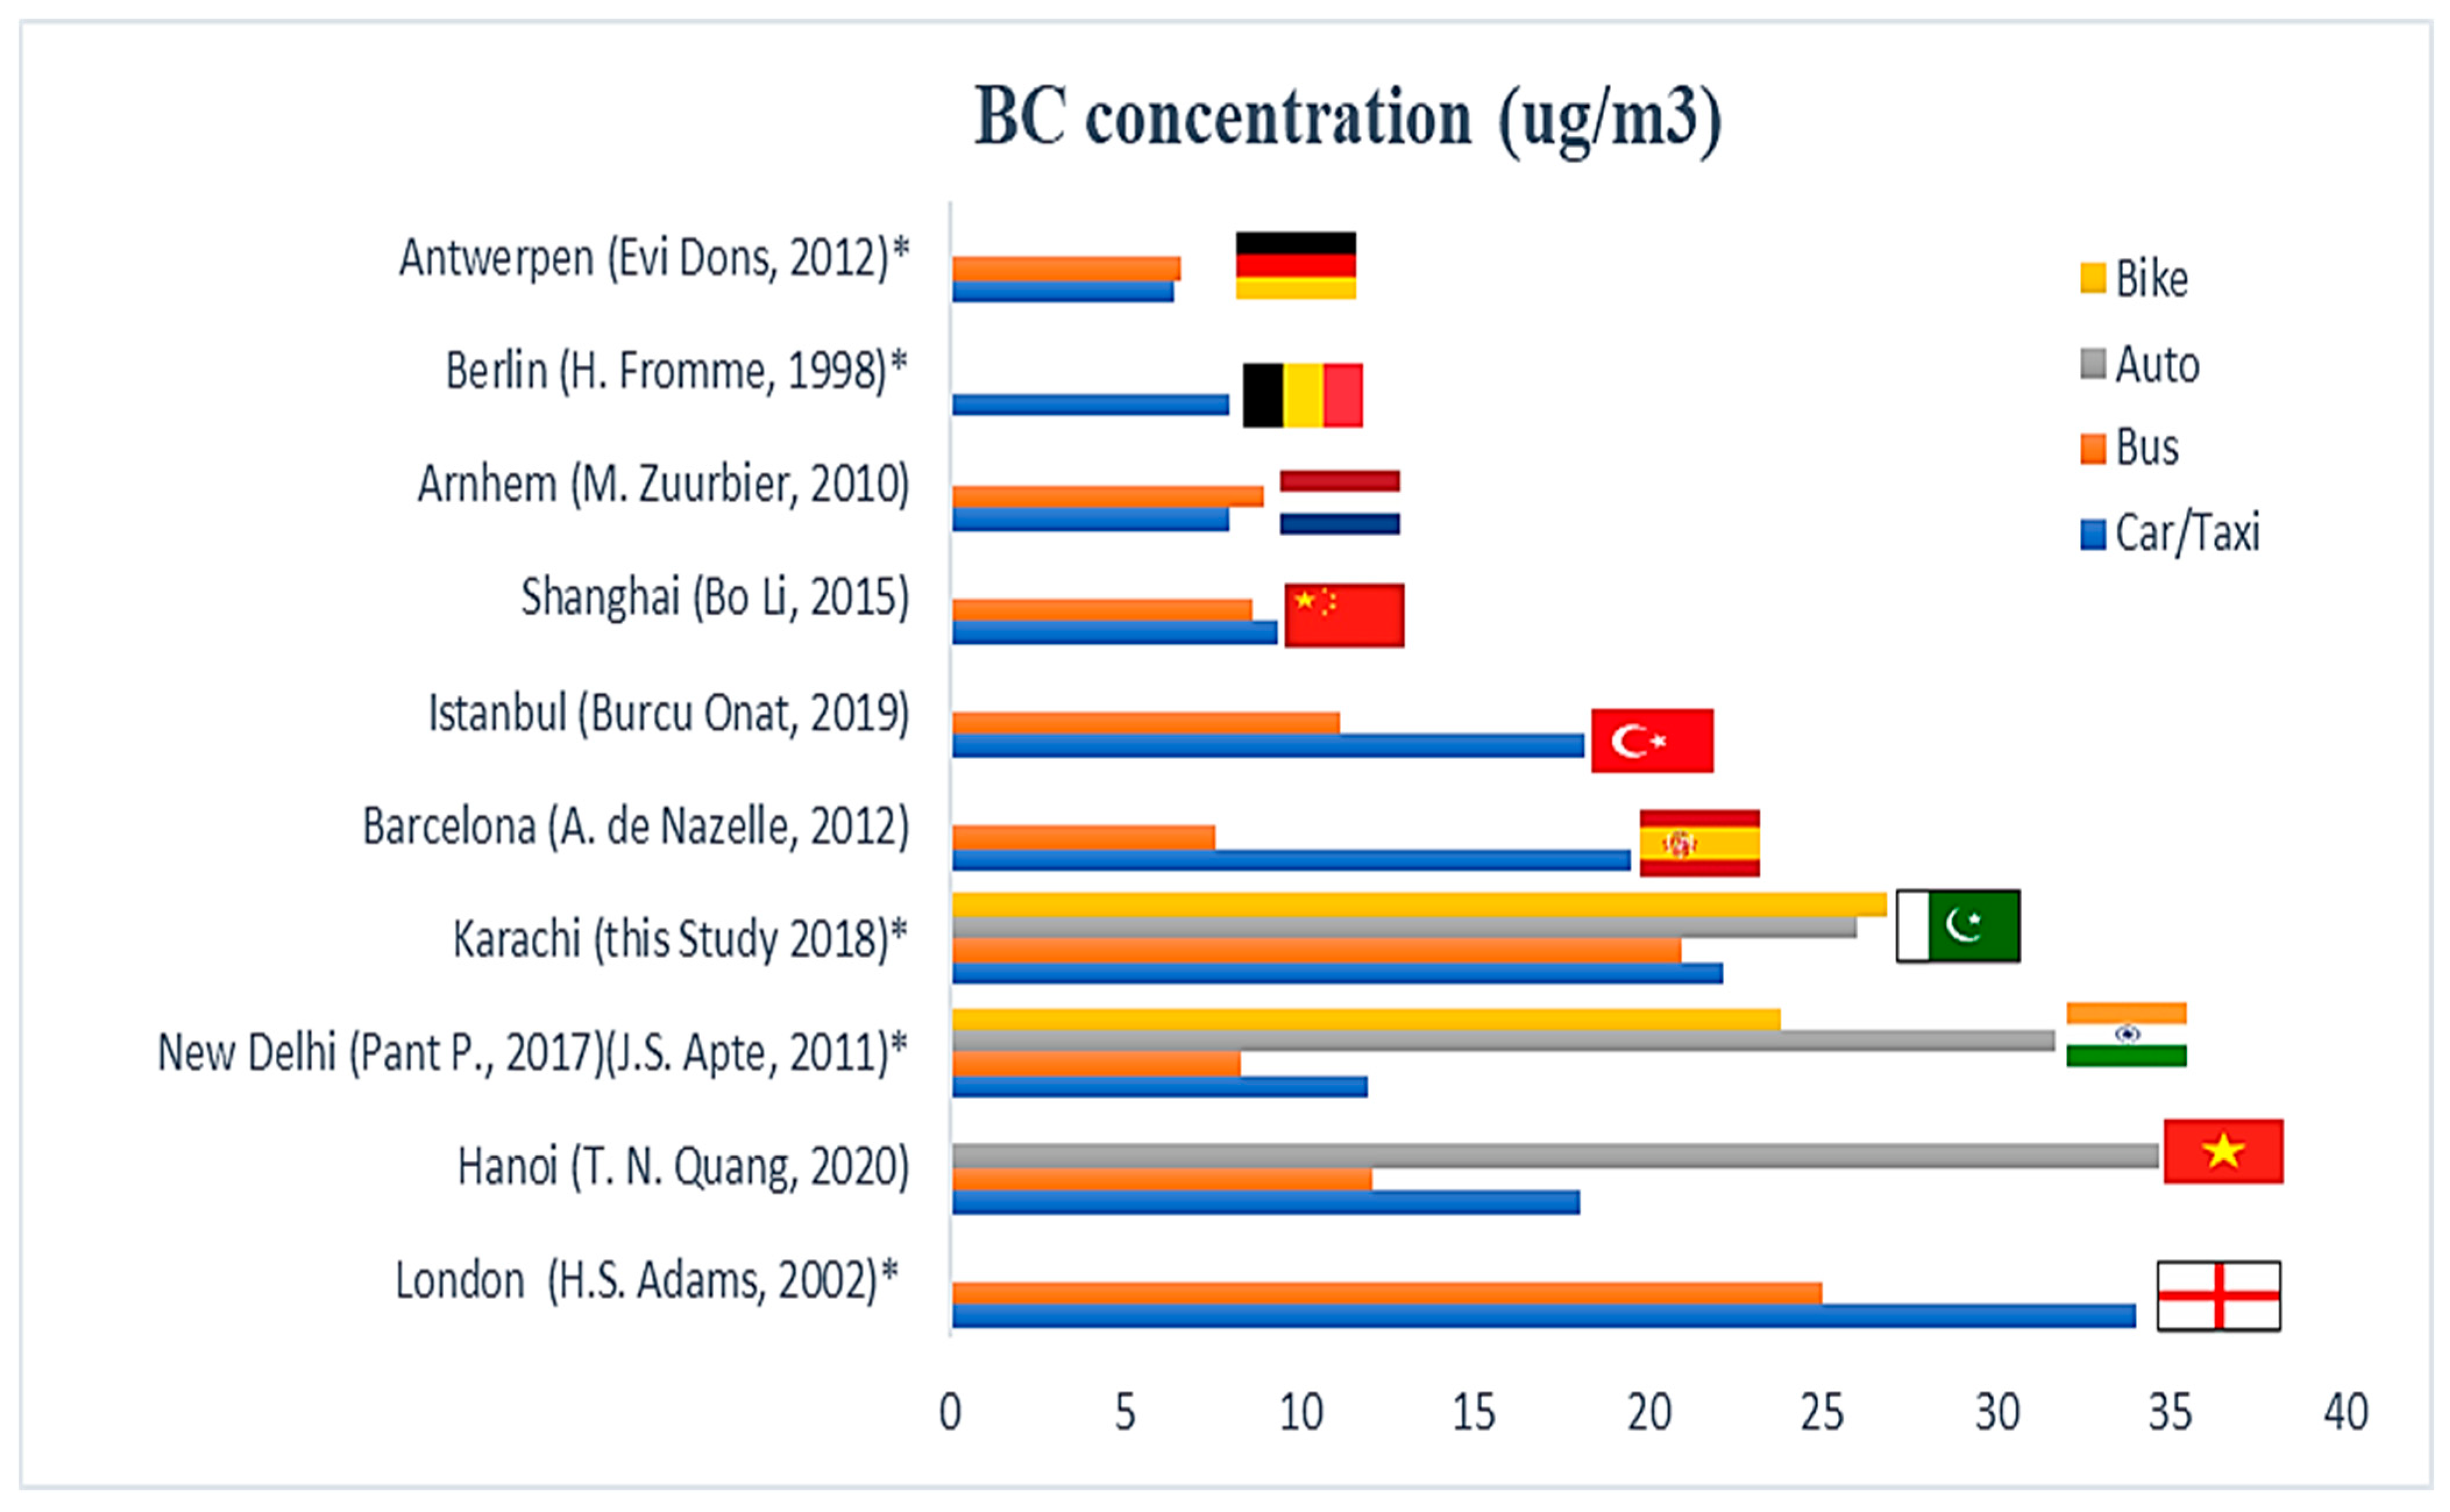
Figure 7 shows a comparison of BC concentrations observed along the roads of Karachi with those reported for various megacities of Asia and Europe. The average BC exposure concentrations in Karachi were comparable to other Asian cities except for Shanghai. However, the concentrations were higher than most of the European cities apart from London, which showed higher levels of elemental carbon during the winter season, possibly due to less efficient vehicle engines and more stable meteorological conditions during the winter season, as reported by another researcher [33].
Table 3 shows the correlation between BC levels and primary meteorological parameters (temperature, humidity, wind speed, and barometric pressure). Results suggest that sources of BC may not be natural but anthropogenic because no significant correlation was found/revealed between BC levels and natural meteorological parameters in this study.
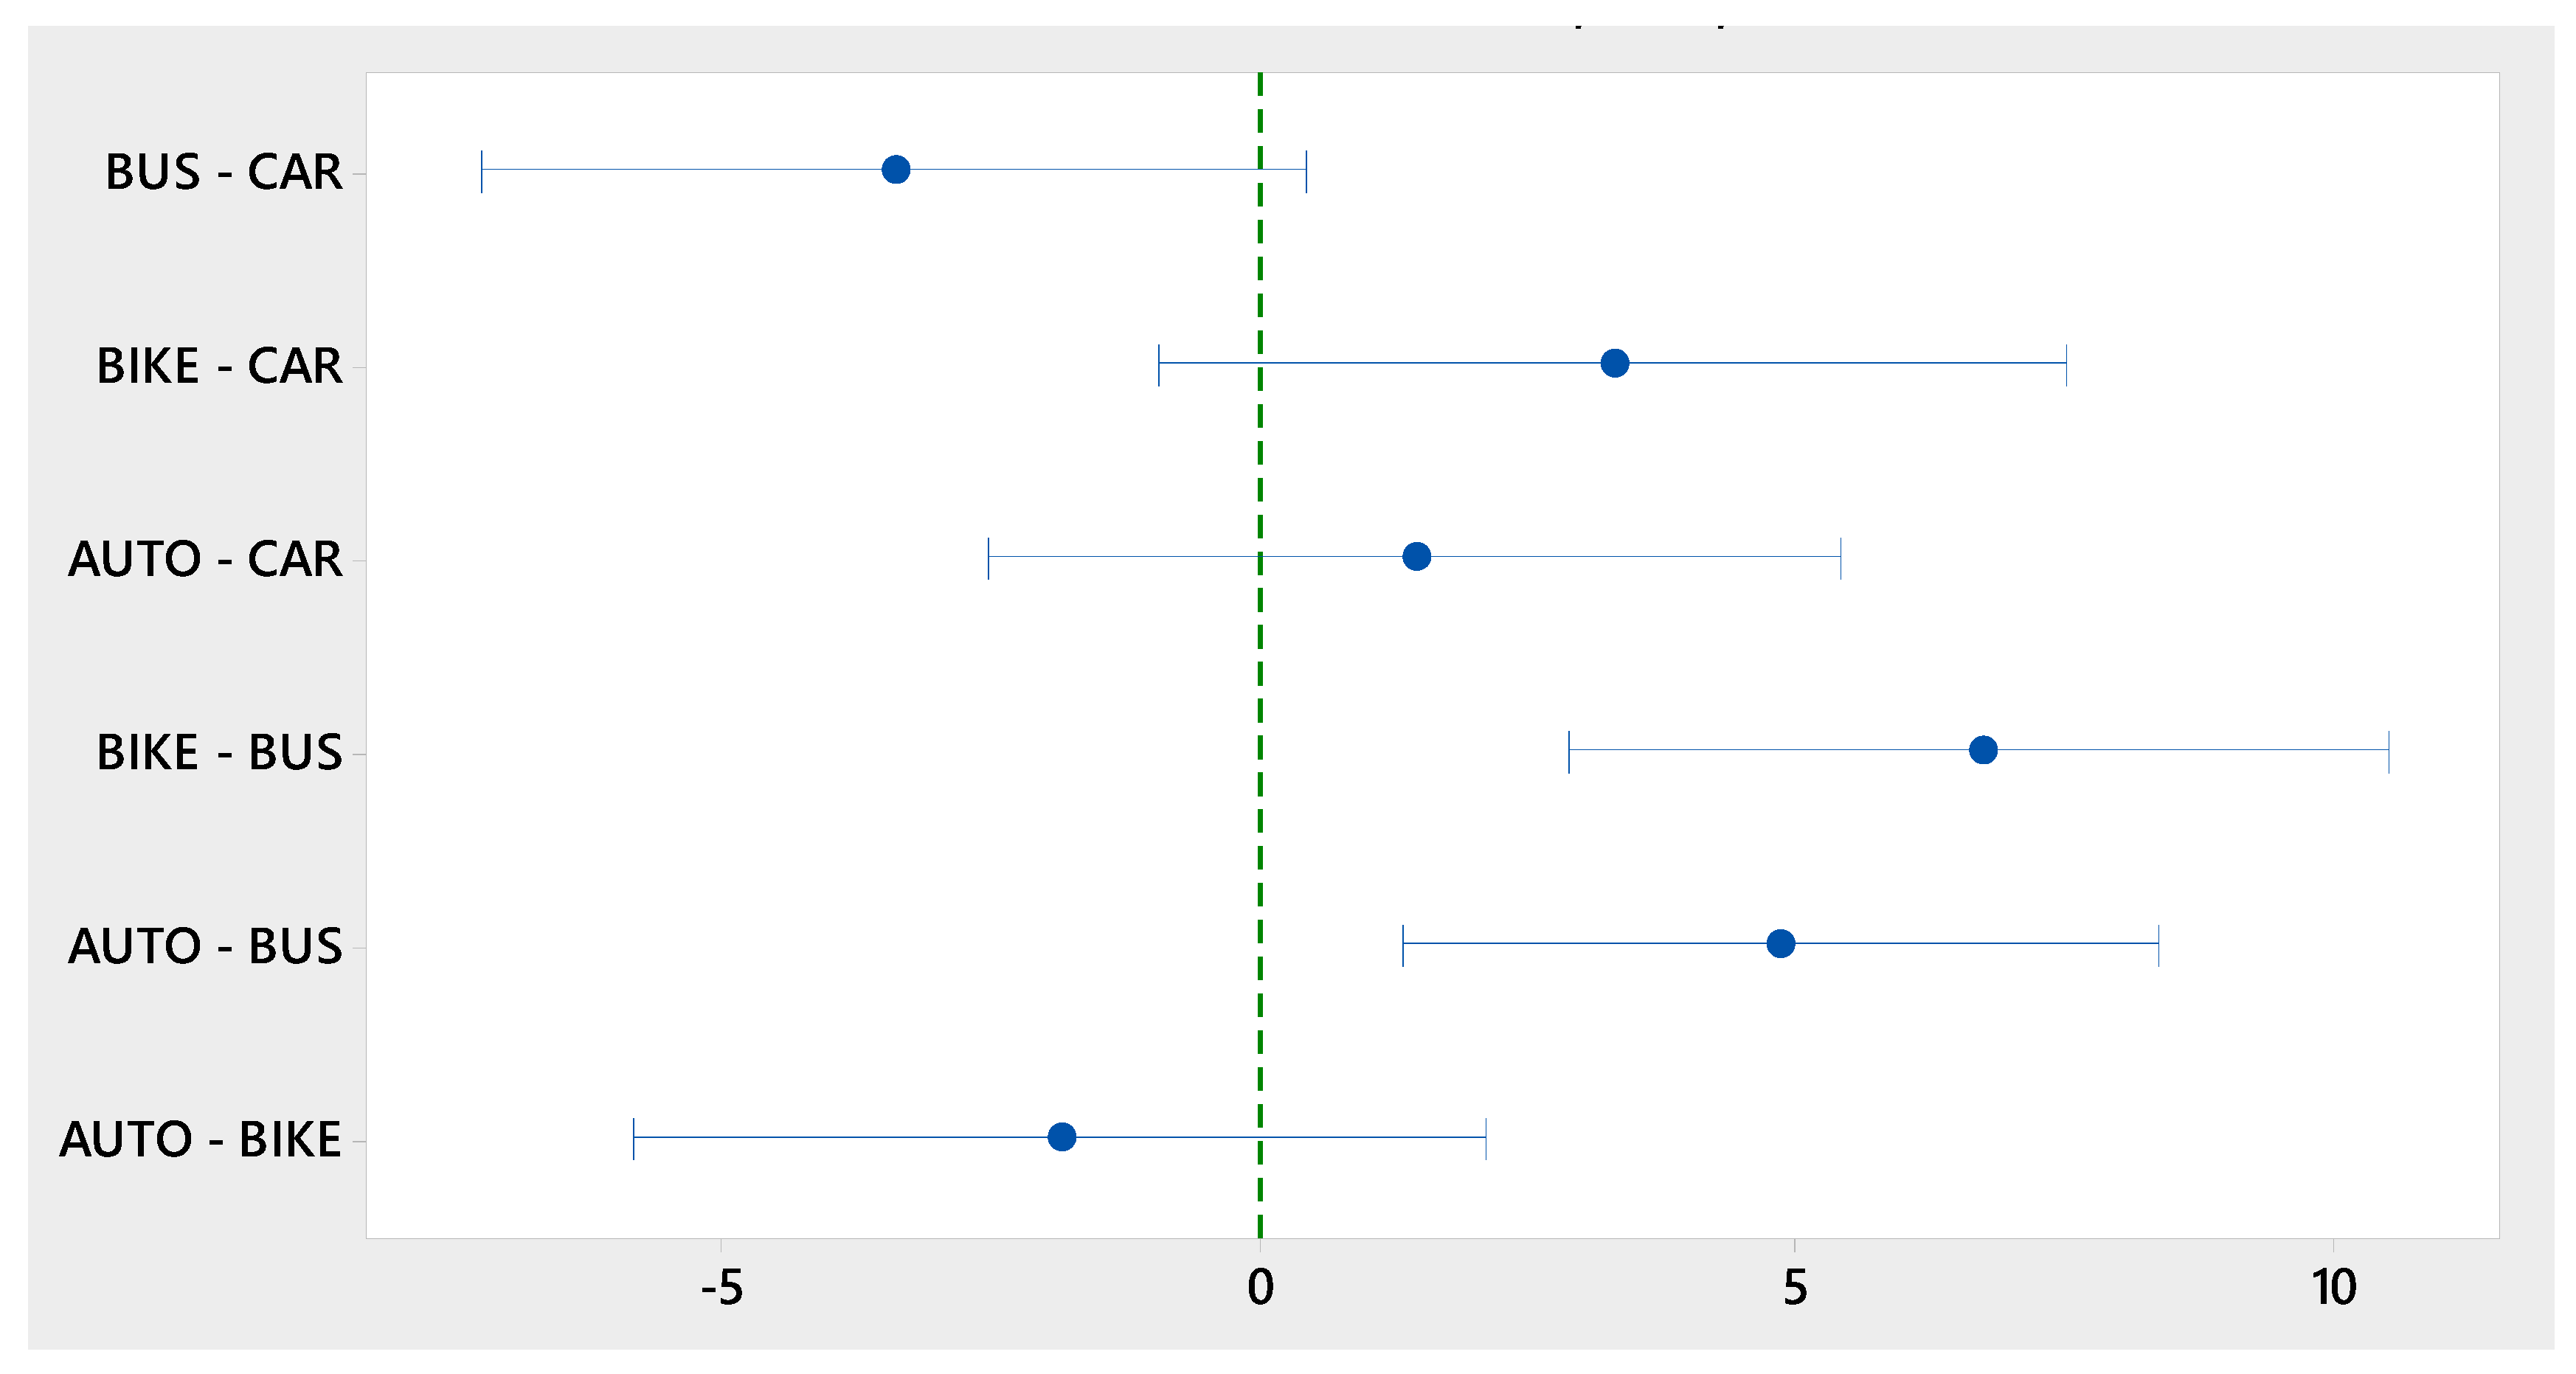
The means of the different commute pairs (bus-car, bike-car, auto-car, bike-bus, auto-bus, auto-bike) were compared using Post Hoc statistical tests (also known as multiple comparisons). Figure 8 shows the ANOVA test result at α = 0.05, with Tukey simultaneous confidence intervals. A null hypothesis (Ho) and an alternative hypothesis (Ha) were determined before the analysis, with Ho stating that all mean of the variables are equal and Ha declaring that the mean of the variables is not equal and there exists at least one inequality. The overall adjusted p-value of < 0.001 indicates that the null hypothesis can be rejected and concludes that the group means are not all equal.
The p-value for the commute pair (bike-bus, p < 0.001) and (auto-bus, p = 0.002) were lesser than the significance alpha level of p = 0.05, which indicates that the two pairs have less than a 5% chance of being significant to each other and the means of two pairs of the commute are statistically significantly different. This may be due to the different ventilation environments of buses compared to bikes and auto, which have resembling exposure environments also supported by their statistically significant means (auto-bike p = 0.625) similar is the case with (bus-car p = 0.788). The means for the pair (auto-car, p = 0.103) and (bike-car, p = 0.186) were also found to be significantly different.

3.4. Inhalation Dose

Inhalation doses for different modes were calculated using Equation (1). Such as BC exposure concentrations, an inhaled dose of BC was also higher in the morning peak hours as compared to the afternoon off-peak time. The inhalation dose levels were reduced to almost half in the off-peak hours, which indicates that the traffic intensity level increased the level of inhalable pollutants to which a person is exposed during peak hours. The highest in-peak inhalation dose was calculated for auto rickshaw (1.20 ± 0.19 µg) followed by bus (1.13 ± 0.22 µg), motorbike (0.62 ± 0.12 µg), and car (0.57 ± 0.27 µg). A similar trend (auto rickshaw > bus > motorbike > car) was observed in off-peak hours with inhalation doses of 0.54 ± 0.16 µg, 0.50 ± 0.08 µg, 0.29 ± 0.24 µg and 0.27 ± 0.11 µg for an auto-rickshaw, bus, motorbike, and car, respectively.
Public buses, although having the lowest BC exposure levels, had the second highest level of inhalation dose, just under that of auto rickshaws, which exhibited the highest levels of inhalation dose. This is because the time required to commute by bus was greater than the other modes. The bus was the slowest method of transit due to stopping and waiting for the passengers at many stations, which increased exposure time and led to elevated levels of inhaled dose. The private car was found to be the safest mode of commute in terms of inhaled dose, with the lowest observed value being 0.27 ± 0.11 µg. The inhalation dose for car commuters was lower than that of bus and auto rickshaws, mainly because of the shorter travel time and comparatively better ventilation and sanitary conditions. The lower inhalation dose for motorbikes was due to their shortest travel time. BC exposure levels for motorbikes and auto-rickshaws were the highest, as they have the same inhalation environment. However, auto-rickshaw was much slower than the motorbike, which increased its comparative inhalation dose levels due to longer exposure times. These results suggest the significance of multiple factors, including exposure levels, traveling time, and breathing environment for inhalation dose of any trip.

4. Conclusions

BC exposure concentrations and inhalation dose for four common travel modes (car, bus, auto-rickshaw, and motorbike) were measured in Karachi during office peak and off-peak hours. Among many other factors that influence the commuter’s exposure to air pollutants, travel mode, traffic intensity, street topology, and time of the day were the major influences that were observed in this study.
Commuters were more exposed to air pollutants in the morning rush hours (high traffic density) than in the off-peak hours when the traffic intensity was low. Also, the time of travel, road congestion, and traffic jams at the road interchanges increased the number of pollutants inhaled. Results showed that delays in commuting time increase the daily dose of pollutants, which in turn increases the risk of skin, eyes, and lungs related issues and diseases.
Average BC personal exposures in order of larger to smaller levels were motorbike, auto-rickshaw, car, and bus, while inhalation dose levels from larger to smaller were auto rickshaw, bus, motorbike, and car. These results were based on different sampling durations, inhalation rates, and different exposure concentrations. Cars and public buses were found to be the safest mode of transportation, while motorbikes and auto-rickshaws were the most exposed modes. However, in terms of inhalation dose, public buses were the least safe, and the motorbike was the safest mode of all transit. BC exposure concentrations in the transport microenvironments of Karachi were found to be similar to other Asian cities but much higher than in most European cities.

Author Contributions

Conceptualization, J.J., E.Z. and H.A.K.; methodology, J.J.; software, J.J. and S.S.M.; validation, E.Z. and H.A.K.; formal analysis, S.S.M.; investigation, J.J. and M.K.K.; resources, H.A.K. and E.Z.; data curation, J.J., M.K.K. and S.S.M.; writing—original draft preparation, J.J.; writing—review and editing, H.A.K.; visualization, J.J.; supervision, E.Z. and H.A.K.; project administration, H.A.K.; funding acquisition, H.A.K. All authors have read and agreed to the published version of the manuscript.

Funding

This research received no external funding.

Institutional Review Board Statement

Not applicable.

Informed Consent Statement

Not Applicable.

Data Availability Statement

The authors confirm that the data supporting the findings of this study are available within the article.

Acknowledgments

We are grateful to Wadsworth Center, New York State Department of Health, and the School of Public Health, University at Albany.

Conflicts of Interest

The authors declare no conflict of interest.

References

  1. World Health Organization. Ambient Air Pollution: A Global Assessment of Exposure and Burden of Disease; World Health Organization: Geneva, Switzerland, 2016. [Google Scholar]
  2. PAKISTAN-TODAY Registered Vehicles in Pakistan Increased by 9.6% in 2018. ISLAMABAD: Associated Press of Pakistan. 2019. Available online: https://profit.pakistantoday.com.pk/2019/06/16/registered-vehicles-in-pakistan-increased-by-9–6-in-2018/ (accessed on 26 November 2021).
  3. Hasan, A.; Raza, M. Responding to the transport crisis in Karachi. IIED Urban Resour. Center 2015. Available online: https://pubs.iied.org/sites/default/files/pdfs/migrate/10733IIED.pdf (accessed on 18 November 2021).
  4. Janssen, N.; Gerlofs-Nijland, M.E.; Lanki, T.; Salonen, R.O.; Cassee, F.; Hoek, G.; Fischer, P.; Brunekreef, B.; Krzyzanowski, M. Health Effects of Black Carbon; WHO Regional Office for Europe: Copenhagen, Denmark, 2012; Volume 2017, Available online: https://www.euro.who.int/en/publications/abstracts/health-effects-of-black-carbon-2012 (accessed on 18 November 2021).
  5. Liu, Y.; Yan, C.; Zheng, M. Source apportionment of black carbon during winter in Beijing. Sci. Total Environ. 2018, 618, 531–541. [Google Scholar] [CrossRef]
  6. Malashock, D.; Khwaja, H.A.; Fatmi, Z.; Siddique, A.; Lu, Y.; Lin, S.; Carpenter, D. Short-term association between black carbon exposure and cardiovascular diseases in Pakistan’s largest megacity. Atmosphere 2018, 9, 420. [Google Scholar] [CrossRef] [Green Version]
  7. Anderson, J.O.; Thundiyil, J.G.; Stolbach, A. Clearing the air: A review of the effects of particulate matter air pollution on human health. J. Med. Toxicol. 2012, 8, 166–175. [Google Scholar] [CrossRef] [PubMed] [Green Version]
  8. Zuurbier, M.; Hoek, G.; Oldenwening, M.; Lenters, V.; Meliefste, K.; Van Den Hazel, P.; Brunekreef, B. Commuters’ exposure to particulate matter air pollution is affected by mode of transport, fuel type, and route. Environ. Health Perspect. 2010, 118, 783–789. [Google Scholar] [CrossRef] [PubMed] [Green Version]
  9. Dons, E.; Panis, L.I.; Van Poppel, M.; Theunis, J.; Wets, G. Personal exposure to black carbon in transport microenvironments. Atmos. Environ. 2012, 55, 392–398. [Google Scholar] [CrossRef]
  10. Krzyżanowski, M.; Kuna-Dibbert, B.; Schneider, J. Health Effects of Transport-Related Air Pollution; WHO Regional Office Europe: Copenhagen, Denmark, 2005. [Google Scholar]
  11. Kaur, S.; Nieuwenhuijsen, M.J.; Colvile, R.N. Fine particulate matter and carbon monoxide exposure concentrations in urban street transport microenvironments. Atmos. Environ. 2007, 41, 4781–4810. [Google Scholar] [CrossRef]
  12. Kingham, S.; Longley, I.; Salmond, J.; Pattinson, W.; Shrestha, K. Variations in exposure to traffic pollution while travelling by different modes in a low density, less congested city. Environ. Pollut. 2013, 181, 211–218. [Google Scholar] [CrossRef]
  13. Bibi, S.; Alam, K.; Chishtie, F.; Bibi, H.; Rahman, S. Temporal variation of Black Carbon concentration using Aethalometer observations and its relationships with meteorological variables in Karachi, Pakistan. J. Atmos. Sol. Terr. Phys. 2017, 157, 67–77. [Google Scholar] [CrossRef]
  14. Dutkiewicz, V.A.; Alvi, S.; Ghauri, B.M.; Choudhary, M.I.; Husain, L. Black carbon aerosols in urban air in South Asia. Atmos. Environ. 2009, 43, 1737–1744. [Google Scholar] [CrossRef]
  15. Review, W.P. Karachi Population 2021. Available online: https://worldpopulationreview.com/world-cities/karachi-population (accessed on 30 November 2021).
  16. Khwaja, H.A.; Fatmi, Z.; Malashock, D.; Aminov, Z.; Kazi, A.; Siddique, A.; Qureshi, J.; Carpenter, D.O. Effect of air pollution on daily morbidity in Karachi, Pakistan. J. Local Glob. Health Sci. 2012, 2012, 3. [Google Scholar] [CrossRef]
  17. Hasan, A. Emerging Urbanisation Trends: The Case of Karachi; ref. Number C-37319-PAK-1, Working Paper for the International Growth Center; London School of Economics: London, UK, 2016; Available online: https://www.theigc.org/wp-content/uploads/2016/12/Hasan-2016-Academic-Paper.pdf (accessed on 18 November 2021).
  18. Noman, S.M.; Ahmed, A.; Ali, M.S. Comparative analysis of public transport modes available in Karachi, Pakistan. SN Appl. Sci. 2020, 2, 1–13. [Google Scholar] [CrossRef] [Green Version]
  19. World Bank. Transforming Karachi into a Livable and Competitive Megacity A City Diagnostic and Transformation Strategy Directions in Development; World Bank: Washington, DC, USA, 2018. [Google Scholar] [CrossRef]
  20. JICA. Karachi Transportation Improvement Project; Final Report; Government of Pakistan, Karachi, Pakistan. Available online: https://openjicareport.jica.go.jp/pdf/12086369_02.pdf (accessed on 26 November 2021).
  21. Aziz, S.; Billoo, A.; Samad, N. Impact of socioeconomic conditions on perinatal mortality in Karachi. J. -Pak. Med. Assoc. 2001, 51, 354–359. [Google Scholar] [PubMed]
  22. Kabir, M.; Iqbal, M.Z.; Shafiq, M. Traffic density, climatic conditions and seasonal growth of Samanea saman (jacq.) Merr. on different polluted roads of Karachi city. Pak. J. Bot. 2012, 44, 1881–1890. [Google Scholar]
  23. Cai, J.; Yan, B.; Kinney, P.L.; Perzanowski, M.S.; Jung, K.H.; Li, T.; Xiu, G.; Zhang, D.; Olivo, C.; Ross, J. Optimization approaches to ameliorate humidity and vibration related issues using the microAeth® black carbon monitor for personal exposure measurement. Aerosol Sci. Technol. 2013, 47, 1196–1204. [Google Scholar] [CrossRef]
  24. Cai, J.; Yan, B.; Ross, J.; Zhang, D.; Kinney, P.L.; Perzanowski, M.S.; Jung, K.; Miller, R.; Chillrud, S.N. Validation of MicroAeth® as a black carbon monitor for fixed-site measurement and optimization for personal exposure characterization. Aerosol Air Qual. Res. 2014, 14, 1. [Google Scholar] [CrossRef] [PubMed] [Green Version]
  25. Cheng, Y.H.; Lin, M.H. Real-time performance of the microAeth® AE51 and the effects of aerosol loading on its measurement results at a traffic site. Aerosol Air Qual. Res. 2013, 13, 1853–1863. [Google Scholar] [CrossRef] [Green Version]
  26. Kirchstetter, T.W.; Novakov, T. Controlled generation of black carbon particles from a diffusion flame and applications in evaluating black carbon measurement methods. Atmos. Environ. 2007, 41, 1874–1888. [Google Scholar] [CrossRef]
  27. EPA, U.S. Exposure Factors Handbook; Final Report (EPA/600/R-09/052F, 2011); National Center for Environmental Assessment: Washington, DC, USA, 2011. Available online: http://www.epa.gov/ncea/efh (accessed on 30 November 2021).
  28. Phillips, L.; Johnson, M.; Deener, K.; Bonanni, C. EPA’s Exposure Assessment Toolbox (EPA-Expo-Box). J. Environ. Inform. 2015, 25, 81–84. [Google Scholar] [CrossRef]
  29. Li, B.; Lei, X.N.; Xiu, G.L.; Gao, C.Y.; Gao, S.; Qian, N.S. Personal exposure to black carbon during commuting in peak and off-peak hours in Shanghai. Sci. Total Environ. 2015, 524, 237–245. [Google Scholar] [CrossRef]
  30. Quang, T.N.; Hue, N.T.; Tran, L.K.; Phi, T.H.; Morawska, L.; Thai, P.K. Motorcyclists have much higher exposure to black carbon compared to other commuters in traffic of Hanoi, Vietnam. Atmos. Environ. 2021, 245, 118029. [Google Scholar] [CrossRef]
  31. Song, S.; Wu, Y.; Xu, J.; Ohara, T.; Hasegawa, S.; Li, J.; Yang, L.; Hao, J. Black carbon at a roadside site in Beijing: Temporal variations and relationships with carbon monoxide and particle number size distribution. Atmos. Environ. 2013, 77, 213–221. [Google Scholar] [CrossRef]
  32. Wang, X.; Westerdahl, D.; Wu, Y.; Pan, X.; Zhang, K.M. On-road emission factor distributions of individual diesel vehicles in and around Beijing, China. Atmos. Environ. 2011, 45, 503–513. [Google Scholar] [CrossRef]
  33. Adams, H.; Nieuwenhuijsen, M.J.; Colvile, R.; Older, M.; Kendall, M. Assessment of road users’ elemental carbon personal exposure levels, London, UK. Atmos. Environ. 2002, 36, 5335–5342. [Google Scholar] [CrossRef]
  34. Fromme, H.; Oddoy, A.; Piloty, M.; Krause, M.; Lahrz, T. Polycyclic aromatic hydrocarbons (PAH) and diesel engine emission (elemental carbon) inside a car and a subway train. Sci. Total Environ. 1998, 217, 165–173. [Google Scholar] [CrossRef]
  35. Onat, B.; Şahin, Ü.A.; Uzun, B.; Akın, Ö.; Özkaya, F.; Ayvaz, C. Determinants of exposure to ultrafine particulate matter, black carbon, and PM2. 5 in common travel modes in Istanbul. Atmos. Environ. 2019, 206, 258–270. [Google Scholar] [CrossRef]
  36. De Nazelle, A.; Bode, O.; Orjuela, J.P. Comparison of air pollution exposures in active vs. passive travel modes in European cities: A quantitative review. Environ. Int. 2017, 99, 151–160. [Google Scholar] [CrossRef] [PubMed]
  37. Pant, P.; Habib, G.; Marshall, J.D.; Peltier, R.E. PM2. 5 exposure in highly polluted cities: A case study from New Delhi, India. Environ. Res. 2017, 156, 167–174. [Google Scholar] [CrossRef]
  38. Apte, J.S.; Kirchstetter, T.W.; Reich, A.H.; Deshpande, S.J.; Kaushik, G.; Chel, A.; Marshalle, J.D.; Nazaroff, W.W. Concentrations of fine, ultrafine, and black carbon particles in auto-rickshaws in New Delhi, India. Atmos. Environ. 2011, 45, 4470–4480. [Google Scholar] [CrossRef]
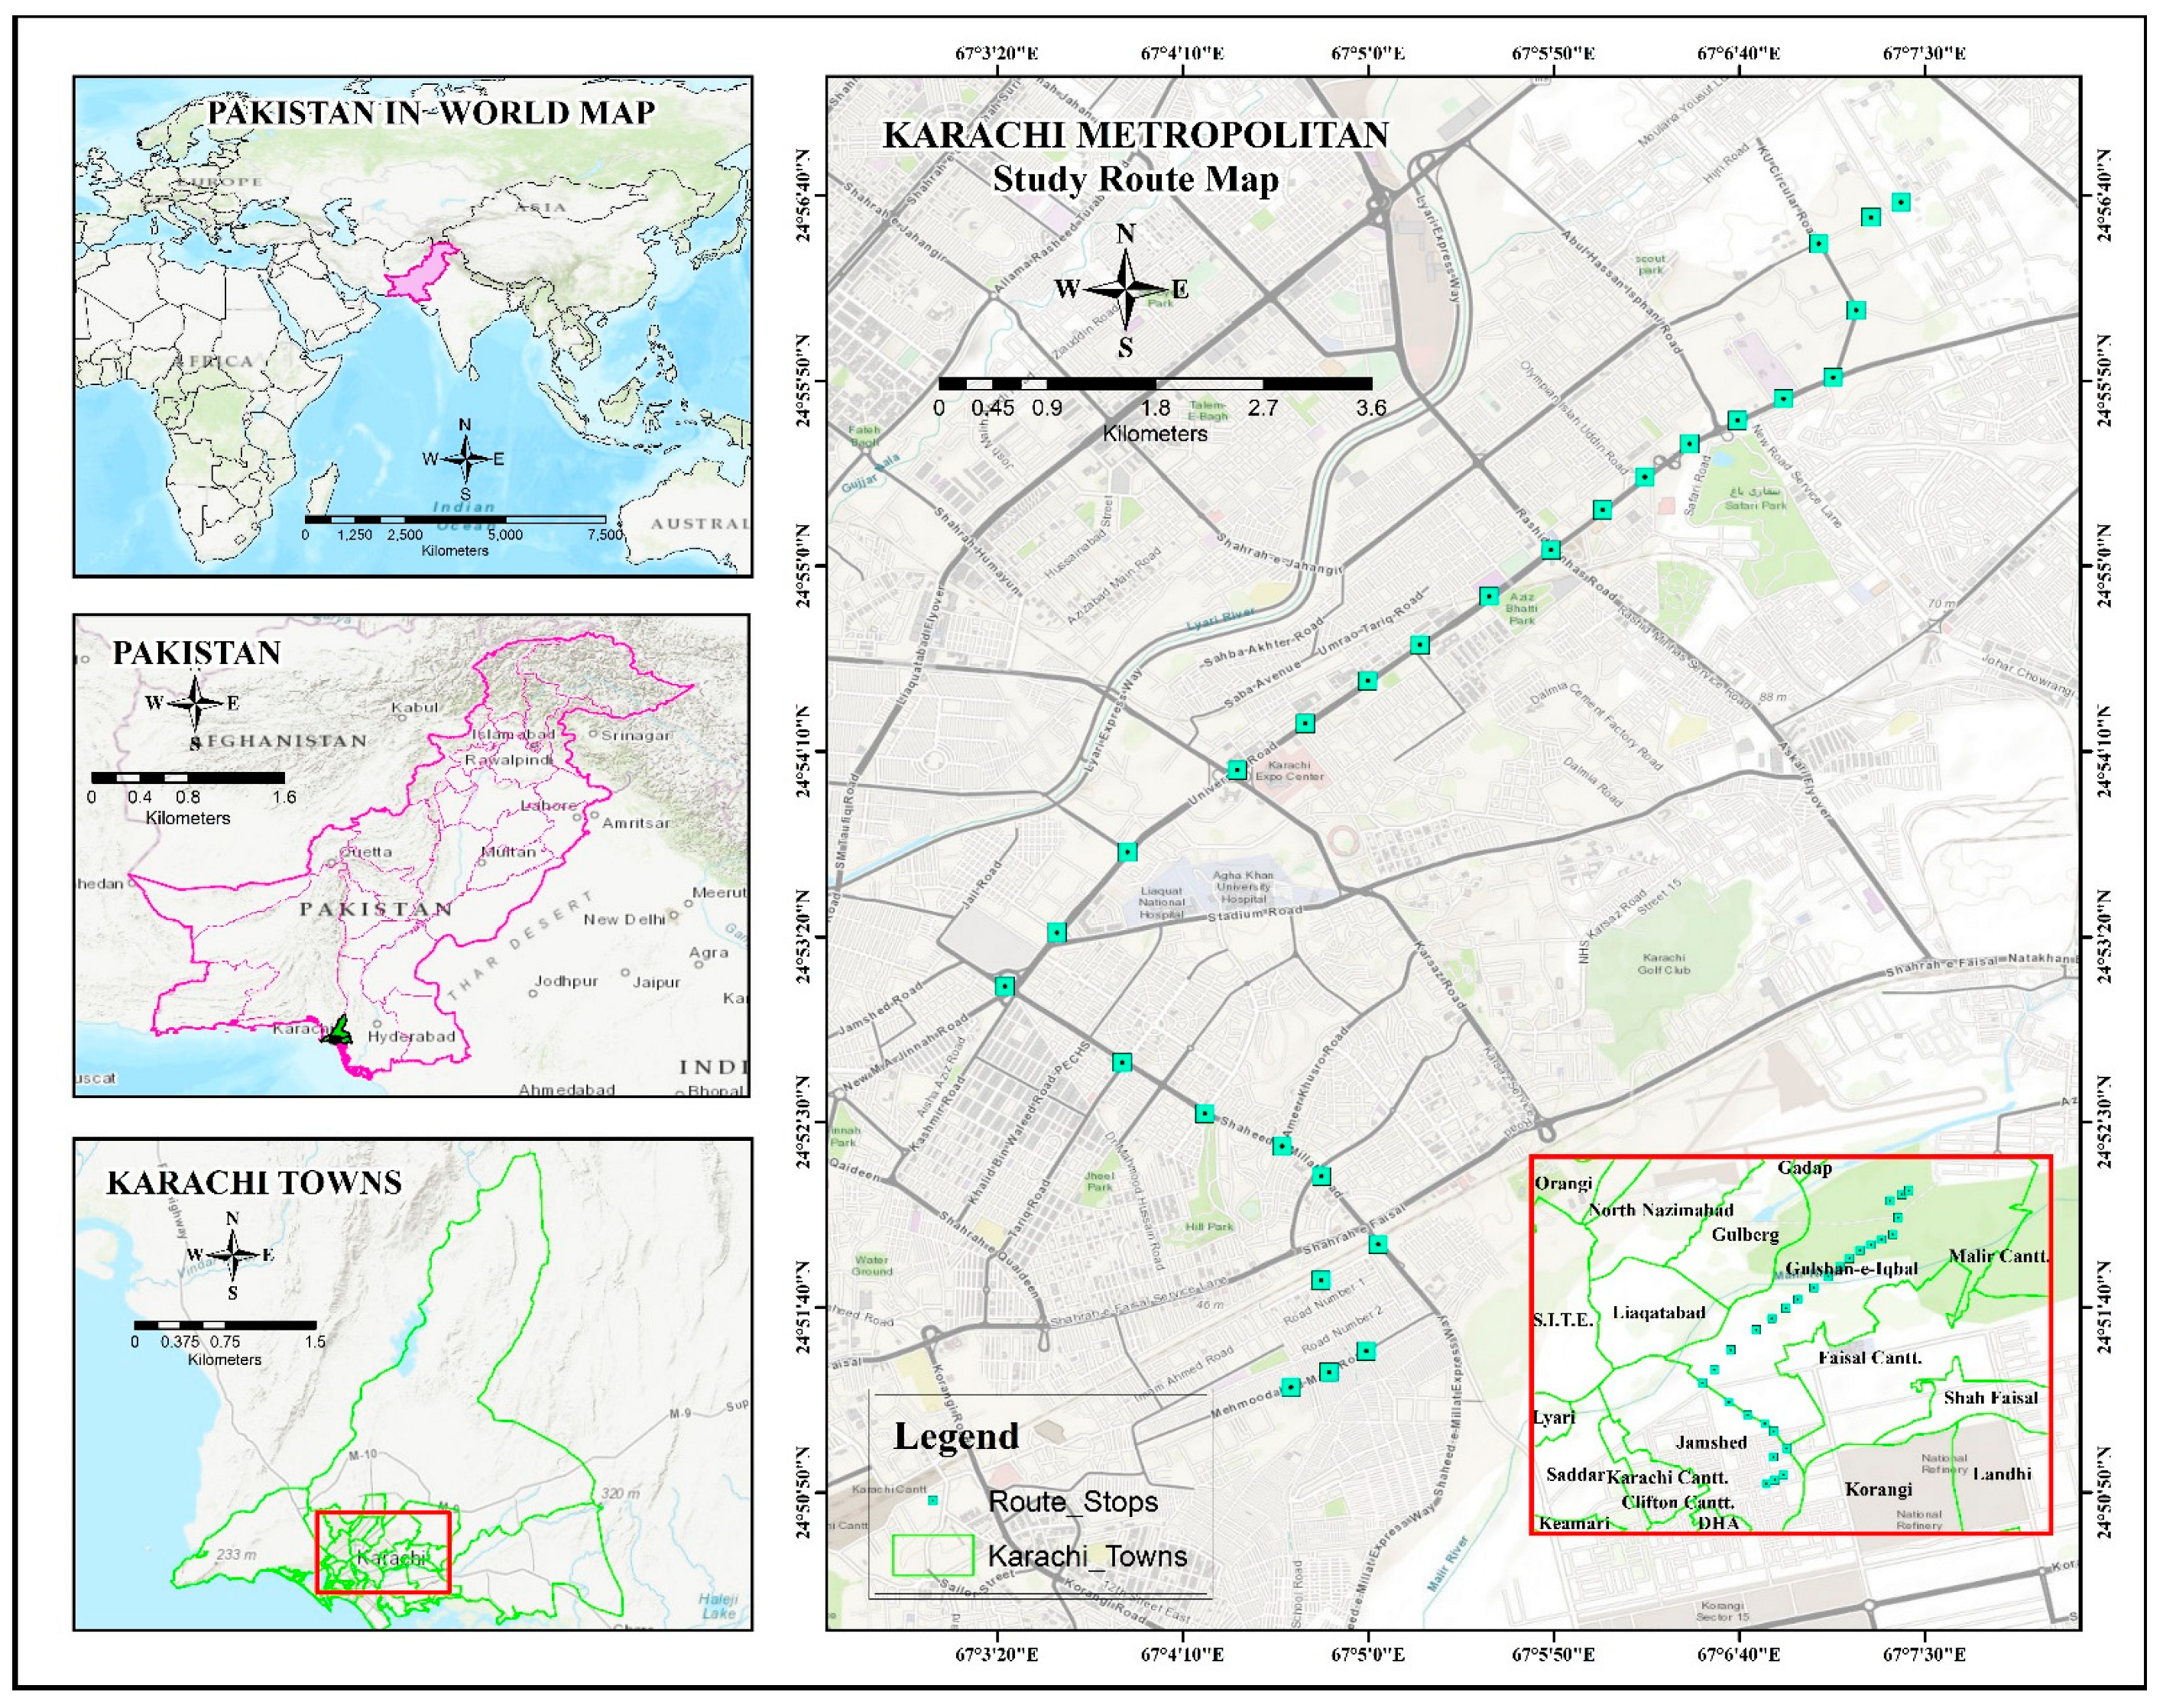
Figure 1. Locator map of the study area (Karachi city).
Atmosphere 13 01930 g001
Figure 2. Road map of the selected routes. Shaheed-e-Millat Road (P1–P10) and Main University Road (P11–P28).
Atmosphere 13 01930 g002
Figure 3. Average traffic flow per hour along ShaheedeMillat and University Road.
Atmosphere 13 01930 g003
Figure 4. BC exposure concentrations in (a) Peak and (b) Off-Peak hours for different modes of commute along the selected routes.
Atmosphere 13 01930 g004
Figure 5. Comparison of peak and off-peak BC exposure for each mode of commute. e.g., (a) car, (b) bus, (c) auto rickshaw, and (d) motorbike. More peak exposure concentrations for all modes of commute were observed during morning rush hours.
Atmosphere 13 01930 g005
Figure 6. (A). Spatial and temporal distribution of BC concentrations during traffic peak hours for different modes of commute, e.g., (a) car, (b) bus, (c) auto rickshaw, and (d) motorbike. (B). Spatial and temporal distribution of BC concentrations during off-peak hours for different modes of commute, e.g., (a) car, (b) bus, (c) auto rickshaw, and (d) motorbike.
Atmosphere 13 01930 g006aAtmosphere 13 01930 g006b
Figure 7. Comparison of BC Concentrations observed along roads of Karachi with those reported for various cities of the world during commuting. “*” represents studies conducted in the winter season [8,9,29,30,33,34,35,36,37,38].
Atmosphere 13 01930 g007
Figure 8. Tukey simultaneous confidence intervals (CIs) for OneWay ANOVA. Zero (represented as dotted line) indicates that the group means are equal. When a CI does not contain zero, the difference between that pair of groups is statistically significant.
Atmosphere 13 01930 g008
Table 1. Characteristics of the selected routes.
RouteLength (km)LanesLane Width (m)IntersectionsU-TurnsBuildingsAverage Vehicles Per Hour
Shaheed-e-Millat Road6.52–37–1152 flyoversSmall to high rise residential buildings on both sides of road.2430.5 1
University Road10.83–49–13442–5 story residential + commercial buildings along with food streets, schools, colleges, universities, and parks.3710.5
1 Vehicular data obtained from (Kabir et al., 2012) [22].
Table 2. Descriptive Statistics of personal exposure of black carbon (BC) and inhaled dose along the routes for different transportation modes during In-peak and off-peak hours.
Travel ModeTrips Per Week (N)Time (min)BC Exposure
Mean ± SD (µg/m3)
MedianRangeQ1Q3IQRInhaled Dose
Mean ± SD (µg/km)
In-Peak
Car43322.2 ± 4.3117.1579.278.6922.3813.700.57 ± 0.27
Bus47021.0 ± 2.1716.11834.65911.25719.2157.9581.13 ± 0.22
Auto rickshaw46026.0 ± 1.8921.7459.9117.9027.9710.071.20 ± 0.19
Motorbike43026.9 ± 3.0221.4938.9615.7831.5215.740.62 ± 0.12
Off-Peak
Car43011.4 ± 2.5812.8730.927.7716.859.090.27 ± 0.11
Bus46010.8 ± 5.469.13937.8157.71412.6664.9520.50 ± 0.08
Auto rickshaw45014.2 ± 1.5710.91730.7707.91216.7688.8560.54 ± 0.16
Motorbike42515.0 ± 2.669.4958.006.3814.878.490.29 ± 0.24
Table 3. Correlation matrix between BC levels and meteorological parameters (temperature, humidity, wind speed, and barometric pressure).
BC (μg/m3)Temperature (°F)Humidity (%)Wind Speed (km/h)Pressure (hPa)
Temperature (⁰F)0.108
0.023
Humidity (%)−0.2450.561
0.0000.000
Wind Speed (Km/h)0.079−0.840−0.897
0.0980.0000.000
Pressure (hPa)0.359−0.093−0.8120.521
0.0000.0520.0000.000
Publisher’s Note: MDPI stays neutral with regard to jurisdictional claims in published maps and institutional affiliations.