Abstract
To address the problems of cumbersome processes, large data, and error accumulation in the calculation of conventional GNSS precipitable water volume (PWV), the multi-factor PWV conversion models were established using the multiple linear regression fitting method. This paper analyzed the correlation between PWV and zenith tropospheric delay (ZTD), surface temperature (T), and atmospheric pressure (P) based on the data from 38 GNSS stations in the China region from 2017 to 2018. The research results showed that the mean deviation of the one-factor PWV conversion model based on the GNSS-ZTD was 12.16 mm, and its RMS was 14.30 mm. After adding surface temperature as an independent variable to form the two-factor PWV conversion model, the mean deviation and RMS decreased to 9.07 mm and 11.15 mm. The mean deviation of the two-factor PWV conversion model based on atmospheric pressure and GNSS-ZTD was 0.31 mm, and its RMS was 0.39 mm. The mean deviation of the three-factor PWV conversion model based on surface temperature, atmospheric pressure, and GNSS-ZTD was 0.33 mm, and its RMS was 0.38 mm. The accuracies of the two-factor and three-factor PWV conversion models were similar. The external precision assessment of PWV conversion models was verified by 12 GNSS stations unused for the modelling establishment. The mean deviation and RMS of the two multi-factor PWV conversion models were both less than 0.16 mm and 0.33 mm, which proves their widespread applicability in the China region.
1. Introduction
Rainstorms can easily cause stagnant water in cities and trigger flash floods in the mountains and may lead to derivative disasters such as traffic interruption, landslides, river flooding, and farmland inundation [1,2,3]. Flood disasters not only harm crops and the forestry, fruit, and fishery industries, but also destroy farmhouses and industrial and agricultural facilities, causing human and animal casualties, as well as serious economic losses [4,5]. Almost all the flood disasters in China’s history have been caused by heavy rainstorms [6,7,8,9].
Atmospheric water vapor is one of the significant driving forces of climate changes and atmospheric circulation [10,11,12]. The dynamical variation of atmospheric water vapor is a significant factor in forecasting heavy rainstorm disasters [13,14,15]. However, it is not practical to monitor atmospheric water vapor at a higher spatiotemporal resolution, predominantly due to the higher operational expenses of traditional sensors such as radiosondes, weather radar, and water vapor radiometers [16,17,18]. Contemporarily, the Global Navigation Satellite Systems (GNSS) have been one of the new technologies to retrieve the atmospheric precipitable water vapor (PWV) due to its lower cost, higher precision, higher spatiotemporal resolution, 24 h availability, and global coverage [17,19,20].
Studies have shown that GNSS-PWV has the potential to predict severe rainstorms [5,21,22,23] and to study the climate [24,25,26]. Previous studies [11,22,27,28,29] have shown that serious rainstorms occur in the descending trends of GNSS-PWV after PWV reaches its initial peak, which can be an obvious sign for rainstorms’ forecasting. Lasota et al. [30] used both radio occultation (RO) and ground-based GNSS observations to study the severe hailstorms that occurred in Bulgaria in 2014 and 2019, and the WRF Model and the ERA5 dataset were used to reproduce the temperature profiles for both hailstorms. Guerova et al. [31,32] used statistical regression analysis, real-time GNSS tropospheric products, and instability indices to predict hail and thunderstorms in Bulgaria.
GNSS-PWV can also be used as an important enhancement factor for numerical weather forecasting models [33,34,35,36]. Zhao et al. [37] established a precipitation forecast model with the time change trend and predicted the rainfall events in the next 2–6 h, with a correct rate of 80% and a false alarm rate of 60–70%. He et al. [38] analyzed the six typhoon events that occurred in Hong Kong in 2017, and precise point positioning (PPP) was used to analyze the PWV inversion accuracy, which provided a strong reference for the water vapor characteristics of typhoon forecasting. Liu et al. [39] used a variety of meteorological elements (temperature, air pressure, relative humidity), time-related parameters (annual cumulative day, daily cumulative hour, time integral), and PWV to establish a forecasting model by a three-hidden-layer neural network. More than 95% of rainfall events could be predicted, and the false alarm rate was only about 20%, which is nearly 10% lower than the existing short-term rainfall prediction methods, while the false alarm rate was similar. Benevides et al. [40] suggested that the reliability and precision of weather forecasts could be improved after analyzing the 3D distribution variations of PWV. Therefore, the rapid acquisition of GNSS-PWV has important practical significance for improving the efficiency and accuracy of real-time heavy rainstorm forecasting [40,41,42,43,44,45].
The traditional GNSS-PWV calculation method first calculates the zenith total delay (ZTD), using the GNSS observation based on the double-difference method or PPP technology, and then, the zenith wet delay (ZWD) can be obtained by subtracting the zenith hydrostatic delay (ZHD) from the ZTD. The ZHD is the main delay for the GNSS signals transmitted in the neutral atmosphere, accounting for more than 90% of the ZTD [46,47]. This means that the precision of the ZHD calculated by the Saastamoinen model will indirectly affect the precision of the ZWD. GNSS-PWV can be obtained from the ZWD multiplied by the water vapor conversion factor (K) [10]. The weighted mean temperature () is one of the important parameters to calculate for the conversion from the ZWD to PWV.
The calculation process of K, , ZHD, ZWD, and PWV is cumbersome. It also involves a large number of meteorological elements such as the surface temperature (T) and air pressure (P), which easily results in the error accumulation problem. Yi et al. [48] used regression analysis to establish seasonal and annual PWV conversion models and found that the RMS of the PWV conversion models in each season was less than 1.5 mm, while the maximum error did not exceed 3.3 mm. Therefore, PWV can be directly estimated using the seasonal linear regression equation based on the tropospheric delay for short-term weather forecasting if some stations lack meteorological data in a certain period of time. Fan et al. [49] established a PWV direct conversion model based on seven GNSS stations in the Yangtze River Delta region from 2017 to 2018. The results showed that the RMS of the three-factor PWV model based on GNSS-ZTD, temperature, and pressure was 0.47 mm [50]. Huang et al. [51] used the ERA5 reanalysis data from 2012 to 2017 to construct a vertical-correction PWV model in Mainland China considering the time-varying decreasing factor according to the national and geographical division methods. The model had better interpolation accuracy and stability, especially in southern and western China. Compared with the conventional GNSS-PWV method, the abovementioned PWV conversion methods can not only improve the computing efficiency, but also reduce the error accumulation, but most of the above research aimed at a single station or small-scale continuously operating reference station (CORS) networks.
This paper used the data of 38 GNSS stations selected nationwide in 2017 to analyze the changes and their correlation between PWV and GNSS-ZTD, temperature, and pressure and establish several applicable PWV conversion models nationally. The PWV of twelve GNSS stations that did not participate in the modeling was used as the true value to test the external accuracy and reliability of the PWV conversion models.
The outline of this paper is as follows. The data sources of the GNSS products, the relationships and collinearity of PWV, and other meteorological elements are analyzed and shown in the second section. The establishment of the one-factor, two-factor, and three-factor PWV conversion models and their precisions is shown in the third section. The conclusions are given in the fourth section.
2. Data Sources and Methods
2.1. Data Sources
The research data in this paper came from the Jiangsu Meteorological Bureau and the China Earthquake Administration GNSS data product service platform [52] (http://www.cgps.ac.cn (accessed on 15 August 2021)), and the main contents include GNSS-PWV, GNSS-ZTD, and its gradient, surface atmospheric pressure and temperature, etc. The time span was from 1 January 2017 0:00 to 31 December 2018 23:00, and the time resolution was 1 h. The accuracy of GNSS-PWV was within 1 and 3 mm. We selected 50 GNSS stations that evenly cover most of the China region, of which 38 GNSS stations were used for PWV modeling and 12 GNSS stations were used for external conformity testing. Their spatial location distributions are shown in Figure 1. The selection of 38 GNSS stations for modeling and 12 GNSS stations was for the verification according to the three-step topography of high, medium, and low altitudes and five climate zones, and they are evenly distributed in China region. At least one GNSS station was selected for modeling in each province. Their precise locations were shown in Table 1 and Table 2.
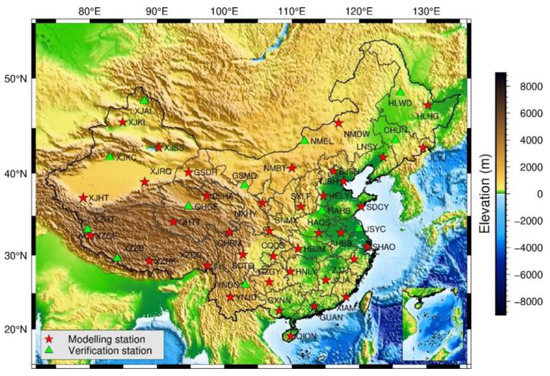
Figure 1.
Spatial distribution map of the 50 selected GNSS stations in the China region.

Table 1.
Locations of 38 GNSS stations for PWV modelling in the China region.
Table 2.
Locations of 12 selected GNSS stations for verification in the China region.
The GNSS product of the China Earthquake Administration uses the Saastamoinen model to calculate the ZHD based on the observed surface meteorological elements at the GNSS stations. Its specific expression is as follows [10].
The ZWD can be obtained by subtracting the ZHD from the ZTD.
According to the empirical equation, PWV can be obtained by multiplying the ZWD by the conversion factor (K):
In the formula, is the density of liquid water; and are the constants of atmospheric refraction, and their empirical values are 22.13 2.20 (K/hPa) and 3.739 0.012 (K/hPa); is the gas constant of water vapor, = 461.495 (J); is the weighted mean temperature. The above GNSS-PWV calculation method is one of the most commonly used and reliable methods in GNSS meteorology [52]. However, this traditional method requires a huge amount of calculation, which may take much time. In this paper, the calculation efficiency could be improved by establishing direct PWV conversion models based on the meteorological elements and GNSS-ZTD.
2.2. Correlation and Collinearity Analysis
Since the ZHD accounts for about 80–90% of the ZTD, the ZWD accounts for a small proportion of the ZTD. The pressure is the main influencing factor of the ZHD. According to Formula (2), the main influencing factor of K is , affected by the surface temperature. Therefore, the main influencing factors that may cause GNSS-PWV calculation errors are GNSS-ZTD, surface temperature, and pressure [53]. However, the ZWD accounts for a small proportion of the ZTD, so there may be a limited impact of temperature on the accuracy of PWV. This paper firstly analyzed the correlation level between PWV and GNSS-ZTD, temperature, and pressure, which were selected to establish the PWV conversion models according to the correlation strength.
The Pearson correlation coefficient (R) can be used to describe the level of linear correlation between two variables. The larger the absolute value of R, the stronger the correlation level. This means an extremely strong correlation if the R is between 0.8 and 1.0. It is a strong correlation if the R is between 0.6 and 0.8. If the R is between 0.4 and 0.6, this means a moderate correlation. It is a weak correlation when R is between 0.2 and 0.4. There is no correlation when R is between 0.0 and 0.2 [54].
It can be seen from Figure 2 that the correlation coefficient between PWV and GNSS-ZTD is 0.99, which means their correlation is extremely strong, indicating that GNSS-ZTD has the greatest impact on PWV. The correlation coefficient between PWV and temperature is 0.80, showing a strong correlation. The correlation coefficient between PWV and pressure is −0.55, showing a moderate negative correlation.
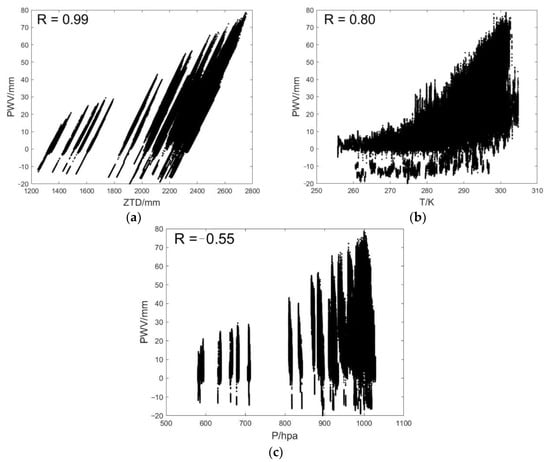
Figure 2.
Correlation analysis between PWV and GNSS-ZTD (a); temperature (b); pressure (c).
In summary, the linear correlation between PWV and GNSS-ZTD is the strongest, and a one-factor PWV conversion model based on GNSS-ZTD can be established. Temperature and pressure also have a greater impact on PWV, and they can be used to establish a three-factor PWV conversion model based on GNSS-ZTD, temperature, and pressure. Considering that pressure and temperature have different influences on PWV, two two-factor PWV conversion models based on GNSS-ZTD and pressure (or temperature) were established, respectively.
Table 3 is a statistics table of the correlations, from which we can see the correlation coefficient between independent variables. If there is a high level of collinearity between two independent variables, the linear regression model based on these variables will be unstable. It is difficult to distinguish the influence of each independent variable on the model results. Therefore, collinearity analysis is necessary for each independent variable.
Table 3.
The correlation of dependent and independent variables and their collinearity.
The variance inflation factor (VIF) was used to analyze the collinearity between independent variables in this paper, its specific expression is as follows.
where R is the correlation coefficient between an independent variable and other variables. It is generally believed that there is no multicollinearity when 0 < VIF < 10; there is stronger multicollinearity when 10 ≤ VIF < 100; there is the strongest multicollinearity when VIF ≥ 100.
It can be seen in Table 3 that the square of the product of the collinearity coefficient of GNSS-ZTD and pressure is 0.30 (), so . Similarly, , ; , and . It is clear that all the VIF are less than 10, so there is no collinearity between any two independent variables.
2.3. Methods
The selected 38 GNSS stations evenly cover the China region, and their GNSS meteorological products in 2017 were used to establish several multiple linear regression models between PWV and other meteorological elements. Taking GNSS-ZTD, pressure, and temperature as the independent variables, PWV as the dependent variable for the multivariate linear model is as follows.
where y is the dependent variable; , ,…, are the independent variables; is the constant term; , ,…, are the regression coefficients, these unknown parameters being irrelevant to the independent variables (, ,…,. ); is an unobservable random variable with zero mean and positive variance (), called the error term. The coefficients () of the independent variables can be obtained using the least-squares method.
At the same time, in order to verify the accuracy of the established PWV conversion models, the GNSS-ZTD, temperature, and pressure of each GNSS station in 2018 were substituted into the models to calculate the predicted PWV value, which can be compared with GNSS-PWV (as the true value) to verify the prediction accuracy and reliability of the established PWV conversion models.
Considering the vast territory, undulating terrain, and complex meteorological conditions in the China region, this paper selected 12 GNSS stations unused for modeling to further verify the accuracy of the external coincidence prediction accuracy and reliability of the established PWV conversion models.
3. Results and Discussions
3.1. PWV Conversion Models
- (1)
- Three-factor model
Taking GNSS-ZTD, temperature, and pressure as the independent variables and GNSS-PWV as the dependent variable, a three-factor linear regression model can be established as follows.
The GNSS-ZTD, temperature, pressure, and GNSS-PWV of the 38 GNSS stations in 2017 were all taken into the above formula, and the model coefficients can be estimated by the least-squares method. Finally, the three-factor PWV conversion model was obtained as follows.
- (2)
- Two-factor model
In the same way, the GNSS-PWV, GNSS-ZTD, and temperature of the 38 GNSS stations in 2017 were all put into Formula (5), and the two-factor PWV conversion model based on GNSS-ZTD and temperature can be obtained as follows.
If the GNSS-PWV, GNSS-ZTD, and pressure of the 38 GNSS stations in 2017 are all put into Formula (5), the two-factor PWV conversion model based on GNSS-ZTD and pressure can be obtained as follows.
- (3)
- One-factor model
In the same way, the GNSS-PWV and GNSS-ZTD of the 38 GNSS stations in 2017 were all taken into Formula (5), and the one-factor PWV conversion model based on GNSS-ZTD can be obtained as follows.
3.2. Internal Coincidence Accuracy
Due to space limitations, Figure 3a lists the time series of the predicted PWV of some GNSS stations during 2017–2018, in which GNSS-PWV can be used as the true value to compare with the PWV predicted by different PWV conversion models. It can be seen from Figure 3 that the one-factor PWV model based on the ZTD showed a small change, and its deviations from the GNSS-PWV series were the largest. The change trends of other PWV sequences were basically the same. Among them, the two-factor PWV based on the ZTD and pressure and the three-factor PWV based on the ZTD, pressure, and temperature were the closest to GNSS-PWV, showing obvious rising and falling trends and seasonal changes in a year. They are in line with the climatic characteristics of a hot and humid summer and a dry winter in China.
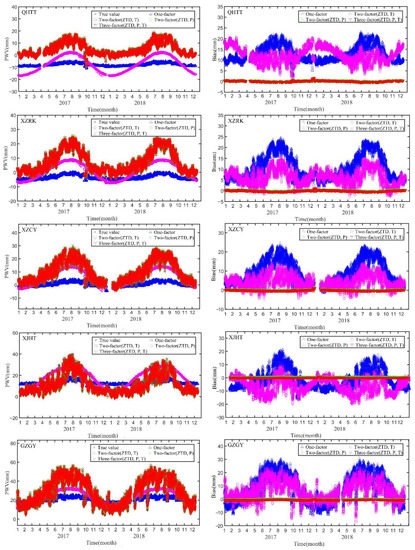
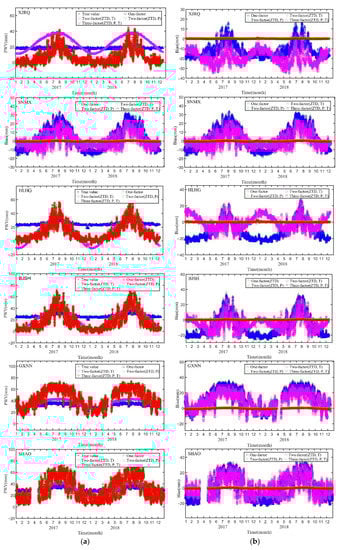
Figure 3.
Variation trends (a) and their deviations (b) of the predicted PWV during 2017–2018.
Figure 3b describes the deviations of each PWV conversion model from GNSS-PWV during 2017–2018. It can be seen from the figure that the deviations of the one-factor predicted PWV based on the ZTD were basically within 40 mm; the deviations of the two-factor predicted PWV based on the ZTD and temperature were mostly within 30 mm; the deviations of the two-factor predicted PWV based on the ZTD and pressure were basically within 1.0 mm. The deviations of the three-factor predicted PWV based on the ZTD, pressure, and temperature were within 1.0 mm as well. However, the three-factor PWV conversion model showed the highest accuracy among them. Moreover, the deviations of the two-factor and three-factor predicted PWV during 2018 were basically the same as those during 2017.
For some high-altitude (>3000 m) GNSS stations, the one-factor predicted PWV based on the ZTD was negative, which is obviously inconsistent with common sense (PWV should always be positive). Therefore, the one-factor PWV model cannot be used in a high-altitude region. The two-factor predicted PWV based on the ZTD and temperature also had a large deviation at high-altitude stations, the maximum PWV being close to 25 mm, and the predicted PWV in some periods was also negative, indicating the weak correlation between the PWV and temperature in high-altitude areas. It is clear that the one-factor and two-factor PWV models based on the ZTD and temperature are not suitable for high altitudes (>3000 m).
Table 4 summarizes the mean deviations and RMS of the predicted PWV of the four conversion models for the 38 GNSS stations during 2017–2018. It can be seen from the table that the RMS of the one-factor PWV conversion model based on the ZTD was 12.16 mm and 14.30 mm. After adding temperature as a new independent variable, the mean deviation of the two-factor PWV conversion model reduced to 9.07 mm, its RMS reduced to 11.15 mm, and the accuracy slightly improved. While adding pressure as a new independent variable, the mean deviation of the two-factor PWV conversion model based on GNSS-ZTD and pressure was 0.31 mm, and its RMS was 0.39 mm. While adding pressure and temperature as two independent variables, the mean deviation of the three-factor PWV conversion model was 0.33 mm, and its RMS was 0.38 mm.
Table 4.
Precision statistics of the one-, two-, and three-factor PWV conversion models (mm).
From Formulas (1–3) in Section 2.1, it can be seen that the ZHD accounted for about 80–90% of the ZTD, mainly calculated by the pressure; adding pressure into the two-factor PWV model can improve its accuracy. The conversion factor (K) is mainly calculated by the surface temperature and , where is also mainly calculated from the air temperature. The ZWD accounts for a small proportion of the ZTD, so the accuracy improvement by adding the temperature is limited. Therefore, the accuracy of two-factor PWV model based on the ZTD and pressure was significantly improved compared to that of the two-factor PWV model with temperature added.
It can be seen that atmospheric pressure is a key meteorological element that greatly improved the accuracy of the PWV conversion models. The RMS of the two-factor and three-factor PWV conversion models by adding pressure were lower than 0.40 mm, and their accuracies were sufficient to meet most atmospheric requirements.
3.3. External Coincidence Accuracy
It is known from Section 3.2 that the accuracies of the two-factor and the three-factor PWV conversion model by adding pressure were relatively high. Therefore, 12 stations that did not participate in the modeling and that are distributed at different altitudes were selected to verify the accuracy of the above two PWV conversion models in this section.
Figure 4a–l lists the deviations of the predicted PWV for the 12 GNSS stations during 2017–2018. Overall, the predicted PWV deviations of the two models were larger in summer and smaller in winter. Most of the predicted PWV deviations were between −0.5 and 1.0 mm.
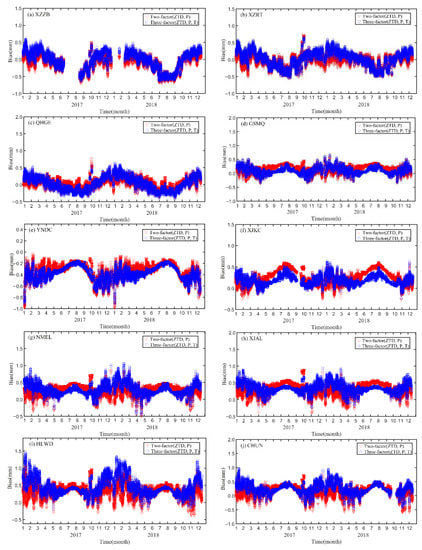
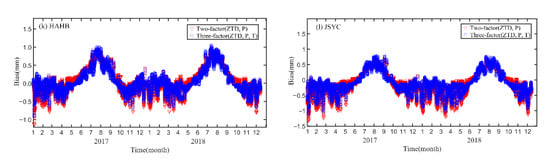
Figure 4.
The deviations of the predicted PWV of 12 GNSS verification stations (a–l) during 2017–2018.
It can be seen from Table 5 that the mean RMS of the two-factor PWV of the 12 GNSS stations during 2017–2018 was 0.31 mm, and the mean deviation was 0.16 mm. The mean RMS of the three-factor PWV was 0.33 mm, and the mean deviation was 0.16 mm. Therefore, the key meteorological elements affecting PWV were the ZTD and pressure. The two-factor and three-factor PWV conversion models based on GNSS-ZTD and pressure can obtain the predicted PWV with an accuracy better than 0.5 mm in this paper. However, the three-factor model will need one more meteorological parameter, which increases the difficulty of obtaining the temperature. In this case, the two-factor model is generally better and more practical than the three-factor PWV model.
Table 5.
The external precision of predicted PWV of verification stations during 2017–2018 (mm).
4. Conclusions
Based on the data of 38 GNSS stations in China from 2017 to 2018, this paper used multiple linear regression fitting and established one-factor, two-factor, and three-factor PWV conversion models suitable for the China region based on GNSS-ZTD, temperature, and pressure. Compared with the conventional GNSS-PWV acquisition method, the PWV conversion models not only improved the computing efficiency, but also reduced the error accumulation. The main research conclusions are as follows:
- (1)
- There are extremely strong and moderate linear correlations between GNSS-PWV and GNSS-ZTD, temperature, and pressure. The correlation coefficient between PWV and GNSS-ZTD is 0.99; the correlation coefficient between PWV and temperature is 0.80; the correlation coefficient between PWV and pressure is −0.55. There is no collinearity between any two independent variables.
- (2)
- The mean deviation of the one-factor predicted PWV based on GNSS-ZTD is 12.16 mm, and its RMS is 14.30 mm. The mean deviation of the two-factor predicted PWV after adding temperature reduced to 9.07 mm, and its RMS reduced to 11.15 mm. The mean deviation of the two-factor predicted PWV based on ZTD and pressure is 0.31 mm, and its RMS is 0.39 mm. The mean deviation of the three-factor predicted PWV based on GNSS-ZTD, pressure, and temperature is 0.33 mm, and its RMS is 0.38 mm.
- (3)
- In terms of external coincidence accuracy, the RMS of the two-factor and three-factor predicted PWV based on the ZTD and pressure is better than 0.33 mm, and the mean deviation is better than 0.16 mm. Obviously, these two new PWV conversion models are good enough to be widely used in the China region.
Moreover, the latitude and elevation both affect the accuracy of the ZHD and ZWD. Due to the smaller number of stations at high latitudes and elevations, these two factors were not considered in this paper. The latitude and elevation may improve the fitting effect and accuracy if they are added into the PWV conversion model in high-altitude areas.
Author Contributions
Conceptualization, L.L. and X.W.; methodology, L.L.; software, Y.W. and H.W.; validation, H.W. and Y.W.; formal analysis, X.W.; investigation, Y.W. and X.W.; resources, L.L.; data curation, Y.W. and H.W.; writing—original draft preparation, L.L. and Y.W.; writing—review and editing, L.L. and H.W.; visualization, H.W.; supervision, L.L.; project administration, L.L.; funding acquisition, L.L. All authors have read and agreed to the published version of the manuscript.
Funding
This research was supported in part by the Strategic Priority Research Program of the Chinese Academy of Sciences (CAS) under Grant XDA17010304, the China Natural Science Funds under Grant 41904033, the CAS Pioneer Hundred Talents Program, and the Natural Science Foundation of Hunan Province under Grant 2016JJ3061.
Institutional Review Board Statement
Not applicable.
Informed Consent Statement
Not applicable.
Data Availability Statement
Not applicable.
Acknowledgments
The authors would like to express their sincere gratitude to the University of Wyoming and the Jiangsu Institute of Meteorological Sciences for the provision of radiosonde and GNSS observations. We also thank the Reviewers for their constructive comments and suggestions, which resulted in a significant improvement in the quality of the paper.
Conflicts of Interest
The authors declare no conflict of interest.
References
- Ye, S.R.; Jiang, P.; Liu, Y.Y. A new numerical integration method for tomographic water vapor distribution in ground-based GPS network. Chin. J. Surv. Mapp. 2013, 42, 654–660. [Google Scholar]
- Suparta, W.; Rahman, R. Spatial interpolation of GPS PWV and meteorological variables over the west coast of Peninsular Malaysia during 2013 Kiang Valley Flash Flood. Atmos. Res. 2016, 168, 205–219. [Google Scholar] [CrossRef]
- Hoseini, M. On the Remote Sensing of the Atmosphere and Ocean Using Direct and Reflected GNSS Signals; Norwegian University of Science and Technology: Trondheim, Norway, 2022. [Google Scholar]
- Moore, A.W.; Small, I.J.; Gutman, S.I.; Bock, Y.; Dumas, J.L.; Fang, P.; Haase, J.S.; Jackson, M.E.; Laber, J.L. National Weather Service Forecasters Use GPS Precipitable Water Vapor for Enhanced Situational Awareness during the Southern California Summer Monsoon. Bull. Am. Meteorol. Soc. 2015, 96, 1867–1877. [Google Scholar] [CrossRef]
- Li, H.; Wang, X.; Wu, S.; Zhang, K.; Chen, X.; Qiu, C.; Zhang, S.; Zhang, J.; Xie, M.; Li, L. Development of an Improved Model for Prediction of Short-Term Heavy Precipitation Based on GNSS-Derived PWV. Remote Sens. 2020, 12, 4101. [Google Scholar] [CrossRef]
- Duan, W.L.; He, B.; Takara, K.; Luo, P.P.; Nover, D.; Yamashiki, Y.; Huang, W.R. Anomalous atmospheric events leading to Kyushu’s flash floods, July 11–14, 2012. Nat. Hazards 2014, 73, 1255–1267. [Google Scholar] [CrossRef]
- Li, H.; Choy, S.; Wang, X.; Zhang, K.; Jiang, C.; Li, L.; Liu, X.; Hu, A.; Wu, S.; Zhu, D. Estimation of diurnal-provided potential evapotranspiration using GNSS and meteorological products. Atmos. Res. 2022, 280, 106424. [Google Scholar] [CrossRef]
- Liu, Y.; Zhao, Q.; Yao, W.; Ma, X.; Yao, Y.; Liu, L. Short-term rainfall forecast model based on the improved BP-NN algorithm. Sci. Rep. 2019, 9, 19751. [Google Scholar] [CrossRef]
- Yao, Y.; Zhang, S.; Kong, J. Research Progress and Prospect of GNSS Space Environment Science. Acta Geod. Et Cartogr. Sin. 2017, 46, 1408–1420. [Google Scholar] [CrossRef]
- Bevis, M.; Businger, S.; Chiswell, S.; Herring, T.A.; Anthes, R.A.; Rocken, C.; Ware, R.H. GPS Meteorology: Mapping Zenith Wet Delays onto Precipitable Water. J. Appl. Meteorol. 1994, 33, 379–386. [Google Scholar] [CrossRef]
- Li, H.; Wang, X.; Choy, S.; Wu, S.; Jiang, C.; Zhang, J.; Qiu, C.; Li, L.; Zhang, K. A New Cumulative Anomaly-Based Model for the Detection of Heavy Precipitation Using GNSS-derived Tropospheric Products. IEEE Trans. Geosci. Remote Sens. 2021, 60, 4105718. [Google Scholar] [CrossRef]
- Zhao, Q.; Ma, X.; Yao, Y. Preliminary result of capturing the signature of heavy rainfall events using the 2-d-/4-d water vapour information derived from GNSS measurement in Hong Kong. Adv. Space Res. 2020, 66, 1537–1550. [Google Scholar] [CrossRef]
- Chung, E.-S.; Soden, B.; Sohn, B.; Shi, L. Upper-tropospheric moistening in response to anthropogenic warming. Proc. Natl. Acad. Sci. USA 2014, 111, 11636–11641. [Google Scholar] [CrossRef] [PubMed]
- He, Q.; Shen, Z.; Wan, M.; Li, L. Precipitable Water Vapor Converted from GNSS-ZTD and ERA5 Datasets for the Monitoring of Tropical Cyclones. IEEE Access 2020, 8, 87275–87290. [Google Scholar] [CrossRef]
- Zhao, Q.; Liu, Y.; Ma, X.; Yao, W.; Yao, Y.; Li, X. An Improved Rainfall Forecasting Model Based on GNSS Observations. IEEE Trans. Geosci. Remote Sens. 2020, 58, 4891–4900. [Google Scholar] [CrossRef]
- Bock, O.; Bosser, P.; Bourcy, T.; David, L.; Goutail, F.; Hoareau, C.; Keckhut, P.; Legain, D.; Pazmino, A.; Pelon, J. Accuracy assessment of water vapour measurements from in situ and remote sensing techniques during the DEMEVAP 2011 campaign at OHP. Atmos. Meas. Tech. 2013, 6, 2777–2802. [Google Scholar] [CrossRef]
- Guerova, G.; Jones, J.; Douša, J.; Dick, G.; de Haan, S.; Pottiaux, E.; Bock, O.; Pacione, R.; Elgered, G.; Vedel, H.; et al. Review of the state of the art and future prospects of the ground-based GNSS meteorology in Europe. Atmos. Meas. Tech. 2016, 9, 5385–5406. [Google Scholar] [CrossRef]
- Jones, J.; Guerova, G.; Douša, J.; Dick, G.; Haan, S.d.; Pottiaux, E.; Bock, O.; Pacione, R.; Malderen, R.v. Advanced GNSS Tropospheric Products for Monitoring Severe Weather Events and Climate; Springer International Publishing: Cham, Switzerland, 2020. [Google Scholar]
- Yeh, T.-K.; Hong, J.-S.; Wang, C.-S.; Chen, C.-H.; Chen, K.-H.; Fong, C.-T. Determining the precipitable water vapor with ground-based GPS and comparing its yearly variation to rainfall over Taiwan. Adv. Space Res. 2016, 57, 2496–2507. [Google Scholar] [CrossRef]
- Yu, K.; Rizos, C.; Burrage, D.; Dempster, A.; Zhang, K.; Markgraf, M. An Overview of GNSS Remote Sensing. EURASIP J. Adv. Signal Process. 2014, 2014, 134. [Google Scholar] [CrossRef]
- Iwabuchi, T.; Rocken, C.; Lukes, Z.; Mervart, L.; Johnson, J.; Kanzaki, M. PPP and Network True Real-time 30 sec Estimation of ZTD in Dense and Giant Regional GPS Network and the Application of ZTD for Nowcasting of Heavy Rainfall. In Proceedings of the ION GNSS 19th International Technical Meeting of the Satellite Division, Fort Worth, TX, USA, 26–29 September 2006; pp. 1902–1909. [Google Scholar]
- Li, L.; Kuang, C.-L.; Zhu, J.-J.; Chen, W.; Chen, Y.-Q.; Long, S.-C.; Li, H.-Y. Rainstorm nowcasting based on GPS real-time precise point positioning technology. Chin. J. Geophys. 2012, 55, 1129–1136. [Google Scholar]
- Łoś, M.; Smolak, K.; Guerova, G.; Rohm, W. GNSS-Based Machine Learning Storm Nowcasting. Remote Sens. 2020, 12, 2536. [Google Scholar] [CrossRef]
- Männel, B.; Dick, G.; Alshawaf, F.; Schuh, H. GNSS for Climate-Related Studies Sci. J. Civ. Eng. 2017, 6, 23–28. [Google Scholar]
- Kruczyk, M. Long Series of GNSS Integrated Precipitable Water as a Climate Change Indicator. Rep. Geod. Geoinf. 2015, 99, 1–18. [Google Scholar] [CrossRef]
- Bianchi, C.E.; Mendoza, L.P.O.; Fernández, L.I.; Natali, M.P.; Meza, A.M.; Moirano, J.F. Multi-year GNSS monitoring of atmospheric IWV over Central and South America for climate studies. Ann. Geophys. 2016, 34, 623–639. [Google Scholar] [CrossRef]
- Li, H.; Wang, X.; Choy, S.; Jiang, C.; Wu, S.; Zhang, J.; Qiu, C.; Zhou, K.; Li, L.; Fu, E.; et al. Detecting heavy rainfall using anomaly-based percentile thresholds of predictors derived from GNSS-PWV. Atmos. Res. 2022, 265, 105912. [Google Scholar] [CrossRef]
- Simeonov, T.; Sidorov, D.; Teferle, F.N.; Milev, G.; Guerova, G. Evaluation of IWV from the numerical weather prediction WRF model with PPP GNSS processing for Bulgaria. Atmos. Meas. Tech. Discuss. [preprint]. 2016. [Google Scholar] [CrossRef]
- Wang, B.; Zhao, L.; Bai, X. The Characteristics Investigation of Ground-Based GPS/PWV During the “7.21” Extreme Rainfall Event in Beijing. In China Satellite Navigation Conference (CSNC) 2015 Proceedings: Volume II; Lecture Notes in Electrical Engineering; Sun, J., Liu, J., Fan, S., Lu, X., Eds.; Springer: Berlin/Heidelberg, Germany, 2015; Volume 341, pp. 563–574. [Google Scholar]
- Lasota, E.; Slavchev, M.; Guerova, G.; Rohm, W.; Kapłon, J. Combined Space-and Ground-Based GNSS Monitoring of Two Severe Hailstorm Cases in Bulgaria. J. Atmos. Ocean. Technol. 2022, 39, 649–665. [Google Scholar] [CrossRef]
- Guerova, G.; Dimitrova, T.; Georgiev, S. Thunderstorm classification functions based on instability indices and GNSS IWV for the Sofia Plain. Remote Sens. 2019, 11, 2988. [Google Scholar] [CrossRef]
- Guerova, G.; Douša, J.; Dimitrova, T.; Stoycheva, A.; Václavovic, P.; Penov, N. GNSS storm nowcasting demonstrator for Bulgaria. Remote Sens. 2022, 14, 3746. [Google Scholar] [CrossRef]
- Chen, S.H.; Zhao, Z.; Haase, J.S.; Chen, A.D.; Vandenberghe, F. A study of the characteristics and assimilation of retrieved MODIS total precipitable water data in severe weather simulations. Mon. Weather Rev. 2008, 136, 3608–3628. [Google Scholar] [CrossRef]
- Gao, L.; Liu, Z.; Chen, D.; Yan, P.; Zhang, Y.; Hu, H.; Liang, H.; Liang, X. GPS-ZTD data assimilation and its impact on wintertime haze prediction over North China Plain using WRF 3DVAR and CMAQ modeling system. Env. Sci. Pollut. Res. Int. 2021, 28, 68523–68538. [Google Scholar] [CrossRef]
- Khaniani, A.S.; Azadi, M.; Zakeri, Z. Impact of Iranian permanent GPS network precipitable water estimates on numerical weather prediction. Earth Obs. Geomat. Eng. 2017, 1, 100–111. [Google Scholar] [CrossRef]
- Sharifi, M.A.; Azadi, M.; Khaniani, A.S. Numerical simulation of rainfall with assimilation of conventional and GPS observations over north of Iran. Ann. Geophys. 2016, 59, 10. [Google Scholar] [CrossRef]
- Zhao, Q.Z.; Yao, Y.B.; Yao, W.Q. GPS-based PWV for precipitation forecasting and its application to a typhoon event. J. Atmos. Sol.-Terr. Phys. 2018, 167, 124–133. [Google Scholar] [CrossRef]
- He, Q.; Zhang, K.; Wu, S.; Zhao, Q.; Wang, X.; Shen, Z.; Li, L.; Wan, M.; Liu, X. Real-Time GNSS-Derived PWV for Typhoon Characterizations: A Case Study for Super Typhoon Mangkhut in Hong Kong. Remote Sens. 2020, 12, 104. [Google Scholar] [CrossRef]
- Liu, Y.; Zhao, Q.Z.; Yao, W.Q. Rainfall prediction research based on GNSS PWV and meteorological data based on multi-hidden layer neural network. Bull. Surv. Mapp. 2019, 36–40. [Google Scholar]
- Benevides, P.; Catalao, J.; Miranda, P.M.A. On the inclusion of GPS precipitable water vapour in the nowcasting of rainfall. Nat. Hazards Earth Syst. Sci. 2015, 15, 2605–2616. [Google Scholar] [CrossRef]
- Jiang, P.; Ye, S.; Chen, D.; Liu, Y.; Xia, P. Retrieving Precipitable Water Vapor Data Using GPS Zenith Delays and Global Reanalysis Data in China. Remote Sens. 2016, 8, 389. [Google Scholar] [CrossRef]
- Manning, T.; Zhang, K.; Rohm, W.; Choy, S.; Hurter, F. Detecting Severe Weather using GPS Tomography: An Australian Case Study. J. Glob. Position. Syst. 2012, 11, 58–70. [Google Scholar] [CrossRef]
- Song, D.-S.; Grejner-Brzezinska, D.A. Remote sensing of atmospheric water vapor variation from GPS measurements during a severe weather event. Earth Planets Space 2009, 61, 1117–1125. [Google Scholar] [CrossRef]
- Wang, H.; He, J.; Wei, M.; Zhang, Z. Synthesis Analysis of One Severe Convection Precipitation Event in Jiangsu Using Ground-Based GPS Technology. Atmosphere 2015, 6, 908–927. [Google Scholar] [CrossRef]
- Zhang, K.; Manning, T.; SuqinWu; Rohm, W.; Silcock, D.; Choy, S. Capturing the Signature of Severe Weather Events in Australia Using GPS Measurements. IEEE J. Sel. Top. Appl. Earth Obs. Remote Sens. 2015, 8, 1839–1847. [Google Scholar] [CrossRef]
- Li, L.; Wu, S.; Zhang, K.; Wang, X.; Li, W.; Shen, Z.; Zhu, D.; He, Q.; Wan, M. A new zenith hydrostatic delay model for real-time retrievals of GNSS-PWV. Atmos. Meas. Tech. 2021, 14, 6379–6394. [Google Scholar] [CrossRef]
- Wang, X.; Zhang, K.; Wu, S.; Fan, S.; Cheng, Y. Water vapor-weighted mean temperature and its impact on the determination of precipitable water vapor and its linear trend. J. Geophys. Res. Atmos. 2016, 121, 833–852. [Google Scholar] [CrossRef]
- Yi, Z.H.; Wang, S.M.; Wang, Y.; Wei. GNSS Tropospheric Delay Estimation of Precipitation Research on the seasonal transition model of water volume. Geod. Geodyn. 2017, 37, 830–834. [Google Scholar]
- Fan, D.; Li, L.; Liu, Y.; Wei. Study on the direct conversion model of GNSS precipitable water in the Yangtze River Delta region. Geod. Geodyn. 2021, 12, 628–632. [Google Scholar]
- Liu, Y.; Li, L.; Wei, Y.; Wei. Research on multi-factor and seasonal precipitable precipitation model based on CORS station. Sci. Surv. Mapp. 2021, 46, 31–37. [Google Scholar]
- Huang, L.K.; Mo, Z.X.; Liu, L.; Xie, S. An empirical model for the vertical correction of precipitable water vapor considering the time-varying lapse rate for Mainland China. Acta Geod. Et Cartogr. Sin. 2021, 50, 1320–1330. [Google Scholar] [CrossRef]
- Yu, J.S.; Tan, K.; Zhang, C.H.; Zhao, B.; Wang, D.; Li, Q. Present-day crustal movement of the Chinese mainland based on Global Navigation Satellite System data from 1998 to 2018. Adv. Space Res. 2019, 63, 840–856. [Google Scholar] [CrossRef]
- Wang, Y.; Liu, Y.P.; Liu, L.T.; Wei. Research on the direct estimation of precipitable precipitable amount from the tropospheric delay of regional GPS network. Chin. J. Trop. Meteorol. 2007, 23, 510–514. [Google Scholar] [CrossRef]
- Wei, H.Y. Diagnosis and Treatment of Multicollinearity in Regression Analysis. Zhou Kou J. Teach. Coll. 2019, 36, 11–15. [Google Scholar]
Publisher’s Note: MDPI stays neutral with regard to jurisdictional claims in published maps and institutional affiliations. |
© 2022 by the authors. Licensee MDPI, Basel, Switzerland. This article is an open access article distributed under the terms and conditions of the Creative Commons Attribution (CC BY) license (https://creativecommons.org/licenses/by/4.0/).