Article

Evaluation of Occupational Exposure Risk for Employees Working in Dynamic Olfactometry: Focus On Non-Carcinogenic Effects Correlated with Exposure to Landfill Emissions

Department of Chemistry, Materials and Chemical Engineering “Giulio Natta”, Politecnico di Milano, Piazza Leonardo da Vinci 32, 20133 Milano, Italy
*
Author to whom correspondence should be addressed.
Atmosphere 2021, 12(10), 1325; https://doi.org/10.3390/atmos12101325
Submission received: 27 August 2021 / Revised: 28 September 2021 / Accepted: 4 October 2021 / Published: 11 October 2021
(This article belongs to the Special Issue Air Pollution, Air Quality and Human Health)

Abstract

:
This work aims to evaluate the non-carcinogenic health effects related to landfill odor emissions, therefore focusing on workers involved in dynamic olfactometry. Currently, the most common technique to quantify odor emissions is dynamic olfactometry, a sensorial analysis involving human assessors. During the analysis, assessors are directly exposed, at increasing concentrations, to odor samples, and thus to the hazardous pollutants contained therein. This entails the need to estimate the associated exposure risk to guarantee examiners’ safety. Therefore, this paper evaluates the exposure risk for olfactometric examiners to establish the minimum dilution level to be adopted during the analysis of landfills’ odorous samples to guarantee panelists’ safety. For this purpose, an extensive literature review regarding the pollutants emitted by landfill odor sources was conducted, comparing compounds’ chemical concentrations and threshold limit values (TLVs) to calculate the Hazard Index (HI) and thus establish a minimum dilution value. The data collected indicate that a non-negligible non-carcinogenic risk exists for all landfill emissions considered. However, from the data considered, the minimum dilution factor to be adopted is lower than the typical odor concentration observed for these sources. Therefore, the olfactometric analysis of landfill samples can be generally conducted in safe conditions.

1. Introduction

In recent decades, odor pollution related to waste treatment and disposal facilities has become an ever-growing challenge [1,2,3]. Landfills are typically affected by the problem of odorous emissions and thus are often subjected to olfactometric investigations [4]. Odorous emissions from landfills are mainly related to the decomposition of the organic matter in the disposed wastes [5,6,7,8]. These odor emissions often cause concerns related to their potential effects on human health and the environment [1,2,9,10]. For these reasons, odor emissions are currently regulated in multiple countries [11,12,13,14], and different specific techniques for odor control and monitoring have been developed.
Among the different methods available, dynamic olfactometry is presently the reference technique for quantifying odorous emissions [15,16]. Dynamic olfactometry is a sensorial analysis, which is standardized at the European level by the EN 13725:2003 [17]. This technique involves human examiners, called “panelists”, who are selected to judge odor samples according to the EN [17]. During the analysis, odor samples are presented to examiners at increasing concentration levels using a specific instrument, called “olfactometer”, which dilutes the samples with neutral air [18,19,20]. During the analysis, examiners are directly exposed to diluted odor samples at increasing concentrations, and thus to the chemical compounds contained therein, including potentially hazardous ones. Therefore, panelists can be exposed to an undefined occupational risk during the analysis. To carry out the olfactometric analysis while ensuring panelists’ safety, it is possible to adopt the approach of defining a minimum dilution factor of the odor sample not to be exceeded during the analysis. To establish this dilution value, it is necessary to evaluate the occupational risk for these workers by considering their exposure.
It should be highlighted that the reference standard, i.e., the EN 13725:2003, despite recommending minimizing risk during the analysis, does not define a standard procedure for assessing the exposure risk for the panelists. For these reasons, the current revision of the standard [21] aims to introduce a guidance on risk assessment for olfactometric examiners, prescribing the application of current occupational exposure limits. However, this approach may still be too generic: indeed, the absence of a reference source for the exposure limits to be used in the toxicological evaluations may drastically affect the results of the toxicological evaluation itself [22]. In general, to conduct a toxicological assessment, it is necessary to analyze the species potentially present in the medium considered. Regarding industrial odorous emissions, a large number of different molecules can be present in a single sample. Therefore, the selection of an appropriate analytical technique becomes crucial for the characterization of complex mixtures, such as odor samples. Currently, among the different analytical techniques that can be adopted, one of the most useful and diffuse is gas chromatography coupled with mass spectrometry (GC-MS) [15]. By applying this technique, the different unknown odorous molecules present in gaseous mixtures can be identified and—if appropriately calibrated—quantified. However, despite the technology’s potential, GC-MS requires highly trained staff and can be a time-consuming analysis. This is hardly applicable in practice previous to odor analysis: indeed, according to the EN 13725, after collection, odor samples have to be analyzed by dynamic olfactometry as soon as possible, and in any case within a maximum time interval of 30 h [21]. Therefore, the analysis of odor samples using GC-MS before conducting an olfactometric analysis, within the timeframe required by the standard, can sometimes be critical. To overcome this critical issue, a preliminary evaluation of the chemicals potentially present in odor samples analyzed by dynamic olfactometry can be conducted by researching pollutants inventories in the scientific and technical literature, as already proposed by two previous studies about panelists’ occupational risk [23,24]. Indeed, the information collected from the literature available can be applied for a preliminary evaluation of the panelists’ exposure risk prior to olfactometric analysis. This paper aims to adopt this approach, based on a deep literature search investigating landfill emission sources and the composition of the emitted fluxes, with the purpose of evaluating the non-carcinogenic risk for olfactometric examiners involved in the analysis of landfill odor samples. From the data retrieved from the scientific literature, the occupational exposure risk for examiners involved in the olfactometric analyses of gas samples collected at the different landfill odor sources was evaluated, with the purpose of suggesting a minimum dilution value to be adopted during the analyses to guarantee panelists’ safety.
To obtain the minimum dilution values from the data available in the literature, the toxicological assessment for the different sources was conducted using the maximum concentration value of each pollutant as found in the scientific and technical literature, to apply a conservative approach. Indeed, to evaluate the non-carcinogenic risk, the pollutants’ maximum concentrations observed in the literature were compared with the toxicological limits (Threshold Limit Values, TLVs) available, to compute the Hazard Quotient (HQ) for each chemical compound and then calculate the Hazard Index (HI) [25]. From the calculation of the HI for each of the odor sources identified, the minimum dilution value to be applied for the analysis of landfill odor samples could be evaluated.
The evaluation conducted in this study will help to categorize the toxic compounds of landfills along with their toxicity level to implement required cautions and improve the health of panelists that are directly exposed to the odor during olfactometric analyses.

2. Materials and Methods

2.1. Analyzed Literature

Landfills have always been considered environmentally impactful, due to their gaseous emissions, in terms of greenhouse gas, volatile organic compounds (VOCs), and odor [4,26,27,28]. Indeed, several scientific studies about gaseous pollutants emitted from landfills are available. Focusing on the aim of this study, to collect information about the nature of odorous emissions from landfills, a complete literature review was conducted, and two main categories of studies were evaluated. The first category includes articles reporting the chemical analysis of odorous emissions, in particular the identification and quantification of volatile organic compounds (VOCs) from landfills, discussing the different atmospheric emission sources [27,29,30,31,32,33,34,35,36,37,38,39,40,41,42,43,44,45,46]. The second category of papers considered includes studies focusing on health risk assessment of odor emissions from landfills [47,48,49]. The papers considered are focused on, but not limited to, municipal solid waste (MSW) landfills. Indeed, a few papers regarding mixed landfills for non-hazardous wastes or landfills for industrial wastes [35,44,45] have been included to make the database more robust. Because of the availability of literature studies on this topic, for the construction of the database, only scientific papers published from 1997 to 2019 were considered, whereas older articles were excluded from this research.

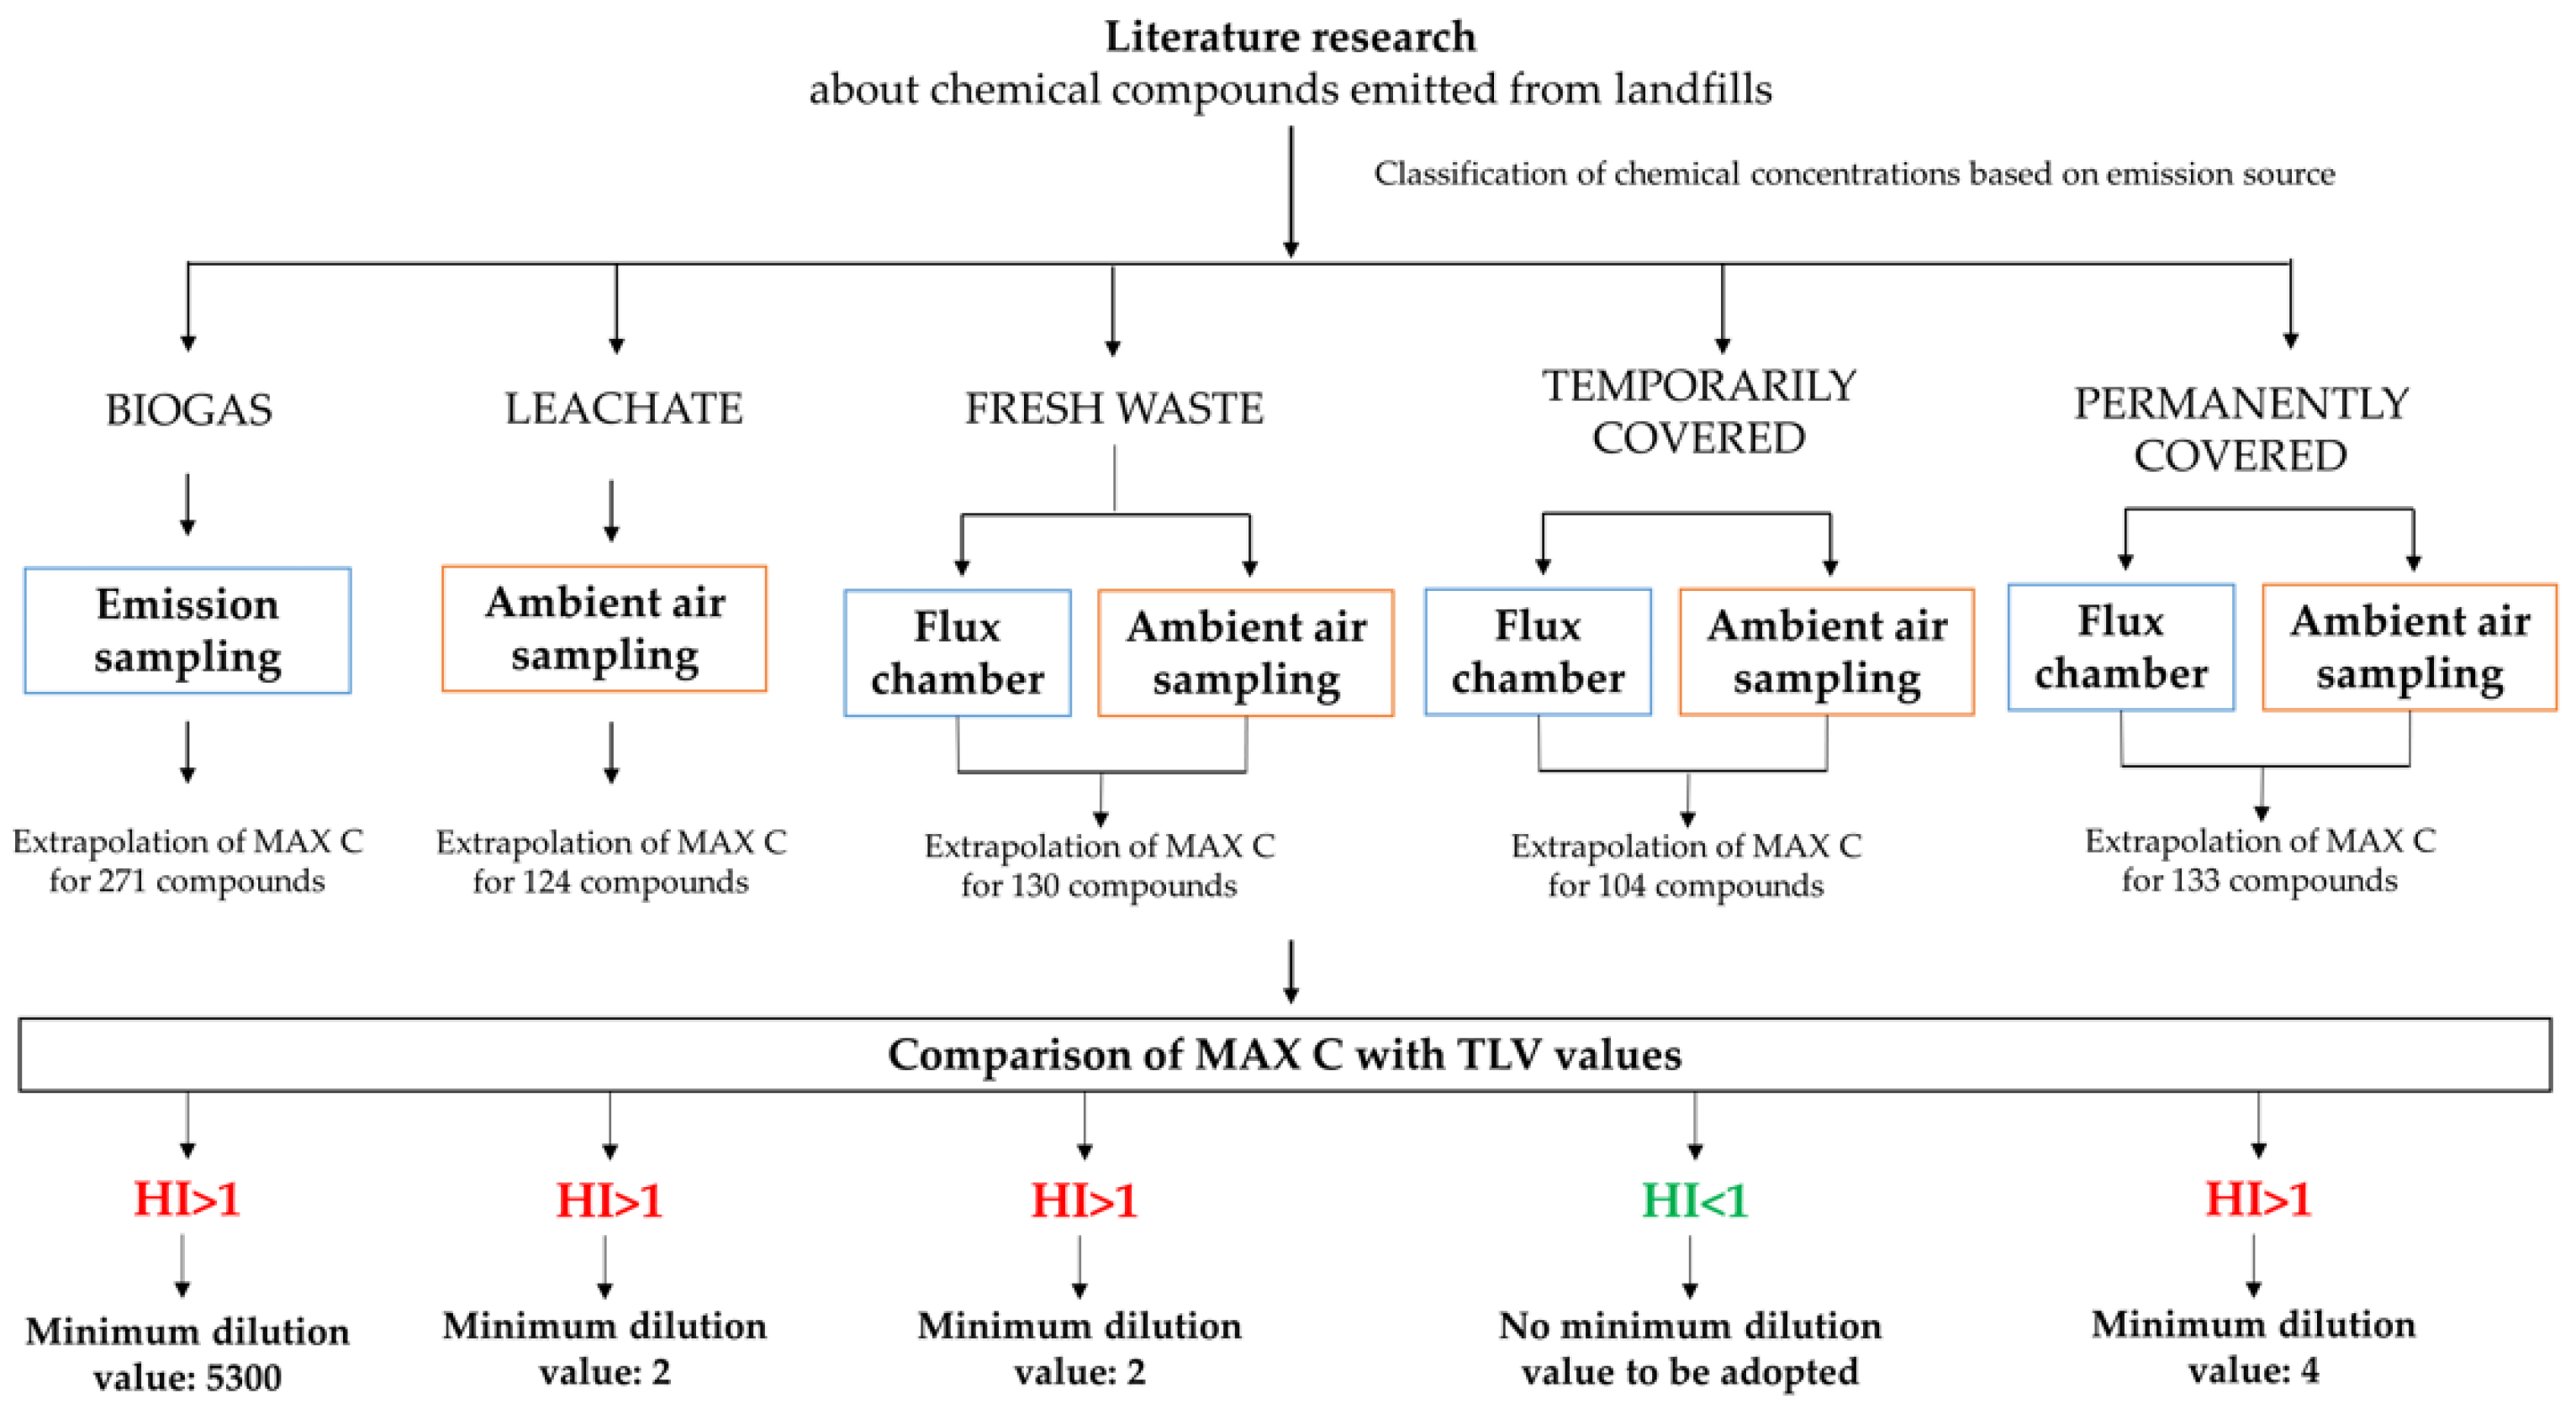
2.2. Approach Adopted for Literature Data Analysis and Classification

As previously described, gaseous emissions from landfills are well-characterized in the scientific literature. Since the data available are therefore very detailed, it was decided to organize the literature data according to the odor sources typically present in a landfill plant. The chemical information retrieved from the literature was thus classified into five different emission sources:
  • Biogas emissions
  • Landfill leachate emissions
  • Emissions related to the disposal of fresh waste (“fresh waste emissions”)
  • Emissions from the temporarily covered landfill surface
  • Emissions from the permanently covered landfill surface
In the literature considered, different sampling methods have been applied to collect samples from the above-listed sources. For biogas emissions, the samples have been collected directly at the extraction wells or at the inlet of the landfill gas (LFG) combustion facilities. For leachate emissions, the data available in the literature come from samples collected in ambient air, generally very close to the source [29,35]. Therefore, the data used in this study for leachate emissions do not refer to the gaseous emissions sampled directly at the source (i.e., directly over the liquid surface). Regarding the emissions from the landfill surface, two different methods are adopted in the selected literature. In some papers (e.g., [33,35,45]), samples were collected in ambient air over the landfill surface. In other cases (e.g., [32,36,38,44]), samples were collected employing special sampling hoods, called flux chambers. Flux chambers are commonly used to determine emission fluxes from landfill surfaces by introducing a known flux of neutral air inside the hood, and then collecting a sample at the hood outlet [50]. Despite being more representative of the emitted flux, the literature’s concentrations measured at flux chambers’ outlets are not necessarily higher compared to concentrations measured in ambient air. Indeed, from the literature data regarding landfill surfaces, it was not possible to highlight any trend proving one sampling method to produce more conservative concentration values than the other (Figure 1).
For this reason, to evaluate the exposure risk for panelists involved in olfactometric measurements, it was decided to adopt a conservative approach and thus consider the maximum concentration value as found in the literature for each compound, independently from the sampling method used for its determination.
A schematization of the global approach adopted for data analysis and for the evaluation of the minimum dilution values is reported at the end of the paper in Section 3.2 (Figure 2).

2.3. Pollutants Concentrations

The chemical concentrations reported in the literature were organized in a database according to the landfill emission sources where they were measured and the specific sampling method adopted. As previously described, the data reported in the literature are collected by different sampling procedures, and the concentrations can therefore be reported in terms either of concentration or flowrate. In addition, different concentration units are sometimes adopted in the papers. Therefore, the literature data, expressed either in terms of concentration or of flowrate, were all converted into ppm in order to facilitate comparison with the TLV values for the toxicological assessment. After that, in order to adopt a precautionary approach, the maximum concentration of each compound was extrapolated to conduct the toxicological assessment.

2.4. Threshold Limit Values (TLV)

Most of the chemical compounds emitted from landfills are characterized by non-negligible toxicological effects on human health and the environment [51]. For evaluating their non-carcinogenic effects on examiners involved in olfactometry, the Threshold Limit Value concentration (TLV), specific to occupational exposure, was used in the study. In this work, the TLV values for all compounds are derived from ACGIH (American Conference of Governmental Industrial Hygienists) [52], according to previous papers about occupational safety of olfactometric panellists [23,24]. Different values of toxicological threshold exist, depending on the duration of the exposure during working activities. Regarding the exposure of olfactometric examiners, they usually work for 1 or 2 h per session, and they are exposed to the odorous stimulus for a few seconds, according to the standard prescription [17]. However, in this study, we conservatively treat them as general workers, and to apply an even more cautious approach [24], the TLV-TWA (Threshold Limit Value—Time-Weighted Average) was adopted, where possible. TLV-TWA is defined as the concentration for a conventional 8-h workday and a 40-h workweek, to which a worker may be repeatedly exposed for an entire working lifetime without adverse effect [52]. If the TLV-TWA value was not available, the TLV-STEL (Threshold Limit Value—Short Term Exposure Limit) was considered in the study. TLV-STEL limits are defined as the concentration for a short exposure (maximum 15 min) [52].

2.5. Risk Evaluation

To evaluate the non-carcinogenic risk exposure of panelists involved in the olfactometric analysis of landfill odorous samples, the Hazard Quotient (HQ) for each compound was evaluated [53]. In general, the HQ value is the ratio between the exposure concentration (Cexp) and the reference concentration (RfC), as reported in Equation (1):
HQ = Cexp⁄RfC
RfC is, generally, the concentration that is likely to be continuously inhaled without an appreciable risk of deleterious effects during a lifetime [54]. In this study, considering the panelists’ exposure, the RfC adopted is the threshold limit value for work exposure (TLV), as suggested by the ACGIH. If the HQ is higher than 1, the exposure risk correlated with a single pollutant is not acceptable [54,55]. According to the constructed VOCs databases and their division into sources, in this study, it was possible to evaluate the exposure risk for olfactometric examiners correlated with the different odorous emissions by evaluating the Hazard Index (HI) for each of the sources considered. The HI for each source was calculated by summing up the HQs of each VOC observed for every source [56,57]. If the HI < 1, the chemical exposure under consideration is regarded as unlikely to lead to adverse health effects. On the other hand, if the HI > 1, adverse health effects are likely to occur [58,59], and a minimum dilution value must be set to protect the health of examiners involved in the analysis [22,23,24,60].

3. Results and Discussion

3.1. Chemical Characterization

From the literature research, different databases regarding the chemical compounds emitted by landfills have been constructed: one for each of the emission sources identified. These databases, including the list of compounds found in the literature, together with their TLV values and HQ, obtained according to Equation (1), are reported in the Supplementary Materials (Tables S1–S11). The tables report the compounds and their maximum concentrations for each source, divided according to the sampling method used (e.g., ambient air or flux chamber). Considering the objectives of this work, i.e., the assessment of the exposure risk related to olfactometric analyses, for the toxicological evaluation it was decided to consider the maximum observed concentration for each source in order to adopt a precautionary approach. Therefore, for landfill sources, the chemical concentrations obtained by different sampling methods were considered together, and the maximum concentration was extracted to assess the toxicological risk, independently from the sampling method adopted. From these data, the non-carcinogenic risk associated with landfill odorous samples was assessed by evaluating the HI for each odor source. This value was then used to establish the minimum dilution value to be adopted when the analysis was evaluated.

3.1.1. Biogas Emissions

Based on the mentioned literature, the compounds associated with biogas emission are 271 in total, and they are reported in the Supplementary Materials. Among those 271 compounds, Table 1 reports the first 20 compounds that most contribute to the overall HI, in decreasing order, with their maximum concentration, threshold limit value, and hazard quotient. Those 20 compounds together represent 99.994% of the overall Hazard Index (HI), calculated by summing the HQ values of all the pollutants observed in pure landfill gas.
From the data reported, it can be observed that non-negligible concentrations of potentially hazardous compounds are present in biogas emissions. Regarding the associated toxicological impact, among the compounds found in the literature relevant to biogas emissions, the most important contribution to HI is from hydrogen sulphide, with an HQ value equal to 5140. Although the concentration may depend on the decomposed material involved, hydrogen sulphide is one of the most common constituents of biogas [58,59]. Apart from hydrogen sulphide, the compounds that most contribute to the HI value relevant to biogas emissions are halogenated hydrocarbons, aromatic compounds, and organic sulphur compounds (sulphides and mercaptans).

3.1.2. Landfill Leachate

Based on the mentioned literature, the compounds associated with landfill leachate emissions are 124 in total, and they are reported in the Supplementary Materials. Among those 124 compounds, Table 2 reports the first 20 compounds that most contribute to the overall HI, in decreasing order, with their maximum concentration, threshold limit value, and hazard quotient. Those 20 compounds together represent 99.5% of the overall Hazard Index (HI), calculated by summing the HQ values of all the pollutants observed in landfill leachate emissions.
Among the most critical compounds (reported in Table 2) relevant to landfill leachate emissions, the most important contributor to the overall HI is hydrogen sulphide. Although the maximum concentration observed in the scientific literature is lower than for other compounds (e.g., ammonia, acetic acid or ethylbenzene), H2S has a lower toxicity threshold for non-carcinogenic effects and is, therefore, more dangerous.

3.1.3. Surface Emissions

As previously described, to evaluate the toxicological impact related to the gaseous emissions from landfill surfaces, the maximum concentration reported in the considered literature was used in the toxicological assessment, regardless of the sampling method adopted. This was done in order to adopt the most precautionary approach to assess occupational risk for examiners involved in dynamic olfactometry. In the tables below, the sampling method applied to obtain the observed maximum concentration value will be reported.

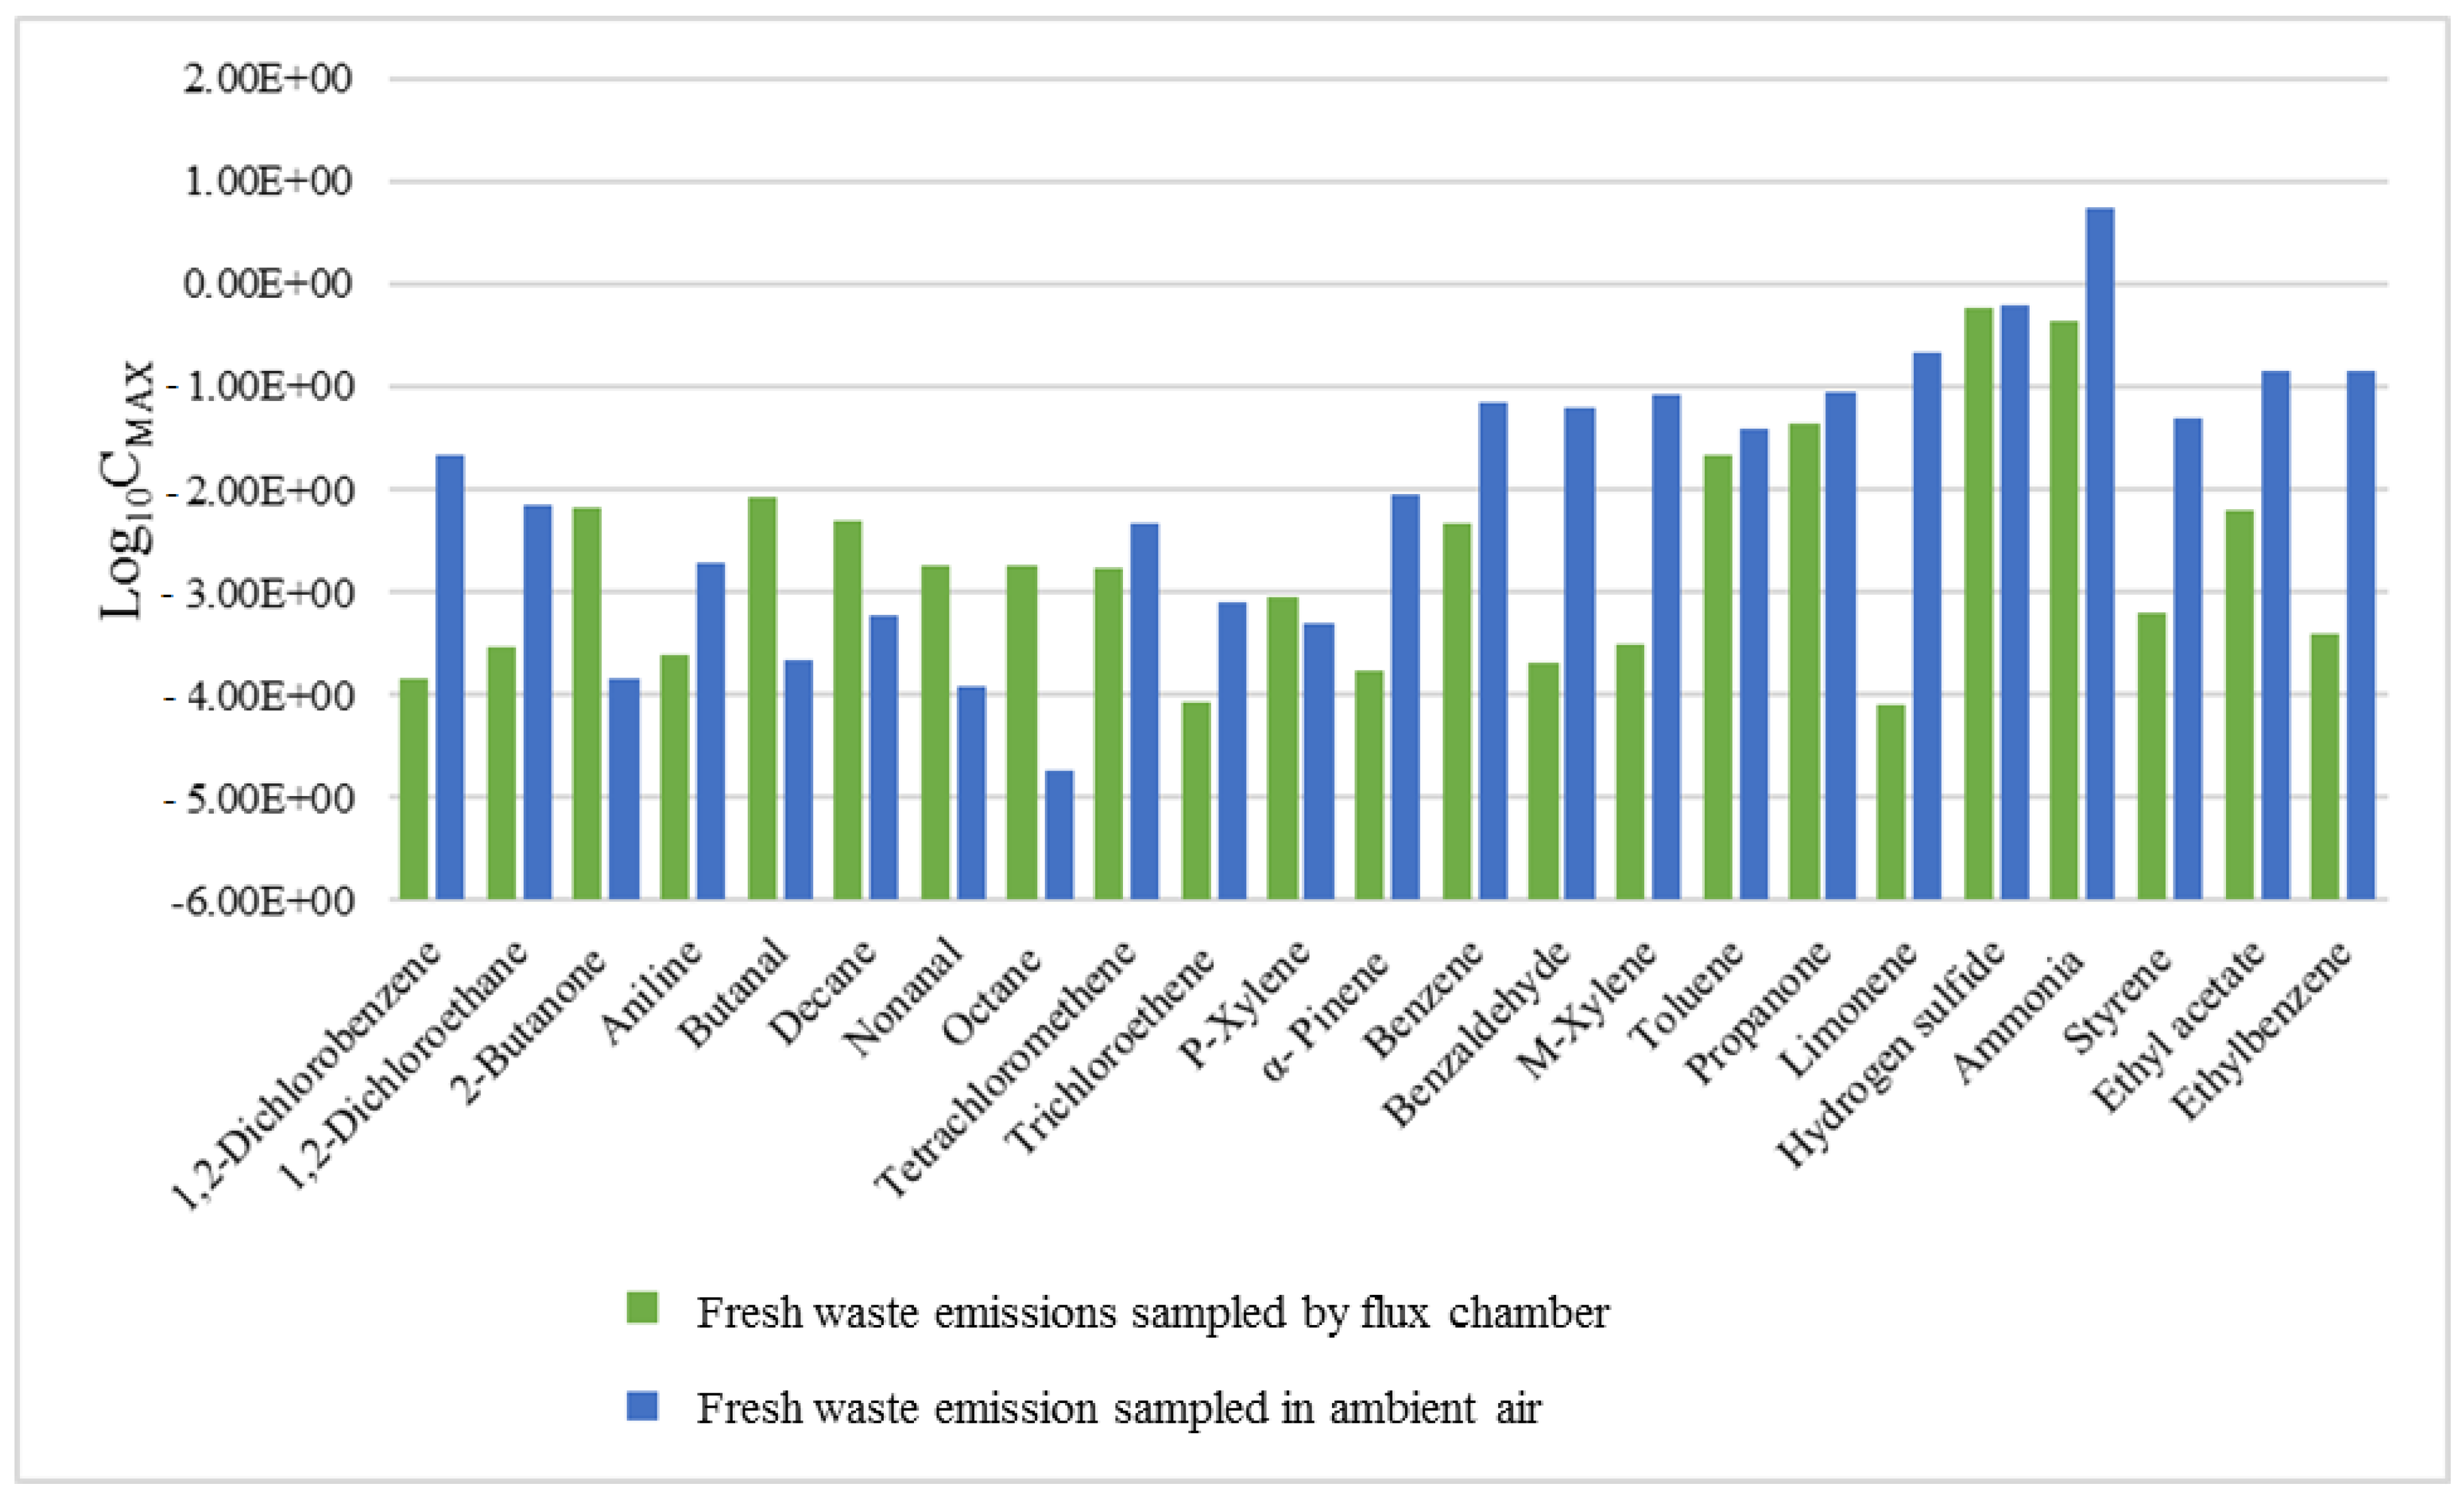
Fresh Waste Emissions

Based on the mentioned literature, the compounds associated with fresh waste landfill surface emissions are 130 in total, and they are reported, divided by the sampling method applied, in the Supplementary Materials. Among those 130 compounds, Table 3 reports the first 20 compounds that most contribute to the overall HI, in decreasing order, with their maximum concentration, threshold limit value, and hazard quotient. Those 20 compounds together represent over 90% of the overall Hazard Index (HI), calculated by summing the HQ values of all the pollutants observed in landfill fresh waste emissions.
By looking at Table 3, it is possible to observe that the highest contribution to the overall HI value for fresh waste emissions is again correlated with hydrogen sulphide. In addition to this pollutant, the compounds that most contribute to the overall HI value related to fresh waste emissions are aromatic compounds, aldehydes, sulphur compounds (sulphides and mercaptans), halogenated organic compounds, and amines.

Temporarily Covered Landfill Surface Emissions

The compounds found in the literature related to the emissions from temporarily covered landfill surfaces are 104 in total, and they are reported in the Supplementary Materials, according to the sampling method used. Among those 104 compounds, Table 4 reports the first 20 compounds that most contribute to the overall HI, in decreasing order, with their maximum concentration, threshold limit value, and hazard quotient. Those 20 compounds together represent over 99% of the overall Hazard Index (HI), calculated by summing the HQ values of all the pollutants observed in the emissions from temporarily covered landfill surfaces.
By looking at Table 4, it can be seen that the highest contribution to the overall HI value relevant to the emissions from temporarily covered landfill surfaces is correlated with hydrogen sulphide. As discussed below, H2S is the compound with the highest concentration, despite its toxicity threshold being higher than for other compounds among those observed. In addition to this pollutant, the compounds that most contribute to the overall HI value relevant to temporarily covered landfill surface emissions are aldehydes and other short-chain oxygenated organic compounds (alcohols, ketones, and acids), ammonia, aromatic compounds, halogenated organic compounds, and carbon disulphide.

Permanently Covered Landfill Surface Emissions

The compounds associated with the emissions from permanently covered landfill surfaces are 133 in total, and they are reported in the Supplementary Materials, according to the sampling method used. Among those 133 compounds, Table 5 reports the first 20 compounds that most contribute to the overall HI, in decreasing order, with their maximum concentration, threshold limit value, and hazard quotient. Those 20 compounds together represent over 99% of the overall Hazard Index (HI), calculated by summing the HQ values of all the pollutants observed in the emissions from permanently covered landfill surfaces.
By looking at Table 5, it can be seen that the highest contribution to the overall HI value relevant to emissions from permanently covered landfill surfaces is correlated with toluene. Indeed, based on the considered literature data, toluene is the compound observed in the emissions from permanently covered landfill surfaces that has the highest concentration. In addition to this pollutant, the compounds that most contribute to the overall HI value relevant to permanently covered landfill surface emissions are short-chain oxygenated organic compounds (alcohols, aldehydes, ketones, and acids), ammonia, aromatic compounds, halogenated organic compounds, and carbon disulphide.

3.2. HI Evaluation and Definition of Minimum Dilution Value

To establish a minimum dilution value to guarantee panelists’ safety during the conduction of olfactometric analysis of landfill emissions, the HI value was evaluated separately for each of the different odor sources considered. The HI values have been obtained by summing the HQ values for all the pollutants observed in the literature for the different odor sources. In Table 6, a comparison of the HI values for the different landfill emission sources are reported, from which the minimum dilution levels to be applied for ensuring panelists’ safety could be evaluated.
From the HI values reported in Table 6, it is evident that a non-negligible risk, relevant to non-carcinogenic effects, exists during the analysis of odorous samples from landfills. Indeed, the exposure risk for panelists is negligible only for samples collected over temporarily covered landfill surfaces (HI lower than 1), for which no further evaluations are necessary. For the other sources, the overall HI values obtained are higher than 1. Therefore, for these sources, the definition of a minimum dilution value is necessary to conduct olfactometric analyses in safe conditions. Looking at the most critical sources, biogas emissions present the highest value of HI, being equal to 5236. Therefore, to provide a safe condition for panelists exposed to the olfactometric analysis of biogas samples collected at the extraction wells or at the inlet of the LFG combustion facilities, the minimum dilution level not to be exceeded is 5237. However, it should be considered that the odor concentration of a biogas sample is typically much higher than the value of the HI observed in our study, i.e., typically ranging from 50,000–2,000,000 ouE/m3 [4,61,62,63]. Therefore, the olfactometric analysis can be conducted without risk for panelists, because the odor of the sample is perceived before potentially dangerous concentrations are reached. Regarding the emissions from landfill surfaces and leachate, the values of HI obtained are slightly higher than 1 (HI < 3). In particular, for leachate emissions, the HI calculated from literature data is equal to 1.51, and for the landfill surfaces—i.e fresh waste, temporarily and permanently covered surfaces—the HI values are, respectively, 1.78, 0.66, and 2.31. Therefore, the dilution value to be adopted for odor samples collected at these sources is between 0.66 and 2.31. However, it is important to note that the odor concentration of these sources is typically higher than the HI values observed from the literature data considered [4,10,59,62,64]. In addition, it is important to note that, in general, for commercial olfactometers, the minimum dilution factor is 4. Therefore, the odor concentrations emitted from landfill surface emission and landfill leachate do not need to be further diluted, since the safety condition is already met.
Focusing on landfill surfaces, from the results reported in Table 6, it is possible to notice that the HI obtained for permanently covered landfill surface is higher (2.31) than the equivalent HI values calculated for fresh waste (1.78) and temporarily covered landfill surface (0.66). This result is apparently in contrast with the effective emission potentials of these sources. However, this unexpected result can be explained by considering that the literature data used for the assessment of the HI relevant to permanently covered landfill surfaces are not the same as those used for the calculation of the HI relevant to the other sources, since they have been retrieved from different papers describing experimental measures carried out on different landfills located in different countries. This makes that these data are not directly comparable, although it should be highlighted that the resulting HI values for landfill surfaces fall within a narrow range. These differences do not affect the validity and the significance of the considerations here presented, which are based on the description of a more general and precautionary approach for the evaluation of occupational exposure risk to panelists involved in olfactometric analyses of landfill odor samples, which does not require extremely precise estimations of HI.
Figure 2 summarizes the entire data processing approach for the occupational risk assessment adopted and the results obtained in this study.
It is important to highlight that the HI values evaluated in this study are strictly influenced by the concentration data available in the scientific literature, which are influenced by several factors (i.e., different regulations, different waste collection and disposal procedures, different landfill management and operation procedures, and different climatic conditions). As a result, this paper aims to provide general guidance about how to evaluate the potential risk for panelists involved in the olfactometric analyses of landfill odor samples. In this context, the HI values presented shall be considered as rough indicators based on the concentration data reported in the literature. Therefore, the risk assessment for real samples collected at specific landfill sites remains essential to ensure the safety of examiners involved in dynamic olfactometry.

4. Conclusions

Landfills represent one of the most important industrial sources of odor pollution, and often, landfill emissions are collected to be analyzed by dynamic olfactometry. These emissions may contain pollutants potentially dangerous for human assessors involved in this analysis, and for this reason, it is important to investigate the exposure risk for these workers. Therefore, this paper investigates the chemical nature, in terms of identification and quantification of pollutants, of odorous emissions collected from landfills, and it evaluates the potential toxicological non-carcinogenic risk for panelists involved in olfactometric analyses. To assess this risk, deep literature research was conducted to collect detailed information about the chemical compounds emitted by landfill odor sources. From the databases obtained by means of this investigation, the maximum concentration values for each pollutant found in the emissions from each source were compared with the corresponding TLV (Threshold Limit Value) to compute the Hazard Quotient (HQ) of each compound and thus estimate the potential associated hazard risk. From these data, it was possible to extract the specific pollutants that may cause a non-negligible effect on human health for the different odor sources considered.
The main outcome of this study is the evaluation of the risk associated with panelists’ exposure to landfill odor samples, especially through the definition of the operational conditions to ensure a safe working environment for them.
This was obtained by summing up all HQ values of the compounds emitted from the different landfill sources, thus quantifying the relevant HI values.
Based on the evaluation of the HI, biogas turns out to be the landfill source entailing the highest risk, with a HI value equal to 5236. Therefore, to provide a safe condition for panelists exposed to biogas samples, those shall be diluted at least 5236 times to bring their HI below one. However, since the typical odor concentration of a biogas sample is above 50,000 ouE/m3, which is much higher than the value of HI observed in our study, the olfactometric analysis of biogas samples can be conducted without danger for panelists.
The other landfill odor sources considered are also characterized by a non-negligible risk correlated with non-carcinogenic effects. Indeed, the HI values associated to landfill surfaces and leachate emissions are between 0.65 and 2.31. However, due to the technical limitations of olfactometric analyses, such low dilution levels are never reached in practice.
Among the compounds observed in the literature, the one having the highest potential to produce a toxicological impact on panelists’ health is hydrogen sulphide. Indeed, it represents the molecule with the highest contribution to the overall HI calculated for the different landfill odor sources. However, this compound is characterized by a low odor threshold (OT = 0.00041 ppm), making it perceivable by panelists before concentrations dangerous to human health are reached.
Based on these considerations, a toxicological problem for non-carcinogenic effects for panelists’ exposure correlated with landfill odorous emissions does not appear. However, the evaluation conducted in this study aims to supply information about the most critical compounds present in landfill odor emissions in order to implement required cautions and improve the health of panelists that are directly exposed to the odor samples during olfactometric analyses.

Supplementary Materials

The following are available online at https://www.mdpi.com/article/10.3390/atmos12101325/s1: Table S1. Chemical compounds identified from biogas emissions reported in scientific literature. In the table, the maximum concentration observed, the TLV and HQ values, and the carcinogenic definition are reported, according to EU Regulation (EC) No 1272/2008. The HQ values reported are used to establish the HI value for the odor source considered. Table S2. Chemical compounds identified from leachate emissions reported in scientific literature. In the table, the maximum concentration observed, the TLV and HQ values, and the carcinogenic definition are reported, according to EU Regulation (EC) No 1272/2008. The HQ values reported are used to establish the HI value for the odor source considered. Table S3. Chemical compounds identified from fresh waste landfill surface emissions sampled with flux chamber reported in scientific literature. In the table, the maximum concentration observed and the TLV values are reported. Table S4. Chemical compounds identified from fresh waste landfill surface emissions sampled in ambient air reported in scientific literature. In the table, the maximum concentration observed and the TLV values are reported. Table S5. Chemical compounds identified from fresh waste landfill surface emissions reported in scientific literature, sampled with both methods. In the table, the maximum concentration observed, the associated sampling method, the TLV and HQ values, and the carcinogenic definition are reported, according to EU Regulation (EC) No 1272/2008. The HQ values reported are used to establish the HI value for the odor source considered. Table S6. Chemical compounds identified from temporarily covered landfill surface emissions sampled with flux chamber reported in scientific literature. In the table, the maximum concentration observed and the TLV values are reported. Table S7. Chemical compounds identified from temporarily covered landfill surface emissions sampled in ambient air reported in scientific literature. In the table, the maximum concentration observed and the TLV values are reported Table S8. Chemical compounds identified from temporarily covered landfill surface emissions reported in scientific literature, sampled with both methods. In the table, the maximum concentration observed, the associated sampling method, the TLV and HQ values, and the carcinogenic definition are reported, according to EU Regulation (EC) No 1272/2008. The HQ values reported are used to establish the HI value for the odor source considered. Table S9. Chemical compounds identified from permanently covered landfill surface emissions sampled with flux chamber reported in scientific literature. In the table, the maximum concentration observed and the TLV values are reported. Table S10. Chemical compounds identified from permanently covered landfill surface emissions sampled in ambient air reported in scientific literature. In the table, the maximum concentration observed and the TLV values are reported, Table S11. Chemical compounds identified from permanently covered landfill surface emissions reported in scientific literature, sampled with both methods. In the table, the maximum concentration observed, the associated sampling method, the TLV and HQ values, and the carcinogenic definition are reported, according to EU Regulation (EC) No 1272/2008. The HQ values reported are used to establish the HI value for the odor source considered.

Author Contributions

Conceptualization, L.C. and S.S.; Methodology, E.P. and L.C.; Formal analysis, E.P. and L.C.; Investigation, B.E.a. and E.P.; Data curation, E.P., L.C. and B.E.a.; Writing—original draft preparation, B.E.a. and E.P.; Writing—review and editing, L.C. and S.S.; Visualization, E.P. and L.C.; Supervision, L.C. and S.S.; Project administration, L.C. and S.S. All authors have read and agreed to the published version of the manuscript.

Funding

This research has received funding from European Union’s HORIZON 2020 research and innovation programme, grant number 789315.

Institutional Review Board Statement

Not applicable.

Informed Consent Statement

Not applicable.

Conflicts of Interest

The authors declare no conflict of interest.

References

  1. Capelli, L.; Sironi, S.; Del Rosso, R.; Magnano, E. Evaluation of landfill surface emissions. Chem. Eng. Trans. 2014, 40, 187–192. [Google Scholar] [CrossRef]
  2. Environmental Alliances Pty Ltd. (ENVALL). Odour Assessment of Proposed Landfill; Prepared for Vancouver Waste Services by ENVALL Environmental Alliances Pty Lt; August 2018. Available online: https://www.der.wa.gov.au/images/documents/our-work/licences-and-works-approvals/Applications/L7344_App_D_-_Odour_Assessment.pdf (accessed on 11 October 2021).
  3. Mustafa, M.F.; Liu, Y.; Duan, Z.; Guo, H.; Xu, S.; Wang, H.; Lu, W. Volatile compounds emission and health risk assessment during composting of organic fraction of municipal solid waste. J. Hazard. Mater. 2017, 327, 35–43. [Google Scholar] [CrossRef]
  4. Sironi, S.; Capelli, L.; Céntola, P.; Del Rosso, R.; Il Grande, M. Odour emission factors for assessment and prediction of Italian MSW landfills odour impact. Atmos. Environ. 2005, 39, 5387–5394. [Google Scholar] [CrossRef]
  5. Wu, C.; Liu, J.; Liu, S.; Li, W.; Yan, L.; Shu, M.; Zhao, P.; Zhou, P.; Cao, W. Assessment of the health risks and odor concentration of volatile compounds from a municipal solid waste landfill in China. Chemosphere 2018, 202, 1–8. [Google Scholar] [CrossRef] [PubMed]
  6. Mckendry, P.; Looney, J.H.; McKenzie, A. Odour Risk at Landfill Sites: Main Report Managing; MSE Ltd & Viridis, 2002. Available online: https://www.researchgate.net/publication/325103363_Managing_Odour_Risk_at_Landfill_Sites_Main_Report (accessed on 11 October 2021).
  7. Davoli, E.; Fattore, E.; Paiano, V.; Colombo, A.; Palmiotto, M.; Rossi, A.N.; Il Grande, M.; Fanelli, R. Waste management health risk assessment: A case study of a solid waste landfill in South Italy. Waste Manag. 2010, 30, 1608–1613. [Google Scholar] [CrossRef] [PubMed]
  8. El-Fadel, M.; Findikakis, A.N.; Leckie, J.O. Environmental impacts of solid waste landfilling. J. Environ. Manag. 1997, 50, 1–25. [Google Scholar] [CrossRef]
  9. Naddeo, V.; Zarra, T.; Oliva, G.; Chiavola, A.; Vivarelli, A. Environmental odour impact assessment of landfill expansion scenarios: Case study of Borgo Montello (Italy). Chem. Eng. Trans. 2016, 54, 73–78. [Google Scholar] [CrossRef]
  10. Capelli, L.; Sironi, S.; Del Rosso, R.; Céntola, P.; Il Grande, M. A comparative and critical evaluation of odour assessment methods on a landfill site. Atmos. Environ. 2008, 42, 7050–7058. [Google Scholar] [CrossRef]
  11. Diaz, C.I.C.; Capelli, L.; Arias, R.; Salas Seoane, R.A.N. Analysis of Existing Regulation in Odour Pollution, Odour Impact Criteria 1; D-NOSES: Barcelona, Spain, 2019; H2020-SwafS-23-2017-789315. [Google Scholar]
  12. Hayes, J.E.; Stevenson, R.J.; Stuetz, R.M. The impact of malodour on communities: A review of assessment techniques. Sci. Total Environ. 2014, 500–501, 395–407. [Google Scholar] [CrossRef] [PubMed]
  13. Rappert, S.; Müller, R. Odor compounds in waste gas emissions from agricultural operations and food industries. Waste Manag. 2005, 25, 887–907. [Google Scholar] [CrossRef] [PubMed]
  14. Bokowa, A.; Diaz, C.; Koziel, J.A.; McGinley, M.; Barclay, J.; Schauberger, G.; Guillot, J.-M.; Sneath, R.; Capelli, L.; Zorich, V.; et al. Summary and Overview of the Odour Regulations Worldwide. Atmosphere 2021, 12, 206. [Google Scholar] [CrossRef]
  15. Bax, C.; Sironi, S.; Capelli, L. How Can Odors Be Measured? An Overview of Methods and Their Applications. Atmosphere 2020, 11, 92. [Google Scholar] [CrossRef] [Green Version]
  16. Dravnieks, A.; Jarke, F. Odor threshold measurement by dynamic olfactometry: Significant operational variables. J. Air Pollut. Control. Assoc. 1980, 30, 1284–1289. [Google Scholar] [CrossRef] [Green Version]
  17. Standard EN 13725:2003. Ambient Air—Determination of Odour Concentration by Dynamic Olfactometry; CEN: Brussels, Belgium, 2003. [Google Scholar]
  18. Hamoda, M.F. Air Pollutants Emissions from Waste Treatment and Disposal Facilities. J. Environ. Sci. Health Part A 2006, 41, 77–85. [Google Scholar] [CrossRef]
  19. Sucker, K.; Both, R.; Winneke, G. Review of adverse health effects of odours in field studies. Water Sci. Technol. 2009, 59, 1281–1289. [Google Scholar] [CrossRef] [PubMed]
  20. Eitzer, B.D. Emissions of Volatile Organic Chemicals from Municipal Solid Waste Composting Facilities. Environ. Sci. Technol. 1995, 29, 896–902. [Google Scholar] [CrossRef] [PubMed]
  21. pr EN 13725:2018. Air Quality—Determination of Odour Concentration by Dynamic Olfactometry and Odour Emission Rate from Stationary by Sources—Complementary Element; CEN: Brussels, Belgium, 2018. [Google Scholar]
  22. Polvara, E.; Invernizzi, M.; Sironi, S. Occupational Safety for Panellists Involved in Dynamic Olfactometry: A Comparison of Available Risk Assessment Models. Chem. Eng. Trans. 2021, 85, 91–96. [Google Scholar] [CrossRef]
  23. Davoli, E.; Zuccato, E.; Bianchi, G.; Palmiotto, M.; Il Grande, M.; Bonati, S.; Rossi, A.N. Dynamic Olfactometry and Potential Sample Toxicity. Guidelines for a Safe Occupational Health Approach. Chem. Eng. Trans. 2012, 30, 7–12. [Google Scholar] [CrossRef]
  24. Polvara, E.; Capelli, L.M.T.; Sironi, S. Non-carcinogenic occupational exposure risk related to foundry emissions: Focus on the workers involved in olfactometric assessments. J. Environ. Sci. Heal. Part. A Toxic/Hazardous Subst. Environ. Eng. 2021, 56, 646–659. [Google Scholar] [CrossRef]
  25. Bleam, W.F. Risk Assessment. In Soil and Environmental Chemistry; Elsevier: Amsterdam, The Netherlands, 2012; pp. 409–447. [Google Scholar]
  26. Zhang, C.; Xu, T.; Feng, H.; Chen, S. Greenhouse gas emissions from landfills: A review and bibliometric analysis. Sustainability 2019, 11, 2282. [Google Scholar] [CrossRef] [Green Version]
  27. Nair, A.T.; Senthilnathan, J.; Nagendra, S.M.S. Emerging perspectives on VOC emissions from landfill sites: Impact on tropospheric chemistry and local air quality. Process. Saf. Environ. Prot. 2019, 121, 143–154. [Google Scholar] [CrossRef]
  28. Hanson, J.; Yesiller, N. Estimation and Comparison of Methane, Nitrous Oxide, and Trace Volatile Organic Compound Emissions and Gas Collection System Efficiencies in California Landfills; Prepared for: The California Air Resources Board and The California Department of Resources Recycling and Recovery; 2020. Available online: https://ww2.arb.ca.gov/sites/default/files/2020-06/CalPoly%20LFG%20Flux%20and%20Collection%20Efficiencies%203-30-2020.pdf (accessed on 11 October 2021).
  29. Sadowska-Rociek, A.M.; Kurdziel, E.; Szczepaniec-Cieciak, C.; Riesenmey, H.; Vaillant, M.; Batton-Hubert, K.P. Analysis of odorous compounds at municipal landfill sites. Waste Manag. Res. 2009, 27, 966–975. [Google Scholar] [CrossRef]
  30. Manheim, D.C.; Yeşiller, N.; Hanson, J.L. Gas Emissions from Municipal Solid Waste Landfills: A Comprehensive Review and Analysis of Global Data. J. Indian Inst. Sci. 2021, 101, 1–33. [Google Scholar] [CrossRef]
  31. Duan, Z.; Scheutz, C.; Kjeldsen, P. Trace gas emissions from municipal solid waste landfills: A review. Waste Manag. 2021, 119, 39–62. [Google Scholar] [CrossRef]
  32. Scheutz, C.; Bogner, J.; Chanton, J.P.; Blake, D.; Morcet, M.; Aran, C.; Kjeldsen, P. Atmospheric emissions and attenuation of non-methane organic compounds in cover soils at a French landfill. Waste Manag. 2008, 28, 1892–1908. [Google Scholar] [CrossRef] [Green Version]
  33. Termonia, A.; Termonia, M. Characterisation and on-site monitoring of odorous organic compounds in the environment of a landfill site. Int. J. Environ. Anal. Chem. 1999, 73, 43–57. [Google Scholar] [CrossRef]
  34. Davoli, E.; Gangai, M.L.; Morselli, L.; Tonelli, D. Characterisation of odorants emissions from landfills by SPME and GC/MS. Chemosphere 2003, 51, 357–368. [Google Scholar] [CrossRef]
  35. Ying, D.; Chuanyu, C.; Bin, H.; Yueen, X.; Xuejuan, Z.; Yingxu, C.; Weixiang, W. Characterization and control of odorous gases at a landfill site: A case study in Hangzhou, China. Waste Manag. 2012, 32, 317–326. [Google Scholar] [CrossRef] [PubMed]
  36. Gallego, E.; Roca, F.J.; Perales, J.F.; Sánchez, G.; Esplugas, P. Characterization and determination of the odorous charge in the indoor air of a waste treatment facility through the evaluation of volatile organic compounds (VOCs) using TD-GC/MS. Waste Manag. 2012, 32, 2469–2481. [Google Scholar] [CrossRef] [PubMed]
  37. Kim, K.H.; Choi, Y.; Jeon, E.; Sunwoo, Y. Characterization of malodorous sulfur compounds in landfill gas. Atmos. Environ. 2005, 39, 1103–1112. [Google Scholar] [CrossRef]
  38. Dincer, F.; Odabasi, M.; Muezzinoglu, A. Chemical characterization of odorous gases at a landfill site by gas chromatography-mass spectrometry. J. Chromatogr. A 2006, 1122, 222–229. [Google Scholar] [CrossRef]
  39. Carriero, G.; Neri, L.; Famulari, D.; Di Lonardo, S.; Piscitelli, D.; Manco, A.; Esposito, A.; Chirico, A.; Facini, O.; Finardi, S.; et al. Composition and emission of VOC from biogas produced by illegally managed waste landfills in Giugliano (Campania, Italy) and potential impact on the local population. Sci. Total Environ. 2018, 640–641, 377–386. [Google Scholar] [CrossRef]
  40. Schweigkofler, M.; Niessner, R. Determination of siloxanes and VOC in landfill gas and sewage gas by canister sampling and GC-MS/AES analysis. Environ. Sci. Technol. 1999, 33, 3680–3685. [Google Scholar] [CrossRef]
  41. Kim, K.H. Emissions of reduced sulfur compounds (RSC) as a landfill gas (LFG): A comparative study of young and old landfill facilities. Atmos. Environ. 2006, 40, 6567–6578. [Google Scholar] [CrossRef]
  42. Fang, J.J.; Yang, N.; Cen, D.Y.; Shao, L.M.; He, P.J. Odor compounds from different sources of landfill: Characterization and source identification. Waste Manag. 2012, 32, 1401–1410. [Google Scholar] [CrossRef] [PubMed]
  43. Scaglia, B.; Orzi, V.; Artola, A.; Font, X.; Davoli, E.; Sanchez, A.; Adani, F. Odours and volatile organic compounds emitted from municipal solid waste at different stage of decomposition and relationship with biological stability. Bioresour. Technol. 2011, 102, 4638–4645. [Google Scholar] [CrossRef] [PubMed] [Green Version]
  44. Gallego, E.; Perales, J.F.; Roca, F.J.; Guardino, X. Surface emission determination of volatile organic compounds (VOC) from a closed industrial waste landfill using a self-designed static flux chamber. Sci. Total Environ. 2014, 470–471, 587–599. [Google Scholar] [CrossRef] [PubMed]
  45. Duan, Z.; Lu, W.; Li, D.; Wang, H. Temporal variation of trace compound emission on the working surface of a landfill in Beijing, China. Atmos. Environ. 2014, 88, 230–238. [Google Scholar] [CrossRef]
  46. Rodríguez-Navas, C.; Forteza, R.; Cerdà, V. Use of thermal desorption-gas chromatography-mass spectrometry (TD-GC-MS) on identification of odorant emission focus by volatile organic compounds characterisation. Chemosphere 2012, 89, 1426–1436. [Google Scholar] [CrossRef]
  47. Parker, T.; Dottridge, J.; Kelly, S. Investigation of the Composition and Emissions of Trace Components in Landfill Gas; Environment Agency: Bristol, UK, 2002; p. 146. [Google Scholar]
  48. Durmusoglu, E.; Taspinar, F.; Karademir, A. Health risk assessment of BTEX emissions in the landfill environment. J. Hazard. Mater. 2010, 176, 870–877. [Google Scholar] [CrossRef]
  49. Cheng, Z.; Sun, Z.; Zhu, S.; Lou, Z.; Zhu, N.; Feng, L. The identification and health risk assessment of odor emissions from waste landfilling and composting. Sci. Total Environ. 2019, 649, 1038–1044. [Google Scholar] [CrossRef]
  50. Capelli, L.; Sironi, S.; del Rosso, R. Odor sampling: Techniques and strategies for the estimation of odor emission rates from different source types. Sensors 2013, 13, 938–955. [Google Scholar] [CrossRef] [Green Version]
  51. Vaverková, M.D. Landfill impacts on the environment—Review. Geosciences 2019, 9, 431. [Google Scholar] [CrossRef] [Green Version]
  52. ACGIH®. ACGIH® Threshold Limit Values (TLVs®) and Biological Exposure Indices (BEIs®); ACGIH®: Cincinnati, OH, USA, 2020; ISBN 9781607260288. [Google Scholar]
  53. Ryker, S.J. Chemical Mixtures in Potable Water in the U.S. In Comprehensive Water Quality and Purification; Elsevier: Amsterdam, The Netherlands, 2014; Volume 1, pp. 267–277. ISBN 9780123821836. [Google Scholar]
  54. U.S. EPA. Human Health Risk Assessment Protocol Chapter 7: Characterizing Risk and Hazard; U.S. Environmental Protection Agency: Washington, DC, USA, 2005; pp. 1–16.
  55. Antoine, J.M.R.; Fung, L.A.H.; Grant, C.N. Assessment of the potential health risks associated with the aluminium, arsenic, cadmium and lead content in selected fruits and vegetables grown in Jamaica. Toxicol. Rep. 2017, 4, 181. [Google Scholar] [CrossRef]
  56. Hoddinott, K.B.; Lee, A.P. The use of environmental risk assessment methodologies for an indoor air quality investigation. Chemosphere 2000, 41, 77–84. [Google Scholar] [CrossRef]
  57. Yimrungruang, D.; Cheevaporn, V.; Boonphakdee, T.; Watchalayann, P. Characterization and Health Risk Assessment of Volatile Organic Compounds in Gas Service Station Workers. Environ. Asia 2008, 2, 21–29. [Google Scholar] [CrossRef]
  58. Barnes, D.G.; Dourson, M.; Dourson, M.; Preuss, P.; Barnes, D.G.; Bellin, J.; Derosa, C.; Engler, R.; Erdreich, L.; Farber, T.; et al. Reference dose (RfD): Description and use in health risk assessments. Regul. Toxicol. Pharmacol. 1988, 8, 471–486. [Google Scholar] [CrossRef]
  59. Palmiotto, M.; Fattore, E.; Paiano, V.; Celeste, G.; Colombo, A.; Davoli, E. Influence of a municipal solid waste landfill in the surrounding environment: Toxicological risk and odor nuisance effects. Environ. Int. 2014, 68, 16–24. [Google Scholar] [CrossRef] [PubMed]
  60. Davoli, E.; Zuccato, E.; Bianchi, G.; Il Grande, M.; Bonati, S.; Rossi, A.N.; Porporato, C.; Pereno, M.; Soldati, S. Dynamic olfactometry and sample toxicity. a case study for a MSW incinerator odour assessment project. Chem. Eng. Trans. 2016, 54, 13–18. [Google Scholar] [CrossRef]
  61. Lucernoni, F.; Capelli, L.; Sironi, S. Odour sampling on passive area sources: Principles and methods. Chem. Eng. Trans. 2016, 54, 55–60. [Google Scholar] [CrossRef]
  62. Capelli, L.; Sironi, S. Combination of field inspection and dispersion modelling to estimate odour emissions from an Italian landfill. Atmos. Environ. 2018, 191, 273–290. [Google Scholar] [CrossRef] [Green Version]
  63. Capanema, M.A.; Cabana, H.; Cabral, A.R. Reduction of odours in pilot-scale landfill biocovers. Waste Manag. 2014, 34, 770–779. [Google Scholar] [CrossRef]
  64. Sarkar, U.; Hobbs, S.E. Landfill odour: Assessment of emissions by the flux footprint method. Environ. Model. Softw. 2003, 18, 155–163. [Google Scholar] [CrossRef]
  65. Nagata, Y. Measurement of Odor Threshold by Triangle Odor Bag Method. Odor Meas. Rev. 2003, 118, 118–127. [Google Scholar]
Figure 1. Comparison of maximum concentrations (expressed in a logarithmic scale), related to fresh waste emissions, obtained by means of flux chamber (green) vs. ambient air sampling (blue).
Atmosphere 12 01325 g001
Figure 2. Schematization of the global approach applied for data analysis and the determination of the minimum dilution values. This study proves that the most important pollutant to be investigated for the evaluation of the non-carcinogenic toxicological impact is hydrogen sulphide. Indeed, the HQ relevant to this compound makes a non-negligible contribution to the overall HI for most landfill odor sources. Nonetheless, it is important to highlight that the odor threshold (OT) of this pollutant is very low (0.00041 ppm) [65], thus making it detectable at very low concentrations. Indeed, the comparison of its OT value (from [65]) and TLV (from ACGIH database), reported in Table 7, shows that hydrogen sulphide can be perceived by panelists before producing any adverse effect on human health [24].
Atmosphere 12 01325 g002
Table 1. Maximum concentration, number of values observed in the literature, TLV and HQ values relevant to the most critical compounds found in biogas.
CompoundCAS NumberCMAX [ppm]TLV-TWA [ppm]TLV-STEL [ppm]No. of ValuesHQ
Hydrogen sulphide7783-06-45.14E + 0315285140
Chloroethene75-01-43.40E + 011 1834
Methanethiol74-93-17.12E + 000.5 3214.2
Toluene108-88-32.53E + 0220 7712.7
Benzene71-43-23.72E + 000.52.5767.43
Carbon disulphide75-15-05.35E + 001 395.35
2,4-Dimethylheptane2213-23-26.33E - 01200 43.17
Trichloroethene79-01-62.83E + 011025212.83
Styrene100-42-52.28E + 011020262.28
Dimethyl sulphide75-18-32.26E + 0110 412.26
Trimethylbenzene25551-13-73.80E +0125 21.52
Tetrachloroethene127-18-43.67E + 0125100241.47
1,1-Dichloroethane75-34-31.09E + 02100 181.09
o-Xylene95-47-69.83E + 01100150540.98
P-Xylene106-42-39.18E + 01100150540.92
α- Pinene80-56-81.59E + 0120 190.79
Ethylbenzene100-41-41.37E + 0120 640.68
Tetrachloromethane56-23-53.34E + 0051090.67
Dimethyl disulphide624-92-02.77E − 010.5 370.55
Dichloromethane75-09-22.45E + 0150 230.49
Table 2. Maximum concentration, number of values observed in the literature, TLV and HQ values relevant to the most critical compounds found in landfill leachate emission.
CompoundCAS NumberCMAX [ppm]TLV-TWA [ppm]TLV-STEL [ppm]No. of ValuesHQ
Hydrogen sulphide7783-06-43.50E − 011530.35
Ammonia7664-41-75.77E + 00253530.23
Dimethyl disulphide624-92-07.70E − 020.5 40.15
Acetic acid64-19-71.13E + 00101550.113
Benzene71-43-25.63E − 020.52.5120.113
Formaldehyde50-00-01.09E − 020.10.320.109
Ethylbenzene100-41-41.45E + 0020 120.073
Hexamethylcyclotrisiloxane541-05-92.20E − 020.3 40.067
Decamethylcyclopentasiloxane541-02-66.36E − 0110 40.064
Acrolein107-02-86.30E − 03 0.140.063
Octamethylcyclotetrasiloxane556-67-25.75E − 01101540.058
α- Pinene80-56-87.90E − 0120 70.040
Toluene108-88-36.90E − 0120 150.035
1,2,4-Trimethylbenzene95-63-61.83E − 0125 10.0073
Styrene100-42-56.58E − 02102020.0066
Dimethylamine124-40-33.26E − 0251520.0065
Aniline62-53-39.80E − 032 20.0049
Carbon disulphide75-15-03.20E − 031 40.0032
Methanethiol74-93-11.25E − 030.5 40.0025
Propionic acid79-09-42.21E − 0210 40.0022
Table 3. Maximum concentration, number of values observed in the literature, TLV and HQ values relevant to the most critical compounds found in fresh waste emissions.
CompoundCAS NumberSampling MethodCMAX [ppm]TLV-TWA [ppm]TLV-STEL [ppm]No. of ValuesHQ
Hydrogen sulphide7783-06-4Ambient Air6.22E − 0115220.62
Ammonia7664-41-7Ambient Air5.69E + 00253560.23
Acetic acid64-19-7Ambient Air2.09E + 00101550.21
Formaldehyde50-00-0Ambient Air1.87E − 020.10.320.19
Benzene71-43-2Ambient Air6.89E − 020.52.5340.14
Acrolein107-02-8Ambient Air9.70E − 03 0.140.10
Methanethiol74-93-1Ambient Air3.95E − 020.5 150.08
Dimethyl disulphide624-92-0Ambient Air3.92E − 020.5 270.08
Hexachlorobutadiene87-68-3Ambient Air9.00E − 040.02 20.05
Carbon disulphide75-15-0Ambient Air3.63E − 021 260.04
Ethylbenzene100-41-4Ambient Air1.43E − 0120 330.0072
1,3,5-Trimethylbenzene108-67-8Ambient Air1.81E − 0125 30.0071
Dimethylamine124-40-3Ambient Air2.80E − 0251520.006
Styrene100-42-5Ambient Air5.05E − 021020180.0051
Diethyl sulphide352-93-2Ambient Air4.53E − 0210 110.0045
Dimethyl sulphide75-18-3Ambient Air4.01E − 0210 210.0040
Crotonaldehyde4170-30-3Flux1.16E − 03 0.310.0039
1,4-Dichlorobenzene106-46-7Ambient Air2.36E − 0210 240.0024
Toluene108-88-3Ambient Air3.83E − 0220 340.0019
Propionic acid79-09-4Ambient Air1.54E − 0210 40.0015
Table 4. Maximum concentration, number of values observed in the literature, TLV and HQ values relevant to the most critical compounds found in temporarily covered landfill surface emission.
CompoundCAS NumberSampling MethodCMAX [ppm]TLV-TWA [ppm]TLV-STEL [ppm]No. of ValuesHQ
Hydrogen sulphide7783-06-4Flux5.74E − 011510.57
Crotonaldehyde4170-30-3Flux9.06E − 03 0.350.03
Ammonia7664-41-7Flux4.31E − 01253510.02
Acrolein107-02-8Flux1.16E − 03 0.140.012
Benzene71-43-2Flux3.76E − 030.52.550.008
Formic acid64-18-6Flux2.32E − 0251030.005
Furfural98-01-1Flux4.53E − 040.2 10.0023
Carbon disulphide75-15-0Flux1.62E − 031 50.0016
Trichloroethene79-01-6Flux1.17E − 02102540.0012
Butanol71-36-3Flux1.96E − 0220 10.0010
Propanal123-38-6Flux1.62E − 0220 40.0008
Toluene108-88-3Flux1.56E − 0220 60.0008
Phenol108-95-2Flux2.43E − 035 10.0005
Styrene100-42-5Flux3.39E − 03102040.0003
Tetrachloromethane56-23-5Flux1.17E − 0351010.00024
Acetic acid64-19-7Flux2.17E − 03101530.00022
Propanone67-64-1Flux5.34E − 0225050050.00021
Phthalic anhydride85-44-9Ambient Air1.60E − 041 10.00016
Trichloromethane67-66-3Flux1.36E − 0310 10.00014
Diethyl phthalate84-66-2Ambient Air7.00E − 050.55 10.00013
Table 5. Comparison of maximum concentration, sampling method adopted, number of values observed in the literature, TLV and HQ values for compounds found in permanently covered landfill surface emission.
CompoundCAS NumberSampling MethodCMAX [ppm]TLV-TWA [ppm]TLV-STEL [ppm]No. of ValuesHQ
Toluene108-88-3Flux2.47E + 0120 341.2
Hydrogen sulphide7783-06-4Flux5.74E − 011520.6
Ammonia7664-41-7Ambient Air5.43E + 00253520.22
Benzene71-43-2Ambient Air8.45E − 020.52.5270.17
Crotonaldehyde4170-30-3Flux1.07E − 02 0.380.04
Acetic acid64-19-7Flux3.39E − 011015170.03
α- Pinene80-56-8Ambient Air2.63E − 0120 90.013
β- Pinene127-91-3Ambient Air1.59E − 0120 90.0079
Ethylbenzene100-41-4Ambient Air1.57E − 0120 340.0078
p-Xylene106-42-3Ambient Air3.39E − 01100150120.0034
Phenol108-95-2Flux1.67E − 025 160.0033
Carbon disulphide75-15-0Flux2.42E − 031 170.0024
Cyclohexanone108-94-1Flux2.54E − 022050170.0013
Butanol71-36-3Flux1.70E − 0220 10.00085
Tetrachloromethane56-23-5Flux4.22E − 0351010.00084
2-Methylnaphthalene91-57-6Flux3.89E − 040.5 150.00078
Ethanol64-17-5Ambient Air7.24E − 01 1000180.00072
Acrolein107-02-8Ambient Air6.98E − 05 0.140.00070
Propanone67-64-1Flux1.09E − 01250500210.0004
Table 6. Comparison of the HI values obtained for the different landfill odor sources.
Landfill Emission SourcesHI Values
Biogas5237
Leachate1.51
Fresh waste1.78
Temporarily covered landfill surface0.66
Permanently covered landfill surface2.31
Table 7. OT and TLV values for hydrogen sulphide.
OT
[ppm]
TLV-TWA
[ppm]
TLV-STEL
[ppm]
0.0004115
Publisher’s Note: MDPI stays neutral with regard to jurisdictional claims in published maps and institutional affiliations.

