
Maximum, Minimum, and Daily Air Temperature Range in Orchards: What Do Observations Reveal?


Abstract
:1. Introduction
- How does air Tmax, Tmin, and DTR in orchards relate to micro-environmental conditions and their changes in the field?
- How far does Tmax, Tmin, and DTR in the orchard deviate from measurements performed at the nearest climate station?
- How far does Tmax, Tmin, and DTR in the orchard deviate from corresponding reanalysis data?
2. Experiments
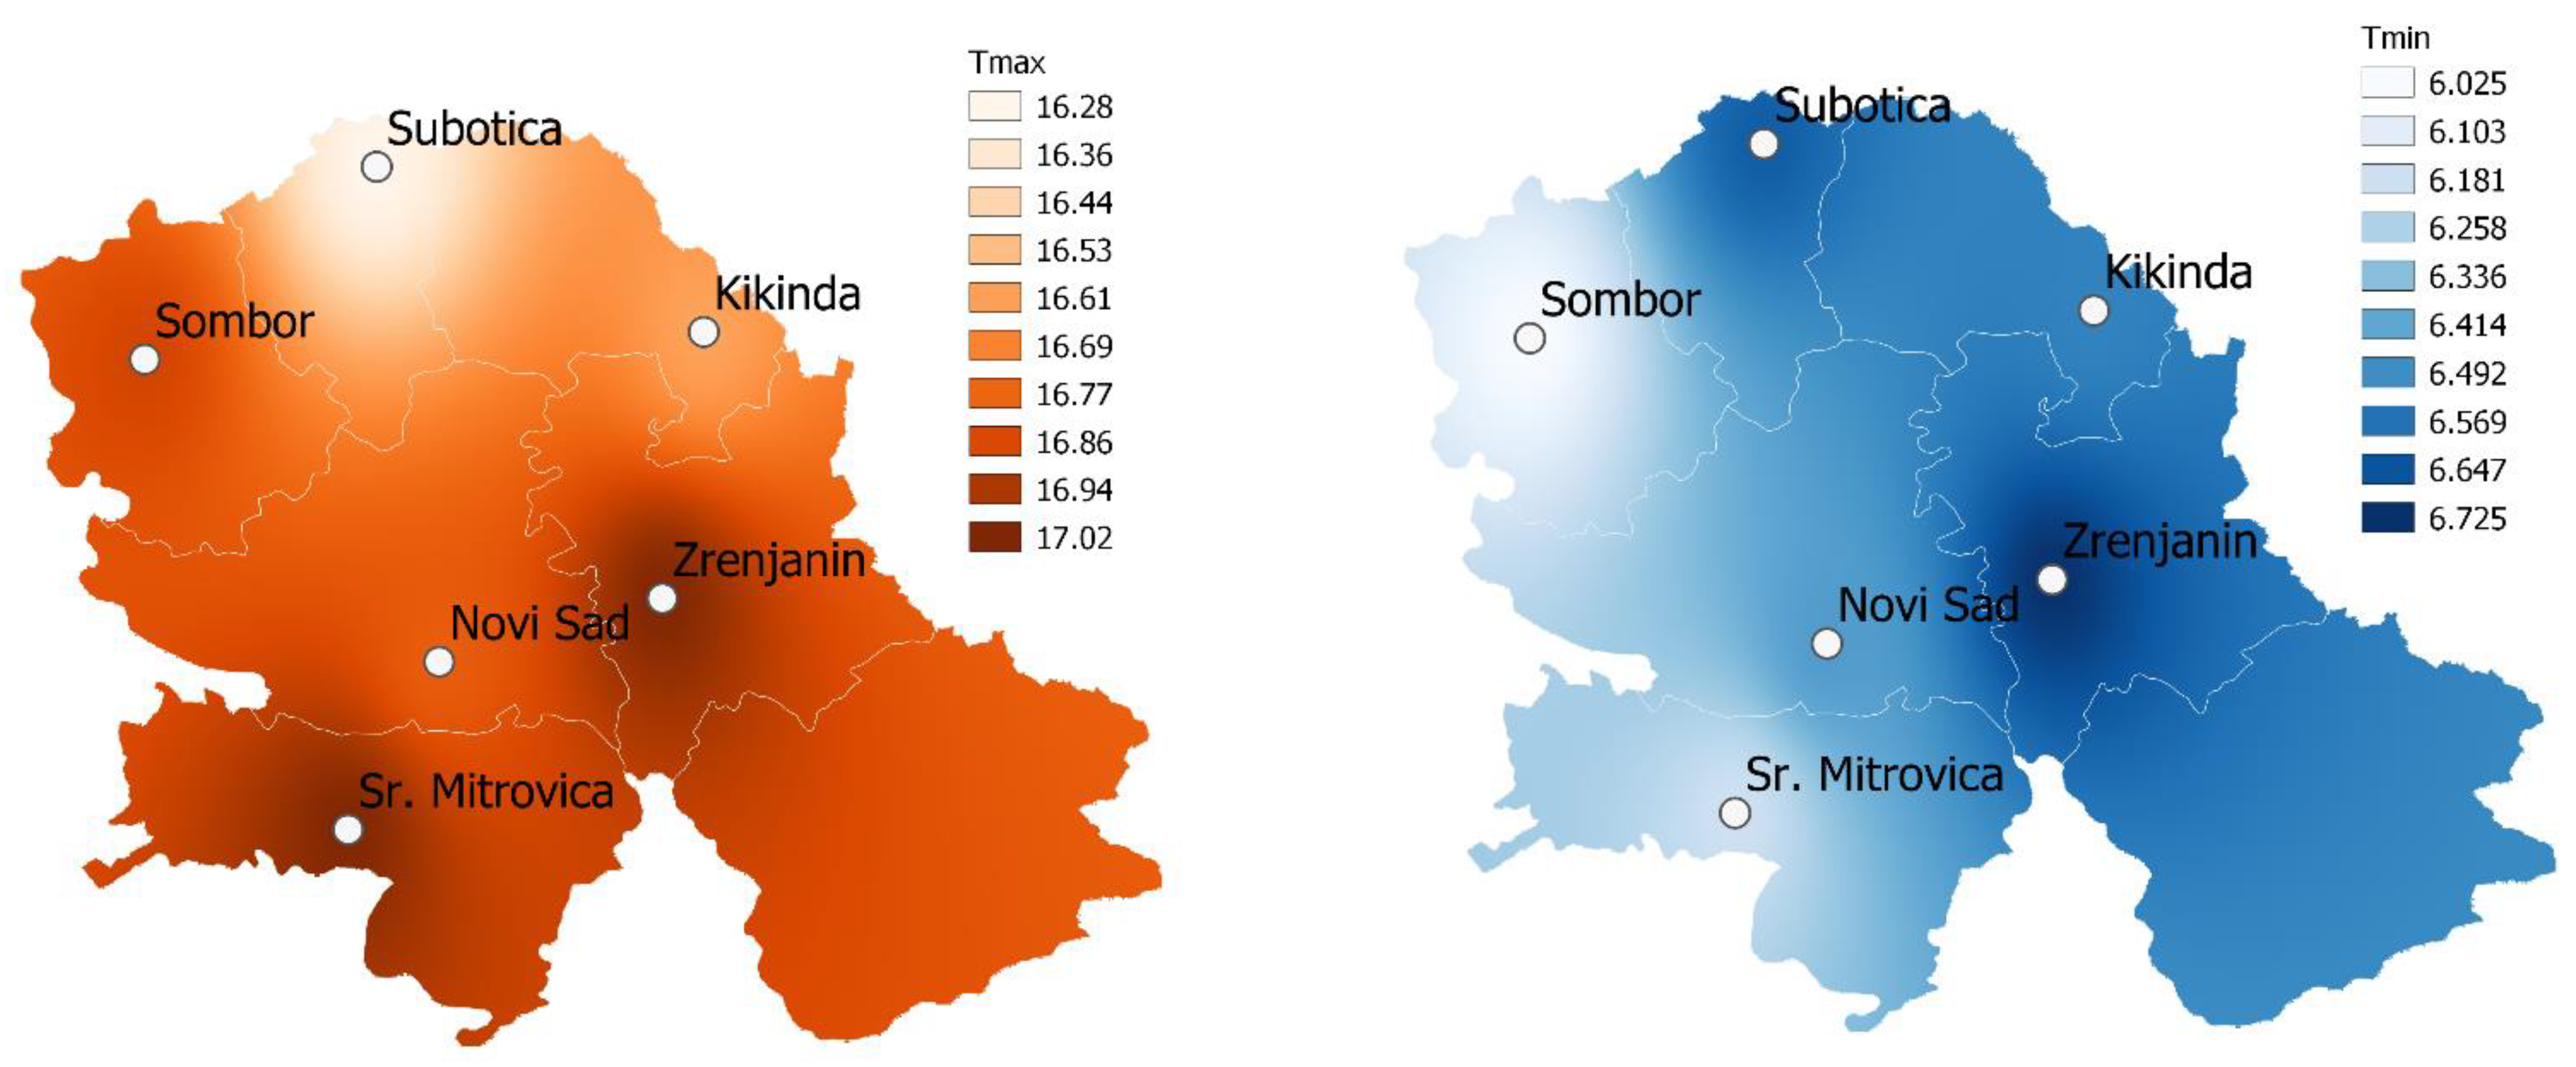
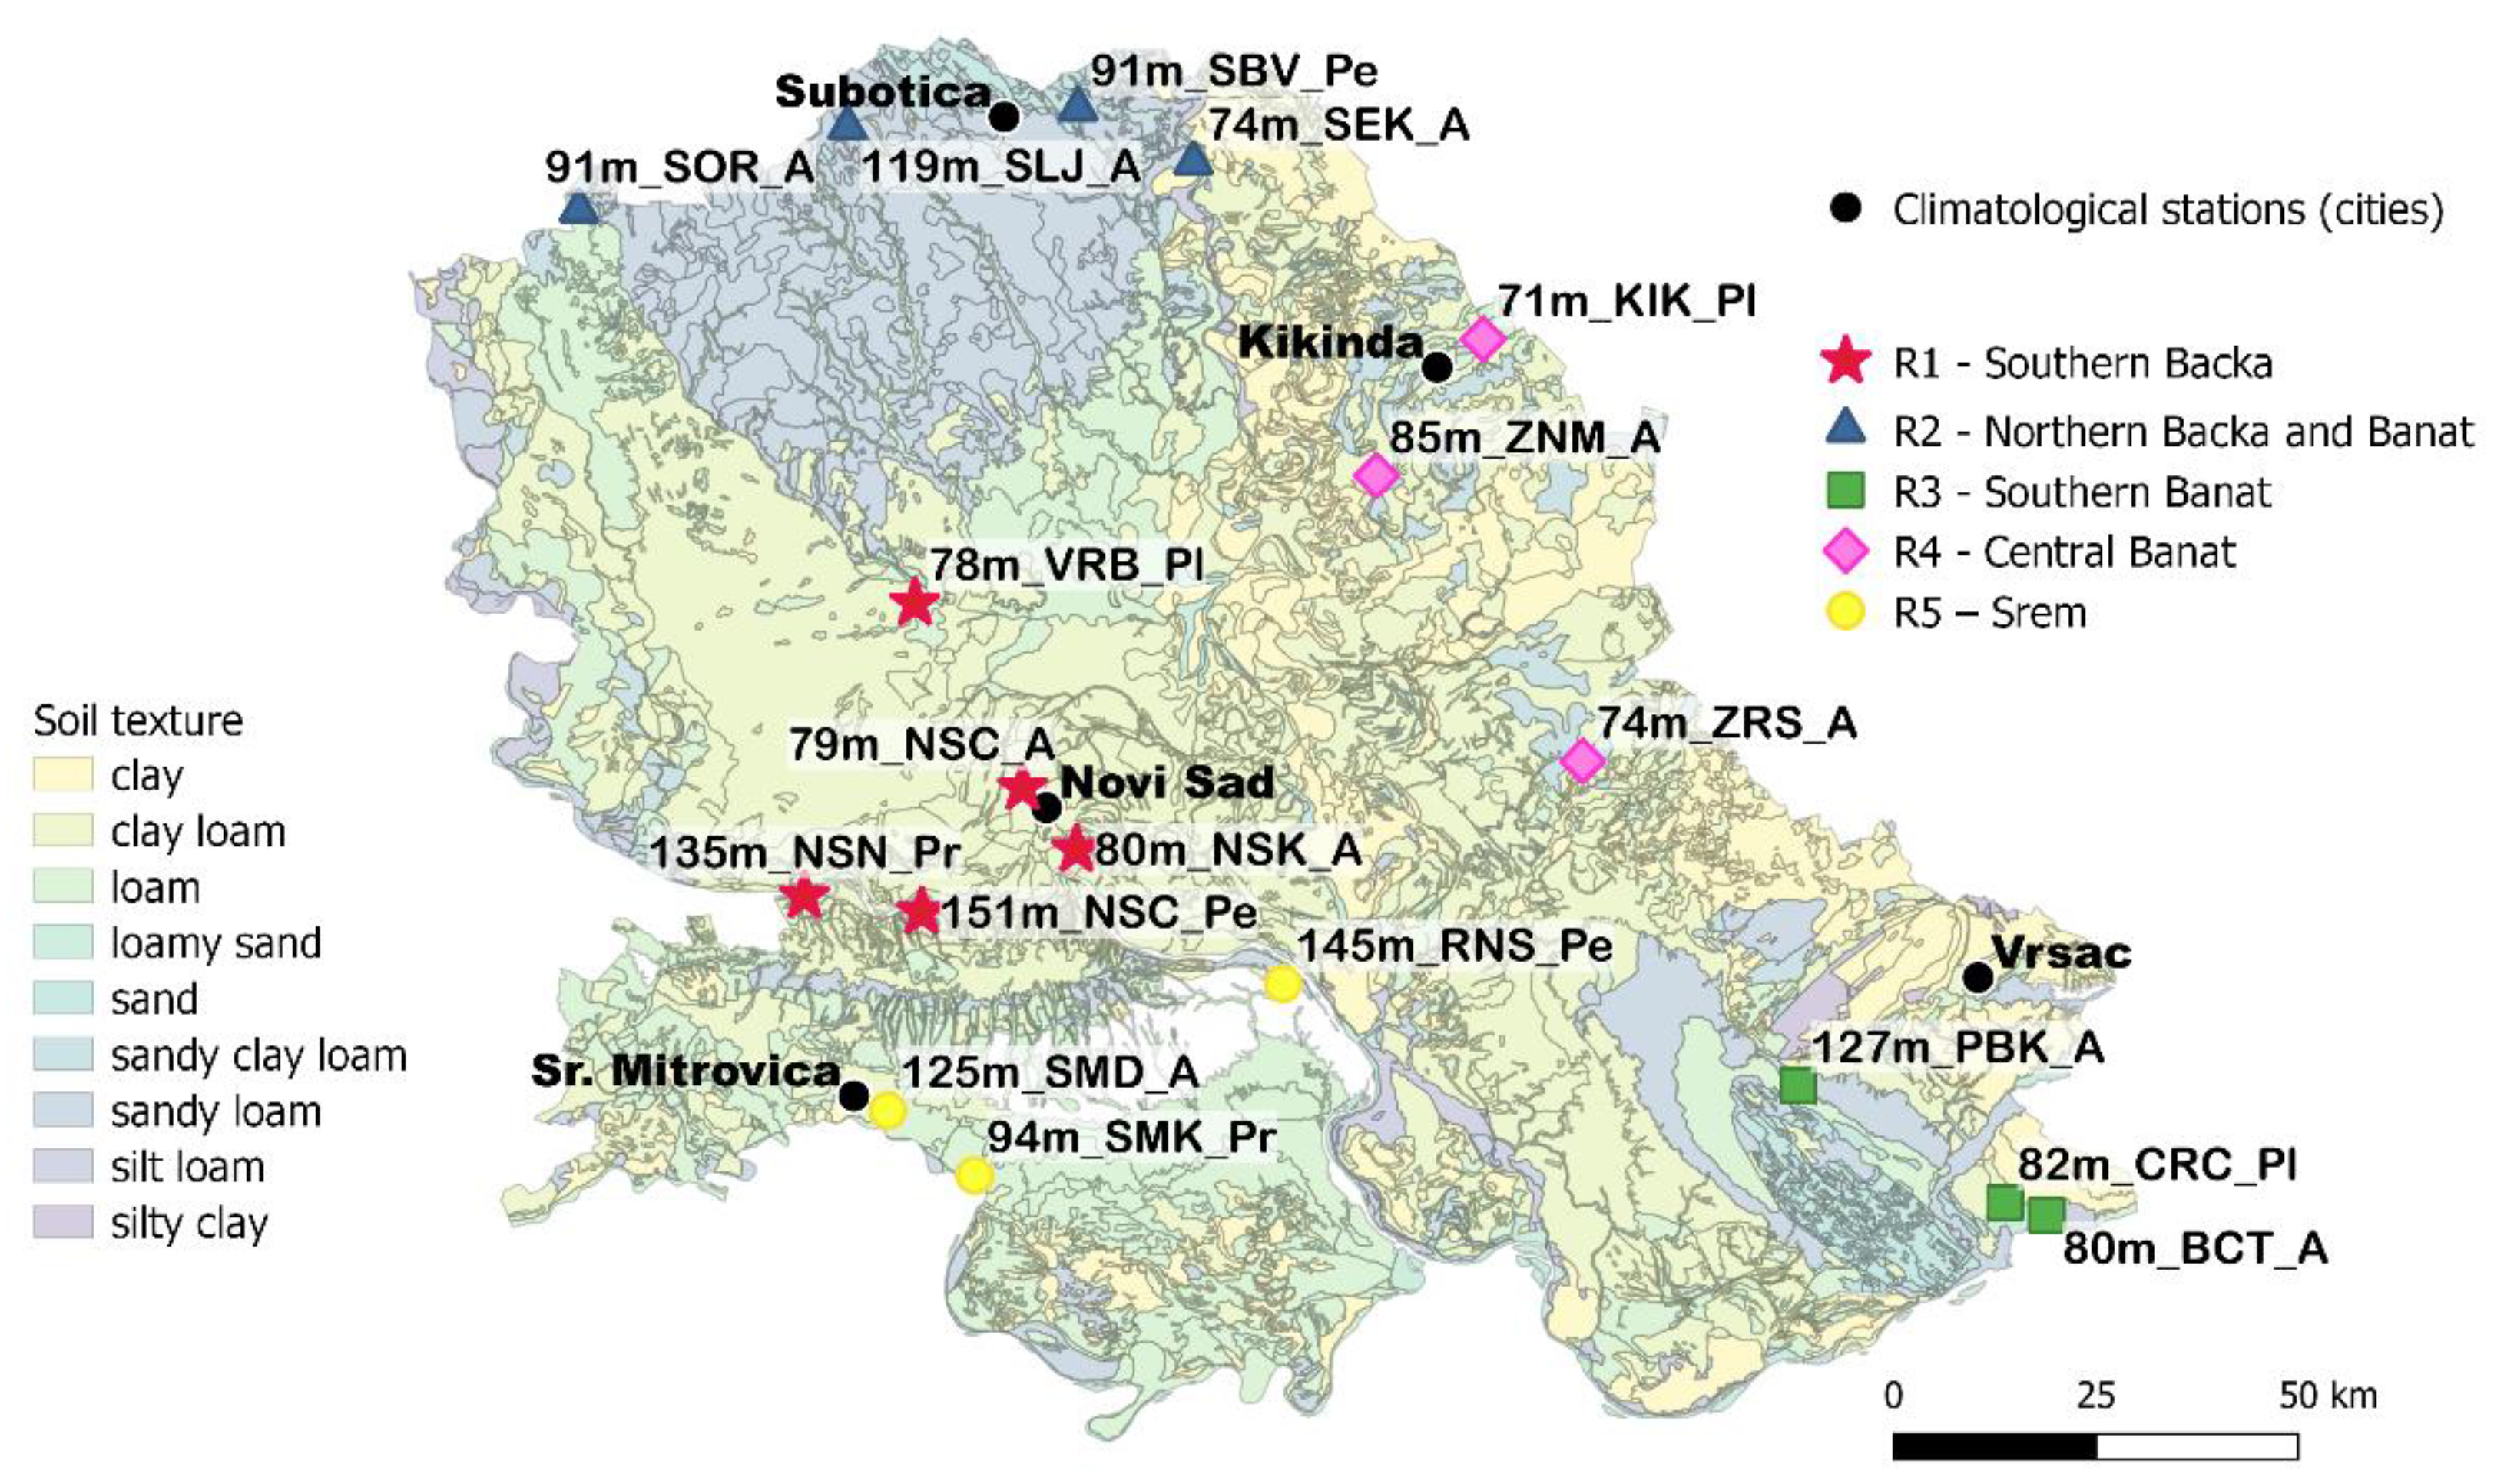
2.1. Study Region
2.2. Data
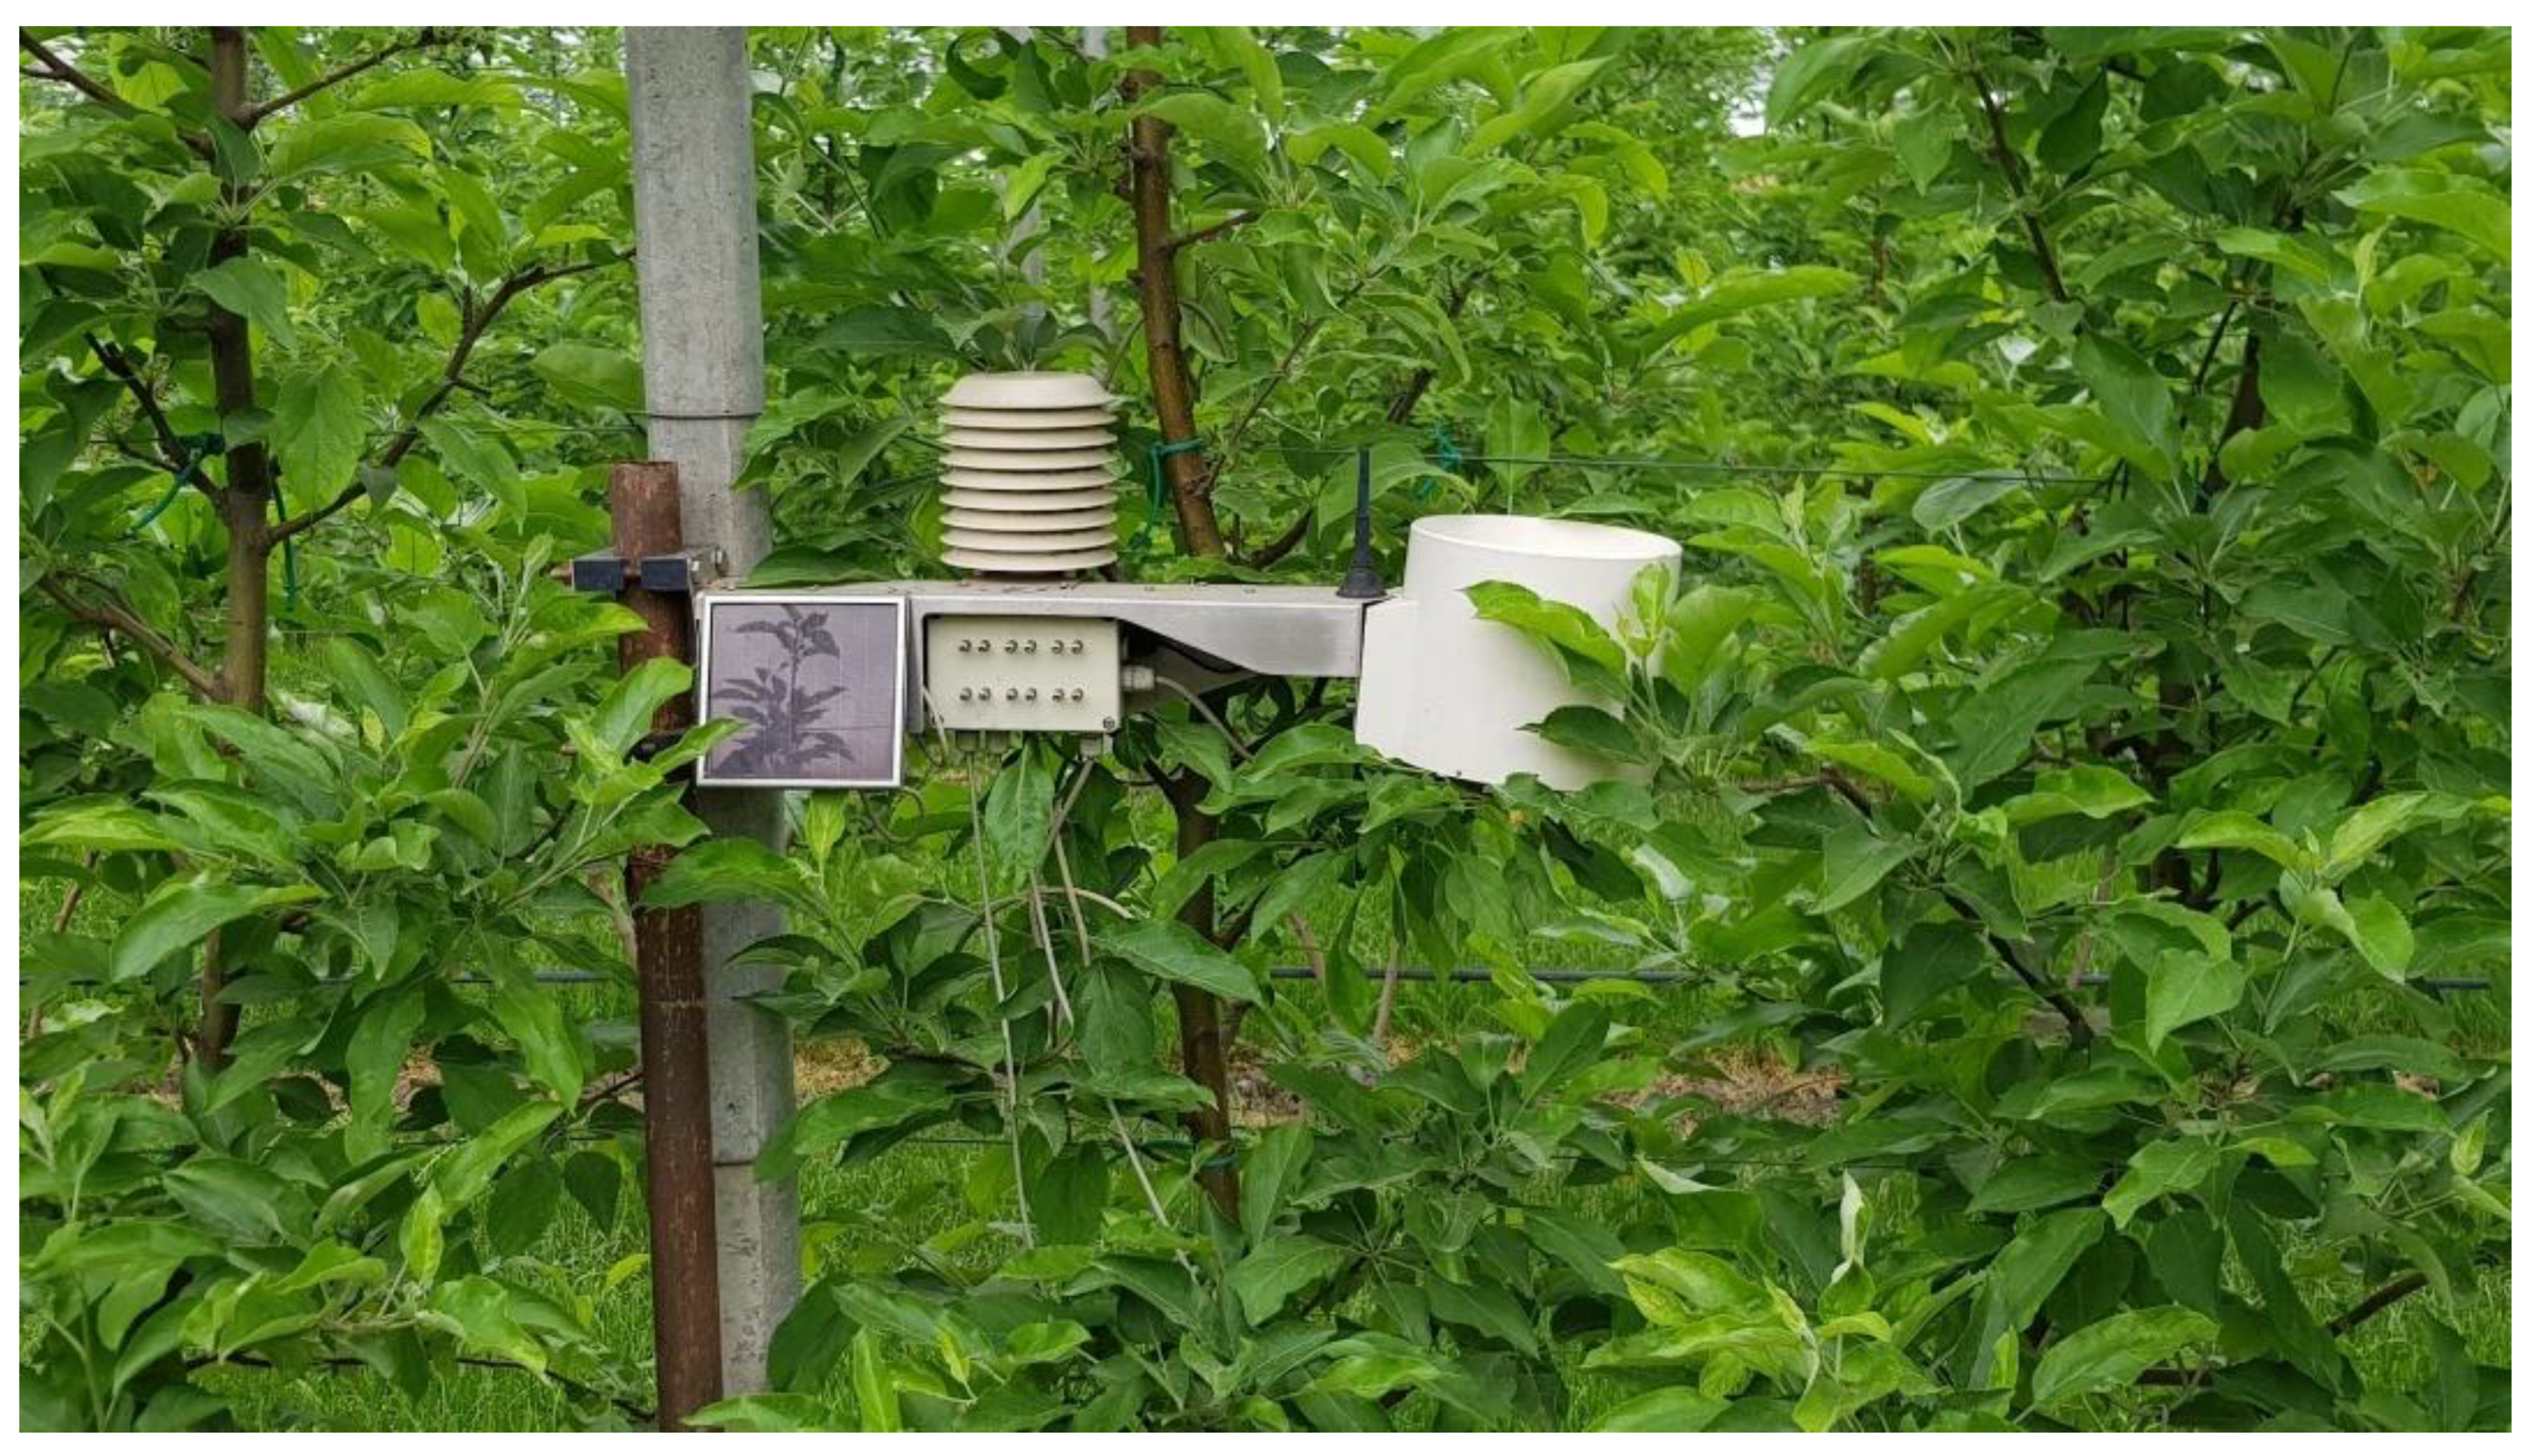
2.2.1. Micrometeorological Data
- R1—an obstacle for S-W warm front is Fruska Gora mountain (8 km–40 km distance, rise (mountain height—450 m)/run (distance) ranges from 0.06 to 0.01);
- R2—wide open for circulations predominantly coming from N-W and N-E; there is not any nearby obstacles (rise/run < 0.0045);
- R3—mixed orography (combination of partly hilly (Vrsac mountains) and flat terrain), mixed landscape (agricultural land and semi-deserts), and specific weather patterns (the strong influence of Kosava wind);
- R4—obstacle for NW winds is the Carpathian Mountain (100 km–150 km distance, rise/run ranges from 0.010 to 0.014); and
- R5—mixed orography (more considerable height and horizontal scale of hill (Fruska Gora), flat terrain, and large river (Danube)).
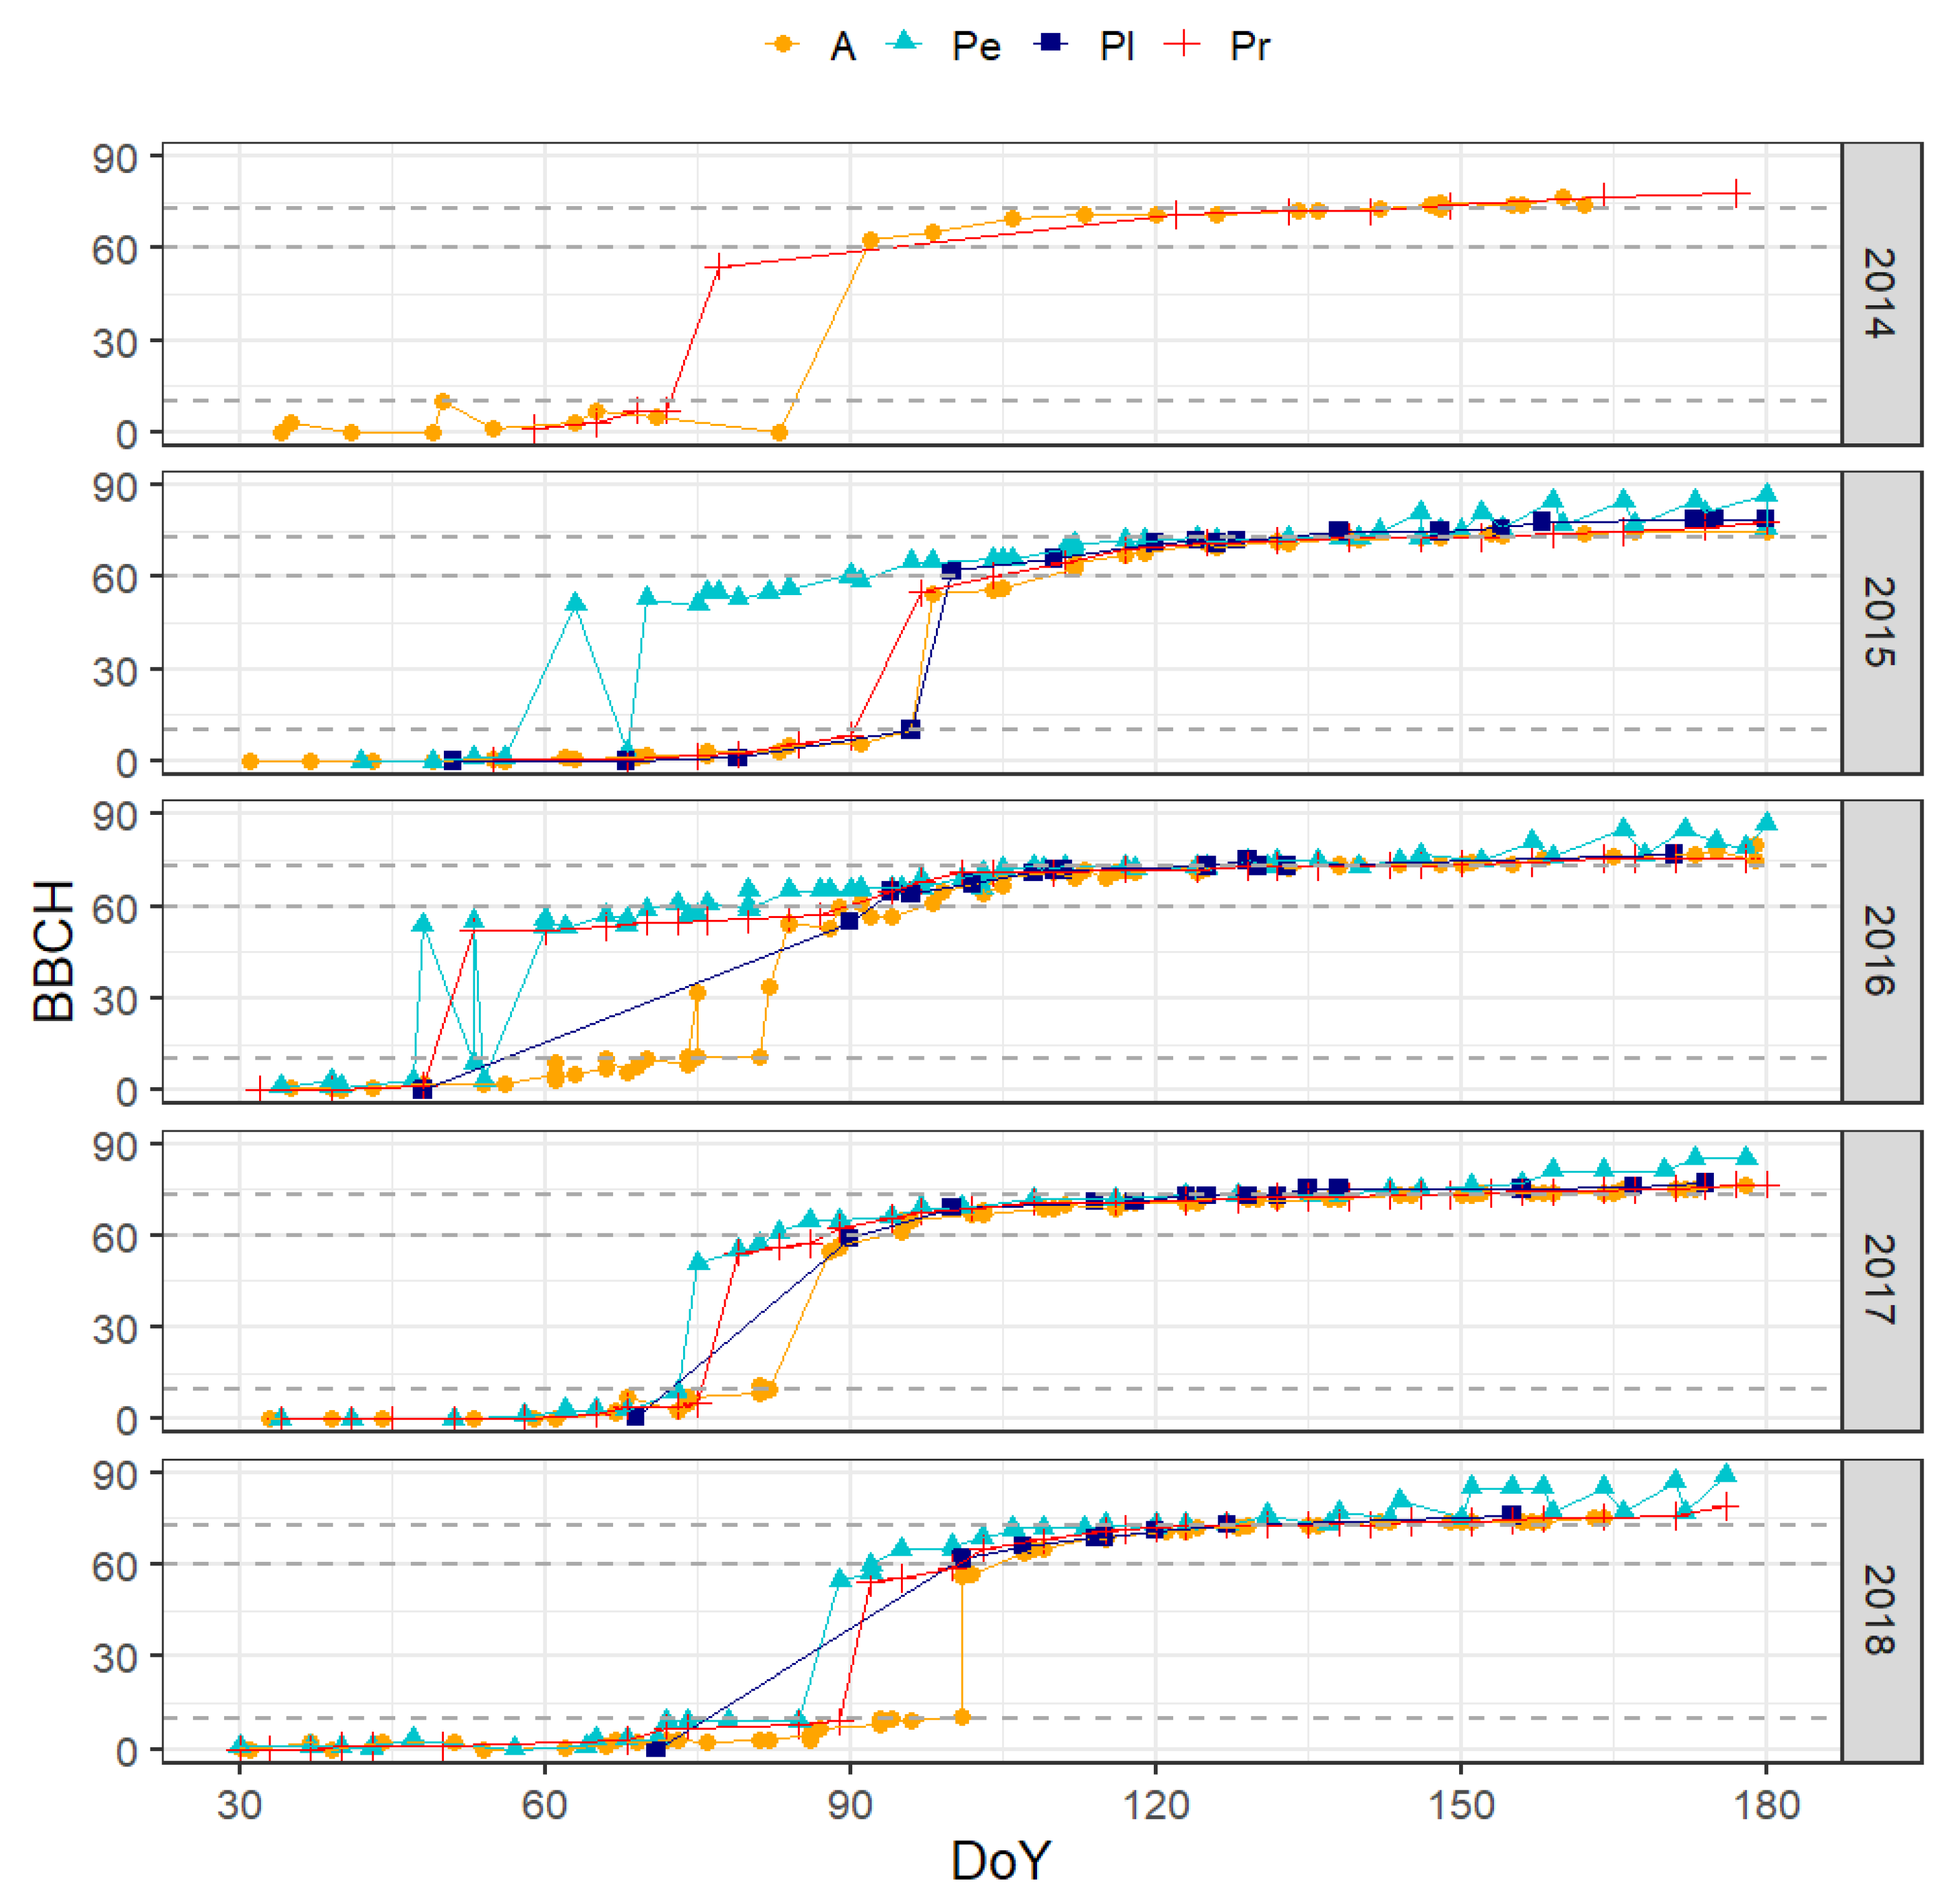
2.2.2. Phenological Data
2.2.3. Soil Data
2.2.4. Climate and Reanalysis Data
2.3. Study Design
3. Results
3.1. Factors Driving Variability of Temperature Extremes
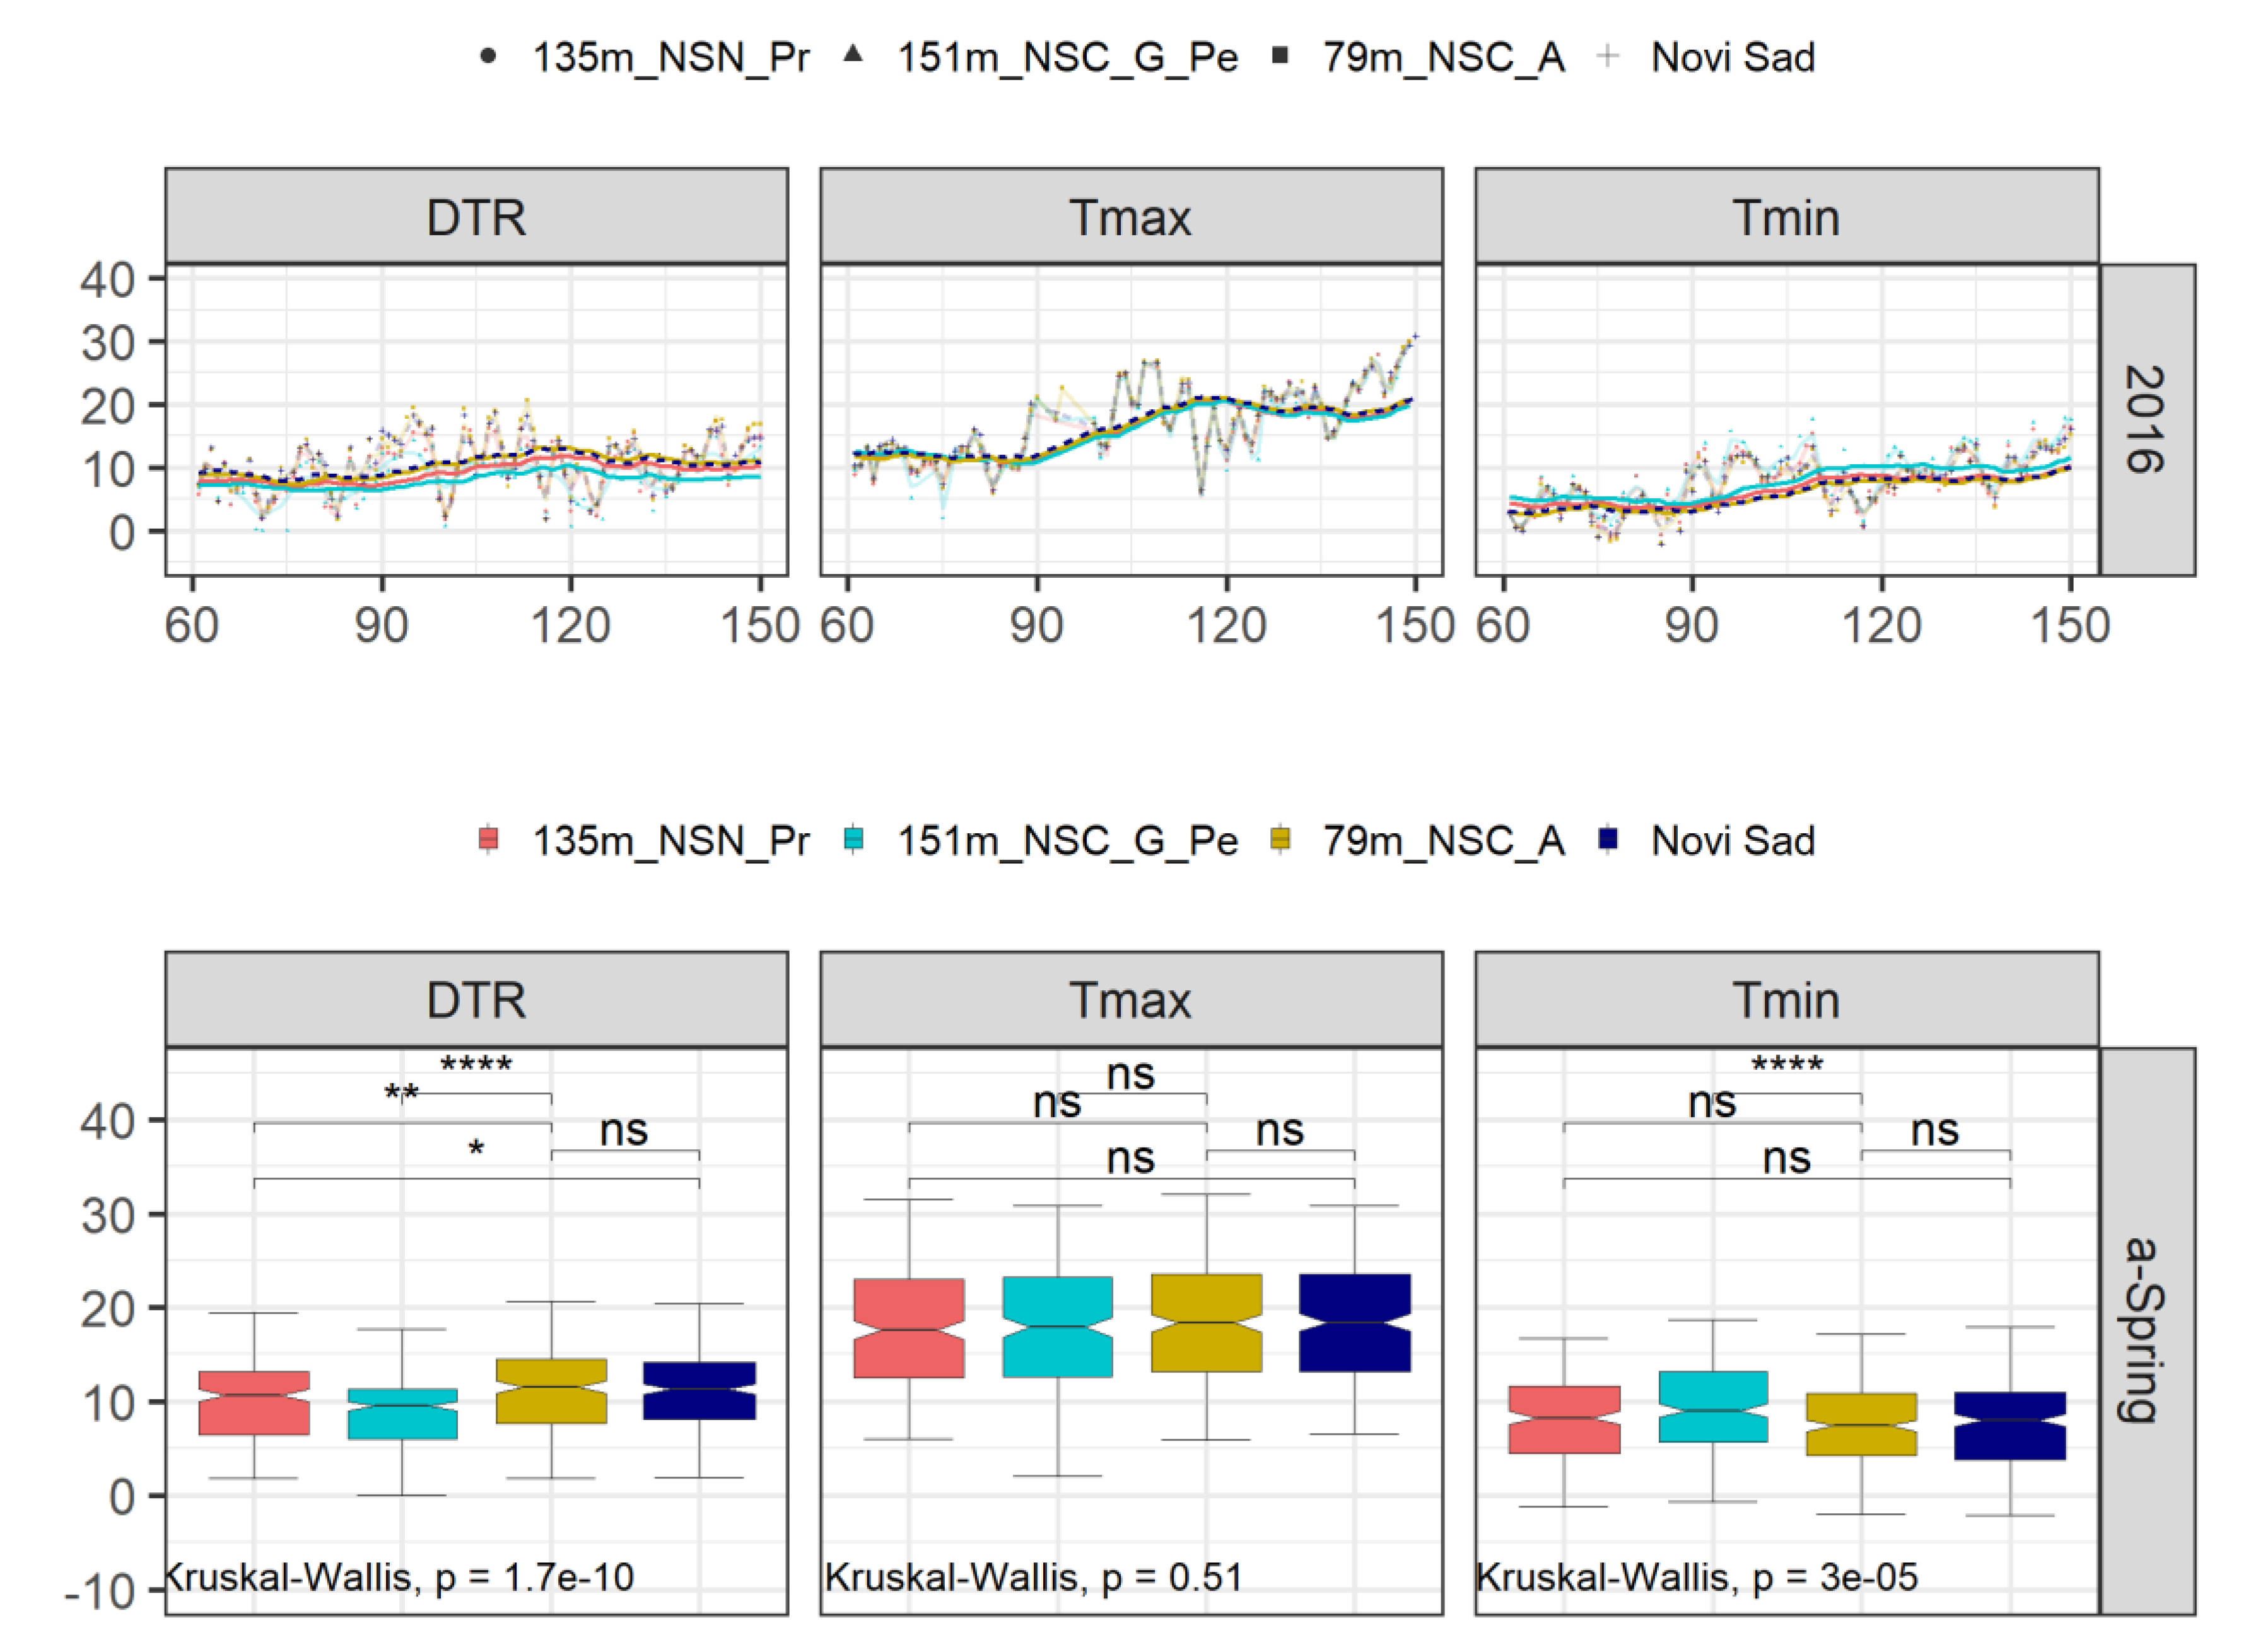
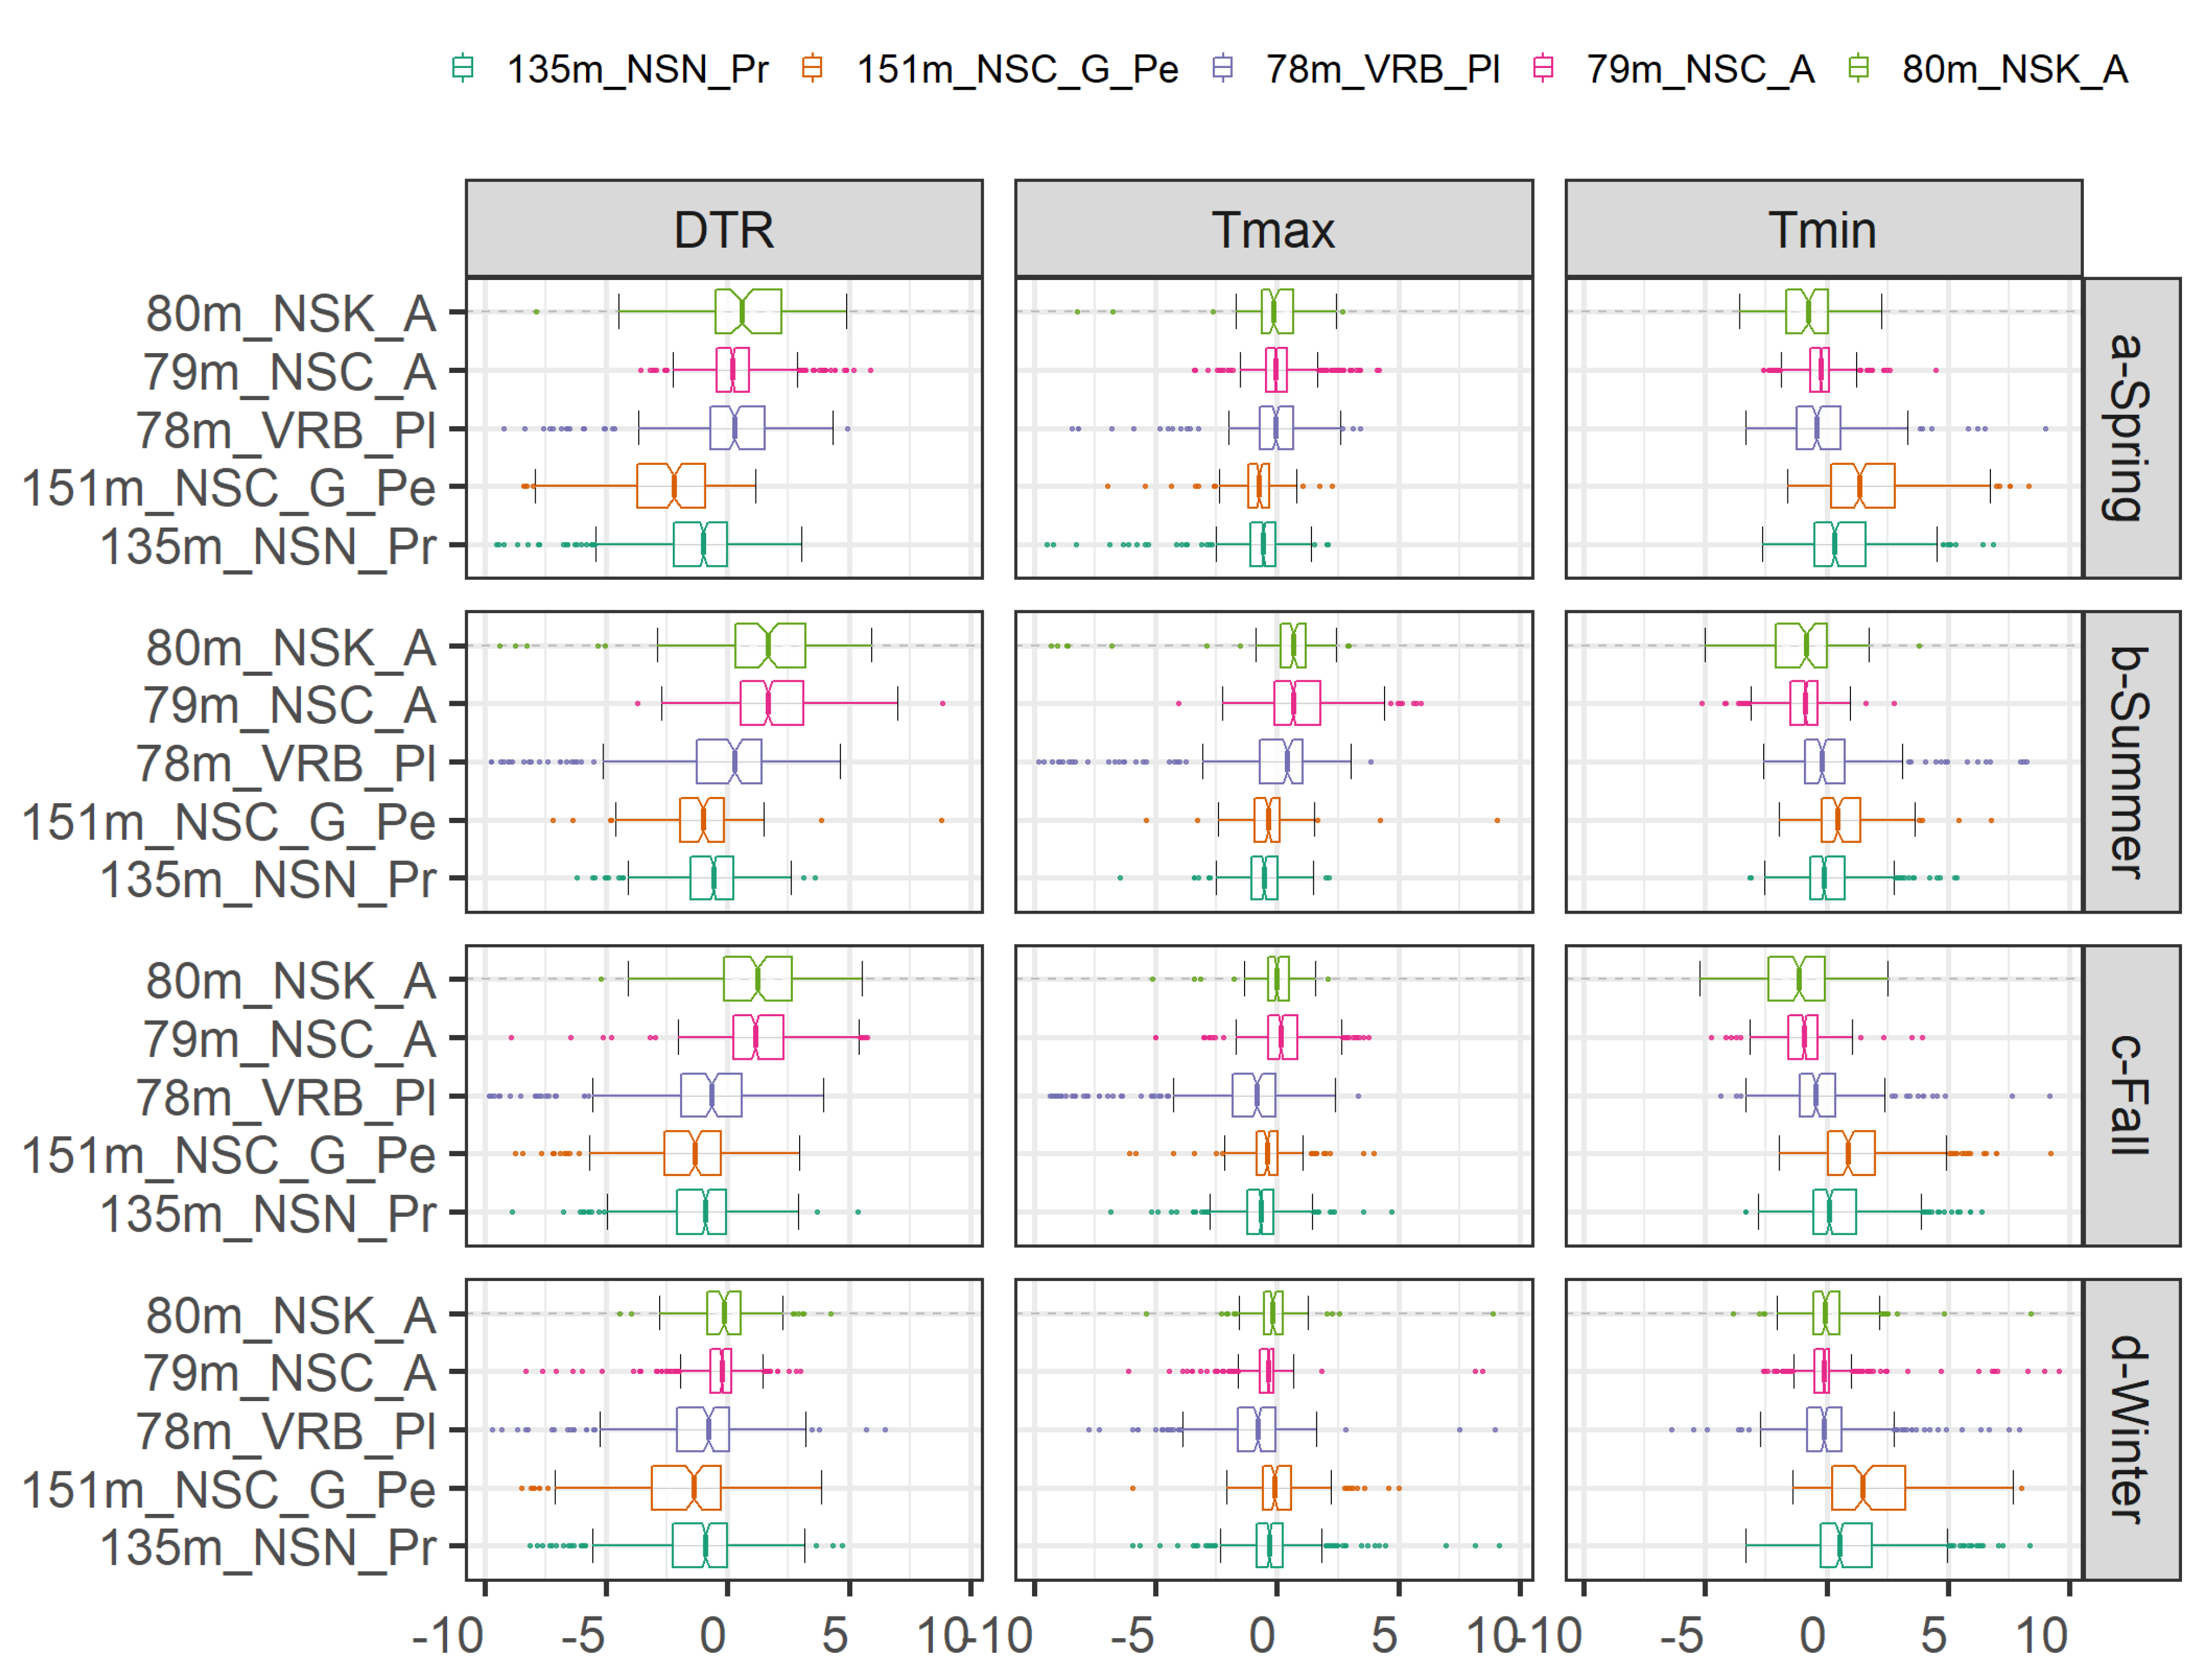
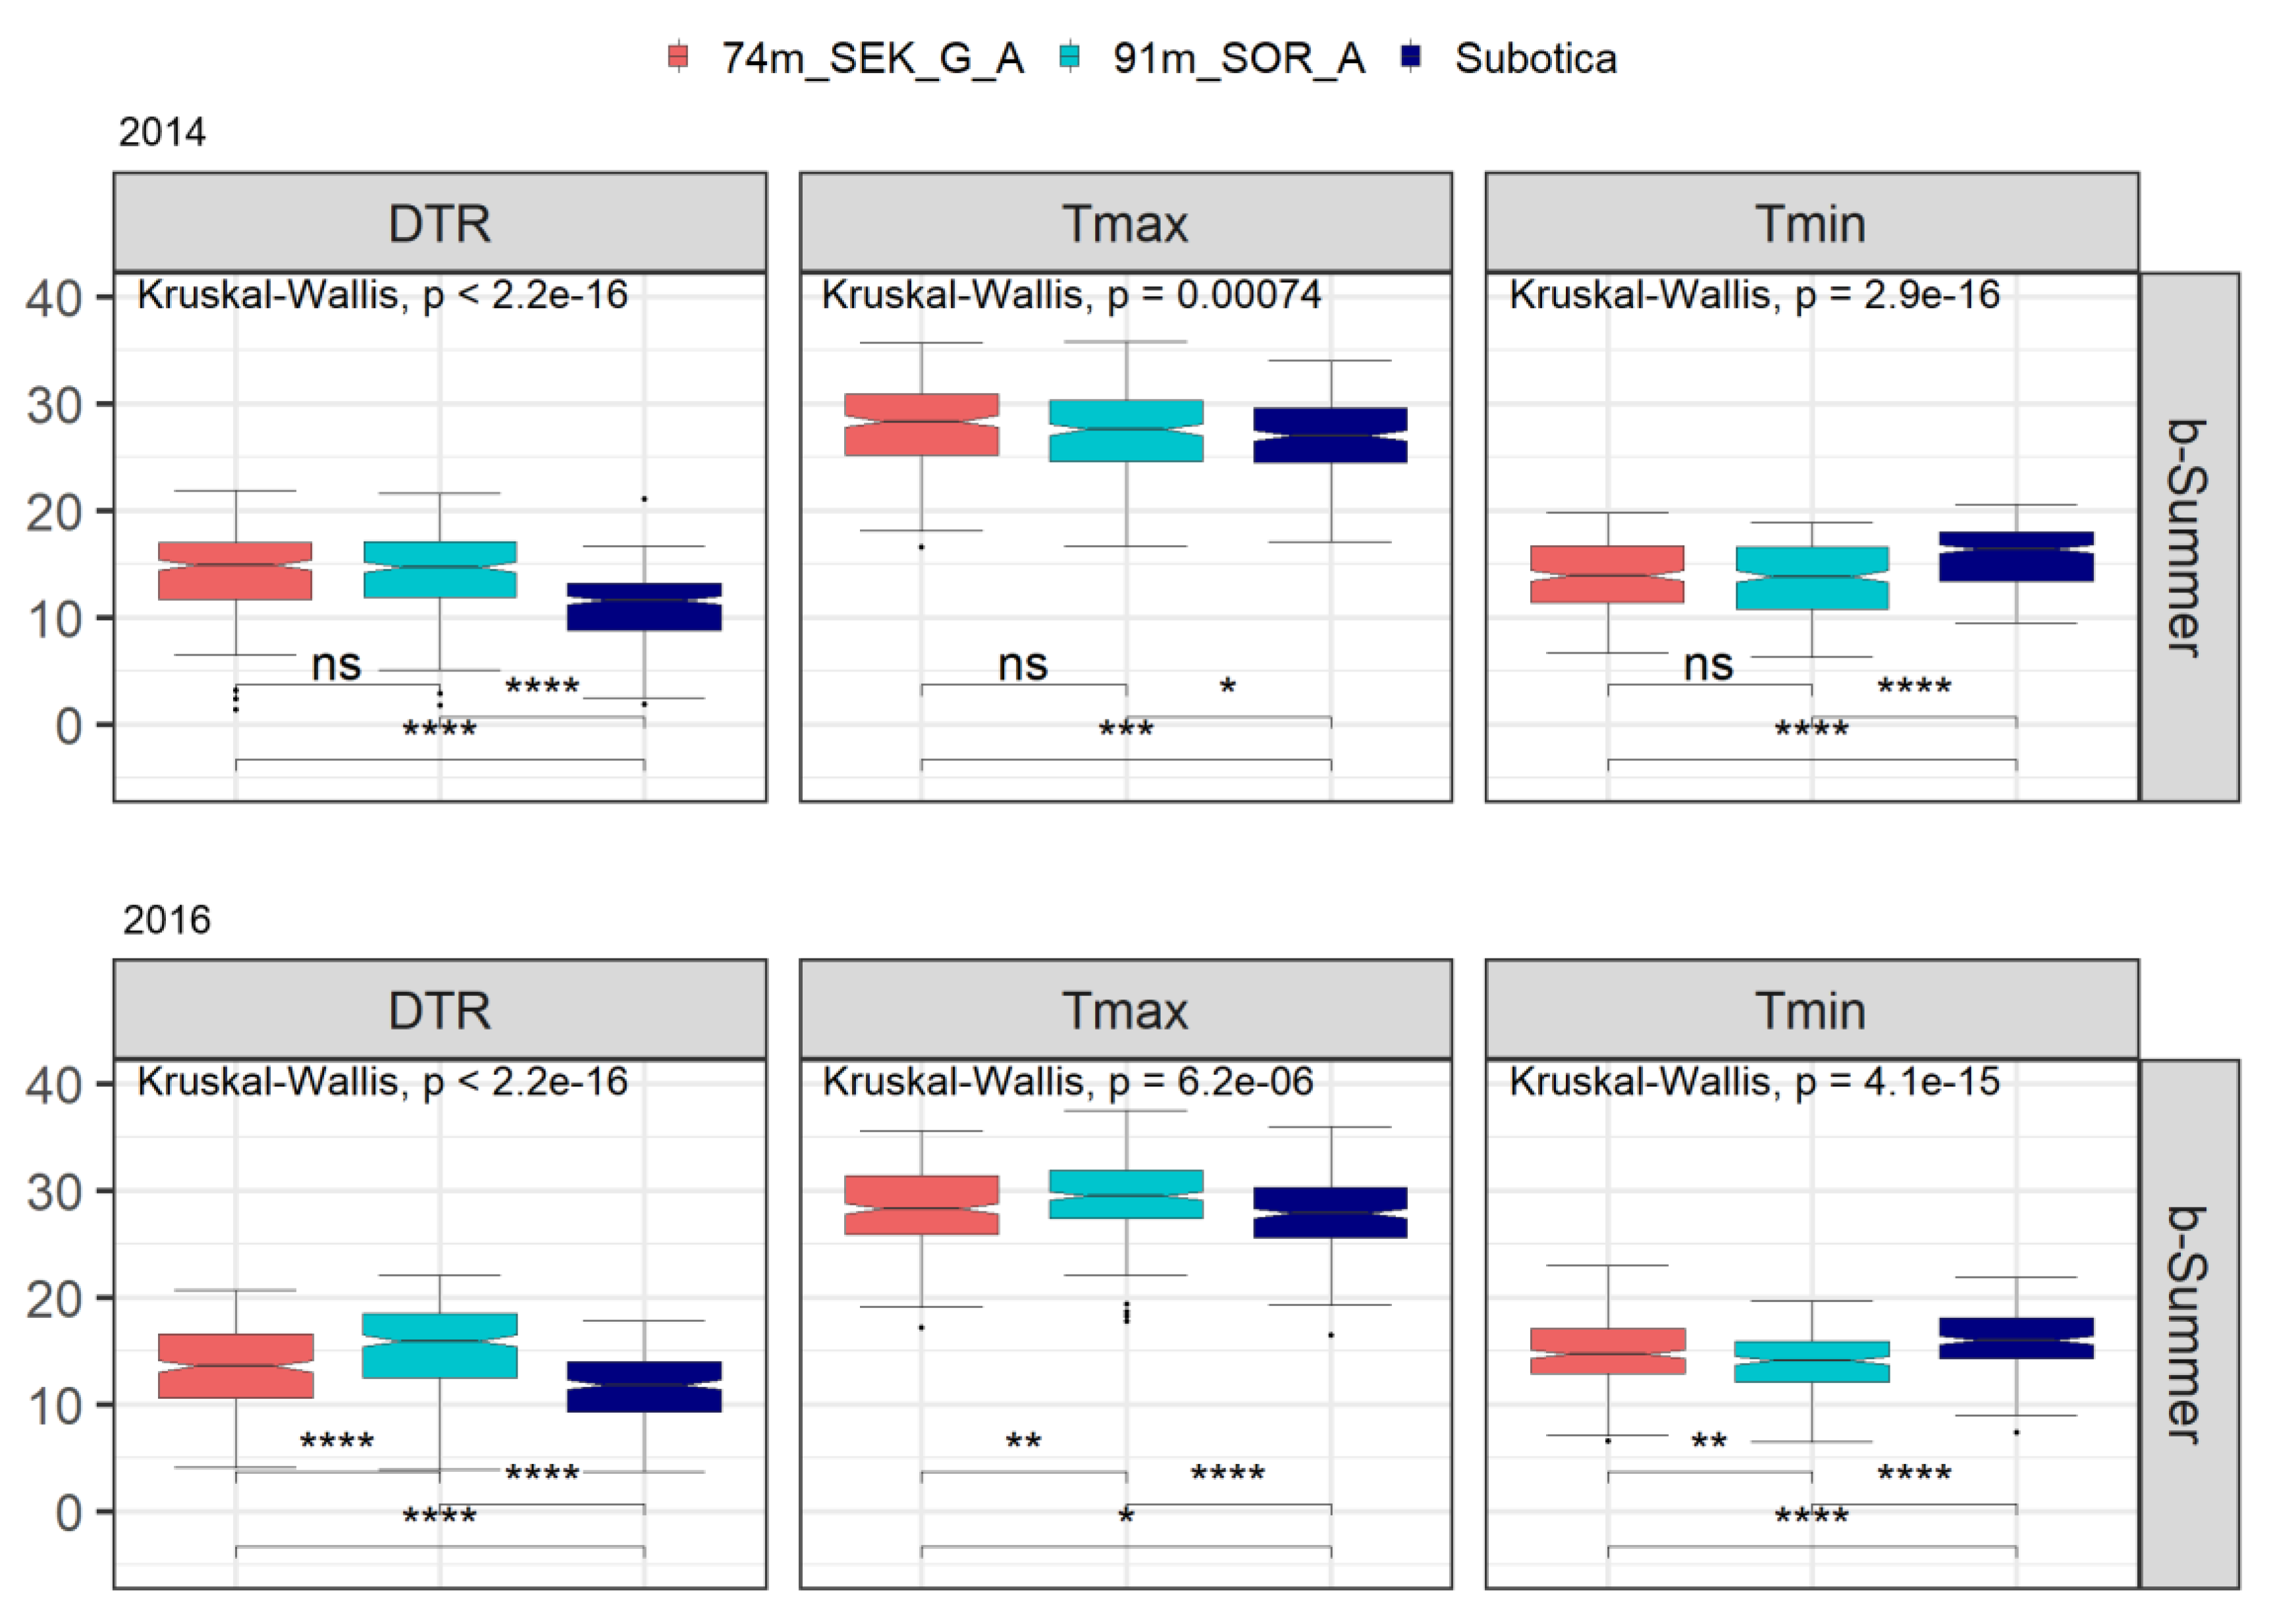
3.2. Small-Scale Variability of Temperature Extremes
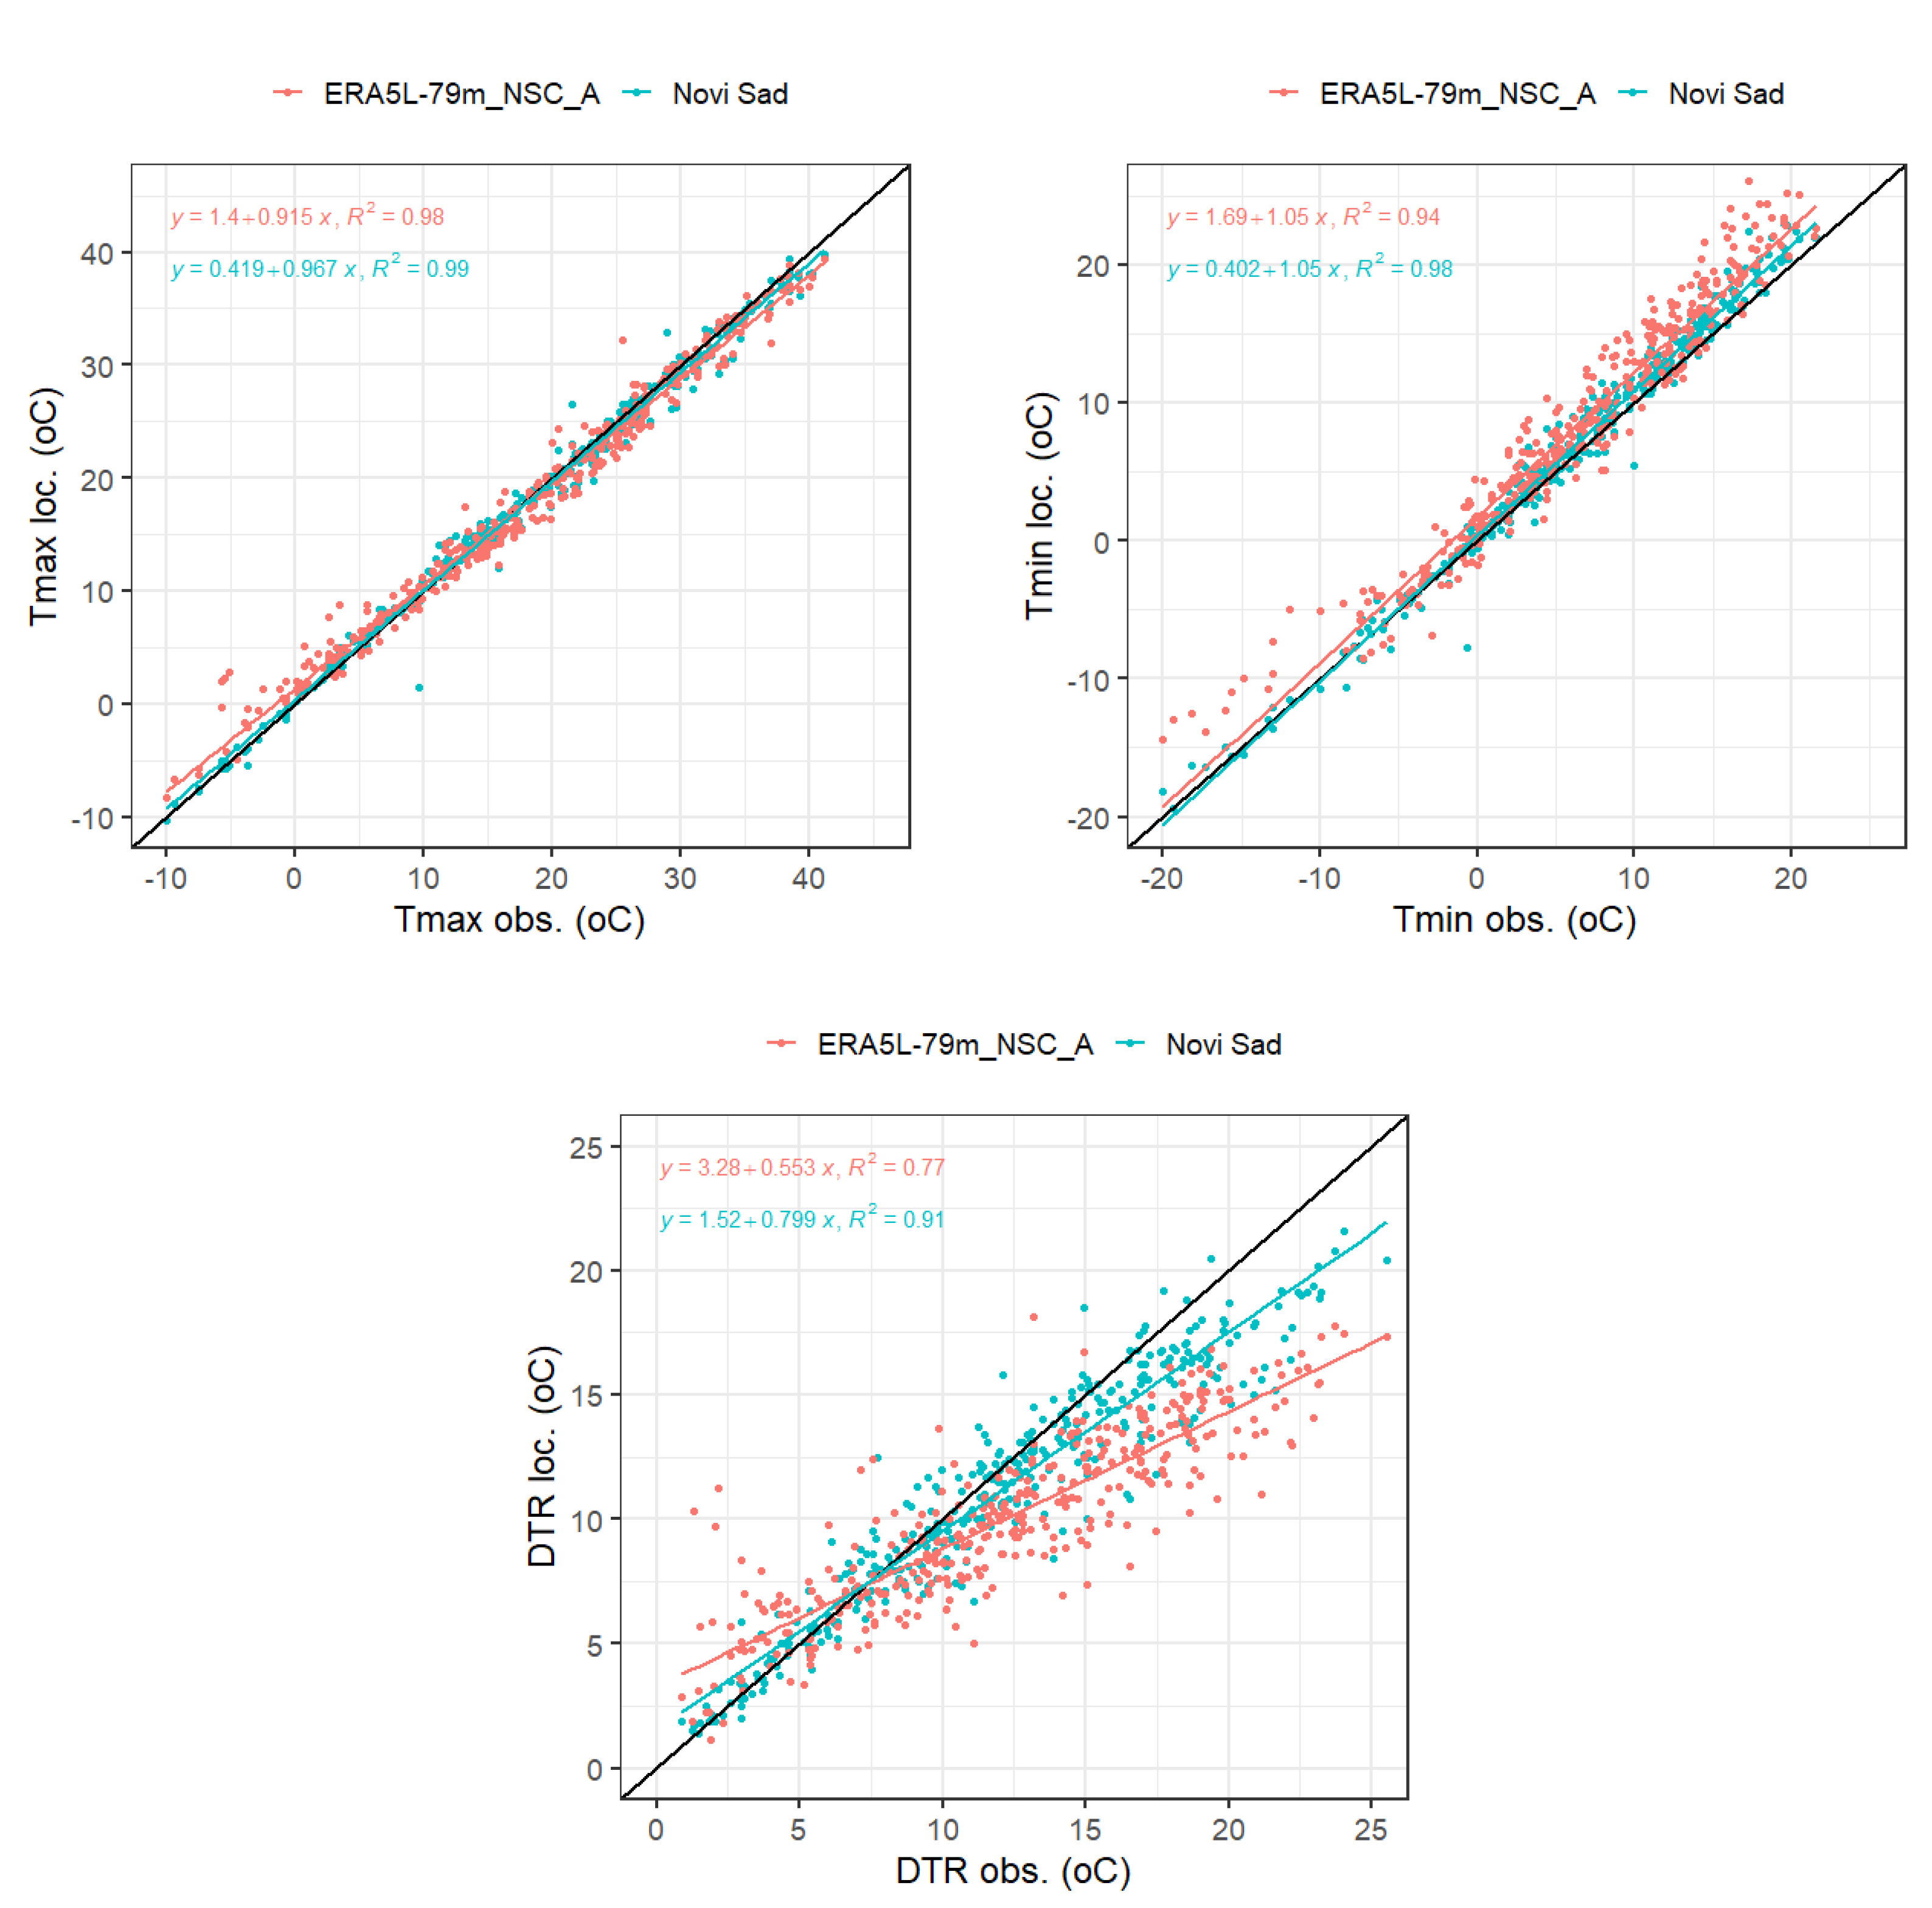
3.3. Observed Temperature Extremes in Field vs. Climate Station and Reanalysis Data
4. Conclusions
Supplementary Materials
Author Contributions
Funding
Institutional Review Board Statement
Informed Consent Statement
Data Availability Statement
Acknowledgments
Conflicts of Interest
References
- Ferrez, J.; Davison, A.C.; Rebetez, M. Extreme Temperature Analysis under Forest Cover Compared to an Open Field. Agric. For. Meteorol. 2011, 151, 992–1001. [Google Scholar] [CrossRef]
- Aussenac, G. Interactions between Forest Stands and Microclimate: Ecophysiological Aspects and Consequences for Silviculture. Ann. For. Sci. 2000, 57, 287–301. [Google Scholar] [CrossRef]
- Lalic, B.; Eitzinger, J.; Dalla Marta, A.; Orlandini, S.; Firanj Sremac, A.; Pacher, B. Agricultural Meteorology and Climatology. In Manuali—Scienze Tecnologiche, 1st ed.; Firenze University Press: Florence, Italy, 2018; Volume 8, ISBN 978-88-6453-795-5. [Google Scholar]
- Hatfield, J.L.; Prueger, J.H. Temperature Extremes: Effect on Plant Growth and Development. Weather Clim. Extrem. 2015, 10, 4–10. [Google Scholar] [CrossRef] [Green Version]
- Fitzjarrald, D.R.; Lala, G.G. Hudson Valley Fog Environments. J. Appl. Meteorol. Climatol. 1989, 28, 1303–1328. [Google Scholar] [CrossRef] [Green Version]
- Snyder, R.L.; de Melo-Abreu, J.P. Frost Protection: Fundamentals, Practice and Economics. In Environment and Natural Resources Series; Food and Agriculture Organization of the United Nations: Rome, Italy, 2005; ISBN 978-92-5-105328-7. [Google Scholar]
- Groot, A.; Carlson, D.W. Influence of Shelter on Night Temperatures, Frost Damage, and Bud Break of White Spruce Seedlings. Can. J. For. Res. 1996, 26, 1531–1538. [Google Scholar] [CrossRef]
- Willems, F.M.; Scheepens, J.F.; Ammer, C.; Block, S.; Bucharova, A.; Schall, P.; Sehrt, M.; Bossdorf, O. Effects of Forest Management on the Phenology of Early-Flowering Understory Herbs. Ecology 2019. [Google Scholar] [CrossRef] [Green Version]
- Zhao, P.; Zhang, X.; Li, S.; Kang, S. Vineyard Energy Partitioning Between Canopy and Soil Surface: Dynamics and Biophysical Controls. J. Hydrometeorol. 2017, 18, 1809–1829. [Google Scholar] [CrossRef]
- Landsberg, J.J.; Powell, D.B.B.; Butler, D.R. Microclimate in an Apple Orchard. J. Appl. Ecol. 1973, 10, 881–896. [Google Scholar] [CrossRef]
- Středa, T.; Litschmann, T.; Středová, H. Relationship between Tree Bark Surface Temperature and Selected Meteorological Elements. Contrib. Geophys. Geod. 2015, 45, 299–311. [Google Scholar] [CrossRef] [Green Version]
- Hatfield, J.L.; Prueger, J.H. Agroecology: Implications for Plant Response to Climate Change. In Crop Adaptation to Climate Change; John Wiley & Sons, Ltd.: Hoboken, NJ, USA, 2011; pp. 27–43. ISBN 978-0-470-96092-9. [Google Scholar]
- Racsko, J.; Schrader, L.E. Sunburn of Apple Fruit: Historical Background, Recent Advances and Future Perspectives. Crit. Rev. Plant. Sci. 2012, 31, 455–504. [Google Scholar] [CrossRef]
- Dalhaus, T.; Schlenker, W.; Blanke, M.M.; Bravin, E.; Finger, R. The Effects of Extreme Weather on Apple Quality. Sci. Rep. 2020, 10, 7919. [Google Scholar] [CrossRef] [PubMed]
- Bonta, J. Offender risk assessment—guidelines for selection and use. Crim. Justice Behav. 2002, 29, 355–379. [Google Scholar] [CrossRef]
- Michaels, P.J.; Balling, R.; Vose, R.S.; Knappenberger, P.C. Analysis of trends in the variability of daily and monthly historical temperature measurements. Clim. Res. 1998, 10, 27–33. Available online: https://www.int-res.com/articles/cr/10/c010p027.pdf (accessed on 29 December 2020). [CrossRef] [Green Version]
- Gregory, J.M.; Mitchell, J.F.B. Simulation of Daily Variability of Surface Temperature and Precipitation over Europe in the Current and 2 × CO2 Climates Using the UKMO Climate Model. Q. J. R. Met. Soc. 1995, 121, 1451–1476. [Google Scholar] [CrossRef]
- Hersbach, H.; ERA5: The New Reanalysis of Weather and Climate Data. Science Blog ECMWF. Available online: https://www.ecmwf.int/en/about/media-centre/science-blog/2017/era5-new-reanalysis-weather-and-climate-data (accessed on 28 April 2021).
- Muñoz-Sabater, J.; Dutra, E.; Agustí-Panareda, A.; Albergel, C.; Arduini, G.; Balsamo, G.; Boussetta, S.; Choulga, M.; Harrigan, S.; Hersbach, H.; et al. ERA5-Land: A State-of-the-Art Global Reanalysis Dataset for Land Applications. Earth Syst. Sci. Data 2021, 13, 4349–4383. [Google Scholar] [CrossRef]
- Oses, N.; Azpiroz, I.; Marchi, S.; Guidotti, D.; Quartulli, M.G.; Olaizola, I. Analysis of Copernicus’ ERA5 Climate Reanalysis Data as a Replacement for Weather Station Temperature Measurements in Machine Learning Models for Olive Phenology Phase Prediction. Sensors 2020, 20, 6381. [Google Scholar] [CrossRef]
- Pelosi, A.; Terribile, F.; D’Urso, G.; Chirico, G. Comparison of ERA5-Land and UERRA MESCAN-SURFEX Reanalysis Data with Spatially Interpolated Weather Observations for the Regional Assessment of Reference Evapotranspiration. Water 2020, 12, 1669. [Google Scholar] [CrossRef]
- Lalic, B.; Marcic, M.; Sremac, A.F.; Eitzinger, J.; Koci, I.; Petric, T.; Ljubojevic, M.; Jezerkic, B. Landscape Phenology Modelling and Decision Support in Serbia. In Landscape Modelling and Decision Support; Mirschel, W., Terleev, V.V., Wenkel, K.-O., Eds.; Innovations in Landscape Research; Springer International Publishing: Cham, Switzerland, 2020; pp. 567–593. ISBN 978-3-030-37420-4. [Google Scholar]
- Keserović, Z.; Magazin, N.; Kurjakov, A.; Dorić, M.; Gošić, J. Popis Poljoprivrede 2012. Poljoprivreda u Republici Srbiji. Voćarstvo; Republički Zavod za Statistiku: Beograd, Serbian, 2014; ISBN 978-86-6161-118-6. [Google Scholar]
- Glickman, T.S. Glossary of Meteorology, 2nd ed.; American Meteorological Society: Boston, MA, USA, 2000; ISBN 978-1-878220-34-9. [Google Scholar]
- Lin, X.; Hubbard, K.G. What Are Daily Maximum and Minimum Temperatures in Observed Climatology? Int. J. Climatol. 2008, 28, 283–294. [Google Scholar] [CrossRef]
- Svetunkov, I.; Smooth: Forecasting Using State Space Models. R Package Version 2.6.0. Available online: https://CRAN.R-project.org/package=smooth (accessed on 28 May 2021).
- Alexander, L.V.; Zhang, X.; Peterson, T.C.; Caesar, J.; Gleason, B.; Klein Tank, A.M.G.; Haylock, M.; Collins, D.; Trewin, B.; Rahimzadeh, F.; et al. Global Observed Changes in Daily Climate Extremes of Temperature and Precipitation. J. Geophys. Res. 2006, 111, D05109. [Google Scholar] [CrossRef] [Green Version]
- Meier, U. Growth Stages of Mono and Dicotyledonous Plants: BBCH Monograph. Available online: https://www.openagrar.de/receive/openagrar_mods_00042351 (accessed on 29 December 2020).
- Živkovic, B.; Nejgebauer, V.; Tanasijevic, D.J.; Miljkovic, N.; Stojkovic, L.; Drezgic, P. Soils of Vojvodina; Institute for Agricultural Research: Novi Sad, Serbia, 1972. [Google Scholar]
- SoilGrids and WoSIS. Available online: https://soilgrids.org/ (accessed on 28 April 2021).
- RHMSS Annual Bulletin for Serbia the Year 2018. Available online: http://www.hidmet.gov.rs/data/klimatologija/eng/2018.pdf (accessed on 15 June 2021).
- Parker, W.S. Reanalyses and Observations: What’s the Difference? Bull. Am. Meteorol. Soc. 2016, 97, 1565–1572. [Google Scholar] [CrossRef] [Green Version]
- Kruskal, W.H.; Wallis, W.A. Use of Ranks in One-Criterion Variance Analysis. J. Am. Stat. Assoc. 1952, 47, 583–621. [Google Scholar] [CrossRef]
- Simoni, S.; Padoan, S.; Nadeau, D.F.; Diebold, M.; Porporato, A.; Barrenetxea, G.; Ingelrest, F.; Vetterli, M.; Parlange, M.B. Hydrologic Response of an Alpine Watershed: Application of a Meteorological Wireless Sensor Network to Understand Streamflow Generation. Water Resour. Res. 2011, 47. [Google Scholar] [CrossRef] [Green Version]
- Taylor, K.E. Summarizing Multiple Aspects of Model Performance in a Single Diagram. J. Geophys. Res. 2001, 106, 7183–7192. [Google Scholar] [CrossRef]
- Akter, M.; Miah, M.A.; Hassan, M.M.; Mobin, M.N.; Baten, M.A. Textural Influence on Surface and Subsurface Soil Temperatures under Various Conditions. J. Environ. Sci. Nat. Resour. 2015, 8, 147–151. [Google Scholar] [CrossRef] [Green Version]
- Decker, M.; Brunke, M.A.; Wang, Z.; Sakaguchi, K.; Zeng, X.; Bosilovich, M.G. Evaluation of the Reanalysis Products from GSFC, NCEP, and ECMWF Using Flux Tower Observations. J. Clim. 2012, 25, 1916–1944. [Google Scholar] [CrossRef]
- Johannsen, F.; Ermida, S.; Martins, J.; Trigo, I.F.; Nogueira, M.; Dutra, E. Dutra Cold Bias of ERA5 Summertime Daily Maximum Land Surface Temperature over Iberian Peninsula. Remote Sens. 2019, 11, 2570. [Google Scholar] [CrossRef] [Green Version]
- Betts, A.K.; Chan, D.Z.; Desjardins, R.L. Near-Surface Biases in ERA5 over the Canadian Prairies. Front. Environ. Sci. 2019, 7, 129. [Google Scholar] [CrossRef]
- Lompar, M.; Lalić, B.; Dekić, L.; Petrić, M. Filling Gaps in Hourly Air Temperature Data Using Debiased ERA5 Data. Atmosphere 2019, 10, 13. [Google Scholar] [CrossRef] [Green Version]


| Short Name | AWS Location | Latitude/ Longitude | Elev. (m) | Orchard | Interval | Age/ Height | Cover Crop | Density | Soil | Row Orientation | Notes | |
|---|---|---|---|---|---|---|---|---|---|---|---|---|
| R1—South Backa | 79m_NSC_A | Novi Sad, Cenej | 45.36/ 19.81/ | 79 | Apple | 9 February 2013 19 November 2018 | 17 y. 3 m | No | Semi-intensive1.8 m × 4 m | Chernozem calcareous (micelar) on loess terrace (clay loam) | NW-SE | |
| 80m_NSK_A | Novi Sad, Kac | 45.29/ 19.90 | 80 | Apple | 8 July 2017 31 December 2018 | - 1 | - | - | Aluvial il (clay loam) | NW-SE | ||
| 78m_VRV_Pl | Vrbas, Vrbas | 45.56/ 19.64 | 78 | Plum | 11 April 2013 8 April 2016 | - | - | - | Chernozemlike meadow soil on loess terrace (clay loam) | NW-SE | ||
| 135m_NSN_Pr | Novi Sad, Nestin | 45.23/ 19.47 | 135 | Pear | 2 October 2012 31 December 2018 | 15 y. 3 m | No | Semi-intensive 2 m × 4 m | Chernozem calsareous brownized (clay loam) | N-S | Danube on 300m Fruska Gora | |
| 151m_NSC_G_Pe | Novi Sad, Cerevic | 45.22/ 19.66/ | 151 | Peach | 1 January 2016 4 October 2017 | 12 y. 2.5 m | Yes | - | Chernozem calsareous brownized (clay loam) | NNW-SEE | Danube on 600m Fruska Gora | |
| Climatological station | Novi Sad | 19.85/ 45.33 | 84 | Chernozem calsareous brownized (clay loam) | ||||||||
| R2—North Backa and Banat | 91m_SOR_A | Sombor, Ridjica | 45.99/ 19.09/ | 91 | Apple | 27 June 2011 31 December 2018 | 4 y. 2 m 2 | No | Semi intensive 2 m × 4 m | Chernozem on sandy loess (sandy loam) | NNW-SEE | Kiđoš river 1.5 km |
| 91m_SBV_Pe | Subotica, Bac. Vinogradi | 46.11/ 19.88 | 90.5 | Peach | 1 January 2016 31 December 2018 | - | - | - | Soloncak (sandy clay loam) | WSW-ENE | ||
| 74m_SEK_G_A | Senta, Kanjiza | 46.05/ 20.07 | 74 | Apple | 24 February 2011 31 December 2018 | 20 y. 3 m | Yes | Semi intensive 2 m × 3 m | Black limeless soil (clay) | NNW-SEE | Tisa river 3 km | |
| 119m_SLJ_A | Subotica, Ljutovo | 46.08/ 19.52 | 119 | Apple | 8 March 2014 31 December 2018 | - | - | - | Chernozemlike medow soil on loess plateau (sandy loam) | NNW-SEE | ||
| Climatological station | Subotica (Palic) | 19.15 45.77 | 102 | Black limeless soil on sand (sandy loam) | ||||||||
| R3—South Banat | 82m_CRC_A | Crvena Crkva | 44.90/ 21.36 | 82 | Plum | 1 January 2013 23 December 2016 | - | - | - | Chernozem brown (clay loam) | NNE-SSW | |
| 127m_PBK_A | Pancevo, Ban. Karlovac | 45.03/ 21.03 | 127 | Apple | 16 January 2013 14 December 2016 | - | - | - | Chernozem calcareous (micelar) on loess plateau (sandy loam) | NNE-SSW | ||
| 80m_BCT_G_A | Bela Crkva, Tirovo | 44.89/ 21.42 | 80 | Apple | 24 March 2015 31 December 2018 | 22 y. 2.5 m | Yes | - | Alluvial sandy soil (loamy sand) | W-E | ||
| Climatological station | Vrsac | 21.32 45.15 | 83 | Black limeless soil (clay) | ||||||||
| R4—Central Banat | 71m_KIK_Pl | Kikinda, Kikinda | 45.86/ 20.53 | 71 | Plum | 22 April 2012 31 December 2018 | 15 y. 3 m | No | - | Black limeless soil on sand (sandy loam) | NE-SW | |
| 74m_ZRS_A | Zrenjanin, Sutjeska | 45.39/ 20.69 | 74 | Plum/ Apple (2016) | 8 December 2011 31 December 2018 | 20 y. 25 y. | No | - | Chernozemlike medow soil on loess terrace (sandy clay loam) | N-S | Concrete terrace | |
| 85m_ZNM_A | Zrenjanin, Novo Milosevo | 45.71/ 20.37 | 85 | Apple | 8 March 2013 1 October 2017 | - | - | - | Chernozem calcareous (micelar) on loess terrace (clay loam) | NNE-SSW | ||
| Climatological station | Kikinda | 20.46 45.83 | 81 | Chernozemlike medow soil on loess plateau (sandy loam) | ||||||||
| R5—Srem | 94m_SMK_G_Pr | Sr. Mitrovica, Kukujevci | 44.92/ 19.75 | 94 | Pear | 23 January 2014 31 December 2018 | - | Yes | - | Pararendzina soils on loess (sandy loam) | NE-SW | |
| 125m_SMD_A | Sr. Mitrovica, Divos | 44.99/ 19.61 | 125 | Apple | 6 November 2014 31 December 2018 | - | - | - | Chernozem calsareous brownized (clay loam) | WNW-ESE | ||
| 145m_RNS_G_Pe | Ruma, N. Slankamen | 45.14/ 20.23 | 145 | Peach | 1 January 2016 24 March 2017 | - | Yes | - | Pararendzina soils on loess (sandy loam) | NNE-SSW | Danube on 100 m, Fruska Gora | |
| Climatological station | Sr. Mitrovica | 19.55 45.10 | 82 | Chernozem calsareous brownized (clay loam) | ||||||||
| Spring | Summer | Autumn | Winter | |||||
|---|---|---|---|---|---|---|---|---|
| Tmax | Tmin | Tmax | Tmin | Tmax | Tmin | Tmax | Tmin | |
| 2013 | 0.1 | 0.4 | 1.3 | 0.5 | 1.0 | 1.2 | 1.2 | 1.9 |
| 2014 | 1.0 | 1.3 | −0.1 | 0.3 | 0.9 | 2.4 | 3.7 | 3.3 |
| 2015 | 0.5 | 0.2 | 2.6 | 1.6 | 0.8 | 1.3 | 1.4 | 2.4 |
| 2016 | 0.9 | 0.8 | 0.6 | 0.8 | 0.1 | −0.1 | 1.9 | 1.2 |
| 2017 | 1.5 | 0.4 | 3.3 | 1.2 | 0.6 | 0.7 | 0.4 | −0.8 |
| 2018 | 2.4 | 2.0 | 1.3 | 1.9 | 3.0 | 1.4 | 1.1 | 1.5 |
| Static/Dynamic | Variable | Selected AWS | Specific to Orchard | Identified Impact | Causal Pathway | Associated Figures |
|---|---|---|---|---|---|---|
| St | Soil texture | 74m_SEK_G_A 91m_SOR_A | No | Yes | Daily soil temperature variation decreases in order sand > loam > peat > clay producing air Tmax and Tmin in the same order [36] | Figure 5, Figures S1.1 and S1.2 |
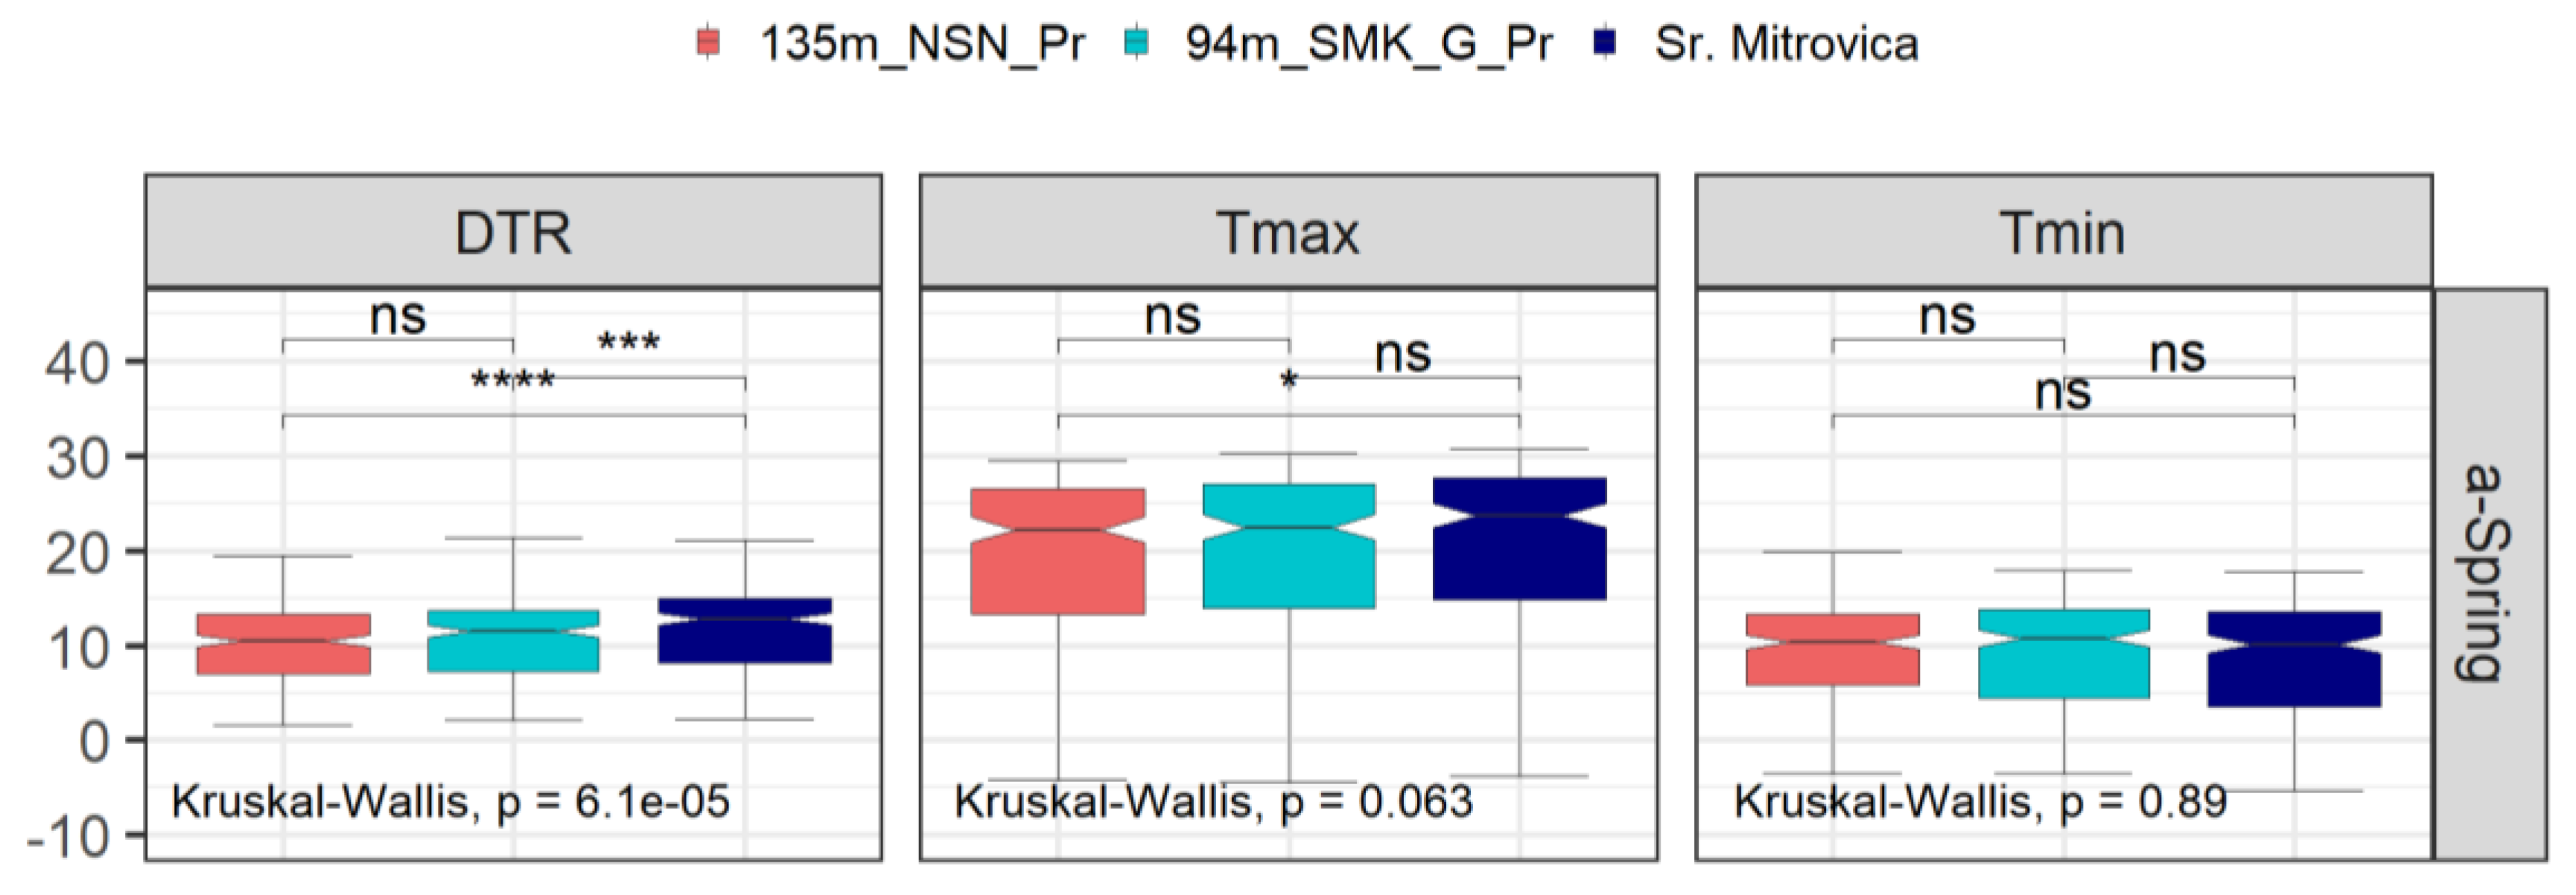
| St | Orography | 94m_SMK_G_Pr 135m_NSN_Pr | No | No | South-facing slopes have higher sun exposure | Figure 6, Figures S1.3 and S1.4 |
| St | Row orientation | - | Yes | No | The W-E-oriented rows have higher soil sun exposure | |
| St | Elevation | All stations | No | Yes | Standard temperature decrees with elevation 0.7 °C/100 m | Figure 8 and Figures S2.1–S2.5 |
| Dy | Cover crop phenology | 74m_SEK_G_A 91m_SOR_A 94_SMK_G_Pr 135m_NSN_Pr | Yes | Yes | The presence of a short cover crop lowers the Tmax and Tmin. Vineyard and orchards with the cover crop are typically between 0 °C and 0.5 °C colder than one with bare soil [6] | Figure 5, Figures S1.1 and S1.2 Figure 6, Figures S1.3 and S1.4 |
| Dy | Tree phenology | All stations | Yes | Yes | The increase of LAI minimizes Tmax and Tmin variation during the vegetation period | Figure 7, Figures S1.5 and S1.6 |
| Dy | Tree age | 74m_SEK_G_A 91m_SOR_A | Yes | Yes | The increase of LAI and closed tree crown minimize Tmax and Tmin variation during the vegetation period | Figure 5, Figures S1.1 and S1.2 |
| Spring | Summer | Fall | Winter | ||||||
|---|---|---|---|---|---|---|---|---|---|
| AV | SD | AV | SD | AV | SD | AV | SD | ||
| R1 | Tmax | 18.5 | 6.9 | 28.6 | 4.8 | 18.5 | 6.8 | 6.2 | 5.3 |
| Tmin | 7.9 | 4.8 | 15.9 | 3 | 8.2 | 4.9 | −0.1 | 4.4 | |
| DTR | 10.6 | 4.4 | 12.7 | 4.0 | 10.3 | 4.5 | 6.3 | 3.4 | |
| R2 | Tmax | 18.3 | 7.1 | 29.2 | 4.5 | 17.6 | 7.2 | 5.3 | 4.9 |
| Tmin | 6.1 | 5.2 | 14.6 | 3.2 | 6.4 | 5.1 | −1.6 | 4.6 | |
| DTR | 12.1 | 4.8 | 14.6 | 4.3 | 11.1 | 5.3 | 6.9 | 3.6 | |
| R3 | Tmax | 18.2 | 6.9 | 29.3 | 4.8 | 17.8 | 7.4 | 6.8 | 5.3 |
| Tmin | 8 | 5.9 | 15.4 | 3.4 | 8 | 5.9 | 0.1 | 4.8 | |
| DTR | 11.0 | 5.3 | 13.9 | 4.8 | 9.8 | 5.2 | 6.6 | 3.8 | |
| R4 | Tmax | 19.2 | 6.6 | 29.1 | 4.6 | 18.3 | 7.1 | 5.7 | 5 |
| Tmin | 7.9 | 4.7 | 15.8 | 3.2 | 8.2 | 5.1 | −0.4 | 4.6 | |
| DTR | 11.3 | 5.1 | 13.8 | 4.3 | 10.1 | 4.9 | 6.1 | 3.6 | |
| R5 | Tmax | 18.5 | 7.3 | 28.8 | 4.8 | 17.4 | 7.3 | 5.8 | 5.8 |
| Tmin | 7.5 | 4.9 | 16.6 | 3.4 | 7.1 | 5.4 | −1 | 4.9 | |
| DTR | 11.0 | 4.9 | 12.7 | 4.3 | 10.3 | 5.1 | 6.8 | 3.8 | |
| R1 | R2 | R3 | R4 | R5 | |||
|---|---|---|---|---|---|---|---|
| Tmax | AWS | SD | 10.2 | 10.4 | 10.3 | 10.2 | 9.8 |
| ERA5-Land | SD | 9.1 | 9.3 | 9.1 | 9.2 | 9.3 | |
| RMSE | 2.0 | 1.9 | 2.6 | 2.1 | 1.9 | ||
| R | 0.99 | 0.99 | 0.99 | 0.98 | 0.98 | ||
| Clim. Stat. | SD | 9.6 | 10.0 | 9.5 | 9.8 | 9.7 | |
| RMSE | 1.4 | 1.1 | 1.5 | 1.5 | 1.1 | ||
| R | 0.99 | 1.00 | 0.99 | 0.99 | 0.99 | ||
| Tmin | AWS | SD | 7.0 | 7.1 | 7.1 | 7.1 | 7.1 |
| ERA5-Land | SD | 7.6 | 7.8 | 7.6 | 7.7 | 7.9 | |
| RMSE | 2.5 | 2.9 | 2.9 | 2.4 | 2.1 | ||
| R | 0.97 | 0.97 | 0.95 | 0.97 | 0.97 | ||
| Clim. Stat. | SD | 7.2 | 7.4 | 7.6 | 7.3 | 7.3 | |
| RMSE | 1.3 | 1.7 | 2.5 | 1.2 | 1.7 | ||
| R | 0.99 | 0.98 | 0.95 | 0.99 | 0.97 | ||
| DTR | AWS | SD | 5.3 | 5.4 | 5.7 | 5.3 | 4.6 |
| ERA5-Land | SD | 3.3 | 3.1 | 3.3 | 3.1 | 3.3 | |
| RMSE | 3.8 | 4.3 | 4.9 | 3.8 | 2.9 | ||
| R | 0.84 | 0.86 | 0.84 | 0.85 | 0.81 | ||
| Clim. Stat. | SD | 4.4 | 4.8 | 4.9 | 4.4 | 4.8 | |
| RMSE | 2.1 | 2.0 | 3.1 | 2.0 | 2.1 | ||
| R | 0.94 | 0.94 | 0.88 | 0.94 | 0.92 |
Publisher’s Note: MDPI stays neutral with regard to jurisdictional claims in published maps and institutional affiliations. |
© 2021 by the authors. Licensee MDPI, Basel, Switzerland. This article is an open access article distributed under the terms and conditions of the Creative Commons Attribution (CC BY) license (https://creativecommons.org/licenses/by/4.0/).
Share and Cite
Firanj Sremac, A.; Lalic, B.; Cuxart, J.; Marcic, M. Maximum, Minimum, and Daily Air Temperature Range in Orchards: What Do Observations Reveal? Atmosphere 2021, 12, 1279. https://doi.org/10.3390/atmos12101279
Firanj Sremac A, Lalic B, Cuxart J, Marcic M. Maximum, Minimum, and Daily Air Temperature Range in Orchards: What Do Observations Reveal? Atmosphere. 2021; 12(10):1279. https://doi.org/10.3390/atmos12101279
Chicago/Turabian StyleFiranj Sremac, Ana, Branislava Lalic, Joan Cuxart, and Milena Marcic. 2021. "Maximum, Minimum, and Daily Air Temperature Range in Orchards: What Do Observations Reveal?" Atmosphere 12, no. 10: 1279. https://doi.org/10.3390/atmos12101279
APA StyleFiranj Sremac, A., Lalic, B., Cuxart, J., & Marcic, M. (2021). Maximum, Minimum, and Daily Air Temperature Range in Orchards: What Do Observations Reveal? Atmosphere, 12(10), 1279. https://doi.org/10.3390/atmos12101279