Abstract
The Yarlung Zangbo River is the largest river on the Tibetan Plateau and a major international river in South Asia. Changes in the blue and green water resources in its basin are of great importance to the surrounding local and Asian regions in the context of global warming. This research used the Soil and Water Assessment Tool model to estimate blue and green flows (BWF and GWF) and analyze the spatial-temporal distribution characteristics under different hypothetical climate change scenarios. The results show that (1) the multi-year average BWF in the middle and upper reaches of the Yarlung Zangbo River Basin is 176.2 mm, the GWF is 213.1 mm, and the difference between precipitation and total water resources is only 5.4 mm; (2) both BWF and GWF in this basin showed a slightly increasing trend from 1980 to 2010, but the distribution of subbasins from upstream to downstream is decreasing; and (3) GWF has a positive correlation with both precipitation and temperature, but BWF only increases with precipitation and decreases with increasing temperature. Moreover, the change in blue and green water resources is more sensitive to the changes in precipitation than to changes in the temperature.
1. Introduction
Climate change and measures to address it have emerged as critical issues in today’s society. Similarly, the impact of water resources in the context of climate change has emerged as one of the most active research areas in hydrology. Previous studies have demonstrated that climate change is not only affecting precipitation, evapotranspiration, soil moisture, and runoff but is also affecting the distribution of water resources both spatially and temporally [1,2,3]. With the intensification of global climate change, the changes in hydrological elements have become increasingly significant, while extreme hydrological events are becoming more frequent [4,5], posing numerous challenges to the regional water cycle and water resource management. Therefore, research on the impact of climate change on watershed resources is critical in the changing environment. In traditional water resource management, surface runoff, also known as blue water resources, has attracted more attention, while green water resources, which are closely related to the ecological environment, have been paid relatively little research [6,7]. In fact, green water resources account for the majority of water use, with more than 60% of the water used for global food production coming from green water, and ecosystems such as forests and grasslands rely almost entirely on it [8]. As a result, research into green water resources in watersheds must be prioritized.
The concept of blue and green water resources was introduced by Falkenmark [9] in the 1990s to assess the impact of water resources on agricultural production processes in semi-arid areas. All rivers, lakes, reservoirs, wetlands, and aquifers that are recharged by the surface are considered blue water resources or blue water flow (BWF). Green water resources are divided into two categories: green water flow (GWF) and green water storage (GWS) [10,11]. GWF includes plant emanation and subsurface evaporation, while green water storage refers to the water stored in the soil. The concept of BWF and GWF introduces a new way of thinking about the evaluation, management, and planning of water resources in a watershed and a shift in how people think about water resources.
Currently, the main methods for estimating BWF are statistical analysis and hydrological modeling [12]; however, there are relatively more methods that can be used to estimate GWF: biological, hydrological modeling, and coupled biological–hydrological modeling [13,14]. Furthermore, hydrological models are one of the methods that can evaluate both blue and green water resources at the same time. The Soil and Water Assessment Tool model (SWAT) is the most commonly used method for estimating water resources, and it has a good application effect in the analysis of their specific gravity and spatial-temporal distribution characteristics [6,7]. For example, Faramarzi et al. [15] used the SWAT model in combination with the Sequential Uncertainty Fitting program (SUFI-2) to calibrate and validate a hydrologic model of Iran, taking into consideration dam operations and irrigation practices. Yuan et al. [7] used the SWAT and the China meteorological assimilation driving datasets for the SWAT model (CMADS) to estimate blue and green water flows in the Erhai Lake Basin. Therefore, using the SWAT model is an effective way to analyze the changes of water resources in a basin.
The Qinghai–Tibet Plateau, which is also known as Asia’s “water tower”, is the birthplace of many rivers, including the Yangtze, Yellow, and Yarlung Zangbo River, and it is vital to the surrounding areas and the global hydrological cycle. Climate change is a serious issue right now, and the Tibetan Plateau region has received a lot of attention from the international and scientific communities because of its unique geographical location [16,17,18]. According to studies, the rapid melting and retreating of glaciers on the Qinghai–Tibet Plateau due to global warming has resulted in frequent glacial lake outbursts, debris flow disasters, and river floods, all of which have serious consequences for people’s production and lives [19,20,21]. Therefore, it is necessary to assess the impact of climate change on the water resources in the watersheds of the Tibetan Plateau region. However, in previous studies, most studies have focused on the impact of precipitation changes on BWF [22,23]. In fact, temperature is also a major factor that can influence water resources, especially GWF. For example, as temperatures rise, surface evaporation and crop water use rise, causing changes in water resources [24]. In this paper, the middle and upper reaches of the Yarlung Zangbo River in the south-central region of the Qinghai–Tibet Plateau were chosen as the study area, the effect of climate change on the spatial-temporal distribution characteristics of blue and green water resources in this basin was studied using the SWAT model, which can provide a scientific foundation for water resource planning and ecological protection in this basin.
2. Study Area and Data
2.1. Study Area
The Yarlung Zangbo River, which flows through southern Tibet, is one of the world’s highest rivers and is an international river. It originates from the Jema Yangtse Glacier in the Himalayas of China’s southern Tibet Autonomous Region into India via Pasighat in Murdoch County (known as the Brahmaputra in India). The total length of the main stream is about 3100 km, and the basin area is approximately 627,000 km2, whereas the length of the main stream in China is 2057 km, and the basin area is about 330,200 km2. The middle and upper reaches of the Yarlung Zangbo River, which are located above the Yangcun hydrological station, are the study area of this paper (Figure 1).
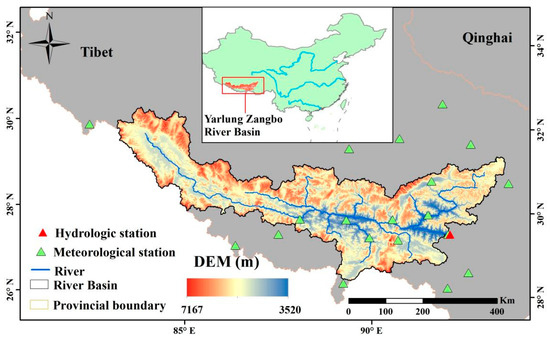
Figure 1.
Map of the middle and upper reaches of the Yarlung Zangbo River Basin.
Because the topography of the Yarlung Zangbo River Basin is complex, with significant differences in elevation, spatially, the climate shows a geographic pattern of being dry and cold upstream, while presenting a warm and wet climate downstream [25]. The high-altitude areas in the basin’s upper reaches, for example, are cold and rainless, with an annual average temperature of about 0–3 °C, with the annual precipitation being less than 300 mm; the middle reaches are warm and rainy, with an annual average temperature of 4.7–8.6 °C and annual precipitation of 300–600 mm. Furthermore, precipitation throughout the year follows an alternating pattern of dry and wet, with the wet season (June to September) accounting for 65% to 80% of the annual precipitation, with precipitating being scarce in the dry season (October to April).
2.2. Data
The data used in this paper are mainly the input data for the SWAT model and the hydro-meteorological data for runoff simulation validation, including digital elevation model (DEM) data with a spatial resolution of 30 m (http://www.gscloud.cn/ (accessed on 28 December 2020)), land use/cover (LULC) data with a resolution of 30 m from GLC30 of 2010 (http://www.globallandcover.com/ (accessed on 10 January 2021)), and soil data from the World Soil Data Set (HWSD) (http://www.fao.org/home/en/ (accessed on 10 January 2021)). The meteorological data are the daily values from 19 measured meteorological stations in and around the Yarlung Zangbo River Basin, and the runoff data are monthly data from the Yangcun hydrologic station on the main stream, all for the period from 1980 to 2010.
3. Method
As shown in Figure 2, the climate change sensitivity analysis of the BWF and GWF based on the SWAT model in the middle and upper Yarlung Zangbo River was conducted using the following steps: (1) constructing a SWAT model based on space remote sensing data and measured meteorological data; (2) using the SWAT-CUP for parameter sensitivity analysis to determine watershed parameters and to obtain original runoff simulation results; (3) changing the precipitation or temperature according to climate change scenarios and building the model to obtain simulation results; (4) assessing the impact of climate change on the amount of blue and green water resources in the basin by comparing the simulation results of various climate change scenarios to those of step (3).
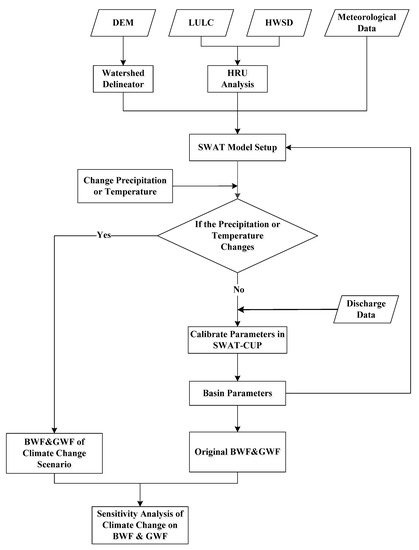
Figure 2.
Methodological workflow for the climate change sensitivity analysis of the BWF and GWF in Yarlung Zangbo River.
3.1. Water Availability Estimated by SWAT Model
The SWAT model is a distributed, basin-scale, hydrological model developed by the Agricultural Research Service of the United States Department of Agriculture [26]. It can simulate and forecast the long-term impacts of different land uses, volatile hydrological runoff, silt transfer, and water contamination. Recently, this model has been widely applied for the management water resources in meso- and micro-scale basins [27]. In the SWAT model, the study basins are comprised of many subbasins that are further divided into multiple hydrological response units (HRUs). Each HRU is composed of a combination of land cover and soil. The water balance in the model is expressed as follows:
where PREC is the precipitation, mm; ET is the actual evapotranspiration, i.e., the GWF mm; is the change of soil water content, and SW is the infiltration of the precipitation and soil water storage variables over a certain period of time, i.e., the GWS, mm; is the relative change in the underground aquifers, mm; LOSS is the amount of water lost in the hydrological process from precipitation to flow production, mm; WYLD is the amount of water yielded by the hydrological corresponding unit pooled into the river through the sub-basin, i.e., the BWF, mm; and SURG, LATQ, and GWQ are surface runoff, side discharge, and subsurface aquifer recharge, respectively. Over a long period of time, the total water volume change in a closed watershed has a value of zero, and we can obtain:
To verify the fitness of simulated runoff to be measured, three parameters commonly used to determine the effect of hydrological models, including the determination coefficient (R2), the Nash–Sutcliffe efficiency coefficient (NS), and relative error (RE) [28], were selected to measure the accuracy of the simulation results. The value of R2, when it is between 0 and 1, can reflect the linear correlation between the simulated and the measured values, and the closer R2 is to 1, the better the simulation effect. In addition to being used to evaluate the simulation effect, NS can reflect the fitting effect at the peak value. When NS = 1, the fitting effect is the best, and when NS = 0, the simulation results are close to the average observation level. RE reflects the differences between the simulated and measured runoff in terms of total quantity, which shows the balanced error. The simulated result is reliable when the fitted flow has NS > 0.5 and RE < ±15%. The computation formula below shows calculations where Qo and Qs are the measured and simulated runoff, respectively.
3.2. Climate Change Scenario
This study used three scenario simulations to assess the impact of climate change on GWF and BWF by varying one factor at a time and by keeping the other factor constant. The first simulation assessed the multi-year average BWF and GWF using measured meteorological data such as precipitation and temperature; the second considered the effect of precipitation on blue and green water flow by holding other factors constant and by increasing the original precipitation by −30% to 30% with an interval of 10%; the third considered the effect of temperature on blue and green water flow by changing the temperature by −3 to 3 °C with an interval of 1 °C. The estimated values of the sequential scenarios were then compared to the multi-year values, and the amount of change in BWF and GWF reflects the impact of climate change on blue and green water resources. The specific contents of the scenario settings are shown in Table 1.

Table 1.
The climate change scenario settings.
4. Results and Discussion
4.1. Performance Evaluation of SWAT Simulation
The Yangcun hydrological station in the main stream of this basin was used as the control station, and the measured monthly discharge data from 1980 to 2010 were used to verify the model simulation performance, where 1980–1998 was the calibration period, and 1999–2010 was the validation period. Through parameter sensitivity analysis, we identified 11 main parameters in the SWAT-CUP parameter calibration model, and the calibration results are shown in Table 2.
Table 2.
The main parameters of the calibration process in the middle and upper reaches of the Yarlung Zangbo River.
Based on the calibration parameters, a simulation of the watershed runoff production process was performed. The simulation results (Table 3 and Figure 3) show that the R2 between the measured and simulated discharge values is greater than 0.89 during both the calibration and validation periods, the NS is greater than 0.87, and the RE is within 15%. This means that the SWAT model simulations in the middle and upper reaches of the Yarlung Zangbo River are very effective. According to Equations (1) and (2), which are based on SWAT simulation output results, the multi-year average precipitation from 1980 to 2010 estimated by the model is 383.9 mm, the BWF is 176.2 mm, the GWF is 211.8 mm, and the GWS is 1.3 mm. The difference between the precipitation and the total water resources is only 5.4 mm and accounts for 1.4% of the total precipitation from that time period, according to the principles of the water balance equation (Equation (3)).
Table 3.
The calibration and validation statistics of Yangcun station.
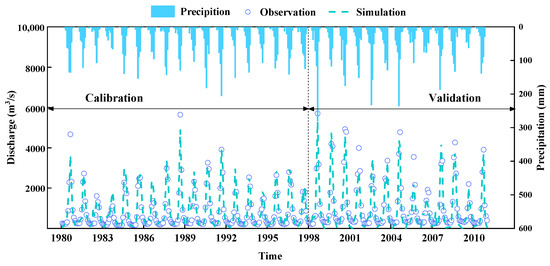
Figure 3.
The process line of simulated and measured discharge in Yangcun station.
4.2. Spatial—Temporal Distribution of Blue and Green Water Resources
As shown in Figure 4, the BWF and GWF in the middle and upper Yarlung Zangbo River region all have a slight upward trend from 1980 to 2010. BWF has a coefficient of variation (Cv) of 0.21 and a range of 113.6 to 258.8 mm. The maximum value occurred in 1998, and there was a significant change with large fluctuations between 1997 and 2001. The GWF was less variable than the BWF, having a coefficient of variation Cv of 0.08 and ranging from 174.9 to 243.7 mm. The highest value of GWF was recorded in 2008. The green water coefficient (GWC), denoted by GWC = GWF/(BWF + GWF), is used to account for the relative importance of BWF and GWF [13]. With the exception of other periods when it was relatively stable, it also varied slightly around 1998, ranging between 0.46 and 0.63. Prior research indicates that the strongest El Nino event in nearly 60 years occurred from May 1997–May 1998, the warmest year in China since 1980, which resulted in mega-floods in several Chinese basins and in the Yangtze River basin in particular [29,30,31]. This could have contributed to the large fluctuations in the blue and green flow that occurred around 1998.
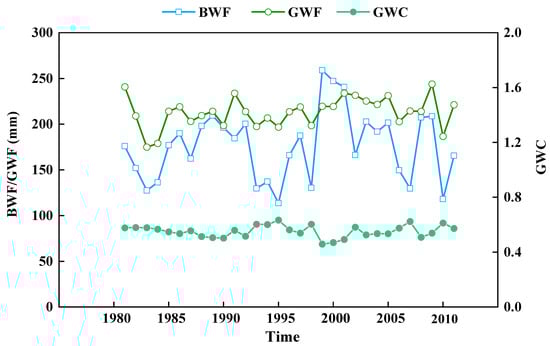
Figure 4.
Time series of blue water flow (BWF), green water flow (GWF), and green water coefficient (GWC) from 1980 to 2010 in the middle and upper reaches of the Yarlung Zangbo River.
Figure 5 shows that both the BWF and GWF show a decreasing trend from upstream to downstream, with the maximum BWF and GWF in the upper Qinlongzangbu basin, Naxungzangbu basin, and Lhasa River basin, with the BWF exceeding 250 mm and the GWF reaching over 300 mm. For the GWC, there is no obvious pattern in the distribution across the entire space, and the maximum value appears in the uppermost reaches, reaching more than 0.7.

Figure 5.
Spatial distribution of multi-year average values of (a) BWF, (b) GWF, and (c) GWC in the middle and upper reaches of the Yarlung Zangbo River Basin from 1980 to 2010.
4.3. Impact of Climate Change on Blue and Green Water Flow
The impact of climate change on BWF and GWF was evaluated by varying precipitation and temperature sequentially. As shown in Figure 6, both the BWF and GWF increased with precipitation, and the BWF increased more than the GWF. For example, a 10% increase in precipitation would change the BWF by 18%, while the GWF would only increase by about 3%. Additionally, this means that the GWC is negatively correlated with precipitation. By changing the temperature, the GWF shows a positive trend with the temperature value, while the BWF shows a negative correlation with it; when there is a greater in the temperature, the change in the BWF smaller. Although the GWC increases with increasing temperature, the magnitude of change is smaller than that of changing precipitation, indicating that the impact of the temperature on the GWC is significantly lower than that of precipitation. The same findings can be found in the studies of Jones et al. [32], Yuan et al. [7], and Zhang et al. [33]. These studies also concluded that precipitation is positively correlated with each runoff component and that precipitation has a greater effect on the runoff component changes than temperature does.
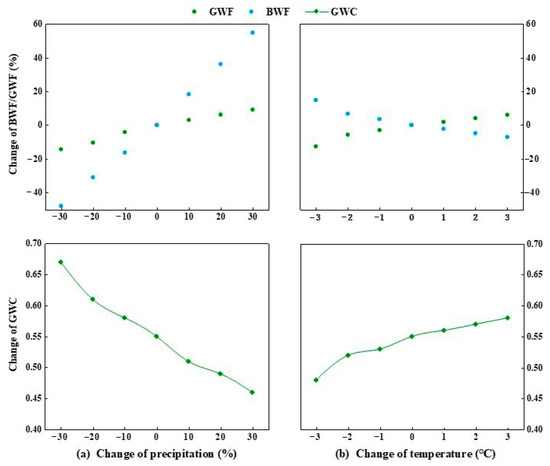
Figure 6.
Effects of (a) precipitation and (b) temperature change on BWF, GWF, and GWC in in the middle and upper reaches of the Yarlung Zangbo River.
As shown in Figure 7, when the precipitation changes, the spatial distribution characteristics of the BWF and GWF changes are essentially the same. The most noticeable changes are in the Yarlung Zangbo River source area, where both the BWF and GWF are the most sensitive to precipitation changes. However, there are differences in the spatial characteristics of the sensitivity of BWF and GWF to temperature change. For GWF, the area that is the most sensitive to temperature change in the Qinlongzangbu basin and in the Naxungzangbu baisn, and these locations are downstream of the source area, while the BWF area that is the most sensitive to temperature change is the main source area. The primary reason for this is that river sources are mostly fed by melt water, and the amount of snowmelt fluctuates greatly with temperature changes [34], making the BWF in the Yarlung Tsangpo River’s source area more sensitive to temperature changes than the other sub-basins.
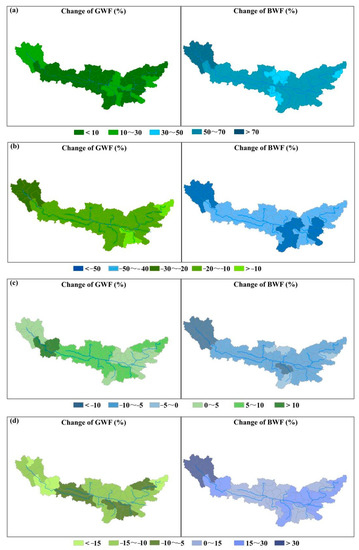
Figure 7.
Changes in the amount of GWF and BWF in the middle and upper Yarlung Zangbo River under different scenarios: (a) 30% increase in precipitation; (b) 30% decrease in precipitation; (c) 3 °C increase in temperature; (d) 3 °C decrease in temperature.
The current research focuses on the sensitivity of various types of water resources to changes in precipitation and temperature as well as the spatial variability of this sensitivity. However, the impact of climate change on the amount of BWF and GWF in the Yarlung Zangbo River has not been studied using future climate models and scenarios, which are also one of the methods that can be used to analyze the impact of climate change on water quantity in the basin. Based on Coupled Model Intercomparison Project Phases 5 and 6 (CMIP5 and CMIP6), Wang et al. [35] studied the effects of temperature and precipitation changes on wet-season runoff in several watersheds on the Tibetan Plateau, including the middle and upper reaches of the Yarlung Zangbo River. The results showed that precipitation and runoff (i.e., BWF) changes are positively correlated, and the response of runoff changes to precipitation changes is stronger than that of temperature changes, which is consistent with the findings of this study.
5. Conclusions
Based on the SWAT model and multiple hypothetical climate change scenarios, the impact of climate change on blue and green water flow in the middle and upper Yarlung Zangbo River was investigated. According to this research, the following conclusions have been made:
In the runoff simulation, the R2 of the simulated and the measured runoff value is greater than 0.89, the NS is greater than 0.87, and the RE is less than 15%. The SWAT estimated that the multi-year average BWF in the middle and upper reaches of the Yarlung Zangbo River Basin is 176.2 mm, the GWF is 213.1 mm, the GWC is 0.55, and the difference between the precipitation and total water resources is only 5.4 mm.
From 1980–2010, both the BWF and GWF in the middle and upper reaches of the Yarlung Zangbo River showed a slightly increasing trend, with a variation coefficient (Cv) of 0.21 for BWF; GWF had a variation coefficient Cv of 0.08; and GWC ranged from 0.46 to 0.63. In terms of spatial distribution, the BWF and GWF show a decreasing trend from upstream to downstream, and the upper reaches of the main stream Qinlongzangbu basin, Naxungzangbu basin, and the middle reaches of the Lhasa River basin have the maximum values.
Both BWF and GWF increase with the increasing precipitation of the whole basin, but the GWC is negatively correlated with precipitation. When the temperature rises, the smaller the change in the BWF is and the greater the change in the GWF is. Meanwhile, the GWC is more sensitive to precipitation changes than temperature changes. The spatial distribution characteristics of the BWF and GWF changes are generally consistent, with the most obvious changes in the source area, where both BWF and GWF are the most sensitive to changes in precipitation and temperature.
Author Contributions
Conceptualization, J.H., D.Z. and X.Q.; methodology, J.H. and Z.Y.; formal analysis, X.Q.; data curation, Z.Y. and Y.T.; validation, D.Z., writing—original draft preparation, X.Q. and Y.T.; funding acquisition, J.H. All authors have read and agreed to the published version of the manuscript.
Funding
This research was funded by the National Natural Science Foundation of China, grant number 41890824 and the National Public Research Institutes for Basic R&D Operating Expenses Special Project, grant number CKSF2019433/SZ.
Institutional Review Board Statement
Not applicable.
Informed Consent Statement
Not applicable.
Data Availability Statement
Not applicable.
Conflicts of Interest
The authors declare no conflict of interest.
References
- Montaldo, N.; Oren, R. Changing Seasonal Rainfall Distribution with Climate Directs Contrasting Impacts at Evapotranspiration and Water Yield in the Western Mediterranean Region. Earth’s Future 2018, 6, 841–856. [Google Scholar] [CrossRef]
- Sun, J.; Li, Y.P.; Zhuang, X.W.; Jin, S.W.; Huang, G.H.; Feng, R.F. Identifying water resources management strategies in adaptation to climate change under uncertainty. Mitig. Adapt. Strat. Glob. 2018, 23, 553–578. [Google Scholar] [CrossRef]
- Feng, H. Individual contributions of climate and vegetation change to soil moisture trends across multiple spatial scales. Sci. Rep.-UK. 2016, 6, 32782. [Google Scholar] [CrossRef] [Green Version]
- Tabari, H. Climate change impact on flood and extreme precipitation increases with water availability. Sci. Rep. 2020, 10, 13768. [Google Scholar] [CrossRef]
- Vicente-Serrano, S.M.; Zabalza-Martínez, J.; Borràs, G.; López-Moreno, J.I.; Pla, E.; Pascual, D.; Savé, R.; Biel, C.; Funes, I.; Azorin-Molina, C.; et al. Extreme hydrological events and the influence of reservoirs in a highly regulated river basin of northeastern Spain. J. Hydrol. Reg. Stud. 2017, 12, 13–32. [Google Scholar] [CrossRef]
- Yuan, Z.; Xu, J.; Wang, Y. Historical and future changes of blue water and green water resources in the Yangtze River source region, China. Theor. Appl. Climatol. 2019, 138, 1035–1047. [Google Scholar] [CrossRef]
- Yuan, Z.; Xu, J.; Meng, X.; Wang, Y.; Yan, B.; Hong, X. Impact of Climate Variability on Blue and Green Water Flows in the Erhai Lake Basin of Southwest China. Water 2019, 11, 424. [Google Scholar] [CrossRef] [Green Version]
- Zhu, K.; Xie, Z.; Zhao, Y.; Lu, F.; Song, X.; Li, L.; Song, X. The Assessment of Green Water Based on the SWAT Model: A Case Study in the Hai River Basin, China. Water 2018, 10, 798. [Google Scholar] [CrossRef] [Green Version]
- Falkenmark, M. Land-water linkages: A synopsis. Land and water integration and river basin management. FAO Water Bull. 1995, 1, 15–16. [Google Scholar]
- Rodrigues, D.B.B.; Gupta, H.V.; Mendiondo, E.M. A blue/green water-based accounting framework for assessment of water security. Water Resour. Res. 2014, 50, 7187–7205. [Google Scholar] [CrossRef] [Green Version]
- Zang, C.F.; Liu, J.; van der Velde, M.; Kraxner, F. Assessment of spatial and temporal patterns of green and blue water flows under natural conditions in inland river basins in Northwest China. Hydrol. Earth Syst. Sc. 2012, 16, 2859–2870. [Google Scholar] [CrossRef] [Green Version]
- Schuol, J.R.; Abbaspour, K.C.; Yang, H.; Srinivasan, R.; Zehnder, A.A.J.B. Modeling blue and green water availability in Africa. Water Resour. Res. 2008, 7, 44. [Google Scholar] [CrossRef] [Green Version]
- Zhao, A.; Zhu, X.; Liu, X.; Pan, Y.; Zuo, D. Impacts of land use change and climate variability on green and blue water resources in the Weihe River Basin of northwest China. Catena 2016, 137, 318–327. [Google Scholar] [CrossRef]
- Giri, S.; Arbab, N.N.; Lathrop, R.G. Water security assessment of current and future scenarios through an integrated modeling framework in the Neshanic River Watershed. J. Hydrol. 2018, 563, 1025–1041. [Google Scholar] [CrossRef]
- Faramarzi, M.; Abbaspour, K.C.; Schulin, R.; Yang, H. Modelling blue and green water resources availability in Iran. Hydrol. Process. 2009, 23, 486–501. [Google Scholar] [CrossRef]
- Liu, X.; Chen, B. Climatic warming in the Tibetan Plateau during recent decades. Int. J. Climatol. 2000, 20, 1729–1742. [Google Scholar] [CrossRef]
- Wang, Y.; Zhang, Y.; Chiew, F.H.S.; McVicar, T.R.; Zhang, L.; Li, H.; Qin, G. Contrasting runoff trends between dry and wet parts of eastern Tibetan Plateau. Sci. Rep. 2017, 7, 15458. [Google Scholar] [CrossRef]
- Zhang, Y.; Xu, C.; Hao, Z.; Zhang, L.; Ju, Q.; Lai, X. Variation of Melt Water and Rainfall Runoff and Their Impacts on Streamflow Changes during Recent Decades in Two Tibetan Plateau Basins. Water 2020, 12, 3112. [Google Scholar] [CrossRef]
- Zhang, G.; Nan, Z.; Zhao, L.; Liang, Y.; Cheng, G. Qinghai-Tibet Plateau wetting reduces permafrost thermal responses to climate warming. Earth Planet Sci. Lett. 2021, 562, 116858. [Google Scholar] [CrossRef]
- Huang, Q.; Long, D.; Du, M.; Zeng, C.; Li, X.; Hou, A.; Hong, Y. An improved approach to monitoring Brahmaputra River water levels using retracked altimetry data. Remote Sens. Environ. 2018, 211, 112–128. [Google Scholar] [CrossRef]
- Chen, X.; Di, L.; Hong, Y.; Zeng, C.; Yan, D. Improved modeling of snow and glacier melting by a progressive two-stage calibration strategy with GRACE and multisource data: How snow and glacier meltwater contributes to the runoff of the Upper Brahmaputra River basin? Water Resour. Res. 2017, 53, 2431–2466. [Google Scholar] [CrossRef]
- Yang, Y.; Weng, B.; Man, Z.; Yu, Z.; Zhao, J. Analyzing the contributions of climate change and human activities on runoff in the Northeast Tibet Plateau. J. Hydrol. Reg. Stud. 2019, 27, 100639. [Google Scholar] [CrossRef]
- Zhang, Y.; Hao, Z.; Xu, C.; Lai, X. Response of melt water and rainfall runoff to climate change and their roles in controlling streamflow changes of the two upstream basins over the Tibetan Plateau. Hydrol. Res. 2020, 51, 272–289. [Google Scholar] [CrossRef] [Green Version]
- Hoekstra, A.Y. Green-blue water accounting in a soil water balance. Adv. Water Resour. 2019, 129, 112–117. [Google Scholar] [CrossRef]
- Li, H.; Liu, L.; Shan, B.; Xu, Z.; Niu, Q.; Cheng, L.; Liu, X.; Xu, Z. Spatiotemporal Variation of Drought and Associated Multi-Scale Response to Climate Change over the Yarlung Zangbo River Basin of Qinghai-Tibet Plateau, China. Remote Sens. 2019, 11, 1596. [Google Scholar] [CrossRef] [Green Version]
- Arnold, J.G.; Srinivasan, R.; Muttiah, R.S.; Williams, J.R. Large area hydrologic modeling and assessment part i: Model development. J. Am. Water Resour. Assoc. 1998, 34, 73–89. [Google Scholar] [CrossRef]
- Abbaspour, K.C.; Yang, J.; Maximov, I.; Siber, R.; Bogner, K.; Mieleitner, J.; Zobrist, J.; Srinivasan, R. Modelling hydrology and water quality in the pre-alpine/alpine Thur watershed using SWAT. J. Hydrol. 2007, 333, 413–430. [Google Scholar] [CrossRef]
- Gupta, H.V.; Sorooshian, S.; Yapo, P.O. Status of automatic calibration for hydrologic models: Comparison with multilevel expert calibration. J. Hydrol. Eng. 1999, 4, 135–143. [Google Scholar] [CrossRef]
- Zong, Y.; Chen, X. The 1998 Flood on the Yangtze, China. Nat. Hazards 2000, 22, 165–184. [Google Scholar] [CrossRef]
- Zhang, R.; Sumi, A.; Kimoto, M. A Diagnostic Study of the Impact of El Nifio on the Precipitation in China. Adv. Atmos. Sci. 1999, 16, 229–241. [Google Scholar] [CrossRef]
- Wang, S.; Zhu, J.; Cai, J. Interdecadal Variability of Temperature and Precipitation in China since 1880. Adv. Atmos. Sci. 2004, 21, 307–313. [Google Scholar]
- Jones, R.N.; Chiew, F.H.S.; Boughton, W.C.; Zhang, L. Estimating the sensitivity of mean annual runoff to climate change using selected hydrological models. Adv. Water Resour. 2006, 29, 1419–1429. [Google Scholar] [CrossRef] [Green Version]
- Zhang, X.; Xu, Y.; Hao, F.; Li, C.; Wang, X. Hydrological Components Variability under the Impact of Climate Change in a Semi-Arid River Basin. Water 2019, 11, 1122. [Google Scholar] [CrossRef] [Green Version]
- Cuo, L.; Zhang, Y.; Zhu, F.; Liang, L. Characteristics and changes of streamflow on the Tibetan Plateau: A review. J. Hydrol. Reg. Stud. 2014, 2, 49–68. [Google Scholar] [CrossRef] [Green Version]
- Wang, T.; Zhao, Y.; Xu, C.; Ciais, P.; Liu, D.; Yang, H.; Piao, S.; Yao, T. Atmospheric dynamic constraints on Tibetan Plateau freshwater under Paris climate targets. Nat. Clim. Chang. 2021, 11, 219–225. [Google Scholar] [CrossRef]
Publisher’s Note: MDPI stays neutral with regard to jurisdictional claims in published maps and institutional affiliations. |
© 2021 by the authors. Licensee MDPI, Basel, Switzerland. This article is an open access article distributed under the terms and conditions of the Creative Commons Attribution (CC BY) license (https://creativecommons.org/licenses/by/4.0/).