Abstract
This review focuses on providing the history of measurement efforts to quantify and characterize the compounds of reactive mercury (RM), and the current status of measurement methods and knowledge. RM collectively represents gaseous oxidized mercury (GOM) and that bound to particles. The presence of RM was first recognized through measurement of coal-fired power plant emissions. Once discovered, researchers focused on developing methods for measuring RM in ambient air. First, tubular KCl-coated denuders were used for stack gas measurements, followed by mist chambers and annular denuders for ambient air measurements. For ~15 years, thermal desorption of an annular KCl denuder in the Tekran® speciation system was thought to be the gold standard for ambient GOM measurements. Research over the past ~10 years has shown that the KCl denuder does not collect GOM compounds with equal efficiency, and there are interferences with collection. Using a membrane-based system and an automated system—the Detector for Oxidized mercury System (DOHGS)—concentrations measured with the KCl denuder in the Tekran speciation system underestimate GOM concentrations by 1.3 to 13 times. Using nylon membranes it has been demonstrated that GOM/RM chemistry varies across space and time, and that this depends on the oxidant chemistry of the air. Future work should focus on development of better surfaces for collecting GOM/RM compounds, analytical methods to characterize GOM/RM chemistry, and high-resolution, calibrated measurement systems.
1. Introduction
1.1. Discovery of GOM
Mercury (Hg) exists in the atmosphere as three forms: gaseous elemental (GEM), gaseous oxidized (GOM), and particulate-bound (PBM). Often, GOM and PBM concentrations are combined and collectively described as reactive Hg (RM). In the beginning, the atmospheric Hg research community focused on development of methods for GEM and did not know GOM existed. Now, GOM is known to be emitted from anthropogenic point sources and formed by atmospheric oxidation reactions of GEM with ozone (O3), hydroxyl radical (OH·), nitrate (NO3), hydrogen peroxide (H2O2), and/or halogen-containing compounds (Cl., Br., ClO, BrO, ClBr) [1,2]. A more recent paper by Saiz-Lopez et al. [3] provides an update on current thinking regarding our understanding with respect to reactions and points out, using a global model based on bromine-induced GEM oxidation that other oxidation mechanisms are needed in the troposphere to explain observations.
In 1979, Fogg and Fitzgerald [4] postulated that since GEM is not highly water soluble, concentrations measured in precipitation could not be explained by GEM alone. Kothny (1973) [5] suggested Hg adsorbed to aerosols was the Hg form present in precipitation. Brosset (1983) [6], based on equilibrium coefficients developed by Iverfeldt, noted that HgCl2 and CH3HgCl could explain observed concentrations. A mechanism for oxidation was proposed by Iverfeldt and Lindqvist [7] that entailed oxidation of GEM in water by ozone.
At the time, atmospheric Hg measurements were made using gold traps with a glass wool filter upstream to capture the particulate component. However, there were inconsistent results with the particulate filter. Research then focused on collecting GEM using gold surfaces such as gold-coated denuders [8,9] and gold-coated sand traps [10,11]. Currently, gold-coated sand traps are the standard method for measurement of GEM; there is still controversy as to whether this is a measurement of GEM or total gaseous Hg (TGM). The Global Mercury Observation System standard operating procedure states that a soda lime trap in front of the Tekran 2537 removes GOM, though this has not been adequately tested.
In 1996, in a critical review paper on Hg speciation in flue gases associated with coal combustion, Galbreath and Zygarlicke [12] pointed out that a variety of RM compounds should exist, including Cl-, O-, and S-based compounds. They also reported Hg(II) (oxidized) forms did exist in the flue gas, based on measurements using USA Environmental Protection Agency (EPA) Method 29, EPA Method 101A, and the modified Method 101A and laboratory tests. Lindberg et al. [13,14] suggested that if such oxidized forms of gaseous Hg persisted in ambient air, they had the potential to be significant contributors to Hg deposition.
1.2. Early Development of Methods
In 1995, a landmark paper was published that described the use of a mist chamber method for measuring RM and provided the first measurements of RM in ambient air [15]. A similar type of method had been attempted earlier by Brosset and Lord [16] using bubblers and long sampling times. Brosset and Lord [16] concluded that measured GOM was an artifact and better approaches were needed. The mist chamber used a single nebulizer nozzle, operated at a flow rate of 15 to 20 L min−1, and collected samples in 20 mL of solution [15]. Stratton and Lindberg [15] reported that one-hour samples contained 50 to 200 pg RM. The mist chamber was deployed at two locations, Tennessee and Indiana, and concentrations of 50 to 150 pg m−3 were reported; similar trends were observed under field conditions at the two sites, leading to the conclusion that the method provided reasonable results [15]. The main concerns with this method were artifacts associated with O3 and the presence of aerosols, which were extensively tested [15,17]. Artifact formation was considered sufficiently slow relative to sampling times. Data collected using the mist chamber method was significantly correlated with temperature, solar radiation, O3, SO2, and total gaseous Hg [18]. Additional work using the sampling system further demonstrated the utility of the method and the limited effect of artifacts on the measurements [18]. Two known drawbacks of the system were that it was not calibrated, and potential for artifacts could vary by sampling location.
At this same time, researchers were also testing the use of membranes for both PBM and GOM capture. Ebinghaus et al. [19] applied Teflon disc filters, Whatman quartz filters, and quartz wool plugs, or Au traps preceded by Au denuders for PBM, and ion exchange membranes for GOM measurements. PBM measured by the different methods ranged from 5 to 100 pg m−3 with the highest concentrations observed on gold traps after a denuder. Ion exchange membranes measured concentrations of 40 to 95 pg m−3, higher than denuder methods by 10 to 20 pg m−3 that were determined after liquid extraction. Munthe et al. [20] explored the use of microquartz fiber filters, cellular acetate, glass fiber, and Teflon filters for measurement of PBM; these results were quite variable.
Denuder methods for measuring GOM in ambient air were first pioneered by Oliver Lindqvist and his collaborators (e.g., Xiao et al. [8]; Feng et al. [21]). Their method utilized a KCl-coated tubular denuder, with GOM quantified using a liquid extraction. Comparison of the tubular and annular denuders showed similar recoveries in two studies in which the tubular denuder was liquid extracted and the annular denuder desorbed (Munthe et al. [20]; Nacht et al. [22]); Sommar et al. [23] reported lower GOM concentrations for annular denuders. In the Munthe et al. [20] intercomparison, mist chamber measurements were made, and concentrations agreed with those measured by the denuders. Nacht et al. [22] worked in a highly Hg contaminated location, reported RM concentrations of up to 75,000 pg m−3 with the highest values being above mine tailings.
In 2000, Steffen et al. [24] reported on the use of a cold regions pyrolysis unit manufactured by Tekran to allow for measurement of total gaseous mercury, while simultaneously measuring GEM. Their measurements were conducted during a Hg depletion event in the Arctic at Alert, Nunaurt, Canada. They observed that 48% of the converted GEM was measured as RM with the pyrolyzer unit and the rest deposited to snow.
Landis et al. [25] was the first to report on the use of an annular denuder in an automated system from which GOM could be thermally desorbed repeatedly to improve temporal resolution. During the period of denuder development, Landis et al. [25] and Xiao et al. [26] tested the efficiency of KCl denuders to collect permeated HgCl2, with the latter testing CH3HgCl as well. Neither study was conclusive; for example, Xiao et al. [26] utilized clean air, and the spiked GOM concentrations are not reported; while Landis et al. [25] data were limited (n = 2) and spike concentrations were one-to-two orders of magnitude higher than reported ambient concentrations (c.f. Valente et al. [27]). Feng et al. [21] reported limited laboratory tests of a tubular denuder loaded with hundreds to 1200 pg in three tests to determine breakthrough; however, the air used for the tests was not made clear. They used thermal desorption of the KCl denuders instead of liquid extraction The authors suggested that if a pyrolyzer was not used after desorption of the denuder that volatile or semi-volatile compounds trapped in the denuder would be released and deposit on the surface of the gold trap, risking passivation. Feng et al. [21] also recommended a denuder desorption temperature of 900 °C, due to the presence of a dual peak that they suggested was not a Hg compound, but volatile organic compounds that interfered with the analysis of Hg. No interference testing was reported in these studies. Feng et al. [21] commented on the fact that if water vapor condensed on the denuder, the sampling efficiency would decrease. Landis et al. [25] suggested that the temperature of the denuder be maintained at 50 °C to prevent hydrolysis of the KCl coating.
The Tekran® 2537/1130/1135 speciation system (Tekran system manufactured by Tekran, Toronto, Canada) was first introduced in 2002, and collects GEM, GOM, and PBM, respectively [25]. Ambient air entering the Tekran system first passes through an elutriator used to prevent coarse particles (>2.5 µm) from moving into the system; the flow rate of the system determines the particle cut size and must be routinely monitored and adjusted. Air then passes through the KCl denuder (1130 module, GOM capture) and subsequently through a quartz fiber filter (1135 module, PBM capture). Downstream of these modules is a pyrolyzer, packed with quartz chips, used to reduce GOM and PBM to GEM at predetermined intervals. Lastly, the air enters the 2537 module, which collects GEM by way of amalgamation on one of two gold-coated sand traps; the two traps are used to alternately collect and desorb Hg, allowing for continuous collection at 2.5 + min resolution (commonly 5 min). GEM is desorbed from the cartridges at 325 to 370 °C, then carried by argon to a quartz cell where Hg is quantified using cold vapor atomic fluorescence spectroscopy (CVAFS). The method detection limit for GEM is 0.1 ng m−3. While GEM is being measured, GOM and PBM are collected over 1 to 2 h. These operationally defined fractions are then sequentially thermally desorbed at 550 and 700 °C for GOM and PBM, respectively. GOM and PBM concentrations are quantified in Hg-free air after three flushing cycles without heating (system blank check), then one cycle of pyrolyzer heating, three cycles for desorbing the particulate filter, three cycles for desorbing the denuder, and two flushing cycles without heating to allow the system to cool. Desorbed GOM and PBM compounds pass through the pyrolyzer and are measured as GEM by the 2537. A soda lime trap is typically installed inline directly upstream of the 2537 inlet to prolong the life of the gold traps and is changed monthly. Typically, the 2537 module is calibrated every 24 h using an internal GEM permeation source, and less regularly using manual injections from an external GEM permeation source. It is noteworthy that calibrated 2537 units sampling the same air can generate concentrations that are up to 28% different (c.f., Gustin et al. [28]).
2. Early Method Intercomparisons
An early method comparison at Mace Head, Ireland, compared GOM measurements collected with the tubular denuder, and analyzed by liquid extraction, with those collected using ion exchange membranes with a quartz fiber filter upstream. These results showed that the denuder collected more GOM [19]; however, the quartz fiber filter could have influenced the amount of GOM collected on the ion exchange membrane [8,29,30]. Sheu and Mason [31] compared GOM concentrations measured using KCl annular denuders and ion exchange membranes, and also found higher GOM concentrations measured by the denuders; however, once again a quartz fiber filter preceded the ion exchange membrane. GOM can be reduced on a quartz fiber filter, especially in the presence of relative humidity (see discussion below). Additionally, comparison of GOM collected using KCl-coated quartz fiber filters with that collected by cation exchange membranes (CEM) showed less GOM collected by the quartz fiber filters [32].
Sheu and Mason [31] at the Chesapeake Biological Laboratory, located 80 km SSE of Washington, D.C., compared RM measurements from ambient air using KCl denuders, the mist chamber, and membranes. Membranes consisted of two polytetrafluoroethylene (PTFE) filters (47 mm diameter, 0.45 µm pore) in front of three cation exchange membranes (CEM) (47 mm diameter) housed in a five-stage filter holder. Unfortunately, the membranes were preceded by a long sampling inlet that we now know allows for deposition of RM and reduction to GEM (c.f. [28]). RM concentrations were measured every 2 h for the mist chamber, and 6 to 24 h for the membranes. Membrane and mist chamber concentrations were similar, but were lower than the denuder that sampled for 24 h. Comparing all methods over 3 days showed membrane and denuder RM concentrations to be higher than for the mist chamber. Concentrations measured at this location were as high as 550 pg m−3, but typically were 20 to 100 pg Hg m−3.
In a comparison of the mist chamber and annular KCl-coated denuder in Florida, the mist chamber reported 6.5 times higher RM concentrations relative to the denuder [25]. The difference was assumed to be an artifact due to PBM or reactions of GEM with acid used in the chamber. This conclusion, based on the works of Lindberg and Stratton [17] and Stratton and Lindberg [18], was not true, and the mist chamber measurement was likely more reliable than originally thought given what we now know about the KCl denuder collection efficiency (see below). Landis et al. [25] recommended that denuders should not collect GOM for more than 12 h without being purged to avoid decreases in sampling efficiency. It is noteworthy as part of National Atmospheric Deposition Program Atmospheric Mercury Network (NADP AMNet) protocol denuders are changed out every two weeks. During this study, denuder measurements were systematically sawtoothing, and it was not clear why, since denuders were changed every 2 to 4 h. Denuder measurements in this study showed GOM concentrations of 0 to 200 pg Hg m−3. A major limitation of the mist chamber was that it required constant attention and significant care to avoid contamination [18]. Thus, the Tekran system that involved less maintenance and oversight, became the method of choice for many researchers and management agencies.
3. Work Pointing to Issues with the Tekran Speciation System
The Tekran system, like the mist chamber, had no field calibration for GOM or PBM, and the behavior of denuders in ambient air was not fully explored prior to large-scale deployment in monitoring networks. Stratton and Lindberg [16] stated that denuders were under-sampling GOM. Weiss Penzias et al. [33] pointed out the data being collected by the instrument could not be fully explained. Others were concerned that a mass balance for air Hg concentrations could not be closed. For example, GOM concentrations increased when GEM concentrations decreased; however, GOM concentrations were not sufficient to account for GEM lost, and based on dry deposition rates, GOM concentrations should have increased. Choi et al. [34] pointed out that GOM measured by the KCl denuder could not fully explain GEM loss due to oxidizing processes. These claims are supported by ongoing work.
Lyman et al. [35] investigated the potential for an O3 interference associated with the Tekran system denuder and found the collection efficiency of permeated HgBr2 decreased by 12 to 30% at O3 concentrations of 6 to 100 ppb. The authors suggested reduction on the denuder wall by way of the following reaction: HgCl2 + 2O3 → Hg0 + 2O2 + 2ClO (ΔGr = −85 kj mole−1, reported in the Open Discussion of this paper). Their results also implied that longer O3 exposure led to less GOM recovery (10 to 26%, and 29 to 55% reduction in recovery for 2.5 and 30 min exposure to 30 ppb O3, respectively). Earlier work by Lynam and Keeler [30] noted that that the KCl denuder removes O3 and was highly efficient at low concentrations (95% removal at 28 ppb), but decreased as O3 concentrations increased (6% removal at 120 ppb).
At the same time, Swartzendruber et al. [36] reported TGM concentration data collected by a Tekran system with an upstream pyrolyzer sampling air from the marine boundary layer. Another Tekran system simultaneously measured Hg in ambient air that passed through KCl denuders, and it was assumed GOM was scrubbed by the denuder. These data were collected during five flights over the Pacific Northwest, USA. GOM concentrations measured by the Tekran system denuder were always lower than those calculated as the difference between the Tekran TGM and GEM measurements. The authors attributed this to a lack of recovery of GOM by the denuder.
4. Realization RM Was Not Being Accurately Measured
4.1. Surrogate Surface Data
In 2007 and 2009, Lyman et al. [37,38] presented work focused on development of a surrogate surface for measurement of dry deposition of GOM. The collection surface utilized was a cation exchange membrane (CEM), specifically supported ICE 450 membrane (Pall Corporation, P/N ICE45S3R), an acidic, negatively charged polysulfone CEM that selectively sorbed RM. The surrogate surface was deployed in an Aerohead dry deposition sampler, an aerodynamic polyoxymethylene disk (104 cm2 surface area). The Aerohead is deployed downward-facing to minimizing collection of PBM and has a drip shield along the rim that prevents rain from impacting the membrane surface except during windy rain events or heavy downpours.
The Aerohead dry deposition method has been applied by others [39,40,41], is available commercially, and continues to be used by the United States Environmental Protection Agency (EPA) [42]. The samplers were deployed as part of an EPA initiative to develop a total maximum daily load for Hg in Florida. Peterson et al. [43] demonstrated that dry deposition estimates using a bi-directional atmospheric resistance model and Tekran GOM concentrations were lower than surrogate surface measurements of dry deposition at a site near Fort Lauderdale and Tampa but were more similar at Outlying Landing Field near Pensacola (Figure 1). Spatial trends observed in passive GOM concentrations, and Aerohead dry deposition measurements were different from the Tekran system data, leading to the conclusions that there were 1—atmospheric Hg forms not being measured by the Tekran system, and 2—different Hg compounds with different dry deposition velocities.
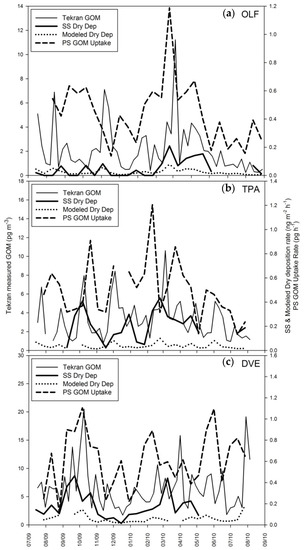
Figure 1.
This figure shows data collected at three locations in Florida, USA: (a) Outlying Landing Field (OLF) near Pensacola, (b) Tampa (TPA), and (c) Davie (DVE) near Fort Lauderdale. Tekran system gaseous oxidized mercury (GOM) concentrations are presented, as are surrogate surface (SS) dry deposition measurements, modeled dry deposition using the Tekran system GOM data, and passive box samplers (PS) GOM uptake. From Atmospheric Chemistry and Physics, Peterson et al. [43]. https://www.atmospheric-chemistry-and-physics.net/policies/licence_and_copyright.html.
It is thought that given the design of the Aerohead, only GOM is collected. Thus, it is a measurement of dry deposition. However, the surface itself does not reflect natural systems, and measured deposition may be higher than is actually occurring. The CEM surrogate surface can be used to understand deposition to ecosystems with low canopy resistance, e.g., water, and it can be used to calibrate natural GOM dry deposition to natural systems.
4.2. RAMIX
The Reno Atmospheric Mercury Intercomparison eXperiment (RAMIX) took place from 22 August to 16 September 2012 [28]. The experiment focused on comparing Tekran system measurements with alternate methods for measurement of atmospheric Hg. A manifold was developed [44] that allowed for injection of HgBr2, GEM, O3, and water vapor into the air being sampled by each unit to calibrate instruments and test for interferences. Novel technologies and alternate methods tested during the comparison were the: University of Washington Detector for Oxidized Hg Species (DOHGS; [45]); University of Houston Mercury instrument (UHMERC); University of Miami Laser Induced Fluorescence (LIF; [46]); cavity ring-down spectroscopy system (Desert Research Institute); and nylon membranes. The UHMERC system measured only GEM and their data is reported in Gustin et al. [28]. The Desert Research Institute instrument did not collect any usable data during this experiment.
As show in Figure 2, during week 3, both Tekran systems, designated as Spec 1 (first in line in the manifold) and Spec 2, were sampling from the manifold. During week 4, Spec 2 was sampling ambient air at the site. It should be noted that Spec 2 concentrations were adjusted by 28% due to a consistent bias between the two Tekran 2537 modules GEM measurements.
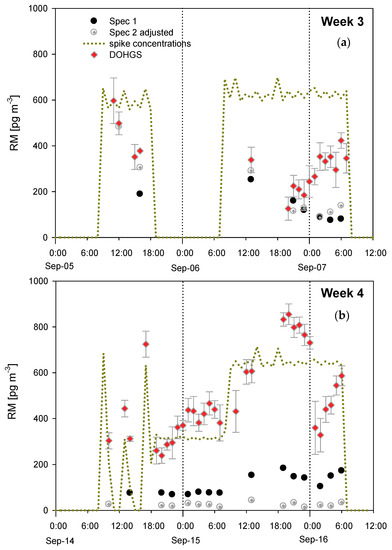
Figure 2.
Hourly mean reactive mercury (RM) concentrations during Reno Atmospheric Mercury Intercomparison eXperiment (RAMIX) measured by two Tekran systems (Spec 1, Spec 2) and Detector for Oxidized mercury System (DOHGS) during HgBr2 spikes. (a) Week 3; (b) Week 4. During week 3, both Tekran systems were sampling from the manifold, whereas in week 4, only Spec 1 was sampling from the manifold. Spec 1 and Spec 2 data represent a single hourly measurement, and the DOHGS data represent a 1-hour average of measurement made every 2.5 min. The error bars on DOHGS data represent 1σ. Reprinted (adapted) with permission from [28]. Copyright (2013) American Chemical Society.
DOHGS RM concentrations were higher than the Tekran RM measurements when sampling ambient air and during the spikes. At that time, the DOHGS used quartz wool to remove GOM from ambient air; during this experiment it was realized that when relative humidity increased the quartz wool lost GOM as GEM, and thus quartz wool has since been replaced by CEM for GOM collection (cf., 45). It is noteworthy that RM and HgBr2 concentrations measured by the Tekran systems were typically higher for Spec 2 at night, indicating that GOM was being generated in the manifold; this was hypothesized to be due to reactions with nitrogen compounds.
Several major conclusions resulted from this complicated method intercomparison. First, the Tekran system RM measurements were up to 13 times lower than those measured using the DOHGS. Second, the DOHGS was measuring a RM compound not being measured by the Tekran systems. Third, the DOHGS recovered 80% of the permeated HgBr2; the lack of complete recovery could be explained by the loss of GOM from the quartz wool due to the presence of relative humidity [47]. Thus, quartz wool is not a good collection surface for GOM. Lastly, nylon membranes deployed in ambient air outside the manifold collected 30 to 50% more RM than the first Tekran system (Spec 1). The nylon measured concentrations during this experiment were an underestimate, given that nylon membranes consistently collect less RM than CEM that are currently thought to provide the more accurate RM measurements [48,49].
Concerns had previously been raised regarding potential artifacts associated with the Tekran system PBM measurement due to environmental temperatures and particle chemistry [50,51,52]. Data developed during RAMIX demonstrated that GOM was being collected on the particulate trap in the Tekran 1135 unit [28], supporting earlier suggestions of this possibility by Lynam et al. [30].
4.3. Additional Tests Following or Associated with RAMIX
Huang et al. [49] reported on a series of systematic laboratory tests that compared GOM uptake by KCl denuders with CEM and nylon membranes. Solid GOM compounds, including HgBr2, HgCl2, and HgO, were used to permeate GOM into a laboratory manifold; additional compounds, Hg(NO3)2 and HgSO4, were tested in Gustin et al [53]. Data collected using these three methods (Tekran system, nylon membrane, and CEM) were also collected in the field. A major finding of this work was that the polarizability of the compound influenced the ability of the denuder to collect the GOM compounds, with collection efficiency decreasing in the order: HgBr2 > HgCl2 > HgO. Moreover, in charcoal scrubbed air, GOM concentrations decreased in the order: CEM > nylon > KCl denuder. In tests comparing CEM versus nylon membrane GOM collection, the collection ratio of CEM:nylon was 1.5, 0.95, and 2.06 for HgCl2, HgBr2, and HgO, respectively. Similarly, the collection ratio of CEM:KCl denuder for the same compounds was 2.4, 1.5, and 3.7, respectively. Subsequent studies have demonstrated that, when comparing CEM data with a calibrated dual channel system, CEM are efficient at collecting GOM and RM compounds, and the CEM is a good method for measurement of total GOM and RM compounds [54]. Nylon membranes do not collect GOM and RM compounds as well as the CEM [48,55].
The Huang et al. [49] paper also described the development of a thermal desorption system for determining GOM chemistry. The thermal desorption system was found to allow for the potential determination of chemistry of the RM compounds in ambient air using standard curves derived from the permeation of commercially available GOM compounds. Field data collected at three locations demonstrated that CEM > nylon > Tekran system GOM concentrations and the chemistry at each location varied, with -N and -S compounds collected at a location adjacent to a highway, halogenated compounds from the free troposphere collected at an agriculture-impacted location, and -N and -S compounds collected from the marine boundary layer.
Furthermore, building off the RAMIX project, Huang and Gustin [56] reported on a series of tests investigating the effect of relative humidity on KCl denuders, CEM, and nylon membranes. In these experiments, HgBr2 was permeated into a manifold that had ports for membranes and denuders, along with relative humidity that was regulated between 25 to 75%. For the denuder, RM collection efficiency decreased to 60% when exposed to increasing levels of relative humidity, and when the humidity was removed the recovery was 60% of what it should have been. Denuders were also passivated over the two-week sampling time recommended by the NADP-AMnet. This effect was also observed during RAMIX. For the nylon membranes, RM collection decreased with increasing humidity and O3 concentrations; increasing humidity increased RM collection on CEM.
McClure et al. [57] reported on measurements made at the North Birmingham South Eastern Aerosol Research and Characterization (SEARCH) site in summer 2013. This project focused on testing the performance of KCl denuders by permeating HgBr2 into Hg- and O3-free (clean) air, and ambient air. KCl denuders had ~95% collection efficiency in clean air, but the efficiency dropped to 20–54% in ambient air. Absolute humidity and O3 were negatively correlated with HgBr2 recovery. Follow up tests in a laboratory setting showed that increasing absolute humidity and O3 resulted in the release of GEM from the denuder due to transformation of GOM to GEM [57].
5. Development of New Methods
5.1. Reactive Mercury Active System (RMAS)
The University of Nevada, Reno-Reactive Mercury Active System (RMAS) uses CEM and nylon membranes to actively collect RM from ambient air. CEM are used to measure concentrations, while nylon membranes allow for characterization of the chemistry. This system has been used to measure RM concentrations at a number of locations, including Nevada, Florida, Utah, Maryland, Hawaii, Sydney, Australia, the Southern Ocean, and Ny-Ålesund, Norway [48,58,59]. CEM have been used for similar purposes in different housings [60,61].
The RMAS has evolved over time and the current version, RMAS 2.0, is described in Luippold et al. [62]. Briefly, the system consists of six sampling ports, sampled using two vacuum pumps, with triplicate ports for nylon membranes and CEM. The membrane types are alternated in the system so if one pump goes offline data are still being collected. A critical flow orifice is used to regulate the flow through each sampling port to 1 Lpm. CEM are digested and analyzed using cold vapor atomic fluorescence following EPA Method 1631, and nylon membranes are thermally desorbed. The nylon desorption profiles are compared to standard profiles and the curves deconvoluted to determine the relative percent of each RM compound present on the membrane. Luippold et al. [48] concluded that the RM compounds measured on the nylon membranes using this method were reasonable given the atmospheric chemistry coming into the corresponding sampling location. Comparison of RM chemistry with measurement of anions F−, Cl−, Br−, SO42−, NO2−, NO3−, and PO43− using an ion chromatograph also showed good agreement between RM chemistry and anion chemistry [48]. This work further demonstrated that the Tekran system denuder performs best in dry air with halogenated RM compounds. The best comparison between the KCl denuder and CEM measurements occurred on Moana Loa, Hawaii, and poor recoveries and large disagreements between the measurements existed at locations in Nevada and Maryland (Figure 3). The observed discrepancies between the Tekran system and membrane RM measurements in this study can be explained by the fact that the Tekran system denuder recoveries are influenced by the chemistry of RM compounds, where halogenated forms are collected more efficiently by the denuder relative to others (Table 1; [53]).
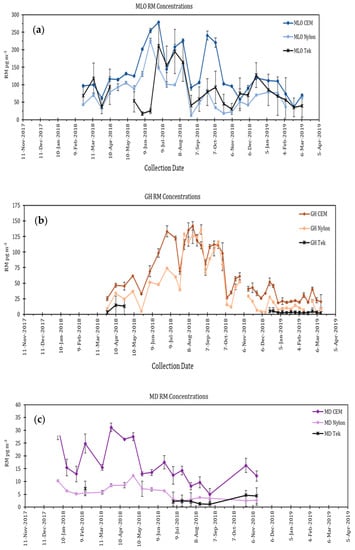
Figure 3.
RM concentration data collected using Tekran system and RMAS 2.0 membranes (CEM and nylon) from November 2017 to March 2019 at 4 locations: Moana Loa, (MLO) Hawaii; Reno, NV (GH); and Piney Reservoir in Maryland (MD). (a) MLO; (b) GH (c) MD. Modified from Luippold et al. [48]. Each panel shows CEM and nylon membrane RM concentrations as compared to Tekran RM data for MD and HI, and GOM data only for the Tekran deployed in NV.

Table 1.
Regression equations comparing GOM concentrations measured by nylon membranes or cation exchange membranes (CEM) versus those measured by the Tekran system denuder. GOM permeations were performed using the UNR laboratory manifold system and charcoal-scrubbed air. From Gustin et al. [53]. https://www.atmospheric-chemistry-and-physics.net/policies/licence_and_copyright.html.
The RMAS has been further upgraded to include PTFE membranes upstream of two-in-line CEM and nylon membranes in three-stage filter packs. The PTFE membrane was added to allow for differentiating between PBM and GOM [55]. Figure 4 shows one set of data collected at the Nevada location with the PTFE membranes in one RMAS system, and no PTFE in a second RMAS. Hg concentrations on the nylon membranes with the upstream PTFE membrane were lower than the concentrations on the nylon membranes without the PTFE membrane. A few interesting observations from this work include that oxide compounds are found on both membranes, suggesting this form exists as both particulate and gaseous Hg compounds. Additionally, nitrogen and sulfur-based compounds were more likely to be associated with the aerosol phase; however, in some cases they were found on both nylon membranes.
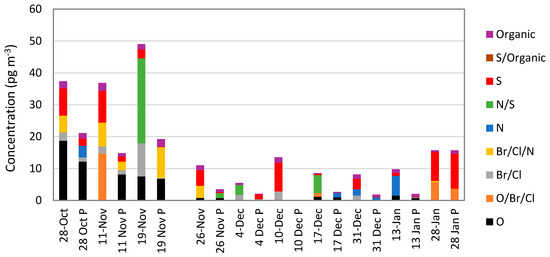
Figure 4.
Breakdown of RM chemistries and concentrations measured on nylon membranes determined using thermal desorption and peak deconvolution. There are two sets of data for each sampling period; the date with the “P” is data derived from nylon membranes with an upstream polytetrafluoroethylene (PTFE) membrane. Compounds are designated as the major elements to which Hg(II) is bound based on deconvolution of thermal desorption profiles. Modified from Gustin et al. [53].
Data collected using the RMAS has demonstrated that GOM concentrations are much higher than previously thought, with concentrations up to 13 times higher than measured by the Tekran system, and that the chemical compounds of RM/GOM/PBM vary across space and time and are in-line with ancillary observations. This work reflects a step forward toward measurement of GOM and PBM concentrations and chemistry. Gustin et al. [55] further demonstrated the utility of the PTFE membrane as a means of discerning between GOM and PBM concentrations and chemistry. Concentrations measured using this system can be used to estimate dry deposition (Osterwalder et al. in progress). The mercury research community is actively seeking (via Mercury in the environment and links to deposition committee (MELD), a committee of the NADP) a measurement method or combination of methods to move forward our ability to measure Hg deposition as a community.
5.2. Dual Channel Systems
Dual channel systems provide an alternate automated method for measurement of RM. The first dual channel system was developed based on the operation of the University of Washington DOHGS (discussed above). The DOHGS system successfully measured elemental and oxidized Hg in several aircraft campaigns [47,63,64].
Its detection limit was ~100 pg Hg m−3, limiting the utility at surface sites where RM concentrations tend to be lower. The DOHGS requires two Tekran 2537 modules, with perfectly matching precise calibrations, to collect data.
Gustin et al. [65] developed a dual channel system that requires only one Tekran 2537 module. This was an improvement over the need for two Tekran systems, for ease of use and cost effectiveness. This dual channel system consisted of a PTFE membrane at the inlet of the sampling system to remove particulates. Once air passed through this filter, the line was bifurcated into one line with a two-stage CEM to remove GOM, and second line with a pyrolyzer for TGM measurements. GOM was determined as the difference between the measurements between the two lines. Data were compared with a Tekran 2537/1130 system and two RMAS, one with CEM and nylon membranes, and the other with PTFE membranes upstream of the CEM and nylon membranes. The dual channel system and Tekran system underestimated GOM relative to the RMAS membrane measurements. For the dual channel system, the poor recovery was due to the long uncovered sampling line and relative humidity promoting reduction of GOM to GEM. The Tekran system exhibited low recovery due to the denuder.
A similar dual channel system was developed by Lyman et al. [66]. Their system differed from the Gustin et al. [65] dual channel system in a few key ways: the inlet line was covered (no light penetration), heated, and significantly longer; and the raw Tekran 2537 output was processed to calculate Hg concentrations based on peak height, and data were averaged to reduce the detection limit. This system resulted in a RM detection limit as low as ~15 pg Hg m3 for a 1-h average; however, when operated at a different location, the system detection limit was in the range of 40 pg Hg m−3. Lyman et al. [66] showed that their dual channel system 1—could detect diurnal and other patterns in ambient GEM and GOM, 2—recovered 100% of HgBr2 and HgCl2 injected by an automated calibration system, 3—measured RM in the same range as the RMAS, and 4—accurately quantified RM concentrations at surface locations on an hourly timescale.
The collective work involving the RMAS and dual channel systems has provided a foundation for better understanding RM concentrations and chemistry, and information that modelers need to refine the biogeochemical Hg cycle.
5.3. Other Work Using CEM
Miller et al. [67] developed a method for measurement of GOM flux. The method utilized CEM to collect GOM from air interacting with mining based soils with a range of Hg contamination. They found that materials, such as those derived from mine tailing impoundments act as a direct emission source of RM compounds. This agrees with the work of Nacht et al. [22] who found high concentrations of RM over mine tailings in the field. The lower concentration mining-related substrates showed deposition of GOM with deposition velocities on the lower end of the range reported by Zhang et al. [68] in their review of Hg dry deposition.
Marusczak et al. [69] measured, using polyethersulfone membranes and a Tekran system, tropospheric RM at the Pic du Midi Observatory, France. They found the Tekran values to be systematically lower by a factor of 1.3 than the polyethersulfone membrane. They found a significant loss of RM (36%) from the denuder or inlet during flush blanks, and if the flush blank was added to the Tekran RM measurement, the agreement with the CEM was better (slope = 1.01, r2 = 0.90), Concentrations measured in dry free tropospheric air were 198 ± 57 and 229 ± 58 pg m−3), and agreed with in-flight observed RM, as well as model based estimates.
Field comparisons of the CEM and polyethersulfone membrane demonstrated that concentrations measured by the two are quite similar ([70]; unpublished data, Dr. Stefan Osterwalder, Université Grenoble Alpes). Preliminary results from a measurement campaign using the RMAS 2.0 and the Aerohead along with the Tekran system at Zeppelin Observatory on Svalbard, Norway, demonstrated that modeled deposition using Tekran data was lower than that determined using the Aerohead sampler and modeled values using RM concentrations measured by the RMAS system (Dr. Stefan Osterwalder, Université Grenoble Alpes; personal communication).
Size-resolved PBM measurements have been collected, usually using multi-stage impactors. This is reviewed and the biases discussed in Lyman et al. [54]. This review also discusses current understanding of reaction mechanisms.
5.4. Mass Spectrometric Methods
Several investigators have attempted to detect RM compounds using mass spectrometric techniques. Deeds et al. [71] pioneered this approach with preconcentration of Hg halide compounds on various surfaces, followed by thermal desorption into an atmospheric pressure chemical ionization mass spectrometer. With this method, the authors were unambiguously able to detect HgBr2 and HgCl2 in laboratory-generated samples. Measurements from samples collected from ambient air were less certain due to contaminants co-adsorbed during preconcentration.
Jones et al. [72] used cryogenic concentration, gas chromatography, and mass spectrometry to detect laboratory-generated and ambient GOM. Similar to Deeds et al. [71], they showed unequivocal detection of HgBr2 and HgCl2 in laboratory-generated samples, but they did not detect RM in ambient air samples. Gas chromatography resulted in the separation of RM compounds from each other and from contaminants, but non-halide Hg compounds failed to pass through the valves or the chromatography column, limiting the method applicability for some Hg compounds.
More recently, Khalizov et al. [73] used ion-drift chemical ionization mass spectrometry to detect HgCl2. The authors did not analyze ambient samples, but they speculate that direct detection of RM compounds in the ambient atmosphere could be possible for future iterations of this method without prior preconcentration.
5.5. Oxidized Mercury Calibration Systems
Calibration of RM measurement systems with RM compounds has only occurred sporadically, though it has been repeatedly called for [54,74,75]. If a method for routine field calibration existed when the KCl denuder method first came into use, the low bias would likely have been quickly discovered, spurring the development of alternative methods at least a decade sooner.
Landis et al. [25] and Feng et al. [40] used HgCl2 permeation tubes to test RM collection by KCl denuders. Landis et al. [25] found quantitative uptake, but their tests were in air scrubbed of ambient Hg and oxidants. Lyman et al. [35,62], and Finley et al. [44] during the RAMIX experiment, and Huang et al. [48], McClure et al. [57] and Huang and Gustin [56] used permeation tubes filled with various Hg (II) compounds to challenge KCl denuders and other measurement methods in ambient air, and, as discussed above, found denuder concentrations to be biased low. These early permeation tube-based methods were manual, meaning that the user had to manually turn a valve or connect tubing to add GOM to the sample air stream.
Lyman et al. [76] developed the first automated RM calibration system for ambient air measurements. They deployed the system at field sites and demonstrated that it delivered stable concentrations of HgCl2 and HgBr2 to measurement systems. Lyman et al. [66] expanded on this system by gravimetrically verifying Hg permeation rates from each permeation tube, though more work is needed to improve the gravimetric techniques. Lyman et al. [66] also showed that the automated calibration system can be used to quantify bias in RM measurements.
Sari et al. [77] tested two calibration systems that added HgCl2 dissolved in ultrapure water to sample air streams. These systems generated RM concentrations much higher than is typical in ambient air, but evaporation methods like these are widely used for flue gas applications (e.g., Gonzalez et al. [78]), and could possibly be adapted for ambient measurements at lower concentrations.
While all of these discussed technologies will benefit from continued development and improvement, they show that routine, quantitative field calibration for oxidized Hg is necessary and possible. We advocate that all future measurements of oxidized Hg should include field calibration.
6. What We Have Learned
These new methods have repeatedly demonstrated that the KCl denuder is not adequate for measuring RM concentrations, and that new surfaces that can be used in an automated system are needed by the atmospheric Hg research community. We expect that KCl-denuder derived data is best for polar regions or high elevation locations in the free troposphere for these areas are dominated by halogenated compounds and dry air. The RMAS membrane-based system has been demonstrated to make accurate RM measurements when compared to a calibrated dual channel system [54]. Nylon membrane data have demonstrated that RM, GOM, and PBM chemistries vary across space and time, information critical for modelers trying to predict Hg deposition and the resulting impacts to ecosystems. However, the exact chemistry of RM compounds is not known, and this should be an emphasis of future work.
Although this work has been largely criticized due to the fact that it has shifted the paradigm away from the Tekran 1130 and 1135 units for being the industry standard for measurement of atmospheric RM, it has moved the Hg scientific community forward and led to better understanding of RM concentrations and chemistry.
7. Work Needed
The Hg research community is in need of a robust, high temporal resolution, calibrated method for measurement of GOM and PBM and/or RM concentrations and chemistry under all environmental conditions. In addition, methods developed should have clear quality control and quality assurance, there must be calibration standards, and tests will need to be done to achieve traceability to national standards that will need to be developed along with reference materials. [79] The RMAS has admitted limitations, including the long sampling duration required to collect sufficient Hg for analysis and the fact that the nylon membrane does not collect all forms of GOM/RM with equal efficiency. A new thermal desorption surface is needed, as the nylon membranes underestimate RM concentrations and have been demonstrated to collect less RM in the presence of water vapor and O3. This surface will need be able to collect all compounds with equal efficiency and not have impacts due to air chemistry. It will be a challenge to find a surface that collects all compounds with equal efficiency and not have impacts due to air chemistry given the different forms have different water solubilities, particle affinities, and redox reactivity. Knowledge of the exact chemistry of RM compounds is still needed and has proven to be difficult to acquire using traditional analytical instruments due to the “stickiness” of RM compounds making it difficult to transport into a gas chromatography mass spectrometer [72]. More work is needed to develop a mass spectrometry method that will allow for identification of the chemistry. In the meantime, simply measuring GEM and TGM with a dual channel system using a pyrolyzer and CEM will allow for getting at GOM and a separate means will be needed for measurement of PBM. This method is a solution for those interested in deriving “real time” data, while the membrane system will be of use to those only interested in concentrations and obtaining an estimate of dry deposition. The latter would be useful in the face of the Minamata Convention. That said, the community has made significant progress over the past 30 years for measuring RM.
Author Contributions
Conceived the idea for the paper, M.S.G.; writing, M.S.G., S.M.D.-C., J.H., S.L. and S.N.L. All authors have read and agreed to the published version of the manuscript.
Funding
Major funding for the Gustin Laboratory’s work on this topic came from the Electric Power Research Institute, US EPA, and the National Science Foundation.
Data Availability Statement
Data sharing not applicable.
Acknowledgments
The first author would like to thank those that blazed the trail for measuring GOM, as well as her many collaborators, students, and reviewers of her papers, for without the collective our progress would not have been possible. The authors thank the anonymous reviewers for their helpful comments.
Conflicts of Interest
The authors declare no conflict of interest.
References
- Ariya, P.A.; Amyot, M.; Dastoor, A.; Deeds, D.; Feinberg, A.; Kos, G.; Poulain, A.; Ryjkov, A.; Semeniuk, K.; Subir, M.; et al. Mercury physicochemical and biogeochemical transformation in the atmosphere and at atmospheric interfaces: A review and future directions. Chem. Rev. 2015, 115, 3760–3802. [Google Scholar] [CrossRef] [PubMed]
- Lin, C.-J.; Pehkonen, S.O. Aqueous phase reactions of mercury with free radicals and chlorine: Implications for atmospheric mercury chemistry. Chemosphere 1999, 38, 1253–1263. [Google Scholar] [CrossRef]
- Saiz-Lopez, A.; Travnikov, O.; Sonke, J.E.; Thackray, C.P.; Jacob, D.J.; Carmona-García, J.; Francés-Monerris, A.; Roca-Sanjuán, R.; Acuña, A.U.; Dávalos, J.Z.; et al. Photochemistry of oxidized Hg(I) and Hg(II) species suggests missing mercury oxidation in the troposphere. Proc. Natl. Acad. Sci. USA 2020, 117, 30949–30956. [Google Scholar] [CrossRef]
- Fogg, T.R.; Fitzgerald, W.F. Mercury in southern New-England coastal rains. J. Geophys. Res. Oceans 1979, 84, 6987–6989. [Google Scholar] [CrossRef]
- Kothny, E.L. 3-phase equilibrium of mercury in nature. Adv. Chem. Ser. 1973, 123, 48–80. [Google Scholar]
- Brosset, C. Transport of airborne mercury emitted by coal burning into aquatic systems. Water Sci. Technol. 1983, 15, 59–66. [Google Scholar] [CrossRef]
- Iverfeldt, A.; Lindqvist, O. Atmospheric oxidation of elemental mercury by ozone in the aqueous phase. Atmos. Environ. 1986, 20, 1567–1573. [Google Scholar] [CrossRef]
- Xiao, Z.F.; Munthe, J.; Lindqvist, O. Sampling and determination of gaseous and particulate mercury in the atmosphere using gold-coated denuders. Water Air Soil Pollut. 1991, 56, 141–151. [Google Scholar] [CrossRef]
- Munthe, J.; Schroeder, W.H.; Xiao, Z.; Lindqvist, O. Removal of gaseous mercury from air using a gold coated denuder. Atmos. Environ. 1990, 24, 2271–2274. [Google Scholar]
- Fitzgerald, W.F.; Gill, G.A. Sub-nanogram determination of mercury by 2-stage gold amalgamation and gas-phase detection applied to atmospheric analysis. Anal. Chem. 1979, 51, 1714–1720. [Google Scholar]
- Bloom, N.; Fitzgerald, W.F. Determination of volatile mercury species at the picogram level by low-temperature gas-chromatography with cold-vapor atomic fluorescence detection. Anal. Chim. Acta. 1988, 208, 151–161. [Google Scholar] [CrossRef]
- Galbreath, K.C.; Zygarlicke, C.J. Mercury speciation in coal combustion and gasification flue gases. Environ. Sci. Technol. 1996, 30, 2421–2426. [Google Scholar] [CrossRef]
- Lindberg, S.E.; Meyers, T.P.; Taylor, G.E.; Turner, R.R.; Schroeder, W.H. Atmosphere/surface exchange of mercury in a forest: Results of modeling and gradient approaches. J. Geophys. Res. 1992, 97, 2519–2528. [Google Scholar] [CrossRef]
- Lindberg, S.E.; Turner, R.R.; Meyers, T.P.; Taylor, G.E.; Schroeder, W.H. Atmospheric concentrations and deposition of airborne mercury to Walker Branch Watershed. Water Air Soil Pollut. 1991, 56, 577–594. [Google Scholar] [CrossRef]
- Stratton, W.J.; Lindberg, S.E. Use of a refluxing mist chamber for measurement of gas-phase mercury(ii) species in the atmosphere. Water Air Soil Pollut. 1995, 80, 1269–1278. [Google Scholar] [CrossRef]
- Brosset, C.; Lord, E. Methylmercury in ambient air. Method of determination and some measurement results. Water Air Soil Pollut. 1995, 82, 739–750. [Google Scholar] [CrossRef]
- Lindberg, S.E.; Stratton, W.J. Atmospheric mercury speciation: Concentrations and behavior of reactive gaseous mercury in ambient air. Environ. Sci. Technol. 1998, 32, 49–57. [Google Scholar] [CrossRef]
- Stratton, W.J.; Lindberg, S.E.; Perry, C.J. Atmospheric mercury speciation: Laboratory and field evaluation of a mist chamber method for measuring reactive gaseous mercury. Environ. Sci. Technol. 2001, 35, 170–177. [Google Scholar] [CrossRef]
- Ebinghaus, R.; Jennings, S.G.; Schroeder, W.H.; Berg, T.; Donaghy, T.; Guentzel, J.; Kenny, C.; Kock, H.H.; Kvietkus, K.; Landing, W.; et al. International field intercomparison measurements of atmospheric mercury species at Mace Head, Ireland. Atmos. Environ. 1999, 33, 3063–3073. [Google Scholar] [CrossRef]
- Munthe, J.; Wängberg, I.; Pirrone, N.; Iverfeldt, Å.; Ferrara, R.; Ebinghaus, R.; Feng, X.; Gårdfeldt, K.; Keeler, G.; Lanzillotta, E.; et al. Intercomparison of methods for sampling and analysis of atmospheric mercury species. Atmos. Environ. 2001, 35, 3007–3017. [Google Scholar] [CrossRef]
- Feng, X.B.; Sommar, J.; Gardfeldt, K.; Lindqvist, O. Improved determination of gaseous divalent mercury in ambient air using KCl coated denuders. Fresenius J. Anal. Chem. 2000, 366, 423–428. [Google Scholar] [CrossRef] [PubMed]
- Nacht, D.A.; Gustin, M.S.; Engle, M.A.; Zehner, R.Z.; Giglini, A.D. Quantifying total and reactive gaseous mercury at the Sulphur Banks Mercury Mine Superfund Site, Northern California. Environ. Sci. Technol. 2004, 38, 1977–1983. [Google Scholar] [CrossRef]
- Steffen, A.; Schroeder, W.; Bottenheim, J.; Narayan, J.; Fuentes, J.D. Atmospheric mercury concentrations: Measurements and profiles near snow and ice surfaces in the Canadian Arctic during Alert 2000. Atmos. Environ. 2002, 36, 2653–2661. [Google Scholar] [CrossRef]
- Sommar, J.; Feng, X.; Gardfeldt, K.; Lindqvist, O. Measurements of fractionated gaseous mercury concentrations over northwestern and central Europe, 1995–99. J. Environ. Monit. 1999, 1, 435–439. [Google Scholar] [CrossRef] [PubMed]
- Landis, M.S.; Stevens, R.K.; Schaedlich, F.; Prestbo, E.M. Development and characterization of an annular denuder methodology for the measurement of divalent inorganic reactive gaseous mercury in ambient air. Environ. Sci. Technol. 2002, 36, 3000–3009. [Google Scholar] [CrossRef] [PubMed]
- Xiao, Z.; Sommar, J.; Wei, S.; Lindqvist, O. Sampling and determination of gas phase divalent mercury in the air using a KCl coated denuder. Fresenius J. Anal. Chem. 1997, 358, 386–391. [Google Scholar] [CrossRef]
- Valente, R.J.; Shea, C.; Humes, K.L.; Tanner, R.L. Atmospheric mercury in the Great Smoky Mountains compared to regional and global levels. Atmos. Environ. 2007, 41, 1861–1873. [Google Scholar] [CrossRef]
- Gustin, M.S.; Huang, J.Y.; Miller, M.B.; Peterson, C.; Jaffe, D.A.; Ambrose, J.; Finley, B.D.; Lyman, S.N.; Call, K.; Talbot, R.; et al. Do we understand what the mercury speciation instruments are actually measuring? Results of RAMIX. Environ. Sci. Technol. 2013, 47, 7295–7306. [Google Scholar] [CrossRef]
- Lu, J.Y.; Schroeder, W.H.; Berg, T.; Munthe, J.; Schneeberger, D.; Schaedlich, F. A device for sampling and determination of total particulate mercury in ambient air. Anal. Chem. 1998, 70, 2403–2408. [Google Scholar] [CrossRef]
- Lynam, M.M.; Keeler, G.J. Artifacts associated with the measurement of particulate mercury in an urban environment: The influence of elevated ozone concentrations. Atmos. Environ. 2005, 39, 3081–3088. [Google Scholar] [CrossRef]
- Sheu, G.-R.; Mason, R.P. An examination of methods for the measurements of reactive gaseous mercury in the atmosphere. Environ. Sci. Technol. 2001, 35, 1209–1216. [Google Scholar] [CrossRef] [PubMed]
- Lyman, S.N.; Gustin, M.S. Determinants of atmospheric mercury concentrations in Reno, Nevada, U.S.A. Sci. Total Environ. 2009, 408, 431–438. [Google Scholar] [CrossRef] [PubMed]
- Weiss-Penzias, P.; Jaffe, D.A.; McClintick, A.; Prestbo, E.M.; Landis, M.S. Gaseous elemental mercury in the marine boundary layer: Evidence for rapid removal in anthropogenic pollution. Environ. Sci. Technol. 2003, 37, 3755–3763. [Google Scholar] [CrossRef] [PubMed]
- Choi, H.-D.; Huang, J.; Mondal, S.; Holsen, T.M. Variation in concentrations of three mercury (Hg) forms at a rural and a suburban site in New York State. Sci. Total Environ. 2013, 448, 96–106. [Google Scholar] [CrossRef] [PubMed]
- Lyman, S.N.; Jaffe, D.A. Formation and fate of oxidized mercury in the upper troposphere and lower stratosphere. Nat. Geosci. 2012, 5, 114–117. [Google Scholar] [CrossRef]
- Swartzendruber, P.C.; Jaffe, D.A.; Finley, B. Development and first results of an aircraft-based, high time resolution technique for gaseous elemental and reactive (oxidized) gaseous mercury. Environ. Sci. Technol. 2009, 43, 7484–7489. [Google Scholar] [CrossRef]
- Lyman, S.N.; Gustin, M.S.; Prestbo, E.M.; Marsik, F.J. Estimation of dry deposition of atmospheric mercury in Nevada by direct and indirect methods. Environ. Sci. Technol. 2007, 41, 1970–1976. [Google Scholar] [CrossRef]
- Lyman, S.N.; Gustin, M.S.; Prestbo, E.M.; Kilner, P.I.; Edgerton, E.; Hartsell, B. Testing and application of surrogate surfaces for understanding potential gaseous oxidized mercury dry deposition. Environ. Sci. Technol. 2009, 43, 6235–6241. [Google Scholar] [CrossRef]
- Castro, M.S.; Moore, C.; Sherwell, J.; Brooks, S.B. Dry deposition of gaseous oxidized mercury in western Maryland. Sci. Total Environ. 2012, 417, 232–240. [Google Scholar] [CrossRef]
- Fang, G.C.; Lin, Y.H.; Chang, C.Y. Use of mercury dry deposition samplers to quantify dry deposition of particulate-bound mercury and reactive gaseous mercury at a traffic sampling site. Environ. Forensics 2013, 14, 182–186. [Google Scholar] [CrossRef]
- Sather, M.E.; Mukerjee, S.; Allen, K.L.; Smith, L.; Mathew, J.; Jackson, C.; Callison, R.; Scrapper, L.; Hathcoat, A.; Adam, J.; et al. Gaseous oxidized mercury dry deposition measurements in the southwestern USA: A comparison between Texas, eastern Oklahoma, and the Four Corners area. Sci. World J. 2014, 2014, 580723. [Google Scholar] [CrossRef] [PubMed]
- Sather, M.E.; Mukerjee, S.; Smith, L.; Mathew, J.; Jackson, C.; Callison, R.; Scrapper, L.; Hathcoat, A.; Adam, J.; Keese, D.; et al. Gaseous oxidized mercury dry deposition measurements in the Four Corners area and eastern Oklahoma, U.S.A. Atmos. Pollut. Res. 2013, 4, 168–180. [Google Scholar] [CrossRef]
- Peterson, C.; Alishahi, M.; Gustin, M.S. Testing the use of passive sampling systems for understanding air mercury concentrations and dry deposition across Florida, USA. Sci. Total Environ. 2012, 424, 297–307. [Google Scholar] [CrossRef] [PubMed]
- Finley, B.D.; Jaffe, D.A.; Call, K.; Lyman, S.; Gustin, M.S.; Peterson, C.; Miller, M.; Lyman, T. Development, testing, and deployment of an air sampling manifold for spiking elemental and oxidized mercury during the Reno Atmospheric Mercury Intercomparison Experiment (RAMIX). Environ. Sci. Technol. 2013, 47, 7277–7284. [Google Scholar] [CrossRef]
- Ambrose, J.L.; Lyman, S.N.; Huang, J.Y.; Gustin, M.S.; Jaffe, D.A. Fast time resolution oxidized mercury measurements during the Reno Atmospheric Mercury Intercomparison Experiment (RAMIX). Environ. Sci. Technol. 2013, 47, 7285–7294. [Google Scholar] [CrossRef]
- Hynes, A.J.; Everhart, S.; Bauer, D.; Remeika, J.; Ernest, C.T. In situ and denuder-based measurements of elemental and reactive gaseous mercury with analysis by laser-induced fluorescence results from the Reno Atmospheric Mercury Intercomparison Experiment. Atmos. Chem. Phys. 2017, 17, 465–483. [Google Scholar] [CrossRef]
- Ambrose, J.L.; Gratz, L.E.; Jaffe, D.A.; Campos, T.; Flocke, F.M.; Knapp, D.J.; Stechman, D.M.; Stell, M.; Weinheimer, A.J.; Cantrell, C.A.; et al. Mercury emission ratios from coal-fired power plants in the southeastern United States during NOMADSS. Environ. Sci. Technol. 2015, 49, 10389–10397. [Google Scholar] [CrossRef]
- Luippold, A.; Gustin, M.S.; Dunham-Cheatham, S.M.; Castro, M.; Luke, W.; Lyman, S.; Zhang, L. Use of multiple lines of evidence to understand reactive mercury concentrations and chemistry in Hawai’i, Nevada, Maryland, and Utah, USA. Environ. Sci. Technol. 2020, 54, 7922–7931. [Google Scholar] [CrossRef]
- Huang, J.Y.; Miller, M.B.; Weiss-Penzias, P.; Gustin, M.S. Comparison of gaseous oxidized Hg measured by KCl-coated denuders, and nylon and cation exchange membranes. Environ. Sci. Technol. 2013, 47, 7307–7316. [Google Scholar] [CrossRef]
- Rutter, A.P.; Schauer, J.J. The impact of aerosol composition on the particle to gas partitioning of reactive mercury. Environ. Sci. Technol. 2007, 41, 3934–3939. [Google Scholar] [CrossRef]
- Rutter, A.P.; Schauer, J.J. The effect of temperature on the gas-particle partitioning of reactive mercury in atmospheric aerosols. Atmos. Environ. 2007, 41, 8647–8657. [Google Scholar] [CrossRef]
- Talbot, R.; Mao, H.; Feddersen, D.; Smith, M.; Kim, S.Y.; Sive, B.; Haase, K.; Ambrose, J.; Zhou, Y.; Russo, R. Assessment of particulate mercury measured with the manual and automated methods. Atmosphere 2010, 2, 1–20. [Google Scholar] [CrossRef]
- Gustin, M.S.; Amos, H.M.; Huang, J.; Miller, M.B.; Heidecorn, K. Measuring and modeling mercury in the atmosphere: A critical review. Atmos. Chem. Phys. 2015, 15, 5697–5713. [Google Scholar] [CrossRef]
- Lyman, S.N.; Cheng, I.; Gratz, L.E.; Weiss-Penzias, P.; Zhang, L. An updated review of atmospheric mercury. Sci. Total Environ. 2020, 707, 135575. [Google Scholar] [CrossRef] [PubMed]
- Gustin, M.S.; Dunham-Cheatham, S.M.; Zhang, L.; Lyman, S.; Choma, N.; Castro, M. Use of membranes and detailed HYSPLIT analyses to understand atmospheric particulate, gaseous oxidized, and reactive mercury chemistry. Environ. Sci. Technol. 2020. [Google Scholar] [CrossRef]
- Huang, J.Y.; Gustin, M.S. Uncertainties of gaseous oxidized mercury measurements using KCl-coated denuders, cation-exchange membranes, and nylon membranes: Humidity influences. Environ. Sci. Technol. 2015, 49, 6102–6108. [Google Scholar] [CrossRef] [PubMed]
- McClure, C.D.; Jaffe, D.A.; Edgerton, E.S. Evaluation of the KCI denuder method for gaseous oxidized mercury using HgBr2 at an in-service AMNet site. Environ. Sci. Technol. 2014, 48, 11437–11444. [Google Scholar] [CrossRef]
- Huang, J.Y.; Miller, M.B.; Edgerton, E.; Gustin, M.S. Deciphering potential chemical compounds of gaseous oxidized mercury in Florida, USA. Atmos. Chem. Phys. 2017, 17, 1689–1698. [Google Scholar] [CrossRef]
- Gustin, M.S.; Pierce, A.M.; Huang, J.Y.; Miller, M.B.; Holmes, H.A.; Loria-Salazar, S.M. Evidence for different reactive Hg sources and chemical compounds at adjacent valley and high elevation locations. Environ. Sci. Technol. 2016, 50, 12225–12231. [Google Scholar] [CrossRef]
- He, Y.; Mason, R.P. Comparison of reactive gaseous mercury measured by KCl-coated denuders andcation exchange membranes during the Pacific GEOTRACES GP15 expedition. Atmos. Environ. 2020, 241, 117973. [Google Scholar] [CrossRef]
- Miller, M.B.; Howard, D.A.; Pierce, A.M.; Cook, K.; Keywood, M.; Powell, J.; Gustin, M.S.; Edwards, G.C. Atmospheric reactive mercury concentrations in coastal Australia and the Southern Ocean. Sci. Total Environ. 2021, 751, 141681. [Google Scholar] [CrossRef] [PubMed]
- Luippold, A.; Gustin, M.S.; Dunham-Cheatham, S.M.; Zhang, L. Improvement of quantification and identification of atmospheric reactive mercury. Atmos. Environ. 2020, 224, 117307. [Google Scholar] [CrossRef]
- Lyman, S.N.; Jaffe, D.A.; Gustin, M.S. Release of mercury halides from KCl denuders in the presence of ozone. Atmos. Chem. Phys. 2010, 10, 8197–8204. [Google Scholar] [CrossRef]
- Gratz, L.E.; Ambrose, J.L.; Jaffe, D.A.; Shah, V.; Jaeglé, L.; Stutz, J.; Festa, J.; Spolaor, M.; Tsai, C.; Selin, N.E.; et al. Oxidation of mercury by bromine in the subtropical Pacific free troposphere. Geophys. Res. Lett. 2015, 42, 10–494. [Google Scholar] [CrossRef]
- Gustin, M.S.; Dunham-Cheatham, S.M.; Zhang, L. Comparison of 4 methods for measurement of reactive, gaseous oxidized, and particulate bound mercury. Environ. Sci. Technol. 2019, 53, 14489–14495. [Google Scholar] [CrossRef]
- Lyman, S.N.; Gratz, L.; Dunham-Cheatham, S.M.; Gustin, M.S.; Luippold, A. Improvements to the accuracy of atmospheric oxidized mercury measurements. Environ. Sci. Technol. 2020, 54, 13379–13388. [Google Scholar] [CrossRef]
- Miller, M.B.; Gustin, M.S.; Edwards, G.C. Reactive mercury flux measurements using cation exchange membranes. Atmos. Meas. Tech. Discuss. 2018. [Google Scholar] [CrossRef]
- Zhang, L.; Wright, L.P.; Blanchard, P. A review of current knowledge concerning dry deposition of atmospheric mercury. Atmos. Environ. 2009, 43, 5853–5864. [Google Scholar] [CrossRef]
- Marusczak, N.; Sonke, J.E.; Fu, X.W.; Jiskra, M. Tropospheric GOM at the Pic du Midi Observatory-Correcting bias in denuder based observations. Environ. Sci. Technol. 2017, 51, 863–869. [Google Scholar] [CrossRef]
- Dunham-Cheatham, S.M.; Lyman, S.; Gustin, M.S. Evaluation of sorption surface materials for reactive mercury compounds. Atmos. Environ. 2020, 242, 117836. [Google Scholar] [CrossRef]
- Deeds, D.A.; Ghoshdastidar, A.; Raofie, F.; Guérette, E.A.; Tessier, A.; Ariya, P.A. Development of a particle-trap preconcentration-soft ionization mass spectrometric technique for the quantification of mercury halides in air. Anal. Chem. 2015, 87, 5109–5116. [Google Scholar] [CrossRef] [PubMed]
- Jones, C.P.; Lyman, S.N.; Jaffe, D.A.; Allen, T.; O’Neil, T.L. Detection and quantification of gas-phase oxidized mercury compounds by GC/MS. Atmos. Meas. Tech. 2016, 9, 2195–2205. [Google Scholar] [CrossRef]
- Khalizov, A.F.; Guzman, F.J.; Cooper, M.; Mao, N.; Antley, J.; Bozzelli, J. Direct detection of gas-phase mercuric chloride by ion drift-chemical ionization mass spectrometry. Atmos. Environ. 2020, 238, 117687. [Google Scholar] [CrossRef]
- Gustin, M.S.; Jaffe, D. Reducing the uncertainty in measurement and understanding of mercury in the atmosphere. Environ. Sci. Technol. 2010, 44, 2222–2227. [Google Scholar] [CrossRef]
- Jaffe, D.A.; Lyman, S.; Amos, H.M.; Gustin, M.S.; Huang, J.; Selin, N.E.; Levin, L.; Ter Schure, A.; Mason, R.P.; Talbot, R.; et al. Progress on understanding atmospheric mercury hampered by uncertain measurements. Environ. Sci. Technol. 2014, 48, 7204–7206. [Google Scholar] [CrossRef]
- Lyman, S.N.; Jones, C.; O’Neil, T.; Allen, T.; Miller, M.; Gustin, M.S.; Pierce, A.M.; Luke, W.; Ren, X.; Kelley, P. Automated calibration of atmospheric oxidized mercury measurements. Environ. Sci. Technol. 2016, 50, 12921–12927. [Google Scholar] [CrossRef]
- Sari, S.; Timo, R.; Jussi, H.; Panu, H. Dynamic calibration method for reactive gases. Meas. Sci. Technol. 2019, 31, 034001. [Google Scholar] [CrossRef]
- González, R.O.; Díaz-Somoano, M.; Antón, M.L.; Martínez-Tarazona, M.R. Effect of adding aluminum salts to wet FGD systems upon the stabilization of mercury. Fuel 2012, 96, 568–571. [Google Scholar] [CrossRef]
- ISO/IEC Guide 98-3:2008. Available online: http://www.iso.org/sites/JCGM/JCGM-introduction.htm (accessed on 4 January 2021).
Publisher’s Note: MDPI stays neutral with regard to jurisdictional claims in published maps and institutional affiliations. |
© 2021 by the authors. Licensee MDPI, Basel, Switzerland. This article is an open access article distributed under the terms and conditions of the Creative Commons Attribution (CC BY) license (http://creativecommons.org/licenses/by/4.0/).