Abstract
Investigation of quantitative predictions of precipitation amounts and forecasts of drought events are conducive to facilitating early drought warnings. However, there has been limited research into or modern statistical analyses of precipitation and drought over Northeast China, one of the most important grain production regions. Therefore, a case study at three meteorological sites which represent three different climate types was explored, and we used time series analysis of monthly precipitation and the grey theory methods for annual precipitation during 1967–2017. Wavelet transformation (WT), autoregressive integrated moving average (ARIMA) and long short-term memory (LSTM) methods were utilized to depict the time series, and a new hybrid model wavelet-ARIMA-LSTM (W-AL) of monthly precipitation time series was developed. In addition, GM (1, 1) and DGM (1, 1) of the China Z-Index (CZI) based on annual precipitation were introduced to forecast drought events, because grey system theory specializes in a small sample and results in poor information. The results revealed that (1) W-AL exhibited higher prediction accuracy in monthly precipitation forecasting than ARIMA and LSTM; (2) CZI values calculated through annual precipitation suggested that more slight drought events occurred in Changchun while moderate drought occurred more frequently in Linjiang and Qian Gorlos; (3) GM (1, 1) performed better than DGM (1, 1) in drought event forecasting.
1. Introduction
As one of the most destructive natural calamities, drought occurs when rainfall amounts are below normal for a long period. The characteristics are high frequency, long duration, wide influence [1,2], and damaging effects on grain yields and water supplies, so it is of great significance to model and forecast the rainfall amount and drought. Accurate precipitation predictions are required for the precise estimation of drought in an area [3]. More accurate and timely rainfall prediction can boost drought research, while greatly improving future water management policies in many ways.
Due to the nonlinear, stochastic and highly complex nature of rainfall data, timely and exact rainfall forecasting has remained a challenging task, and more complex technologies are needed. The autoregressive integrated moving average (ARIMA) and neural network (NN) are broadly trending [1,4,5]. ARIMA has good prediction accuracy and flexibility for different types of time series data, such as those found in hydrology [6,7], finance [8], agriculture [9], and medicine [10]; however, ARIMA cannot adequately simulate the nonlinear structure of precipitation. Consequently, linear methods cannot capture the nonlinear characteristics of rainfall processes, and nonlinear time series methods should be considered when predicting rainfall [11,12]. NN is able to overcome this shortcoming superbly and can model the complex, mostly nonlinear relationships of precipitation time series to achieve higher precision in precipitation predictions [13,14,15,16,17]. Compared with the ARIMA model, the neural network structure has the advantages of self-organization, self-learning and nonlinear approximation, but it also has the disadvantage of assuming that the inputs and outputs are independent. NN is an efficient way for modeling, function approximation and prediction of complex problems. Many scholars have found that the main advantage of neural networks is its good accuracy, especially when the variables are nonlinear, compared with other artificial intelligence (AI) models such as gene expression programming (GEP). The GEP model is more sensitive to the quality of observations than NN models, so its performance is usually inferior to NN models [18,19,20]. Due to the influences of observation field environment, climate, instrument performance, installation mode, and human factors, the precipitation observations often have systematic random errors. Therefore, NN models are a good choice in predicting precipitation. The deep learning model can automatically learn complex time patterns through high-level abstraction and nonlinear transformation and achieve approximations of complex functions compared with the simple NN model [21]. Thus, deep learning models such as LSMT can solve the nonlinear and periodic problems presented by rainfall forecasting [10,22]. However, the functioning of LSTM is governed by other factors, such as sample sizes and noise factors. In short, it is not sensible to use single LSTM or single ARIMA to predict rainfall because each individual model may not perform well in all circumstances. On the other hand, hybrid technologies combine the superiorities of several models used for time series data to overcome the shortcomings of each model and improve prediction accuracy. In most cases, hybrid models achieve higher prediction than any single model [1,4,23,24]. For example, Shishegaran et al. [23] developed a hybrid model for predicting air quality index by combining ARIMA and GEP. Mehdizadeh et al. [24] developed hybrid models GEP-FARIMA, MARS-FARIMA, MLR-FARIMA, GEP-SETAR, MARS-SETAR and MLR-SETAR for modeling monthly streamflow; it showed that the hybrid models offered more accurate results than the single models and MLR-FARIMA and MLR-SETAR models. As such, this study presents a new hybrid wavelet-ARIMA-LSTM that takes advantage of the unique strengths of wavelet transformation, ARIMA and LSTM for accurately predicting monthly precipitation.
Drought is generally classified as meteorological drought, agricultural drought, hydrological drought or socioeconomic drought by drought timescales and impacts [25,26,27]. Among these categories, meteorological drought usually precedes other types of drought and is determined by the degree of lack of precipitation in an area over a period of time. This paper studies meteorological drought. Due to the different classification criteria, each drought event has a different drought severity level. Many meteorological drought indices are used to describe the hydrometeorological characteristics of drought at different scales and include the China Z-Index (CZI) [28,29,30,31,32], which is used in this paper.
Drought is a complex phenomenon and is one of the most unpredictable natural disasters [33,34,35]. The causes of drought are extremely complex and are related not only to natural factors such as meteorology but also to human activities; thus, data collection and selection of potential influencing factors of drought are difficult. When faced with cases of inadequate sample sizes and poor information, accurate forecasting of drought events is a difficult task. The important problem in drought prediction is how to make accurate predictions under uncertain systems. The grey model GM (1, 1), which was introduced by Deng [36], focuses on resolving uncertain problems with small sample sizes [37]. GM (1, 1) can effectively reflect the exponential growth characteristics of system change trends [38] because its time response function corresponds to an exponential function. A discrete grey model DGM (1, 1) was proposed by Xie and Liu [39] to address the prediction errors due to the change in the traditional grey model from discrete to continuous. DGM (1, 1) has the advantages of fully fitting pure exponential sequences, no restrictions on the development coefficient, and broadens the application scope of the model. However, in actual situations, the unique superiorities of DGM (1, 1) cannot be fully utilized because the data are basically inconsistent with exponential growth, which causes scholars to usually choose GM (1, 1) instead of DGM (1, 1) when solving practical problems. Since first being proposed, grey prediction models have been broadly employed in various fields, such as electricity consumption prediction [40,41], air pollution forecasting [42,43,44] and energy forecasting [45,46,47]. Such practical applications show that grey prediction models have wide applicability, especially in situations with incomplete information and inaccurate data. Grey prediction models have successfully dealt with various problems, but only a few scholars have used these models to study drought prediction, while prediction of drought events conforms to the characteristics of grey systems. Therefore, this paper uses GM (1, 1) and DGM (1, 1) to predict the occurrence of drought events. In addition, we choose GM (1, 1) and DGM (1, 1) because that they are the most basic and widely used grey prediction models.
Generally, hybrid models have higher prediction accuracy than single models. In this paper, the wavelet-ARIMA-LSTM method are proposed for the first time. It combines the advantages of wavelet, ARIMA and LSTM and can predict future precipitation more accurately. Drought is considered to be the most incomprehensible and least understood disaster by many researchers. It is very difficult to achieve accurate forecasting of drought events when facing the problems of insufficient samples and poor information. The grey system model places a particular emphasis on dealing with the uncertainty brought by small samples. Based on this, the study uses GM (1, 1) and DGM (1, 1) to predict drought years for drought risk analyses and drought warnings. The major objectives of this study are: (1) to develop a hybrid wavelet-ARIMA-LSTM method to predict monthly precipitation for the period 1967–2017 in Northeast China; (2) to analyze drought characteristics in Northeast China based on the drought index, CZI; and (3) to use GM (1, 1) and DGM (1, 1) to predict the occurrence of drought events and compare the predictive capabilities of the two methods. It is expected that the research results will help to provide decision support for rainfall predictions, which in turn will help in planning adaptative measures to reduce drought impacts and provide decision support for disaster prevention.
2. Data and Methodology
2.1. Study Area
In this study, the study area includes three stations, namely Changchun, Linjiang and Qian Gorlos in Jilin province, Northeast China between 41° N to 46° N and 122° E to 131° N and experience a temperate continental monsoon climate. The climate of Jilin province is classified into different categories of humid climatic conditions. Qian Gorlos is located in northwestern Jilin province, which is arid and semi-arid, while Linjiang is located in southeastern Jilin province, which is humid and semi-humid. The climate of Changchun represents a transitional zone between the semi-humid mountains to the east and semi-arid plains to the west. The locations of the stations used in Jilin province, Northeast China, shown in Figure 1. Table 1 presents the geographical coordinates and climatic conditions of the three selected stations.
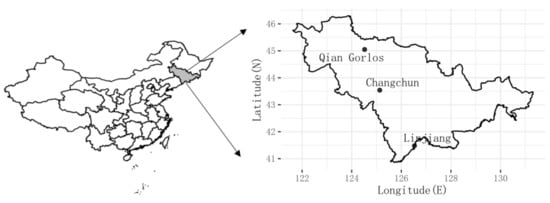
Figure 1.
Geographical location of the study area in Jilin province, Northeast China.

Table 1.
Geographical coordinates and climates for the selected stations.
2.2. Site Precipitation Observations
The observed monthly and annual precipitation data for the studied regions were collected from the National Meteorological Information Center (NMIC) of the China Meteorological Administration (CMA) from January 1967 to December 2017. In this study, monthly rainfall time series data from the studied stations were utilized for precipitation predictions, while annual rainfall amounts were utilized for drought analyses and predictions. For precipitation predictions, the monthly data between 1967 and 1997 (approximately 60% of the total data, i.e., 31 × 12 = 372 data points) were used to train the models, and the monthly data from 1998 to 2017 (40% of the total data, i.e., 20 × 12 = 240 data points) were used to test the models. For drought analyses and predictions, the annual data between 1967 and 1997 (approximately 60% of the total data, i.e., 31 data points) were employed to train the grey prediction models, and the remaining data were employed to test these models.
Figure 2 shows the time series plots of observed monthly precipitation over 51 years for three stations throughout the study period. As indicated in Figure 3, precipitation in July and August is much higher than in other months, and the average value for each month is not the same. These data reflect a notable seasonal effect, which is consistent with the sequence chart shown in Figure 2. It is worth noting that precipitation time series must be normalized to eliminate the dimensions of observational precipitation datasets and map the data to the range of 0~1, which is more convenient and faster. Here, all monthly precipitation data were normalized as follows:
where , , and denote the normalized precipitation data, observed precipitation, minimum value of observed data, and maximum value of observed data, respectively.
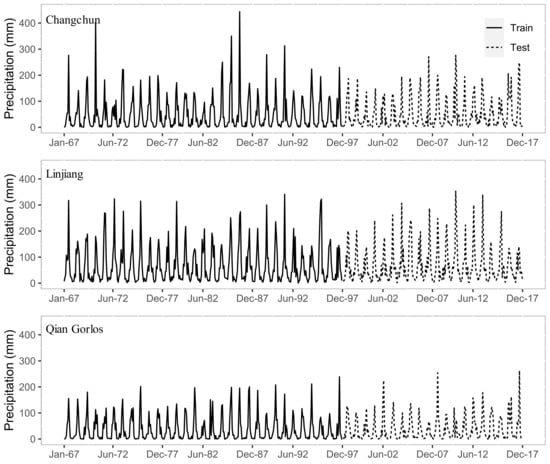
Figure 2.
Time series of the observed monthly precipitation data during the training period of 1967–1997 and testing period of 1998–2017.
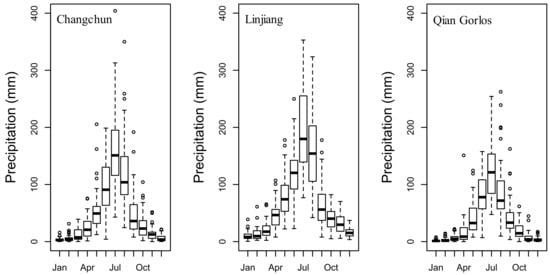
Figure 3.
Boxplots of monthly precipitation amounts for the period from 1967 to 2017.
2.3. Time Series Models on Monthly Precipitation
2.3.1. Autoregressive Integrated Moving Average (ARIMA)
The ARIMA method proposed by Box and Jenkins [48] has gained great popularity in many fields, and research experience has confirmed its strength and flexibility [1,10]. It is a stochastic sequential model that is trained to forecast future data points. The model can capture complex patterns and relationships as it can combine capturing observations of lagged terms and white noise. The ARIMA consists of three parts: autoregressive (AR), integration (I), moving average (MA). The corresponding parameters are p, d, and q. The general ARIMA model is called ARIMA (p, d, q). The method is composed of three main steps: identification, estimation parameters, and forecasting [1,4,49].
2.3.2. Long Short-Term Memory Method (LSTM)
A traditional RNN which is a type of artificial neural network, readily introduces the problems of gradient disappearance and explosion, thereby making it difficult to capture long-term time correlations. Long short-term memory (LSTM) is a type of time-cyclic neural network, that is specifically used to solve the long-term correlation problem of general RNN. The LSTM proposed by Hochreiter and Schmidhuber [50] was initially used in the field of deep learning and was popularized by researchers in subsequent work [51].
The network takes three inputs and two outputs, as shown in Figure 4. For the inputs, is the input of the current time step, is the output of the last LSTM unit, is the memory of the previous unit, is the output of the current network, and is the memory of the current unit. The LSTM model has an input gate , output gate and forget gate . There are three stages in the LSTM. The first is the forgetting stage, which mainly is used to selectively forget the input from the previous node. Specifically, the calculated is used as the forget gate to control which parts of in the previous state need to be retained and which needs to be forgotten. The second stage is the selective memory stage, which selectively memorizes the input . If input is important, it should be noted down, and if it is not, it should be noted less. The third stage is the output phase, which determines which outputs will be treated as the current state [52].
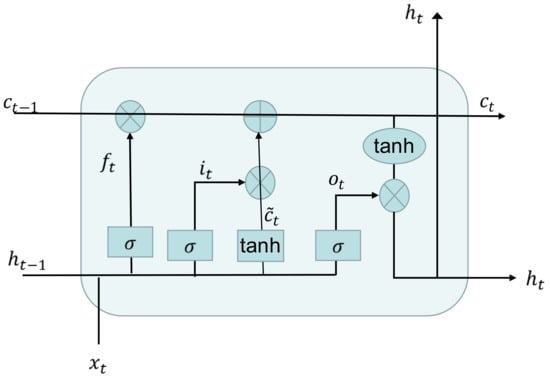
Figure 4.
The module in the long short-term memory (LSTM) contains four interacting layers.
The LSTM equations are as follows [22,52]:
where , and present the activations of the forget gate state, input state and output gate, respectively, at time step t; is the current input cell state; and are the cell state vectors at time t and t − 1; and are the hidden state vectors also known as output vectors at time t and t−1; and tanh denote the sigmoid function and hyperbolic tangent function; and represent the weight matrix and bias of the forget gate layer; similarly, and represent the weight matrix and bias of the input gate, and represent the weight matrix and bias of the unit state, and and represent the weight matrix and bias of the output gate, respectively.
2.3.3. Discrete Wavelet Transformation (DWT)
Wavelet analysis methods can be classified into continuous wavelet transformation (CWT) and discrete wavelet transformation (DWT) [1,53]. The main difference between the two is that continuous transformations operate on all possible scaling and translation values, while discrete transformation uses a specific subset of all scaling and shifting values. The main disadvantage of the CWT is that the construction of the CWT inverse is more complicated and thereby computationally difficult. Discrete wavelet transforms are widely used in the prediction field because of their short calculation times and easy application. This paper chooses DWT since DWT simplifies the transformation process and reduces the workload; the discrete wavelet transform can still produce very effective and accurate analysis results. DWT adopts the following form [53]:
where a and b are integers that control the scale and time; denotes the mother wavelet; denotes a dilation step with a constant value that is greater than 1; and represents a position variable with value greater than zero. The most common selections for the parameters for and are 2 and 1, respectively. When a time series is discrete with a value of occurring at discrete time t, the wavelet coefficient () of DWT becomes [53]:
The wavelet coefficients of the wavelet transform are calculated at scale and locations , which reveal the signal changes at different scales and locations [53].
2.3.4. Development of Wavelet-ARIMA-LSTM (W-AL) Model
In time-series applications, although there are many available time series models, none of them can provide the best results in various situations. A large number of time series prediction studies have indicated that hybrid methods can improve prediction performance [4]. By making full use of the advantages of each method in the combination model, the error risk from using an inappropriate method is reduced, and more accurate results are obtained. In this study, we develop a new hybrid method for time series forecasting that combines the strengths of wavelet transformation, ARIMA and LSTM.
The method is divided into decomposition and reconstruction. First, the original sequence is decomposed by high pass (detail) and low (approximate) pass filters, and the high-frequency and low-frequency components of the sequence are extracted respectively. Then, ARIMA is used to estimate the approximate signal, and LSTM is used to estimate the detailed part of the signal. Finally, the predicted wavelet coefficients obtained are used to reconstruct the data. The main advantage of WT is that it can analyze and process over different time scales. Figure 5 shows the framework of the wavelet-ARIMA-LSTM model development. Debauches’ (db4) mother wavelet was used for decomposing the rainfall time series in this study. The monthly rainfall prediction accuracy of the W-AL models was compared to that of the single ARIMA and LSTM models.
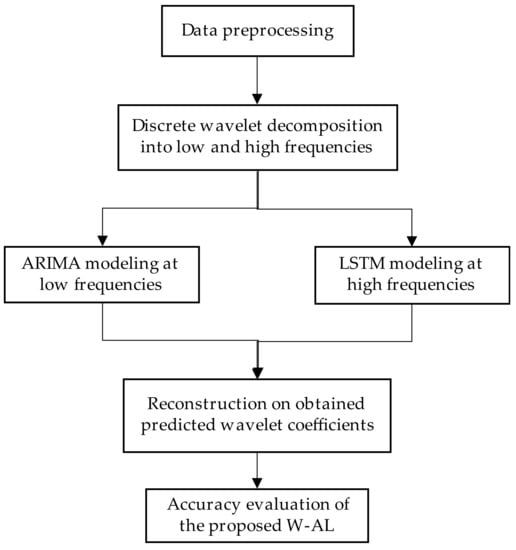
Figure 5.
Framework of wavelet-autoregressive integrated moving average (ARIMA)-LSTM model.
2.3.5. Evaluation Metrics
To analyze the reliability and forecasting performance of the model, it is necessary to verify the accuracy of the models. The root mean square error (RMSE), which represents the standard deviation of the predicted results of the models; mean absolute error (MAE) which directly provides the average difference between the predicted results and actual data; and coefficient of determination (R2), which provides a way to assess the results of the same model on different data, are adopted to assess the performance of the models. Smaller RMSE and MAE values indicate better model performance, and larger R2 values indicate better model performance. The criteria are defined as follows:
where n, , and represent the number of observations, observed data, predicted data and the mean of the observed data, respectively.
2.4. Grey System Models on Drought Events
2.4.1. China Z-Index (CZI)
There are many kinds of indicators for assessing drought, and the annual precipitation amount is an important sign of drought. Drought determined by using annual precipitation is generally called meteorological drought, and the year in which the meteorological drought occurs is referred to as the drought year. This paper chose the drought index CZI.
CZI, which was developed by the National Climate Centre (NCC) of China in 1995 as an alternative to the SPI [30] is used to describe drought conditions [28,29,31]. The value of CZI is calculated as:
where is the coefficient of skewness, is the standard variation, and the calculation formulas can be represented as follows:
where is the standard deviation, is the mean of the observation values, and n is the number of observation values. The classifications of drought severity levels for CZI are given in Table 2.

Table 2.
Classification of drought categories for the meteorological drought indices China Z-Index (CZI) [27].
2.4.2. Grey Prediction Models
Grey prediction theory, as a significant part of grey system theory, addresses problems with small sample sizes and inadequate information [37]. The most important feature of grey prediction models is that they have relatively loose requirements for the collected data for the study of the problem. This theory can take all random variables as the object of study, and then regard their random nature as a time-related grey process. When grey prediction models are applied to the prediction of drought years, there is no need to know any a priori characteristics of the original data distribution, the test accuracy after modeling is high, and the models can better reflect the actual situation.
Drought is a complicated phenomenon and is one of the most unpredictable natural disasters. Therefore, data collection and selecting the potential influencing factors of drought are difficult tasks. Meanwhile, drought occurrences are irregular and discontinuous events, and their prediction methods are more difficult. Grey prediction models can use fewer data to obtain the desired results. Thus, considering that predictions of drought years conform to the characteristics of grey system models, this paper used GM (1, 1) and DGM (1, 1) [38,39,47], as the most fundamental and extensively used grey prediction models. The descriptions of the processes and computations of the GM (1, 1) and DGM (1, 1) methods are detailed in Wang et al. [38].
GM (1, 1) has the problem of prediction error caused by the abrupt change from discrete to continuous. Therefore, DGM (1, 1) proposed by Xie and Liu [38] make up for the defects of the traditional GM (1, 1). DGM (1, 1), which can be called the discrete form of the GM (1, 1) model, is superior to the GM (1, 1) because it can fully fit the pure exponential sequences and has no limit to the development coefficients. However, due to the interference of random factors in the actual data generation process, the superiority of DGM (1, 1) over GM (1, 1) cannot be widely and reliably verified in practical applications. For the univariate non-negative time series . The sequence is the first-order accumulation generation of , where . The DGM (1, 1) is defined as follows [38]:
Tests of grey prediction models mainly include residual tests and posterior variance tests. The residual test calculates the absolute where and represent the univariate nonnegative time series and the first-order accumulation generation of respectively, and the relative error between the original sequence and the grey prediction sequence. The smaller the relative error, the higher the accuracy of the model. The posterior-variance test includes two indices: the variance ratio C and small error possibility P. The specific functions can be expressed as [38]:
Then, the variance ratio , is computed and then the small error probability is computed. The accuracy of the models is determined according to the Table 3. If both the residual test and posterior variance test are qualified, the model can be used for prediction.

Table 3.
Evaluation standards of the posterior-variance test [38].
3. Results and Discussions
3.1. Time Series Analysis of Monthly Precipitation Amounts
The rainfall time series data are separated into two detailed subseries and one approximate subseries by db4 mother wavelet, which is a frequently used wavelet for the DWT. Because the two detailed subsequences of the wavelet are nonlinear, LSTMs are used to predict the nonlinear time series. Meanwhile, because one approximate subsequence of wavelet is linear, ARIMA is used for prediction. Finally, the predicted values of ARIMA and LSTM are used to reconstruct the data series.
In the present research, the proposed W-AL was compared with the single ARIMA and LSTM models by adopting three statistical indicators for evaluating the performance of W-AL for predicting precipitation at the monthly scale and the results of the comparisons for the test stages are presented in Table 4. Performance comparisons of the best-fitted models indicated that W-AL was the best performer and was followed by LSTM and then ARIMA. For Changchun, the RMSE values ranged from 31.086 to 38.698, MAE from 22.215 to 25.256, and R2 from 0.578 to 0.728. For Linjiang, the RMSE values ranged from 35.772 to 42.739, MAE from 21.712 to 29.439, and R2 from 0.626 to 0.738. For Qian Gorlos, the RMSE values ranged from 27.064 to 37.535, MAE from 19.111 to 21.712, and R2 from 0.366 to 0.670. These results indicated that the best RMSE and MAE values were found for Qian Gorlos, while the best R2 value was found for Linjiang. However, RMSE and MAE values have limitations; that is, the same algorithm model that is utilized to predict monthly precipitation at different stations, cannot reflect the fitting effect of the model at different stations. Because the dimensions of the data are different at different stations, it is impossible to directly compare the predicted values, and it is impossible to determine the stations for which the model performs better. In contrast, R2 converts the predicted results into accuracies, and the results all fall between 0 and 1. For the prediction accuracies of different stations, it is possible to employ R2 to compare and determine which stations perform better. Based on this, it can be found that the fitting effect of the model was best in Linjiang with humid and semi-humid climate type and was worst in Qian Gorlos with arid and semi-arid climate type which revealed the model predicted better in humid region and worse in arid region.

Table 4.
Obtained error statistics for the ARIMA, LSTM and wavelet-ARIMA-LSTM (W-AL) models for the test period from 1998 to 2017.
Figure 6 shows comparisons between the observed and estimated monthly precipitation amounts from the ARIMA, LSTM and W-AL models during the test period. The monthly precipitation estimates of the W-AL model outperformed those of the ARIMA and LSTM models. For further evaluation of the accuracy of the proposed W-AL model, scatter plots were drawn for the predicted values that were obtained by the W-AL model against the observations in Figure 7. The correlation coefficients (CC) of W-AL were 0.873, 0.880 and 0.655 at Changchun, Linjiang and Qian Gorlos, respectively which demonstrated that the precipitation estimates of W-AL had strong, positive, linear correlations and consistency.
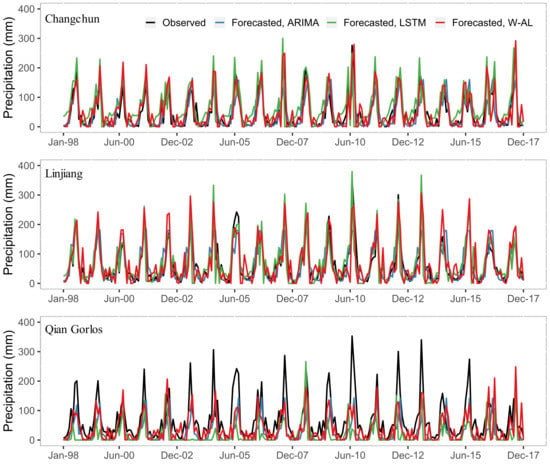
Figure 6.
Observed versus forecasted monthly precipitation data for the ARIMA, LSTM and W-AL models for the test period from 1998 to 2017.
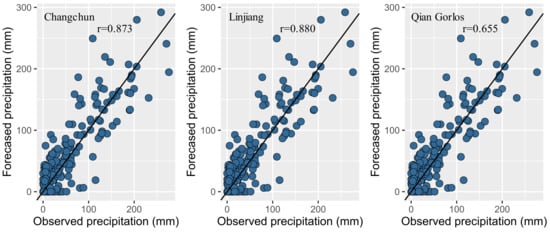
Figure 7.
Scatter plots of observed and forecasted monthly precipitation for the W-AL model for the test period from 1998 to 2017.
In order to illustrate the superiority of the W-AL model, this paper also used 70:30, 80:20 and 90:10 as different proportions of training and test sets. The RMSE values also show that the proposed W-AL model is superior to LSTM and ARIMA under different ratios as shown in Table 5. It can be found that the prediction accuracies of the LSTM and W-AL present an overall trend of increasing with the increase of the proportion of training sets. The prediction accuracy reaches the highest when the ratio training:test is 80:20 at Changchun and Linjiang, while it is 90:10 at Qian Gorlos.

Table 5.
Obtained RMSE statistics for the W-AL models at different ratio training:test for the test period from 1998 to 2017.
More accurate rainfall prediction can not only boost drought research, but also become an important reference for the impending severe weather warning. The study area, Northeast China, is one of the most important grain and animal husbandry production regions, while modern statistical analyses on precipitations and droughts here are relatively limited. Northeast China, which is recognized as a sensitive area of climatic change in global climate models due to its continental monsoon climate, suffers drought events and rainstorm consecutively [54,55]. This has resulted in numerous negative impacts on the national economy of the region. Therefore, the investigation on the rainfall prediction play a vital function in improving the risk management and prevention of meteorological disaster such as droughts. In this paper, the W-AL can improve the prediction accuracy of monthly precipitation compared with single ARIMA and LSTM methods, and becomes a new method for the statistical procedures to predict rainfall. On one hand, ARIMA has better prediction accuracy and flexibility for different types of time series data than other linear methods [6,7,8,9,10], while linear methods cannot capture the nonlinear characteristics of rainfall processes. LSTM, as a nonlinear method, can automatically learn complex time patterns through high-level abstraction and nonlinear transformation and achieve approximations of complex functions compared with the simple NN models. Thus, LSTM has a good accuracy, especially when the variables are nonlinear over other nonlinear methods like GEP which is more sensitive to the quality of the measured data [18,19,20]. On the other hand, hybrid methods can combine the superiorities of several models to overcome the shortcomings of each single model, and accordingly improve prediction accuracy in most cases [1,4,24]. After all, this paper uses the W-AL, ARIMA and LSTM to predict monthly precipitation in Northeast China to illustrate the predictive power of the W-AL over any single model at different climate types. Besides, this paper considers different ratios of training and test sets to conduct further research on the superiority of the W-AL model.
3.2. Grey System Analysis for Drought Events
3.2.1. Identification of Drought Events
Drought events at the three stations were analyzed by using CZI calculated from the annual precipitation time series data. Figure 8 displays the annual CZI that was obtained for Changchun, Linjiang and Qian Gorlos for the period from 1967 to 2017. As seen in Figure 8, all stations experienced some level of drought in the 1980s, mid 2000s, and early 2010s.
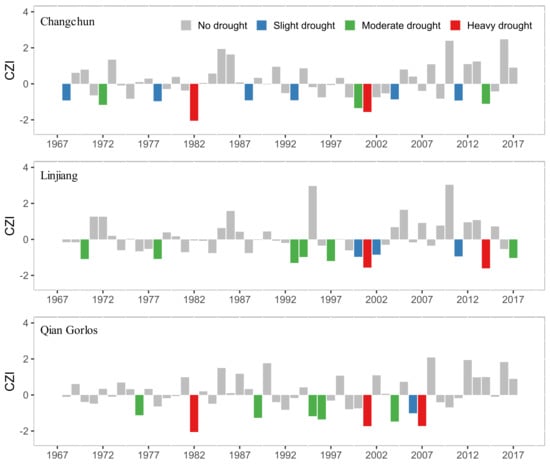
Figure 8.
Drought events categorized following the annual CZI for the period from 1967 to 2017.
In Changchun, six slight drought events occurred during 1968–2011; moderate drought events occurred in 1972, 2000 and 2014; and heavy drought events occurred in 1998 and 2001. In Linjiang, two drought events occurred between 1967 and 1992; however, droughts became frequent after 1993. Three slight drought events occurred after 2000; six moderate drought events occurred from 1970 to 2017; and two heavy drought events occurred in 2001 and 2014. In Qian Gorlos, no drought events occurred between 1967 and 1975; however, moderate and heavy droughts became frequent after 1976. One slight drought event occurred in 2006; five moderate drought events occurred between 1976 and 2004; and three heavy drought events occurred in 1982, 2001 and 2007. These results demonstrated that there were more slight drought events in Changchun, and more moderate drought events in Linjiang and Qian Gorlos. Moreover, in 2001, heavy drought events occurred at all three stations, and after 1987, drought events became more frequent.
3.2.2. Projections of Drought Events
The GM (1, 1) and DGM (1, 1) prediction models were established for the annual drought events of Changchun, Linjiang and Qian Gorlos from 1998 to 2017 to predict the annual drought events from 1998 to 2017 and to compare these with actual drought events. According to the classification results of drought statistics in CZI, drought years for a 31-year period were selected. Since the grey prediction models have better prediction effects for small numbers of sample data, the corresponding numbers of drought years after 1972 were selected to establish the initial sequence in Changchun, Linjiang and Qian Gorlos. Finally, the parameter estimations of GM (1, 1) and DGM (1, 1) prediction models are shown in Table 6.

Table 6.
Parameter estimations of GM (1, 1) and DGM (1, 1) for drought events at three stations.
The actual drought years and forecasted drought years of the two models are presented in Table 7. As seen, the GM (1, 1) model predicted that the drought years after 1998 in Changchun were 2001 and 2012, while heavy drought actually occurred in 2001 and a slight drought occurred in 2001. The prediction indicated drought years in Linjiang for 2007 and 2017, while moderate drought occurred in 2017 and slight drought occurred in 2007. The prediction indicated drought years in Qian Gorlos for 2004 and 2012, while heavy drought occurred in 2007 and moderate drought occurred in 2004. The DGM (1, 1) predicted drought years after 1998 in Changchun for 2002 and 2013, while drought actually occurred in 2001 and 2014. The prediction indicated drought years in Linjiang for 2006 and 2015, while actual drought occurred in 2002 and 2014. The prediction indicated drought years in Qian Gorlos for 2004 and 2012, which were the same as the GM (1, 1) results. In contrast, GM (1, 1) performed better than DGM (1, 1). The average relative error values for GM (1, 1) were higher in Linjiang and were followed by Qian Gorlos, while Changchun showed a minimum.

Table 7.
Forecasted drought events and average relative errors for GM (1, 1) and DGM (1, 1).
In summary, the prediction results of GM (1, 1) performed better than DGM (1, 1) such that GM (1, 1) is used to predict drought years for different drought levels. Furthermore, GM (1, 1) predicted poorly in relatively humid regions and well in relatively arid regions.
This paper studies the rainfall and drought in Northeast China from two aspects. Firstly, take the monthly rainfall time series data into consideration, and the proposed hybrid model W-AL is employed to predict the rainfall, so as to improve the prediction accuracy and carry out drought warning better, which has been discussed in the previous section. Secondly, considering the annual rainfall data, drought events and severity can be identified by drought index CZI and the occurrence of drought events can be predicted by grey system methods GM (1, 1) and DGM (1, 1). The grey prediction models have been widely concerned by academic circles [35,36,37,38,39,40,41,42], but only a few scholars have used the models to study drought prediction. The biggest characteristic of the grey prediction model is that the data collected are relatively loose, which solves the problems of small sample size and insufficient information. Drought occurrence, which is irregular and discontinuous, conforms to the characteristics of grey system models such as GM (1, 1) model with DGM (1, 1) [42].
4. Conclusions
This study employed the proposed W-AL, single ARIMA and single LSTM to predict precipitation, using monthly data over a long period of from1967 to 2017 for three stations. Additionally, drought analysis by using the CZI drought index, using annual precipitation amounts for the same years was carried out. Finally, drought years, as classified by the CZI, applying the grey prediction models of GM (1, 1) and DGM (1, 1), were predicted. The following main conclusions are drawn from this study.
The proposed W-AL model at different ratios of training and test sets all exhibited higher prediction accuracy than the ARIMA and LSTM, based on different climate types for monthly precipitation data. In addition, by comparing the R2 values obtained by the W-AL models of the three stations, it can be found that the fitting effect of the W-AL method in Linjiang with humid and semi-humid climate type was best and was followed by Changchun with semiarid and semihumid climate type and Qian Gorlos with arid and semiarid type.
The drought index CZI results revealed that, drought events have become more frequent since 1987, and that all stations experienced some levels of drought in the 1980s, mid-2000s and early 2010s. On the other hand, the results indicated that there were more numerous slight drought events in Changchun and more numerous moderate drought events in Linjiang and Qian Gorlos.
GM (1, 1) and DGM (1, 1) were used to predict drought years. According to the results, GM (1, 1) always showed higher accuracy than DGM (1, 1) at different climate types, with an average relative error of 2.22% at a minimum and 6.66% at a maximum. Therefore, GM (1, 1) was applied to predict drought years that were close to the actual conditions. Additionally, the best prediction effect for drought events was relatively arid areas, and the worst was a relatively humid area.
Author Contributions
Conceptualization, X.W. and J.Z.; methodology, J.Z.; formal analysis, J.Z.; funding acquisition, X.W. and H.Y.; resources, X.W., J.H., H.S. and F.X.; supervision, D.L.; writing—original draft preparation: X.W., J.Z., K.X. and Y.C.; writing—review and editing, X.W. and J.Z.; visualization, J.Z. All authors have read and agreed to the published version of the manuscript.
Funding
This research was supported by the National Key R&D Program of China (Grant No. 2018YFC1507905), and National Natural Science Foundation of China (42075068, 41505118, 41605045, 41975176 and 71701105).
Institutional Review Board Statement
Not applicable.
Informed Consent Statement
Informed consent was obtained from all subjects involved in the study.
Data Availability Statement
Publicly available datasets were analyzed in this study. This data can be found here: http://data.cma.cn/.
Acknowledgments
We appreciate the associate editor and reviewer for their constructive comments that contributed to improving the manuscript.
Conflicts of Interest
The authors declare no conflict of interest.
References
- Khan, M.M.H.; Muhammad, N.S.; El-Shafie, A. Wavelet based hybrid ANN-ARIMA models for meteorological drought forecasting. J. Hydrol. 2020, 590, 125380. [Google Scholar] [CrossRef]
- Yang, P.; Zhang, Y.; Xia, J.; Sun, S. Identification of drought events in the major basins of Central Asia based on a combined climatological deviation index from GRACE measurements. Atmos. Res. 2020, 244, 105105. [Google Scholar] [CrossRef]
- Ndlovu, M.S.; Demlie, M. Assessment of Meteorological Drought and Wet Conditions Using Two Drought Indices across KwaZulu-Natal Province, South Africa. Atmosphere 2020, 11, 623. [Google Scholar] [CrossRef]
- Büyükşahin, Ü.Ç.; Ertekin, Ş. Improving forecasting accuracy of time series data using a new ARIMA-ANN hybrid method and empirical mode decomposition. Neurocomputing 2019, 361, 151–163. [Google Scholar] [CrossRef]
- Tang, R.; Zeng, F.; Chen, Z.; Wang, J.S.; Huang, C.M.; Wu, Z. The Comparison of Predicting Storm-time Ionospheric TEC by Three Methods: ARIMA, LSTM, and Seq2Seq. Atmosphere 2020, 11, 316. [Google Scholar] [CrossRef]
- Beyaztas, U.; Yaseen, Z.M. Drought interval simulation using functional data analysis. J. Hydrol. 2019, 579, 124141. [Google Scholar] [CrossRef]
- Valipour, M.; Banihabib, M.E.; Behbahani, S.M.R. Comparison of the ARMA, ARIMA, and the autoregressive artificial neural network models in forecasting the monthly inflow of Dez dam reservoir. J. Hydrol. 2013, 476, 433–441. [Google Scholar] [CrossRef]
- Li, S.; Wang, Q. India’s dependence on foreign oil will exceed 90% around 2025-The forecasting results based on two hybridized NMGM-ARIMA and NMGM-BP models. J. Clean Prod. 2019, 232, 137–153. [Google Scholar] [CrossRef]
- Selvaraj, J.J.; Arunachalam, V.; Coronado-Franco, K.V.; Orjuela, L.V.R.; Yara, Y.N.R. Time-series modeling of fishery landings in the Colombian Pacific Ocean using an ARIMA model. Reg. Stud. Mar. Sci. 2020, 39, 101477. [Google Scholar] [CrossRef]
- Hernandez-Matamoros, A.; Fujita, H.; Hayashi, T.; Perez-Meana, H. Forecasting of COVID19 per regions using ARIMA models and polynomial functions. Appl. Soft. Comput. 2020, 96, 106610. [Google Scholar] [CrossRef]
- Diez-Sierra, J.; del Jesus, M. Long-term rainfall prediction using atmospheric synoptic patterns in semi-arid climates with statistical and machine learning methods. J. Hydrol. 2020, 586, 124789. [Google Scholar] [CrossRef]
- Xiang, Y.; Gou, L.; He, L.; Xia, S.; Wang, W. A SVR–ANN combined model based on ensemble EMD for rainfall prediction. Appl. Soft. Comput. 2018, 73, 874–883. [Google Scholar] [CrossRef]
- Ahmed, G.E.; Daniel, W.S. A neural network model to predict the wastewater inflow incorporating rainfall events. Water Res. 2002, 36, 1115–1126. [Google Scholar] [CrossRef]
- Pham, B.T.; Le, L.M.; Le, T.T.; Bui, K.T.T.; Le, V.M.; Ly, H.B.; Prakash, I. Development of advanced artificial intelligence models for daily rainfall prediction. Atmos. Res. 2020, 237, 104845. [Google Scholar] [CrossRef]
- Shu, C.; Ouarda, T.B.M.J. Flood frequency analysis at ungauged sites using artificial neural networks in canonical correlation analysis physiographic space. Water Resour. Res. 2007, 43, W07438. [Google Scholar] [CrossRef]
- Tripathi, S.; Srinivas, V.V.; Nanjundiah, R.S. Downscaling of precipitation for climate change scenarios: A support vector machine approach. J. Hydrol. 2006, 330, 621–640. [Google Scholar] [CrossRef]
- Zheng, F.; Maier, H.R.; Wu, W.; Dandy, G.C.; Gupta, H.V.; Zhang, T. On lack of robustness in hydrological model development due to absence of guidelines for selecting calibration and evaluation data: Demonstration for data-driven models. Water Resour. Res. 2018, 54, 1013–1030. [Google Scholar] [CrossRef]
- Debnath, S.; Madhusoothanan, M.; Srinivasamoorthy, V.R. Prediction of air permeability of needle-punched nonwoven fabrics using artificial neural network and empirical models. Indian J. Fibre Text. Res. 2000, 25, 251–255. [Google Scholar]
- Landeras, G.; López, J.J.; Kisi, O.; Shiri, J. Comparison of Gene Expression Programming with neuro-fuzzy and neural network computing techniques in estimating daily incoming solar radiation in the Basque Country (Northern Spain). Energy Conv. Manag. 2012, 62, 1–13. [Google Scholar] [CrossRef]
- Yassin, M.A.; Alazba, A.A.; Mattar, M.A. Artificial neural networks versus gene expression programming for estimating reference evapotranspiration in arid climate. Agric. Water Manag. 2016, 163, 110–124. [Google Scholar] [CrossRef]
- Li, T.; Wu, T.; Liu, Z. Nonlinear unsteady bridge aerodynamics: Reduced-order modeling based on deep LSTM networks. J. Wind Eng. Ind. Aerodyn. 2020, 198, 104116. [Google Scholar] [CrossRef]
- Poornima, S.; Pushpalatha, M. Prediction of Rainfall Using Intensified LSTM Based Recurrent Neural Network with Weighted Linear Units. Atmosphere 2019, 10, 668. [Google Scholar] [CrossRef]
- Shishegaran, A.; Saeedi, M.; Kumar, A.; Ghiasinejad, H. Prediction of air quality in Tehran by developing the nonlinear ensemble model. J. Clean Prod. 2020, 259, 120825. [Google Scholar] [CrossRef]
- Mehdizadeh, S.; Fathian, F.; Adamowski, J.F. Hybrid artificial intelligence-time series models for monthly streamflow modeling. Appl. Soft. Comput. 2019, 80, 873–887. [Google Scholar] [CrossRef]
- El Kenawy, A.M.; Al Buloshi, A.; Al-Awadhi, T.; Al Nasiri, N.; Navarro-Serrano, F.; Alhatrushi, S.; Robaa, S.M.; Domínguez-Castro, F.; McCabe, M.F.; Schuwerack, P.; et al. Evidence for intensification of meteorological droughts in Oman over the past four decades. Atmos. Res. 2020, 246, 105055. [Google Scholar] [CrossRef]
- Esfahanian, E.; Nejadhashemi, A.P.; Abouali, M.; Adhikari, U.; Zhang, Z.; Daneshvar, F.; Herman, M.R. Development and evaluation of a comprehensive drought index. J. Environ. Manag. 2017, 185, 31–43. [Google Scholar] [CrossRef]
- Yao, N.; Zhao, H.; Li, Y.; Biswas, A.; Feng, H.; Liu, F.; Pulatov, B. National-Scale Variation and Propagation Characteristics of Meteorological, Agricultural, and Hydrological Droughts in China. Remote Sens. 2020, 12, 3407. [Google Scholar] [CrossRef]
- Dogan, S.; Berktay, A.; Singh, V.P. Comparison of multi-monthly rainfall-based drought severity indices, with application to semi-arid Konya closed basin, Turkey. J. Hydrol. 2012, 470, 255–268. [Google Scholar] [CrossRef]
- Jain, V.K.; Pandey, R.P.; Jain, M.K.; Byun, H.R. Comparison of drought indices for appraisal of drought characteristics in the Ken River Basin. Weather. Clim. Extremes. 2015, 8, 1–11. [Google Scholar] [CrossRef]
- Mahmoudi, P.; Rigi, A.; Kamak, M.M. Evaluating the sensitivity of precipitation-based drought indices to different lengths of record. J. Hydrol. 2019, 579, 124181. [Google Scholar] [CrossRef]
- Wu, H.; Hayes, M.J.; Weiss, A.; Hu, Q.I. An evaluation of the standardized precipitation index, the china-Zindex and the statistical Z-Score. Int. J. Clim. 2001, 21, 745–758. [Google Scholar] [CrossRef]
- Javed, T.; Li, Y.; Rashid, S.; Li, F.; Hu, Q.; Feng, H.; Chen, X.; Ahmad, S.; Liu, F.; Pulatov, B. Performance and relationship of four different agricultural drought indices for drought monitoring in China’s mainland using remote sensing data. Sci. Total Environ. 2020, 143530. [Google Scholar] [CrossRef] [PubMed]
- Hao, Z.; Singh, V.P.; Xia, Y. Seasonal drought prediction: Advances, challenges, and future prospects. Rev. Geophys. 2018, 56, 108–141. [Google Scholar] [CrossRef]
- Kiem, A.S.; Johnson, F.; Westra, S.; van Dijk, A.; Evans, J.P.; O’Donnell, A.; Jakob, D. Natural hazards in Australia: Droughts. Clim. Chang. 2016, 139, 37–54. [Google Scholar] [CrossRef]
- Mossad, A.; Alazba, A.A. Drought forecasting using stochastic models in a hyper-arid climate. Atmosphere 2015, 6, 410–430. [Google Scholar] [CrossRef]
- Deng, J.L. Grey System Fundamental Method; Huazhong University of Science and Technology: Wuhan, China, 1982. [Google Scholar]
- Wang, Y.; Liu, X.; Ren, G.; Yang, G.; Feng, Y. Analysis of the spatiotemporal variability of droughts and the effects of drought on potato production in northern China. Agric. For. Meteorol. 2019, 264, 334–342. [Google Scholar] [CrossRef]
- Wang, Z.X.; Li, D.D.; Zheng, H.H. Model comparison of GM (1, 1) and DGM (1, 1) based on Monte-Carlo simulation. Phys. A Stat. Mech. Appl. 2020, 542, 123341. [Google Scholar] [CrossRef]
- Xie, N.M.; Liu, S.F. Discrete grey forecasting model and its optimization. Appl. Math. Model. 2009, 33, 1173–1186. [Google Scholar] [CrossRef]
- Lee, Y.S.; Tong, L.I. Forecasting energy consumption using a grey model improved by incorporating genetic programming. Energy Conv. Manag. 2011, 52, 147–152. [Google Scholar] [CrossRef]
- Wu, J.; Cui, Z.; Chen, Y.; Kong, D.; Wang, Y.G. A new hybrid model to predict the electrical load in five states of Australia. Energy 2019, 166, 598–609. [Google Scholar] [CrossRef]
- Xiong, P.P.; Huang, S.; Peng, M.; Wu, X.H. Examination and prediction of fog and haze pollution using a Multi-variable Grey Model based on interval number sequences. Appl. Math. Model. 2020, 77, 1531–1544. [Google Scholar] [CrossRef]
- Xu, N.; Ding, S.; Gong, Y.; Bai, J. Forecasting Chinese greenhouse gas emissions from energy consumption using a novel grey rolling model. Energy 2019, 175, 218–227. [Google Scholar] [CrossRef]
- Ye, L.; Xie, N.; Hu, A. A novel time-delay multivariate grey model for impact analysis of CO2 emissions from China’s transportation sectors. Appl. Math. Model. 2020, 91, 493–507. [Google Scholar] [CrossRef]
- Ding, S.; Hipel, K.W.; Dang, Y.G. Forecasting China’s electricity consumption using a new grey prediction model. Energy 2018, 149, 314–328. [Google Scholar] [CrossRef]
- Liu, L.; Wu, L. Forecasting the renewable energy consumption of the European countries by an adjacent non-homogeneous grey model. Appl. Math. Model. 2020, 89, 1932–1948. [Google Scholar] [CrossRef]
- Zhao, H.; Wu, L. Forecasting the non-renewable energy consumption by an adjacent accumulation grey model. J. Clean Prod. 2020, 275, 124113. [Google Scholar] [CrossRef]
- Box, G.E.; Jenkins, G.M.; Reinsel, G.C.; Ljung, G.M. Time Series Analysis: Forecasting and Control; John Wiley & Sons: New York, NY, USA, 2015. [Google Scholar]
- Nguyen, X.H. Combining Statistical Machine Learning Models with ARIMA for Water Level Forecasting: The Case of the Red River. Adv. Water Resour. 2020, 142, 103656. [Google Scholar] [CrossRef]
- Hochreiter, S.; Schmidhuber, J. Long short-term memory. Neural Comput. 1997, 9, 1735–1780. [Google Scholar] [CrossRef]
- Mbatha, N.; Bencherif, H. Time Series Analysis and Forecasting Using a Novel Hybrid LSTM Data-Driven Model Based on Empirical Wavelet Transform Applied to Total Column of Ozone at Buenos Aires, Argentina (1966–2017). Atmosphere 2020, 11, 457. [Google Scholar] [CrossRef]
- Kang, J.; Wang, H.; Yuan, F.; Wang, Z.; Huang, J.; Qiu, T. Prediction of Precipitation Based on Recurrent Neural Networks in Jingdezhen, Jiangxi Province, China. Atmosphere 2020, 11, 246. [Google Scholar] [CrossRef]
- Nalley, D.; Adamowski, J.; Khalil, B. Using discrete wavelet transforms to analyze trends in streamflow and precipitation in Quebec and Ontario (1954–2008). J. Hydrol. 2012, 475, 204–228. [Google Scholar] [CrossRef]
- Liang, L.; Li, L.; Liu, Q. Precipitation variability in Northeast China from 1961 to 2008. J. Hydrol. 2011, 404, 67–76. [Google Scholar] [CrossRef]
- Wang, R.; Zhang, J.; Guo, E.; Chao, T. Spatial and temporal variations of precipitation concentration and their relationships with large-scale atmospheric circulations across Northeast China. Atmos. Res. 2019, 222, 62–73. [Google Scholar] [CrossRef]
Publisher’s Note: MDPI stays neutral with regard to jurisdictional claims in published maps and institutional affiliations. |
© 2021 by the authors. Licensee MDPI, Basel, Switzerland. This article is an open access article distributed under the terms and conditions of the Creative Commons Attribution (CC BY) license (http://creativecommons.org/licenses/by/4.0/).