Abstract
This study presents the climatological characteristics and physical mechanisms of Guinea Coast precipitation in June. Traditionally, the low-tropospheric air temperature and equivalent potential temperature () play crucial roles in the generation of monsoon precipitation through the following mechanisms: 1. Near-surface atmospheric front, depicted by steep , corresponds to the vertical motion in the lower troposphere. 2. Strong easterly wind in the middle troposphere (600–500 hPa), generated by a steep near the surface at 12° N, induces a positive vorticity to the south and vertical motion over the Guinea Coast (~5° N). Meanwhile, the strong Guinea Coastal precipitation, in association with the interannual variability, is mainly determined by the sea-surface temperature (SST) anomaly in the eastern equatorial Atlantic Ocean. In years of warm SST in the eastern equatorial Atlantic, in the lower troposphere is less pronounced than in normal years. However, the atmospheric buoyancy (moist static instability) increases, owing to a strong vertical gradient () arising from the increase in moisture and warm temperature in the lower troposphere over the warm SST area. Consequently, the eastern equatorial Atlantic warm SST modulates the Guinea Coastal thermodynamic structure, causing deep convection that increases precipitation south of the Guinea Coast. Forced by the eastern equatorial Atlantic warm SST anomaly, the strong precipitation and corresponding atmospheric structures are successfully simulated from the Geophysical Fluid Dynamics Laboratory global atmosphere model 2.1.
1. Introduction
The West African monsoon (WAM) precipitation is vital for human life by influencing agriculture production, water resources, and health conditions. The West African summer deep convection, known for causing heavy precipitation, had long been recognized as a part of the Intertropical Convergence Zone (ITCZ) [1]. However, the variability of precipitation over West Africa is considerably different from that in the tropical Pacific and Atlantic ITCZ [2] because the WAM rainband is zonally elongated between the huge West African continental land mass and the equatorial Atlantic Ocean [3,4]. The land-ocean thermal contrast (even in the tropics) has been known to be the phenomenon primarily responsible for the monsoon [5]. Therefore, to perform WAM studies, it is necessary to analyze the pronounced meridional discontinuity in the thermodynamic variables [6,7,8].
The WAM precipitation shows a multi-temporal scale variation on an intraseasonal–interdecadal timescale [9,10,11,12,13,14]. For the interannual variability of the precipitation, many previous studies have shown that large-scale boundary forcing plays a significant role in the variation of the WAM precipitation. For example, the Mediterranean Sea–south Atlantic Ocean surface temperature dipole induces enhanced precipitation in the WAM region, whereas the Indian Ocean sea-surface temperature (SST) warming and positive El Niño–Southern Oscillation (ENSO) phase promote droughts in this area [15,16,17,18]. Recently, the roles of fine-scale boundary conditions and African easterly waves have been highlighted in regional modeling studies [19,20,21,22,23], in which the strong WAM precipitation is revealed to be caused by high-elevation terrain, increased vegetation over Central Africa and the coastal Gulf of Guinea, and intensified African easterly waves.
The climatological deep convection associated with the WAM precipitation is initially located near the equator during boreal winter; then, the rainband migrates northward during the following spring and summer. From April through July, the rainband moves into the African continent from the Atlantic Ocean. After the WAM mature phase in August, the rainband begins to retreat toward the equator. In association with the annual cycle of the atmospheric background state caused by the change in solar insolation, the month-to-month precipitation variability response is expected to vary. For example, the positive precipitation anomaly over West Africa is accompanied by a low-level southerly wind in June, whereas the westerly wind anomaly is significant in August [24]. Accordingly, a monthly (or sub-seasonal) timescale analysis helps to clarify the specific dynamical structure and physical mechanisms behind the WAM [2,24,25,26] and other regional monsoon systems [27].
In this study, first, we investigate the climatological characteristics of the WAM; then, the physical mechanisms of the interannual variability are analyzed for June, the time at which the precipitation peak lies over the Guinea Coast [28]. The Guinea Coast precipitation has long been considered as being under different physical processes against the peak phase of the WAM (i.e., the Sahelian) precipitation. The Guinea Coast precipitation can be understood as an early stage of the WAM cycle [29,30], and the decrease in the Guinea Coast precipitation in late June and early July coincides with the so-called “jump” characterizing the onset of the WAM [31]. Although early summer is regarded as the transition period in the WAM cycle, we focus on June because of a lack of dynamical understanding regarding the formation and variation of precipitation over the Guinea Coast.
The annual cycle of the monsoon rainband in the latitudinal direction (equator to 15° N) is closely related to the horizontal distribution of the low-level equivalent potential temperature (). Hall and Peyrillé (2006) documented that a wet WAM year has a steep meridional gradient in the boundary layer [32]. Thorncroft et al. (2011) argued that the thermal contrast between the Atlantic cold tongue and Saharan heat low is a major factor in generating the cross-equatorial southerly wind in the lower troposphere and causing the moisture flux convergence in the rainfall area [8]. Despite the fact that these factors play crucial roles in the generation and maintenance of the thermodynamic structure, the importance of the gradient has not been greatly emphasized. Furthermore, in general, the WAM represents a mature phase or entire boreal summer average; therefore, using and its meridional gradient (), we investigate the mechanisms of the Guinea Coast precipitation in June.
The paper is organized as follows. The methodology and data are presented in Section 2. The climatological dynamic and thermodynamic structure of the Guinea Coast precipitation are shown in Section 3.1, whereas the interannual variability of the precipitation and associated mechanisms are described in Section 3.2. The model experiment is presented in Section 3.3. Discussion is provided in Section 4, and summary and conclusion are in Section 5.
2. Data and Methods
The monthly mean datasets (1979–2013) used in this study include the NOAA Optimum Interpolation Sea Surface Temperature (OISST, v2) [33], Global Precipitation Climatology Project precipitation [34], and National Centers for Environmental Prediction–Department of Energy (NCEP/DOE) Reanalysis 2 datasets for the pressure levels [35].
The climatology analysis is based on the mean for 1979–2013 in June. For the pressure-latitude and time-latitude cross sections, the mean data for 10° W–5° E are used to exclude the Cameroon Highlands (east of 6° E) [36,37,38]. For the calculation of the precipitation index, the 10° W–5° E and 0°–10° N domain, representing the Guinea Coast, is averaged. However, for all analyses, the fundamental characteristics of the physical mechanisms are not sensitive to small variations in the domain box (not shown).
Equivalent potential temperature is calculated from the equations of Bolton (1980) [39], and its meridional gradient () and vertical pressure gradient () are analyzed to elucidate the underlying thermodynamic mechanisms.
For the model experiment to examine the role of the eastern equatorial Atlantic SST warming, the Geophysical Fluid Dynamics Laboratory (GFDL) global atmosphere model 2.1 (AM2.1) is used [40]. CM2, the global coupled model of the GFDL, is known as one of the highest performing GCMs in simulating the interannual WAM variability [41]. However, an unrealistically broad atmospheric meridional overturning circulation around the convective area and a warm SST bias in the equatorial Atlantic are recognized as its weakness [41,42]. An improvement in the SST distribution in the equatorial Atlantic is essential for realistic precipitation simulation in a coupled dynamical model [43]. Therefore, in this study, OISST datasets are used for the SST boundary condition of the ocean, and the runs produced a realistic vertical structure of the vertical velocity (not shown). This model consists of a finite volume dynamical core with the vertical eta coordinate, using 144, 90 and 24 grid points in the longitudinal, latitudinal, and vertical directions, respectively. The relaxed Arakawa–Schubert convection scheme is used in AM2.1 to treat the cumulus convection [44].
The 17-year control simulations (1982–1998) use a climatological SST boundary condition (with 17 different atmospheric conditions). For the anomalous warm SST boundary forcing, the regressed SST anomaly field against the normalized Guinea Coast precipitation index (10° W–5° E, 0°–10° N) is added to the original SST data in June. A 1-year integration from January to the corresponding summer for the control and forced simulations is repeated for each year during 1982–1998 to avoid the superposition effect of the SST warming. This type of model experiment is used in Xie et al. (2009) for the ensemble simulations [45].
3. Results
3.1. Climatological Characteristics of the West African Monsoon
The climatological rainband (shading in Figure 1) propagates northward over West Africa from April to July. In Figure 1, a large variation of precipitation occurs south of the peak; however, an additional strong variability of precipitation appears to the north of the rainband at 12.5° N in August. These results imply that the variation of precipitation may behave in a different way under the successively varying dynamical or thermodynamical background state. For instance, Lélé et al. (2015) recently documented that the dominant direction of the moisture flux affecting the monthly precipitation is zonal in the mature phase but meridional during the developmental stage [24]. The varying direction of the moisture flux according to the latitudinal location of the WAM rainband was also found in Thorncroft et al. (2011). While the lower tropospheric convergent wind is a well-known moisture source of the monsoon precipitation, a more detailed physical process for the production of precipitation has not been fully established [8].
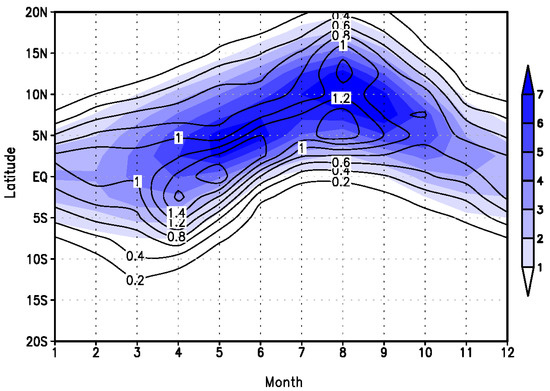
Figure 1.
Time-latitude cross-section (averaged for 10° W–5° E) of the climatological mean precipitation (shading, mm day−1) and standard deviation (contour) (GPCP).
The long-term average precipitation and interannual standard deviation are maximized along the Guinea Coastal area (5° N, 10° W–5° E) in June (Figure 2). The climatological mean precipitation and horizontal wind in June are shown in Figure 3a, and the thermodynamic characteristics of and its meridional gradient () at 925 hPa are exhibited in Figure 3b. As evident in the precipitation pattern (Figure 3a), the rainband over the Guinea Coast (~5° N) is zonally elongated, with the lower troposphere southerly wind blowing into the West African continent. In Figure 3b, a prominent moist and warm air mass is located along 10° N, inducing atmospheric frontal zones (strong positive and negative ) on the northern (~15° N) and southern (~5° N) flanks of this air mass.

Figure 2.
Climatological mean precipitation (contour, mm day−1) and interannual standard deviation range (shading) in the coastal area (5° N, 10° W–5° E) (GPCP).

Figure 3.
Climatological (a) mean precipitation (color, mm day−1) and 925 hPa wind (m s−1) and (b) equivalent potential temperature (shading, K) and its meridional gradient (contour, 10−5 K km−1) in June (GPCP and NCEP/DOE reanalysis).
In general, the front can be represented by a steep , as shown in Figure 3b [27], where both positive and negative maxima denote the frontal zones. Whereas shows the integral field of the moisture and temperature; each variable has a different horizontal and vertical distribution. Figure 4 shows the pressure-latitude cross section of the equivalent potential temperature, air temperature, and mixing ratio, in which the zonal range of 10° W–5° E is averaged to represent the Guinea Coast precipitation region. The maximum mixing ratio appears near 10° N in the lowest troposphere, whereas the air temperature is highest over the Sahara Desert near 20° N. Therefore, over this area, the moisture is likely to contribute more than the air temperature to the location of the maximum , appearing at 10° N (Figure 3 and Figure 4). The atmospheric moisture regulating and is known to be determined mainly by the surface heat flux and lower tropospheric moisture flux convergence [4,24,46].

Figure 4.
Pressure–latitude cross-section (averaged over 10° W–5° E) of the equivalent potential temperature (top, K), air temperature (mid, K), and mixing ratio (bottom, g Kg−1) in June (NCEP/DOE reanalysis).
In the latitude–pressure cross section (10° W–5° E average) of the vertical pressure velocity (shading in Figure 5a), it is evident that a deep vertical motion at 5° N (green and blue color) and another notable upward motion confined in the lower troposphere at 17° N (purple color) are constructed over West Africa. Although these dual latitudinal cores (5° N and 17° N) in the upward vertical velocity have been found in Nicholson (2009) [2], their associated dynamics are still not clearly resolved. The upward motion at these latitudes roughly matches the positive and negative peak locations of (contour in Figure 5a), as atmospheric buoyancy increases in the front. While the monsoon rainband is located in the positive peak of (~5° N), the Sahel experiences no heavy precipitation, despite the lower level active upward motion generated by the sharp negative peak of (at 15° N). These peculiar precipitation responses are related to the mid-troposphere (600–500 hPa) meridional dipole omega pattern. Here, an upward motion at 5° N (green and blue color in Figure 5a) represents the deep vertical convection from the lower level; however, a subsidence at 14°N in the mid- and upper levels (red color) inhibits the growth of the deep convection.
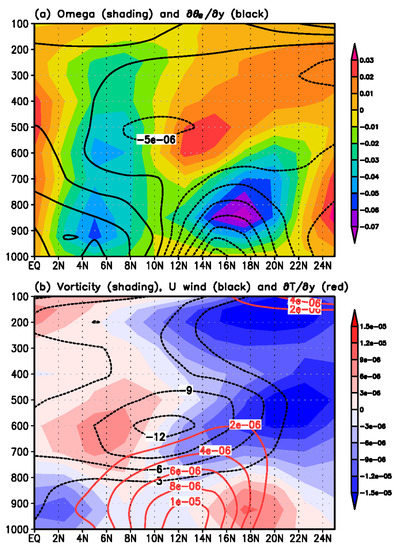
Figure 5.
Pressure–latitude cross-section of (a) the omega (color, Pa s−1) and meridional gradient of the equivalent potential temperature (contour, K km−1) and (b) the vorticity (shading, radian s−1), zonal wind (dotted black line, m s−1), and meridional gradient of the air temperature (solid red line, K km−1) (NCEP/DOE reanalysis).
Over the African continent, the mid-level African easterly jet (dotted black line in Figure 5b) is induced by the positive meridional gradient of the air temperature at 12° N (red contour in Figure 5b) through the thermal wind balance. This easterly geostrophic flow causes a positive vorticity to the south (red) and negative vorticity to the north (blue shading) in the middle troposphere. The positive vorticity south of the African easterly jet is known to be associated with the African easterly waves and the WAM convection [2]. In general, over the Guinea Coast precipitation area (near the equator), the relative vorticity dominates the absolute vorticity, owing to the negligible planetary vorticity, and the quadrupole vorticity pattern in the pressure–latitude plane (shading in Figure 5b) reflects the first baroclinic mode of the tropical atmosphere; therefore, it is consistent with the tropical dynamics.
The negative vorticity at the bottom of the deep convection (2° N) acts to attenuate the frontal buoyancy effect, whereas the positive vorticity in the mid- and upper levels over this region gives rise to this deep convection. On the contrary, the positive vorticity in the northern area (18° N) sustains the low-level upward motion along the front; however, the negative vorticity in the upper troposphere leads to subsidence. In the low-level northern core, the upward motion at 17° N is located between the frontal surface (15° N) and the low-level positive vorticity center (18° N). Consequently, the combination of the low-level front and vorticity field establishes the climatological mean omega field, as shown in Figure 5b.
3.2. Interannual Variability of the Precipitation
The West African precipitation index averaged over the Guinea Coast and adjoining ocean (10° W–5° E, 0°–10° N) represents the early stage of the WAM, which exhibits a significant interannual variation (Figure 6). The variation of precipitation is closely linked with the dynamically and thermodynamically induced atmospheric structures, as illustrated in Figure 7. In the pressure–latitude cross section of the correlation between the omega and precipitation indices, the positive correlation at 2° N shows that strong deep convection results in a positive precipitation anomaly. The correlation of the vertical motion peaks in the upper troposphere implies that the high-level upward motion is essential for the deep convection and heavy precipitation over the Guinea Coast. Over 5° S–5° N, the moist static instability () or buoyancy is positively correlated with the precipitation, where the development of the positive anomaly in the lower level is responsible for the strengthening of (red shading in Figure 7). In this figure, the positive correlation in the buoyancy (shading) is centered over the equator; however, the upward motion (black contour) is invigorated only to the north of the equator. The latter is associated with the climatological Hadley circulation in boreal summer, which has an upward branch just to the north of the equator and a downward motion in the southern hemisphere. These climatological background states act to limit the anomalous convection area near the Guinea Coast.

Figure 6.
(a) Domain-averaged precipitation index over 10° W–5° E and 0°–10° N and (b) correlation map of the precipitation using the index (GPCP).

Figure 7.
Pressure–latitude correlation map of the meridional equivalent potential temperature gradient (blue line), omega (black line), and buoyancy (shading) against the precipitation index. The contour lines are illustrated from −0.35 with an interval of 0.05 (NCEP/DOE reanalysis).
Note that, in climatology, positive along 5° N (black contour in Figure 5) is the essential component for the Guinea Coastal deep convection. Therefore, it is of interest that the negative correlation of (blue contour in Figure 7) in the lower troposphere over the Guinea Coastal area corresponds to a weakening of the front. In Figure 7, the negative (~5° N) and (near the equator) coincide with the strong precipitation over south of the Guinea Coast. To identify the source of the gradient variation, the correlation coefficient between the surrounding SST and the index at 925 hPa (for the same horizontal domain as that of the precipitation index) is calculated (not shown), where the sign of the index is reversed for consistency with the precipitation index. We note that the index and precipitation index have an interannual correlation of 0.67.
An analysis using the thermodynamical and has recently been performed for the interannual variation of the East Asian summer monsoon (EASM) [27]. They showed that the vertically well-organized strong monsoon front enhances the EASM precipitation. Note that the positive Guinea Coast precipitation anomaly is characterized by a rather weak front in the lower troposphere but an enhanced vertical moist static instability throughout the troposphere. In climatology, however, both the EASM and Guinea Coast precipitation are determined by the meridional gradient, even though the former is vertically well developed while the latter is developed only in the lower troposphere (Table 1). Therefore, the analysis can be of great use for investigating the variations of other local monsoon systems.

Table 1.
Comparison of climatological and interannual frontal characteristics between the East Asian summer monsoon (EASM) precipitation and the Guinea Coast precipitation.
3.3. Model Experiment for the SST Boundary Forcing
Using the precipitation index, we show an SST correlation map in Figure 8, in which the correlation coefficient is greater than 0.5 for the Gulf of Guinea, where the eastern equatorial Atlantic warming SST is represented by the Atlantic Niño [47,48]. The correlation coefficients between the precipitation and the Atlantic Niño 1–3 indices in June are 0.56–0.63. This statistical relationship between the precipitation index and Atlantic SST strongly implies that the warm SST in the eastern equatorial Atlantic Ocean causes a weak to the north of the equatorial Atlantic but a strong near the equator.

Figure 8.
Correlation map between the SST (OISST, v2) and precipitation (GPCP) index in June. The shading indicates the 90, 95 and 99% significance levels.
For reference, there is a significant cold SST region south of the warm signal (30°–40° S) (Figure 8). This meridional dipole SST pattern is known as the South Atlantic Ocean dipole [49] and may strengthen the local Hadley circulation, increasing the low-tropospheric moisture flux to the rainband [17]. However, according to the previous study [46], the cold anomaly is known to play a minor role in the generation of the WAM precipitation.
In Figure 9, the control simulation output is subtracted from the SST forcing simulation to illustrate the impact of the SST boundary forcing. In June, a precipitation increase in the 10° S–5° N region and a decrease in the northern area (5° N–15° N) are demonstrated. The dipole precipitation anomalies (i.e., positive over the Gulf of Guinea and Guinea Coast and negative over the Sahel) due to the warm SST anomaly in the equatorial Atlantic are consistent with previous studies [48,50,51]. This latitudinal dipolar precipitation pattern can be interpreted as the intensification of the local Hadley circulation. In the case of the cold SST over the tropical Atlantic Ocean, we can expect that a positive precipitation anomaly presides over the Sahel, which means that the cold SST induces the early onset of the WAM or early northward shift in the monsoon rainband.

Figure 9.
Precipitation anomaly (shading) from the AM2.1 model experiment forced by a warm SST (contour, K).
Furthermore, the pressure–latitude cross section of the vertical velocity and is even consistent with the structure of observations (Figure 7 and Figure 10). Therefore, the thermodynamic modulation of the WAM precipitation by the eastern equatorial Atlantic SST is supported by the results of the model experiment. However, due to lack of air-sea coupling in the simulation and model deficiency, the detailed structure is slightly different between the real world and model result (Figure 7 and Figure 10).

Figure 10.
Pressure–latitude cross section of the meridional gradient of the equivalent potential temperature (blue line, 10−6 K km−1) and omega (black line, Pa s−1) fields from the AM2.1 forced minus the control simulation.
4. Discussion
The current study shows that the WAM interannual variability of precipitation in June is significantly connected to the eastern equatorial Atlantic SST variation. However, the northern boundary condition (e.g., soil moisture and surface temperature over the Sahara Desert) may also play a significant role in the interannual variability of the precipitation, comparable to the southern SST boundary condition. If the variability is analyzed for other months that correspond to a shift in the rainband to the north or south of the Guinea Coast, different factors can be deemed to regulate the precipitation intensity. Therefore, a comprehensive study including additional dynamic factors (e.g., variations of the tropical and midlatitude Rossby waves affecting the African Easterly Jet and horizontal thermodynamical gradient) is required to obtain global pictures of the WAM over the entire seasonal cycle associated with various boundary conditions, such as the Mediterranean SST, Indian Ocean SST, ENSO, south Atlantic SST dipole, soil moisture in the Sahel, and land-use changes [52,53,54,55].
5. Summary and Conclusions
The climatological properties and interannual variation mechanisms of the Guinea Coast precipitation in June are revealed by thermodynamical (equivalent potential temperature, ) and dynamical (relative vorticity) variables over western Africa. On the one hand, from a climatological point of view, the deep convection in the precipitation area is induced by the meridional gradient of air temperature and through the front and thermal wind balance. On the other hand, as a key player for the interannual variability of the thermodynamic field, the equatorial eastern Atlantic warming SST is fatal for the anomalous precipitation. The correlation between the Guinea Coast precipitation index and the Atlantic Niño is greater than 0.5, explaining approximately 30% of the precipitation variability. During the years of intense (but slightly southward-shifted) precipitation, the weak in the lower troposphere and enhanced moist static instability strengthen the upward motion in the middle and upper troposphere. A new finding in this study is that a thermodynamically induced strong upward motion develops through the enhanced moist static instability, despite a weak front in June (Figure 11). However, the Sahel precipitation may be enhanced with the occurrence of the cold SST and strong surface front; this argument is definitely consistent with WAM characteristics in previous studies [29,32,56], which performed an analysis from July to September in the Sahel region and showed the positive relationship between the WAM precipitation and positive . This result implies that the mechanisms of the Sahelian and Guinea Coast precipitation are much different in the role of front but still maintain a secure physical connection.
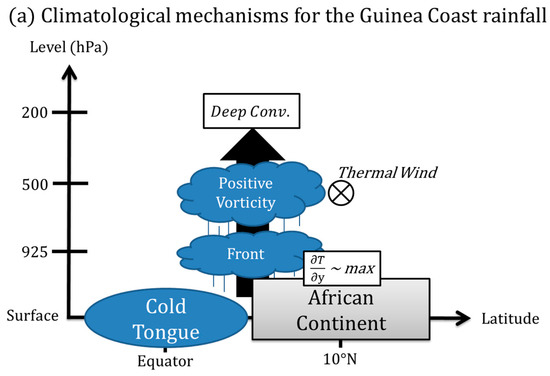
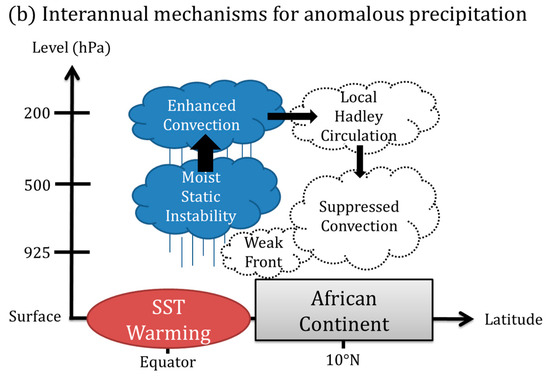
Figure 11.
Schematic diagram of physical mechanisms for (a) the climatological Guinea Coast precipitation and (b) the interannual variation of precipitation in June.
Author Contributions
J.-H.S. and K.-H.S. devised the study and wrote the manuscript. All authors have read and agreed to the published version of the manuscript.
Funding
This study was supported by the National Research Foundation of Korea (NRF) grant funded by the Korea government (MSIP) (No. NRF-2020R1A2C2009414), and the KMA Research and Development Program under Grant KMI 2018–01012.
Acknowledgments
Global Precipitation Climatology Project precipitation data can be found at https://climatedataguide.ucar.edu/climate-data/gpcp-monthly-global-precipitation-climatology-project, National Centers for Environmental Prediction–Department of Energy Reanalysis 2 data can be found at https://data.nodc.noaa.gov/cgi-bin/iso?id=gov.noaa.ncdc:C01311, and OISST.v2 data can be found at https://www.esrl.noaa.gov/psd/data/gridded/data.noaa.oisst.v2.html.
Conflicts of Interest
The authors declare no conflicts of interest.
References
- Webster, P.J.; Fasullo, J. Monsoon: Dynamical theory. In Encyclopedia of Atmospheric Sciences; Holton, J., Curry, J.A., Eds.; Academic Press: San Diego, CA, USA, 2003; pp. 1370–1385. [Google Scholar]
- Nicholson, S.E. A revised picture of the structure of the “monsoon” and land ITCZ over West Africa. Clim. Dyn. 2009, 32, 1155–1171. [Google Scholar] [CrossRef]
- Burpee, R.W. The origin and structure of easterly waves in the lower troposphere of North Africa. J. Clim. 1972, 29, 77–90. [Google Scholar] [CrossRef]
- Hourdin, F.; Coauthors. AMMA–Model intercomparison project. Bull. Am. Meteorol. Soc. 2010, 91, 95–104. [Google Scholar] [CrossRef]
- Ramage, C. Definition of the Monsoons and their extent. In Monsoon Meteorology; Academic Press: London, UK; New York, NY, USA, 1971. [Google Scholar]
- Cook, K.H. Generation of the African easterly jet and its role in determining West African precipitation. J. Clim. 1999, 12, 1165–1184. [Google Scholar] [CrossRef]
- Lélé, I.M.; Lamb, P.J. Variability of the intertropical front (ITF) and rainfall over the West African Sudan–Sahel zone. J. Clim. 2010, 23, 3984–4004. [Google Scholar] [CrossRef]
- Thorncroft, C.D.; Nguyen, H.; Zhang, C.; Peyrillé, P. Annual cycle of the West African monsoon: Regional circulations and associated water vapor transport. Q. J. R. Meteorol. Soc. 2011, 137, 129–147. [Google Scholar] [CrossRef]
- Giannini, A.; Saravanan, R.; Chang, P. Oceanic forcing of Sahel rainfall on interannual to interdecadal timescales. Science 2003, 302, 1027–1030. [Google Scholar] [CrossRef]
- Grist, J.P.; Nicholson, S.E. A Study of the dynamic factors influencing the rainfall variability in the West African Sahel. J. Clim. 2001, 14, 1337–1359. [Google Scholar] [CrossRef]
- Janicot, S.; Mounier, F.; Hall, N.; Leroux, S.; Sultan, B.; Kiladis, G. The West African monsoon dynamics. Part IV: Analysis of 25-90-day variability of convection and the role of the Indian monsoon. J. Clim. 2009, 22, 1541–1565. [Google Scholar] [CrossRef]
- Joly, M.; Coauthors. Intraseasonal variability of the West African monsoon. Atmos. Sci. Lett. 2011, 12, 58–66. [Google Scholar] [CrossRef]
- Nicholson, S.E.; Grist, J.P. The seasonal evolution of the atmospheric circulation over West Africa and equatorial Africa. J. Clim. 2003, 16, 1013–1030. [Google Scholar] [CrossRef]
- Sultan, B.; Janicot, S. The West African monsoon dynamics. Part I: Documentation of intraseasonal variability. J. Clim. 2003, 16, 3389–3406. [Google Scholar] [CrossRef]
- Chung, C.E.; Ramanathan, V. Weakening of North Indian SST gradients and the monsoon rainfall in India and the Sahel. J. Clim. 2006, 19, 2036–2045. [Google Scholar] [CrossRef]
- Joly, M.; Voldoire, A. Influence of ENSO on the West African monsoon: Temporal aspects and atmospheric processes. J. Clim. 2009, 22, 3193–3210. [Google Scholar] [CrossRef]
- Nnamchi, H.C.; Li, J. Influence of the South Atlantic Ocean dipole on West African summer precipitation. J. Clim. 2011, 24, 1184–1197. [Google Scholar] [CrossRef]
- Rowell, D.P. The impact of Mediterranean SSTs on the Sahelian rainfall season. J. Clim. 2003, 16, 849–862. [Google Scholar] [CrossRef]
- Mohr, K.I.; Thorncroft, C.D. Intense convective systems in West Africa and their relationship to the African easterly jet. Q. J. R. Meteorol. Soc. 2006, 132, 163–176. [Google Scholar] [CrossRef]
- Paeth, H.; Born, K.; Podzun, R.; Jacob, D. Regional dynamical downscaling over West Africa: Model evaluation and comparison of wet and dry years. Meteorol. Z. 2005, 14, 349–367. [Google Scholar] [CrossRef]
- Paeth, H.; Born, K.; Girmes, R.; Podzun, R.; Jacob, D. Regional climate change in tropical and northern Africa due to greenhouse forcing and land use changes. J. Clim. 2009, 22, 114–132. [Google Scholar] [CrossRef]
- Sylla, M.B.; Gaye, A.T.; Jenkins, G.S. On the fine-scale topography regulating changes in atmospheric hydrological cycle and extreme rainfall over West Africa in a regional climate model projections. Int. J. Geophys. 2012. [Google Scholar] [CrossRef]
- Sylla, M.B.; Pal, J.; Wang, G.L.; Lawrence, P.J. Impact of land cover characterization on regional climate modeling over West Africa. Clim. Dyn. 2015. [Google Scholar] [CrossRef]
- Lélé, I.M.; Leslie, L.M.; Lamb, P.J. Analysis of low-level atmospheric moisture transport associated with the West African monsoon. J. Clim. 2015, 28, 4414–4430. [Google Scholar] [CrossRef]
- Nicholson, S.E. The intensity, location and structure of the tropical rainbelt over West Africa as factors in interannual variability. Int. J. Climatol. 2008, 28, 1775–1785. [Google Scholar] [CrossRef]
- Nicholson, S.E.; Webster, P.J. A physical basis for the interannual variability of rainfall in the Sahel. Q. J. R. Meteorol. Soc. 2007, 133, 2065–2084. [Google Scholar] [CrossRef]
- Seo, K.-H.; Son, J.-H.; Lee, J.-Y.; Park, H.-S. Northern East Asian monsoon precipitation revealed by air mass variability and its prediction. J. Clim. 2015. [Google Scholar] [CrossRef]
- Sultan, B.; Janicot, S. The West African monsoon dynamics. Part II: The “preonset” and “onset” of the summer monsoon. J. Clim. 2003, 16, 3407–3427. [Google Scholar] [CrossRef]
- Ward, N.M. Diagnosis and short-lead time prediction of summer rainfall in tropical North Africa at interannual and multidecadal timescales. J. Clim. 1998, 11, 3167–3191. [Google Scholar] [CrossRef]
- Cook, K.H. Role of initial instability in the West African monsoon jump. J. Geophys. Res. 2015, 120, 3085–3102. [Google Scholar]
- Hagos, S.M.; Cook, K.H. Dynamics of the West African monsoon jump. J. Clim. 2007, 20, 5264–5284. [Google Scholar] [CrossRef]
- Hall, N.M.J.; Peyrillé, P. Dynamics of the West African monsoon. J. Phys. IV 2006, 139, 81–99. [Google Scholar] [CrossRef]
- Reynolds, R.W.; Rayner, N.A.; Smith, T.M.; Stokes, D.C.; Wang, W. An improved in situ and satellite SST analysis for climate. J. Clim. 2002, 15, 1609–1625. [Google Scholar] [CrossRef]
- Adler, R.F.; Coauthors. The Version-2 Global Precipitation Climatology Project (GPCP) monthly precipitation analysis (1979−present). J. Hydrometeor. 2003, 4, 1147–1167. [Google Scholar] [CrossRef]
- Kanamitsu, M.; Ebisuzaki, W.; Woollen, J.; Yang, S.K.; Hnilo, J.J.; Fiorino, M.; Potter, G.L. NCEP−DOE AMIP-II Reanalysis (R-2). Bull. Am. Meteorol. Soc. 2002, 83, 1631–1643. [Google Scholar] [CrossRef]
- Vizy, E.K.; Cook, K.H. Mechanisms by which Gulf of Guinea and eastern North Atlantic sea surface temperature anomalies can influence African rainfall. J. Clim. 2001, 14, 795–821. [Google Scholar] [CrossRef]
- Vizy, E.K.; Cook, K.H. Development and application of a mesoscale climate model for the tropics: Influence of sea surface temperature anomalies on the West African monsoon. J. Geophys. Res. 2002, 107. [Google Scholar] [CrossRef]
- Vizy, E.K.; Cook, K.H.; Crétat, J.; Neupane, N. Projections of a wetter Sahel in the 21st century from global and regional models. J. Clim. 2013, 26, 4664–4687. [Google Scholar] [CrossRef]
- Bolton, D. The computation of equivalent potential temperature. Mon. Weather Rev. 1980, 108, 1046–1053. [Google Scholar] [CrossRef]
- Anderson, J.L.; Coauthors. The new GFDL global atmosphere and land model AM2–LM2: Evaluation with prescribed SST simulations. J. Clim. 2004, 17, 4641–4673. [Google Scholar]
- Cook, K.H.; Vizy, E.K. Coupled model simulations of the West African monsoon system: Twentieth– and twenty–first–century simulations. J. Clim. 2006, 19, 3681–3703. [Google Scholar] [CrossRef]
- Roehrig, R.; Bouniol, D.; Guichard, F. The present and future of the West African monsoon: A process–oriented assessment of CMIP5 simulations along the AMMA transect. J. Clim. 2013, 26, 6471–6505. [Google Scholar] [CrossRef]
- McCrary, R.R.; Randall, D.A.; Stan, C. Simulations of the West African monsoon with a superparameterized climate model. Part I: The seasonal cycle. J. Clim. 2014, 27, 8303–8322. [Google Scholar] [CrossRef]
- Moorthi, S.; Suarez, M.J. Relaxed Arakawa–Schubert: A parameterization of moist convection for general circulation models. Mon. Weather Rev. 1992, 120, 978–1002. [Google Scholar] [CrossRef]
- Xie, S.-P.; Hu, K.; Hafner, J.; Tokinaga, H.; Du, Y.; Huang, G.; Sampe, T. Indian Ocean capacitor effect on Indo−Western Pacific climate during the summer following El Niño. J. Clim. 2009, 22, 730–747. [Google Scholar] [CrossRef]
- Nnamchi, H.C.; Li, J.; Kang, I.-S.; Kucharski, F. Simulated impacts of the South Atlantic Ocean dipole on summer precipitation at the Guinea coast. Clim. Dyn. 2013, 41, 677–694. [Google Scholar] [CrossRef]
- Lutz, K.; Rathman, J.; Jacobeit, J. Classification of warm and cold water events in the eastern tropical Atlantic Ocean. Atmos. Sci. Lett. 2013, 14, 102–106. [Google Scholar] [CrossRef]
- Lutz, K.; Jacobeit, J.; Rathman, J. Atlantic warm and cold water events and impact on African west coast precipitation. Int. J. Climatol. 2014, 35, 128–141. [Google Scholar] [CrossRef]
- Nnamchi, H.C.; Li, J.; Anyadike, R.N.C. Does a dipole mode really exist in the South Atlantic Ocean? J. Geophys. Res. 2011, 116, D15104. [Google Scholar] [CrossRef]
- Janicot, S.; Harzallah, A.; Fontaine, B.; Moron, V. West African monsoon dynamics and eastern equatorial Atlantic and Pacific SST anomalies (1970–88). J. Clim. 1998, 11, 1874–1882. [Google Scholar] [CrossRef]
- Losada, T.; Rodrı´guez-Fonseca, B.; Janicot, S.; Gervois, S.; Chauvin, F.; Ruti, P. A multi-model approach to the Atlantic Equatorial mode: Impact on the West African monsoon. Clim. Dyn. 2010, 35, 29–43. [Google Scholar] [CrossRef]
- Lee, S.-E.; Seo, K.-H. The development of a statistical forecast model for Changma. Weather Forecast. 2013, 28, 1304–1321. [Google Scholar] [CrossRef]
- Seo, K.-H.; Son, S.-W. The Global Atmospheric Circulation Response to Tropical Diabatic Heating Associated with the Madden-Julian Oscillation during Northern Winter. J. Atmos. Sci. 2012, 69, 79–96. [Google Scholar] [CrossRef]
- Seo, K.-H.; Son, J.-H.; Lee, S.-E.; Tomita, T.; Park, H.-S. Mechanisms of an extraordinary East Asian summer monsoon event in July 2011. Geophy. Res. Lett. 2012, 39, L05704. [Google Scholar] [CrossRef]
- Son, J.-H.; Seo, K.-H.; Wang, B. Dynamical control of the Tibetan Plateau on the East Asian summer monsoon. Geophys. Res. Lett. 2019, 46, 7672–7679. [Google Scholar] [CrossRef]
- Eltahir, E.A.B.; Gong, C. Dynamics of Wet and Dry Years in West Africa. J. Clim. 1996, 9, 1030–1042. [Google Scholar] [CrossRef]
© 2020 by the authors. Licensee MDPI, Basel, Switzerland. This article is an open access article distributed under the terms and conditions of the Creative Commons Attribution (CC BY) license (http://creativecommons.org/licenses/by/4.0/).