1. Introduction
Halocarbons are substances emitted by anthropogenic sources, which are commonly employed as solvents cleaners, refrigerants, and reagents in the plastic and metal industry. Long-term exposure to halocarbons has been associated with some potential health risks, in particular to some respiratory problems, such as irritation and cancer [
1]. Halocarbons, in particular chlorofluorocarbons (CFCs) and chlorinated solvents, are significant sources of greenhouse gases (GHGs) and contribute to ozone layer depletion [
2,
3]. Landfills may be a source of fugitive volatile compound emissions, including halocarbons [
4,
5]. In landfill sites, wastes are usually piled up and compacted on the working face, being exposed to the atmospheric environment for days to weeks before being definitively covered. The presence of textiles, cleaning agents, and plastics in disposed wastes leads to the emission of these compounds into the atmosphere [
6]. Usually, the gaseous emissions in landfills are collected, but the risk persists in fugitive emissions.
Several studies were done on the fugitive emissions of municipal solid waste landfills, analyzing emissions, odors, and risks. The atmospheric emissions of landfills consist of methane, carbon dioxide, water vapor, and non-methane volatile organic compounds (NMVOCs or VOCs). Considering the VOC composition, the higher percentage is of sulphur compounds, nitrogen compounds, oxygenated compounds, aromatics, halogenated compounds, and terpenes [
7]. The variations that exist in the trace component composition from distinct areas of a given landfill site and between landfill sites can be readily assigned to differences in the composition of wastes, the age of the wastes, the reached stage in the decomposition processes, and in some cases, the method of site operation [
8]. In terms of local air quality, the presence of large quantities of potentially hazardous mixtures of chemicals in landfill sites close to residential populations has increasingly caused concern [
9]. For this reason, a substantial number of studies on the health effects associated with landfill sites were conducted in the last years. Health risk analysis (HRA) is the consolidated methodology to evaluate citizens’ and workers’ exposure to pollutant emissions. HRA is a management tool. It involves assessing the likelihood and consequences of undesirable events to inform decisions about the significance of risks to human health. It helps to identify how best to manage unacceptable risks and requires an understanding of the sources of a hazard, potential receptors, and the pathways by which hazards might affect receptors [
10].
In previous research studies, HRA methods were applied to landfill sites. The majority of existing studies considered the evaluation of risk exposure to a number of VOCs, in particular the benzene-toluene-ethylbenzene-xylene group (BTEX). Halocarbons were also considered, but these studies do not always include a wide range of these substances. Besides, most of the studies were conducted on municipal solid waste (MSW) landfills, while analyses conducted on hazardous waste landfills are scarce [
7]. Of the existing studies, Liu et al. [
4] conducted an HRA of the exposure of the population to BTEX in an MSW landfill in China. The results showed that the working face of a landfill could be a significant source of aromatics, which might pose a carcinogenic risk to residents nearby, especially for those receiving mixed MSW. Palmiotto et al. [
11] presented an integrated HRA of a MSW landfill located in central Italy. The results indicated that the potential incremental cancer risk for residents living in the vicinity of the facility was negligible, and other health effects are not likely to occur. This study also indicated a negligible risk for exposure to vinyl chloride monomer (VCM). A study of the Bristol Environmental Agency, UK, reported the HRA of population exposure to the fugitive emissions of two MSW landfills, considering over 60 substances and substance groups [
10]. In total, 23 substances were found to require more detailed investigation because the measured boundary fence average concentrations were above the project-specific health criteria values. No halocarbons were included in this group of substances. The list of substances posing an insignificant contribution to risk reported eight halocarbons, including 1,1-dichloroethane. Another study in Novi Sad (Serbia) was conducted on an MSW landfill [
12]. The only halocarbon considered was hexachlorocyclohexane (HCH). The calculated risk values for all investigated substances were not significant. Similar results were also reported in a study on occupational exposure on an MSW landfill near Shanghai [
13]. This trend was also confirmed in a study conducted on a large MSW landfill in Bejing, China [
5]. In this study, the health risk of VOC inhalation was calculated. Aromatics and halogenated compounds (chloroform and tetrachloroethylene) contributed the most to carcinogenic risk, while sulphur compounds contributed the most to the cumulative toxicity index. Considering hazardous waste landfills, a review of Vrijheid [
9] reported that, although evidence for a causal relationship between landfill exposures and cancers is still weak, increases in the risk of adverse health effects have been reported near individual landfill sites and in some multisite studies.
Even if they do not constitute the main pollutants in terms of emission flow, the presence of halocarbons in landfills represents a hazard to human health, given their high toxicity and carcinogenicity. This is especially valid when landfills are located next to urban or industrial areas, where additional pollution sources (e.g., traffic or industrial activities) may be present. In fugitive emissions from landfills, the pollutant levels are not high, with it being expected that their effect on human health is limited to the landfill’s area. Thus, HRA must first be addressed to the workers operating on site.
The present study was focused on the analysis of fugitive halocarbon emissions from hazardous waste landfills. The objective was to evaluate the contribution of halogenated VOCs to the cumulative health risks associated with the exposure of workers operating in the landfill sites. The contribution of halocarbons to the total risk was compared to those of other VOCs, gathering information on the possible role of endogenous/exogenous sources present in densely anthropized areas. A secondary objective of the study was the analysis of the possible waste typologies responsible for halocarbon emissions by landfill sites, collecting information on the sources and possible mitigation pathways. The Barricalla site, a hazardous waste landfill located in Turin, Italy, was used as a case study. 1,2-dichloroethane and 1,2-dichloropropane were selected as marker substances of halocarbons’ presence. These substances are commonly monitored in hazardous waste landfills, because of their high carcinogenic and toxic potential. In the last years, the presence of these substances in other working environments was also investigated. For example, Çankaya et al. [
14] analyzed VOC levels at small enterprises in Kocaeli, Turkey (restaurants, dry cleaners, photocopy centers, and auto paint shops). According to the HRA, high cancer risk and hazard quotients were mostly dependent on the abundance of benzenes and chlorinated VOCs. Among halocarbons, 1,2-dichloroethane, 1,2-dichloropropane and carbon tetrachloride showed the highest contribution to risk. Another study conducted in Buenos Aires, Argentina showed opposite results [
15]. In this study, five different working environments were considered, and the concentration of 1,2-dichloroethane was always below the measurement detection limit.
The present study also considered the characterization of the uncertainty related to the HRA methodology. In the case of a landfill, it is difficult to locate a single source of contaminants at a specific depth because the contamination is generally diffuse [
16]. To evaluate the VOC concentrations in landfills, traditional approaches include measurement of the landfill gas concentration [
17] and air quality monitoring of the site [
18,
19,
20]. To be representative, HRA must be supported by data with a detailed spatial and temporal resolution. The implementation of an analysis of the probability distribution of the incoming data can support the characterization of the uncertainty associated with the method. For this reason, in this study, the HRA was calculated by means of a novel approach, based on the probabilistic analysis of ambient air pollutant concentrations. The potential waste typologies emitting halocarbons were finally evaluated through an analysis of the waste disposal records made available by the landfill operator. The methodology, results, and discussion are reported in the following sections.
2. Methodology
The risk contribution of halocarbon emissions from hazardous waste landfills was evaluated through the application of a health risk analysis (HRA) approach, considering the exposure of possible workers operating on the site. The considered case study was the Barricalla landfill, located close to the town of Turin, northern Italy. As demonstrated by previous research activity on HRA, particular care must be addressed to the definition of the representative pollutant concentration levels, especially when exposure to multiple chemical substances is evaluated [
21]. Considering only the average or maximum of the observed concentrations might not be, in some cases, representative of the effective long-term exposure of workers. This is especially valid if fugitive emissions from landfills are considered, where emissions depend on variable factors and sources. If an adequate number of observations is available, the analysis of the probability distribution of measured concentrations and the application of Monte-Carlo methods could provide support in this sense. For this reason, in our study, the calculations of HRA were preceded by an analysis of the concentrations of the chemical species that were measured on site. Data of the ambient concentration of pollutants recorded in 7 sampling points of the study site in the period 2016–2017 were elaborated to find the best fitting probability distribution. One distribution curve per pollutant species was defined. These curves were then used to generate large vectors of the estimated concentration values. Cumulative HRA was then calculated repeatedly using vectors of the estimated concentration values as an input, as described in the following sections. The scheme of the operating model used in this study is reported in
Figure 1.
In a subsequent phase of the study, an analysis was conducted, with the objective of defining the waste typologies that are possibly responsible for halocarbon emissions. This analysis was based on the cross-comparison of halocarbon concentration trends and waste disposal records.
The studied site and the methodological approach are presented in the following.
2.1. Case Study
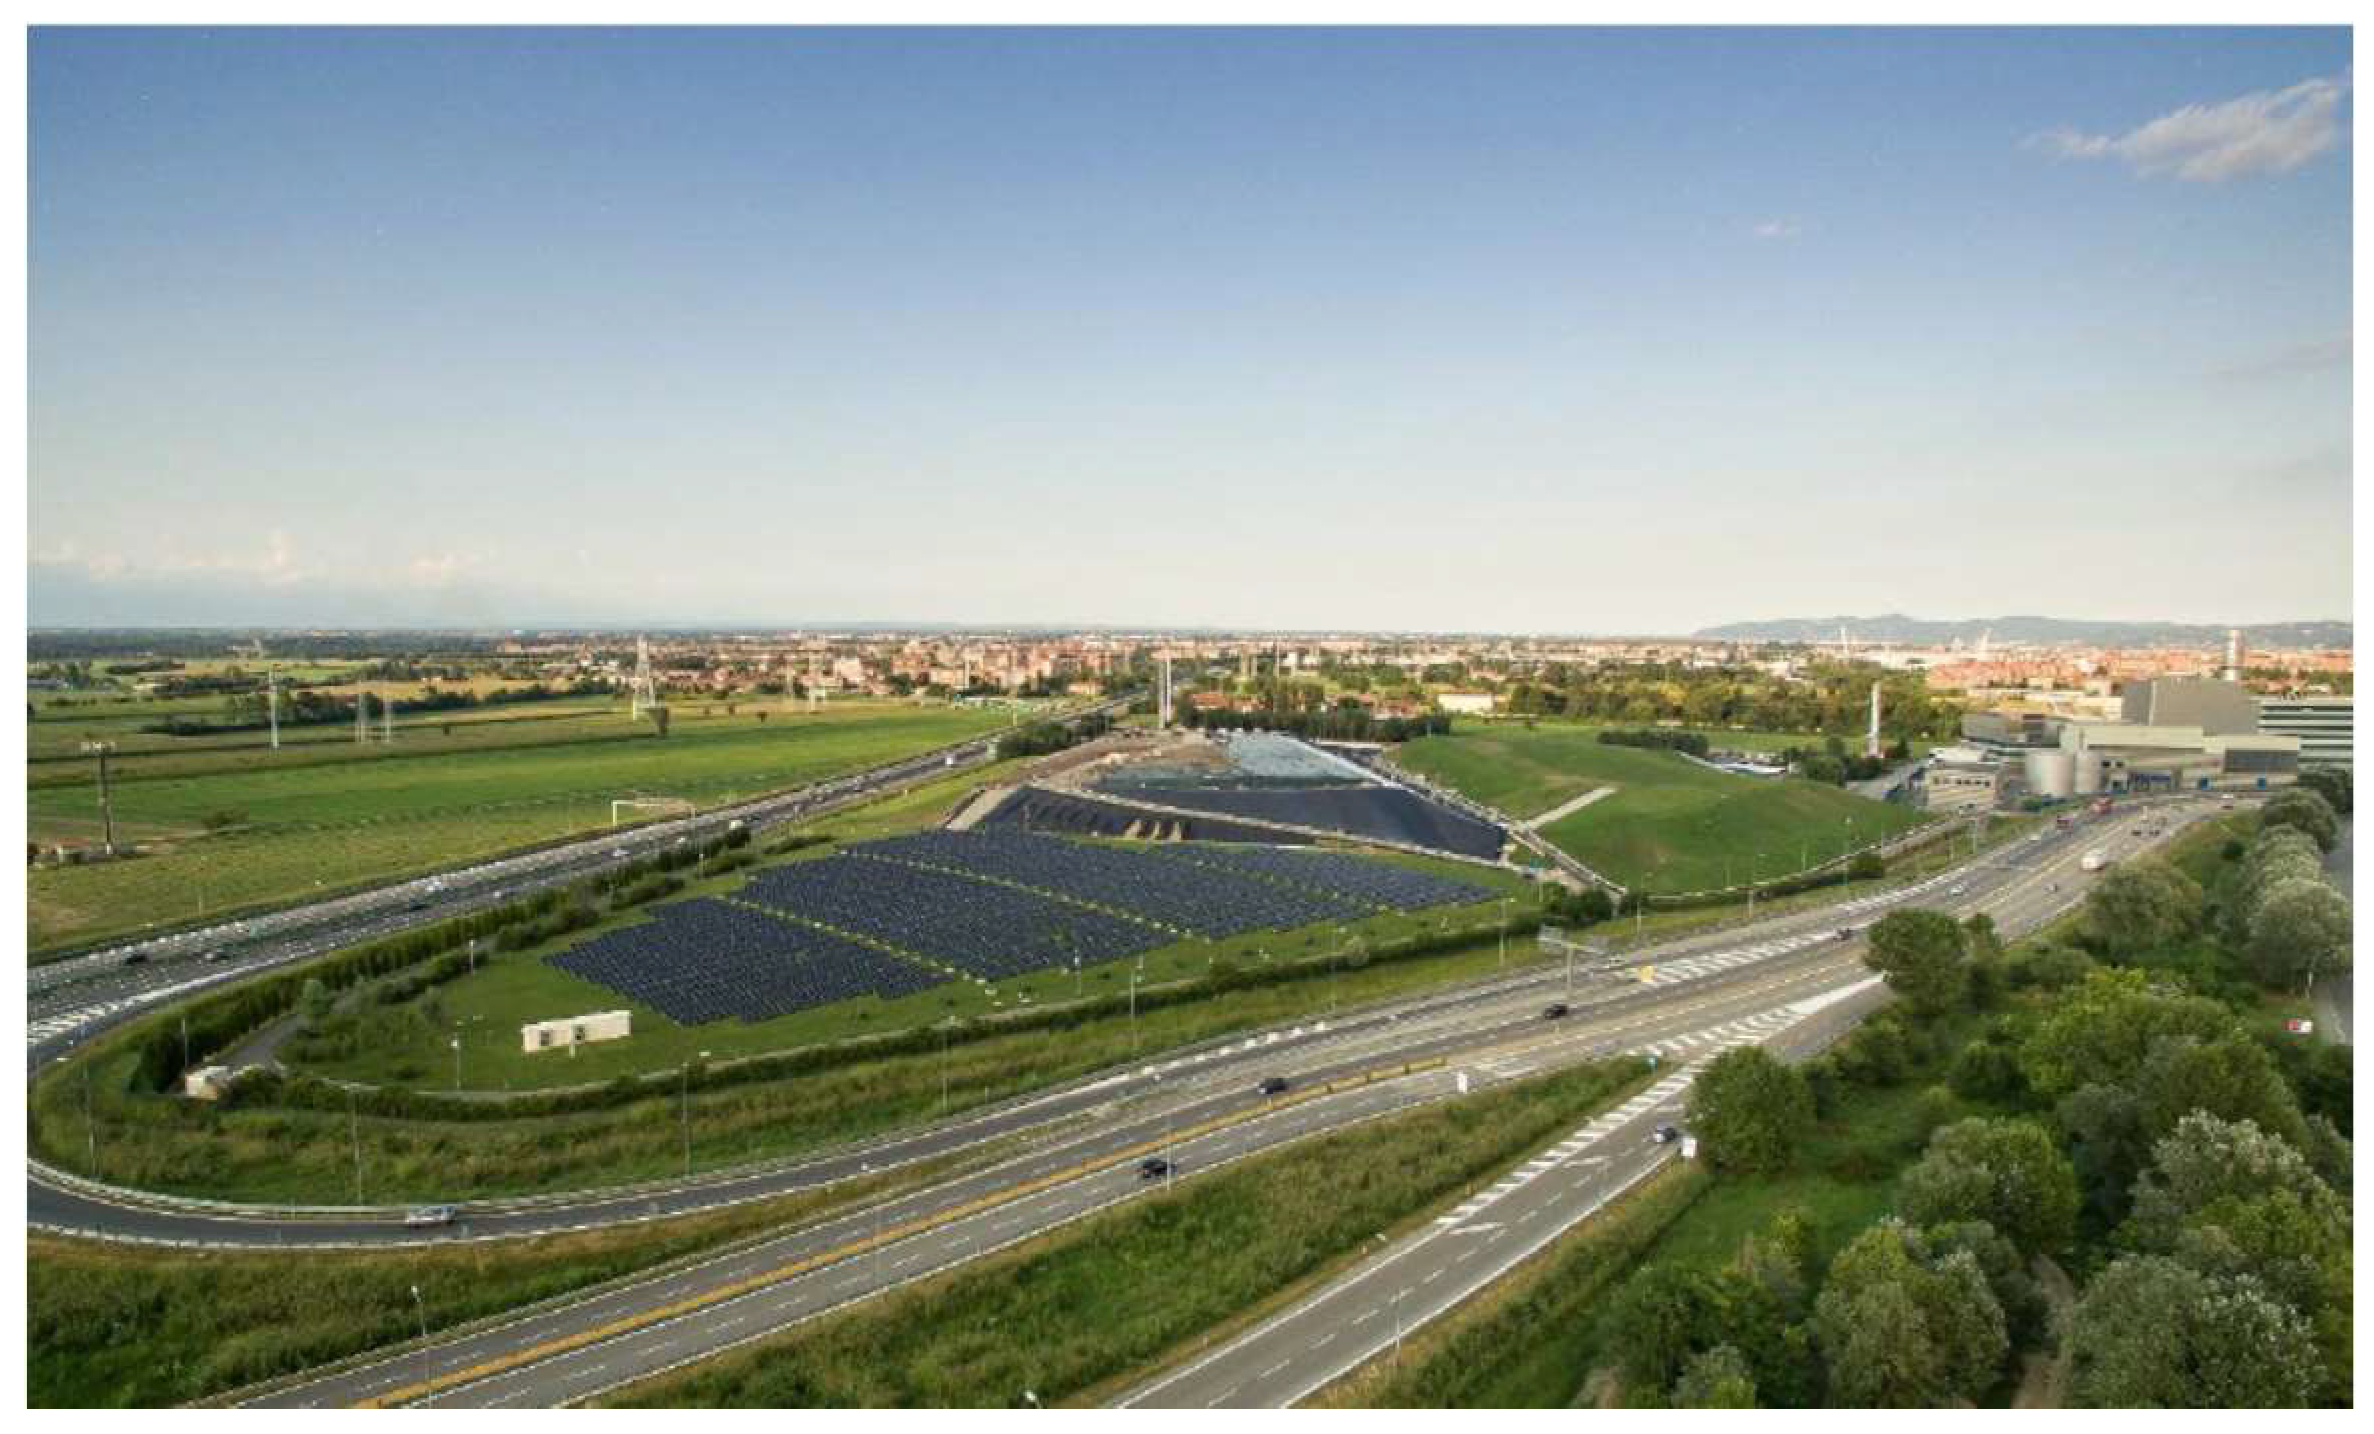
The studied area is situated northwest of Turin, close to an industrial area and the town ring road (
Figure 2 and
Figure 3). The Barricalla landfill has a comprehensive area of 150,000 m
2 divided into 5 lots. The area previously housed a gravel pit of about 600,000 m
3, used mainly for the extraction of raw materials for the construction of the Turin ring road. The Barricalla landfill was inaugurated in 1988; lots 1 and 2 have been exhausted and closed. Lot 4 and lot 3 were declared terminated in April 2017 and July 2018, respectively. Recently, the new lot 5 was built, which can accommodate 508,850 m
3 of wastes.
The site is Eco-Management and Audit Scheme (EMAS) certified and subjected to the Integrated Pollution Prevention and Control (IPPC) authorization. Generally, the wastes conferred in this landfill are industrial sludge, railway ballasts, wastes from the treatment of flue gas of steel mills, ashes from incineration, land reclamation, and wastes from treatment plants. Two different kinds of analyses are performed on waste before its disposal: an analysis on the eluate and another on the solid waste. The first is done to analyze the potential release of substances in the liquid phase (inorganic compounds and chemical oxygen demand, COD). The second kind of analysis evaluates the residue at 105 °C and the total organic carbon (TOC).
The environmental authorization sets the specifications of the monitoring of the pollutants emitted by the landfill surface (compounds to be measured and frequency of measurements) [
22]. Concerning the emissions into the atmosphere, measures on ambient air and landfill gas are done regularly. Ambient air monitoring is measured with a monthly frequency on 11 points (
Figure 4) and includes the following compounds: 1,2-dichloroethane, benzene, 1,2-dichloropropane, toluene, ethylbenzene, meta- and para- xylene, styrene, ortho-xylene, 1,2,4-trimethylbenzene, and 1,3,5-trimethylbenzene. The ambient air concentration in lot 3 is measured with a monthly frequency on sampling points 1, 2, and 3 (
Figure 4). These points are located at a position of 120° with respect to the center of lot 3. The same method is used in lot 4 (points 7, 8, and 9 of
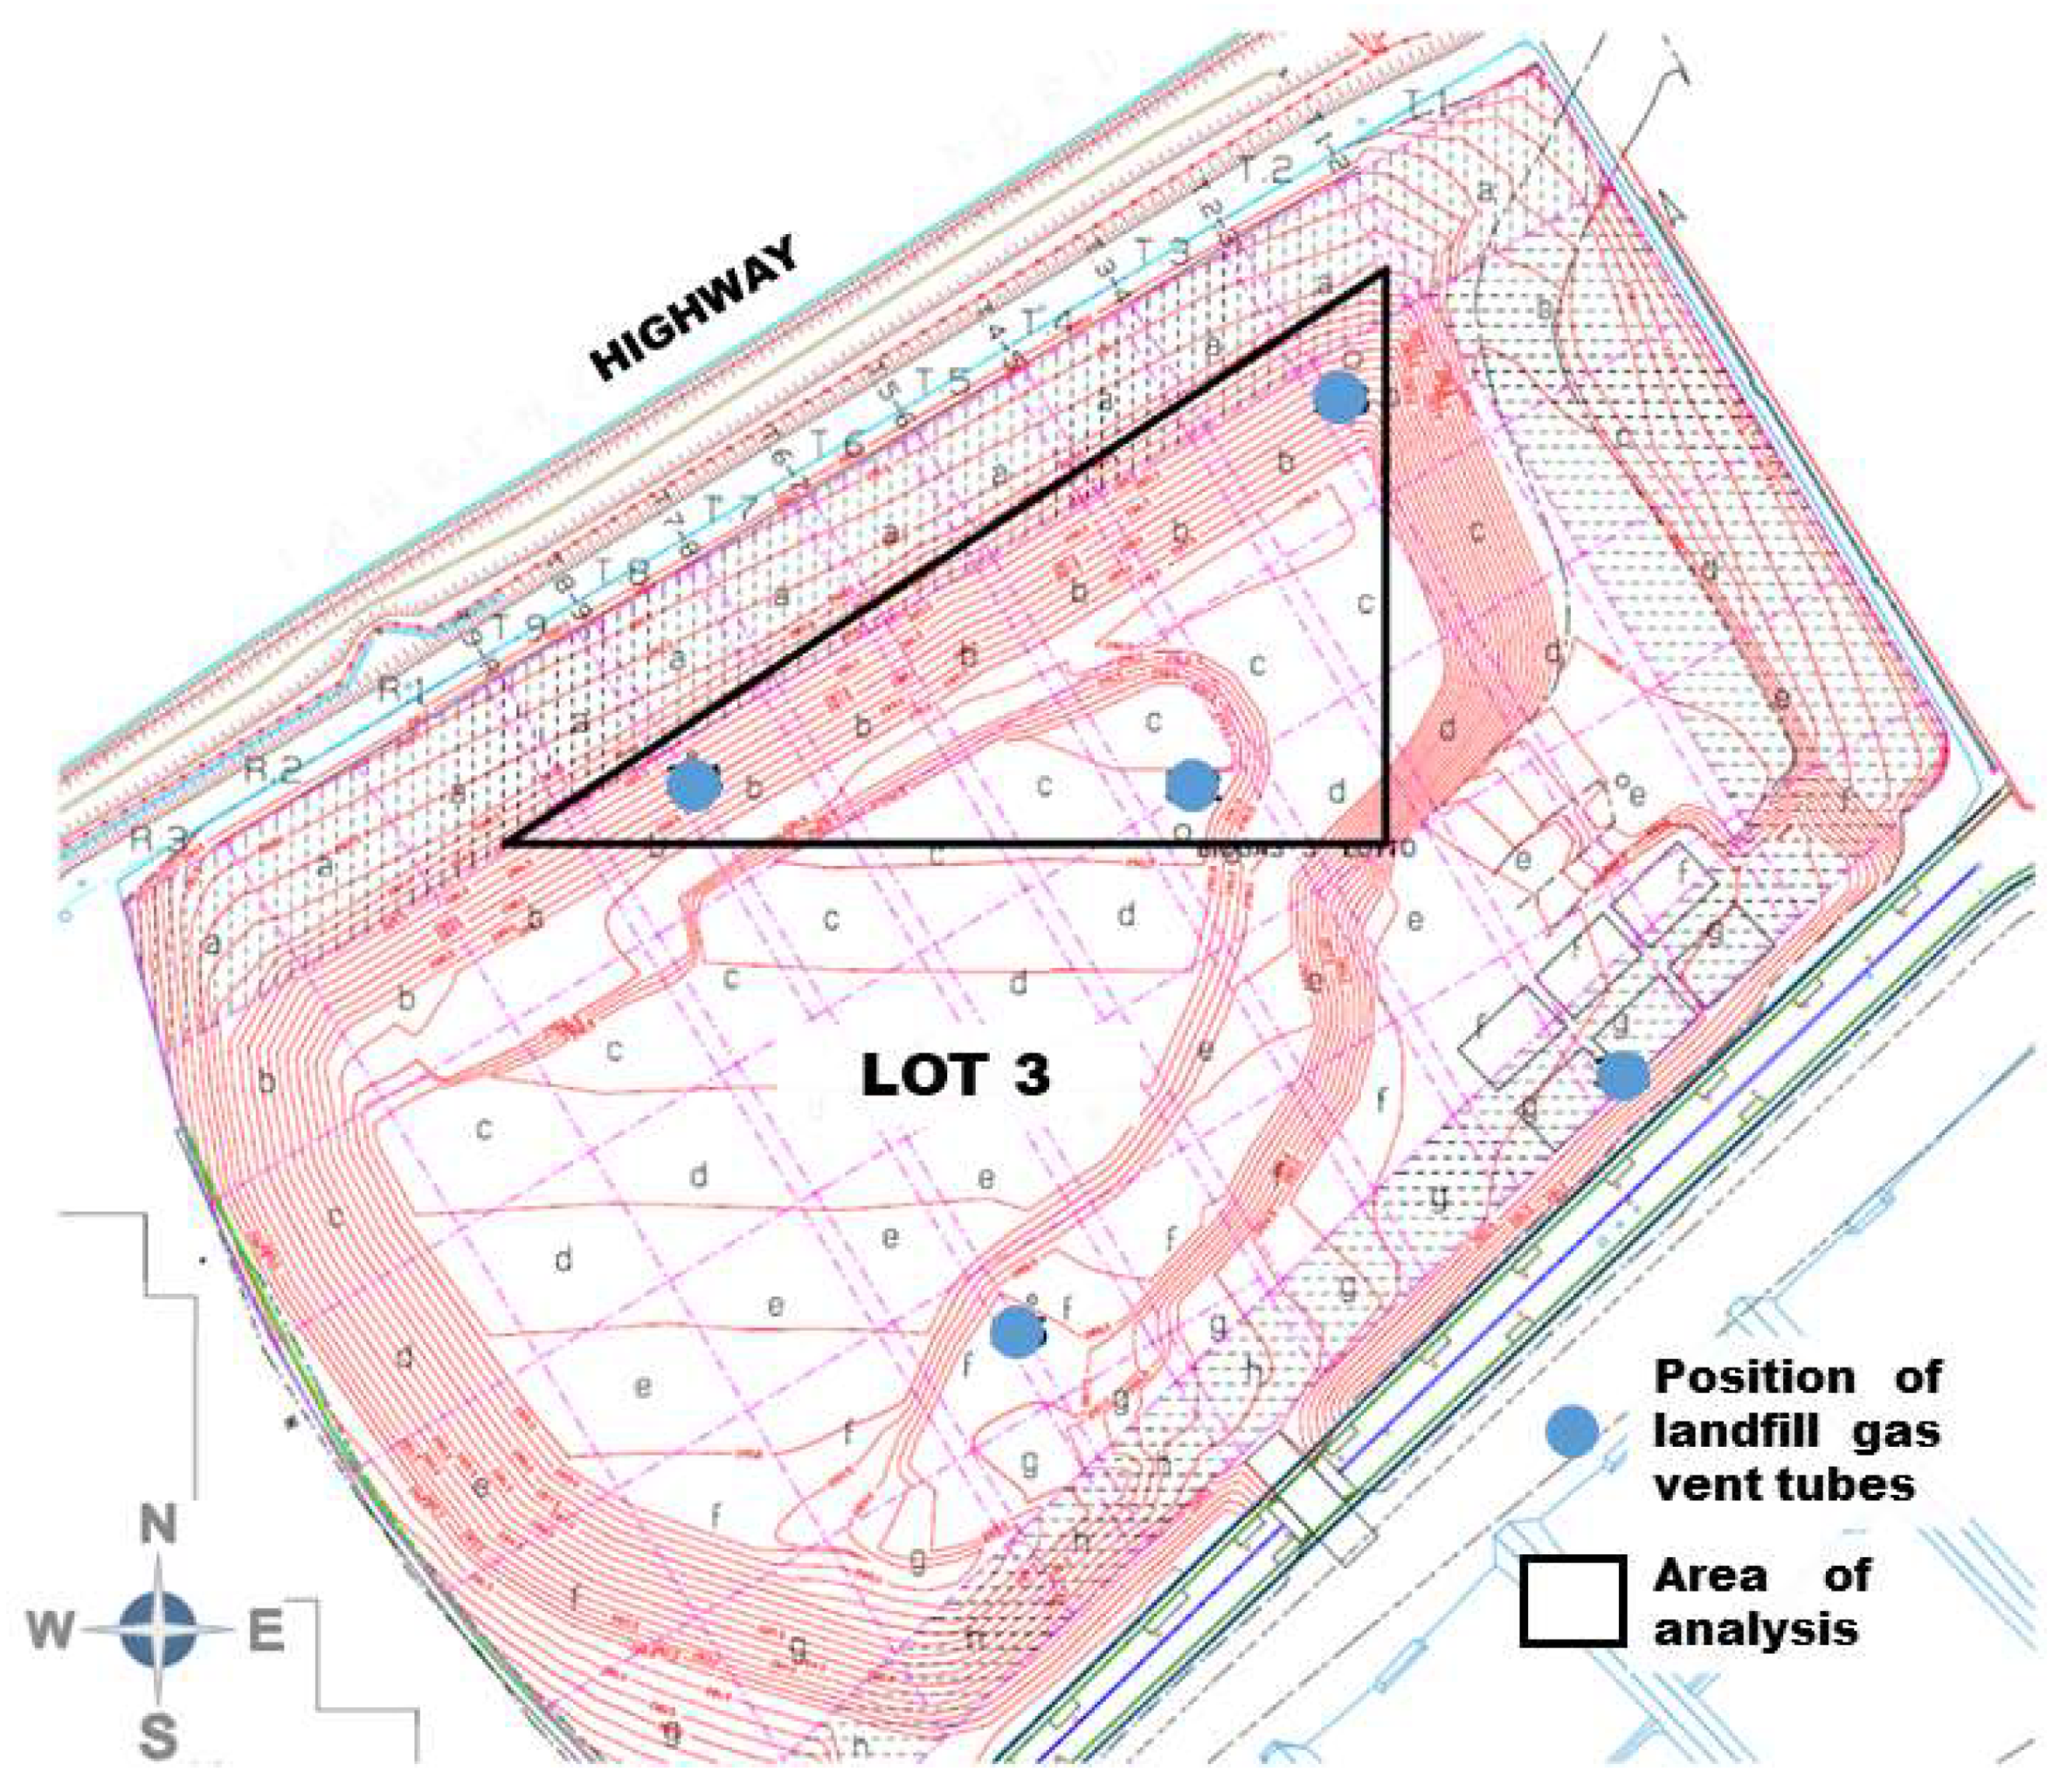
Figure 4). Every 6 months, additional measurements are done in the central position of lot 3 (points 4 and 5) and lot 4 (points 10 and 11). The background concentration is measured every 6 months, at a distance of around 100 m to the limit of the landfill site, in the direction of the nearest receptor (an isolated residential unit). Landfill gas is collected by means of a system of vertical slotted tubes, surrounded by gravel to allow the drainage of gases. Waste typologies conferred in this landfill have very low biodegradability, thus landfill gas production is very limited. The gas is directly vented into the atmosphere. The concentration of pollutants in the vent gas is measured every 6 months. The same chemical species as of ambient air are monitored. The position of the vent pipes in lot 3 is reported in
Figure 5. The collection of samples and analysis are done by an external laboratory. The concentration of pollutants in both ambient air and landfill gas are determined according to the EPA TO15/99 method [
23]. The meteorology of this area is characterized by low winds, in particular during summer and winter. The average wind distribution in 2015, which is representative of the average conditions, is reported in
Figure 6. In this area, during the cold season, pollutant dispersion is mainly regulated by local breeze regimens and soil heat-induced turbulence, which is minimum from December to February. Precipitations are minimum in January.
This study considered all the pollutants monitored on the site, with a particular focus on 1,2-dichloroethane and 1,2-dichloropropane. 1,2-dichloroethane (CAS 107-06-2) is classified by the USA Environmental Protection Agency as a probable human carcinogen (group B2) [
24]. This substance is used principally in the synthesis of vinyl chloride monomer and other chlorinated solvents. It also used as a cleaning agent, and can be contained in personal hygiene and household products [
25]. 1,2-dichloropropane (CAS 78-87-5) is classified by the EPA as a human carcinogen (group A) [
24] and it is used as an industrial solvent in paint stripper and varnishes [
26]. The physico-chemical characteristics of these substances are reported in
Table 1. A Henry’s constant value higher than 10
−3 atm∙m
3/mol identifies compounds that easily volatilize from the liquid phase. Values of the relative volatility from soil higher than 1 identify a substance that easily volatilizes from a solid surface [
27]. Based on their characteristics, it is expected that 1,2-dichloroethane and 1,2-dichloropropane volatilize rapidly and spontaneously from wastes.
2.2. Calculation Approach
To define the most representative values of the pollutant concentration to which landfill workers are exposed, the data collected from the ambient air monitoring systems were analyzed to define their probability distribution. Monthly concentration values recorded in the years 2016 and 2017 in lot 3 (i.e., the period of full operation of this lot) were collected. Data of sampling points 1–5, 7, and 10 were considered (
Figure 4), for a total of 168 observations for each monitored species. To be conservative, a concentration value equal to half of the detection limit was assigned to the observations where the value was below the detection limit. These data were analyzed with the use of the Distribution Fitter tool of the Matlab software [
28]. This tool interactively fits probability distributions to imported data, choosing from 22 built-in probability distributions, or creates a customized distribution. The app displays the fitted distribution over plots of the empirical distributions and the estimated parameters. To evaluate the best fit, the principle of maximum log-likelihood estimates was adopted. One distribution was obtained for each pollutant. These data were used to calculate risk and hazard index (HI) by applying a Monte-Carlo method. A Matlab script was generated to calculate the single and cumulative risk and hazard index based on the equations reported in
Section 2.3.
2.3. Health Risk Analysis
Health risk analysis (HRA) had the objective of evaluating the exposure to hazardous emissions of possible workers operating on the site. HRA considered all 10 substances measured onsite. The cumulative risk and HI for outdoor air inhalation was calculated, then compared to the benchmark reference values. Risk is defined as the probability that a receptor will develop cancer. The hazard index is related to non-carcinogenic effects and is defined as the ratio of the potential exposure to a substance and the level at which no adverse effects are expected. The contribution of halocarbons emissions to the cumulative risk and cumulative HI was then evaluated. The determination of the risk was done independently for each contaminant, thus possible synergic effects (positive and negative) deriving from the coexistence of different compounds were not taken into account. Risk and HI were calculated as:
where
FT [unitless] is the transport factor characteristics for each environmental pathway,
CRS is the representative input concentration [µg/m
3],
EM is the effective flow rate of exposure [m
3 ∙ kg
−1 ∙ day
−1],
SF is the slope factor [kg ∙ day ∙ mg
−1], and
RfD is the reference dose [mg ∙ kg
−1 ∙ day
−1].
FT is assumed to be equal to unity, as it is supposed that workers operate close to the emitting area.
EM is connected to the time of exposure and the characteristics of the receptor; in this case, it was calculated as:
The description and default values of the parameters of Equation (3) are reported in
Table 2.
The toxicological parameters of single substances, i.e.,
SF and
RfD, were calculated from the unit cancer risk (
UCR) and reference concentration (
RfC) parameters, according to Equations (4) and (5). The reference values for these parameters were taken by the report issued by the Italian National Institute of Insurance on Occupational Accidents (INAIL) [
29] and are reported in
Table 3, with the respective International Agency for Research on Cancer (IARC) classification of carcinogenicity:
For each pollutant, considering the specific type and estimated parameters of the probability distribution obtained, a large vector (
n = 10
5) of the estimated concentrations was generated. The Matlab script described in
Section 2.2 was run repeatedly. In every run, a random value was extracted by the vectors of the estimated concentrations and used as an input for the risk and HI calculation. The following output values were obtained: 1 vector of cumulative risk values, 1 vector of cumulative HI values, 10 vectors (one per pollutant) of single risk values, and 10 vectors (one per pollutant) of single HI values.
2.4. Analysis of the Possible Sources of Halocarbons
The secondary objective of this study consisted of the identification of the possible sources of halocarbon emissions in the studied area. With this purpose, a preliminary screening analysis based on the comparative evaluation of concentration measurements and waste disposal records was conducted on the study site. This phase followed two different levels of analysis, corresponding to (i) identification of the possible endogenous/exogenous contribution to halocarbon emissions in the area of the landfill site, and (ii) analysis of the waste disposal reports of the landfill site, to identify possible waste typologies responsible for the halocarbon emissions.
The first phase consisted of the screening of all possible emission sources of VOC present in the area. The study site is located not far from the urban settlement of Turin. Different possible emission sources may thus contribute to VOC emissions in this area, but the highway ring traffic is the most evident source nearby. The research was, therefore, focused on characterizing the emission footprint of traffic sources. A total of 12 publications reporting the composition of VOC emissions from traffic sources were found in the bibliography. As shown in
Table 4, traffic emissions are mainly composed of alkanes, alkenes, and polycyclic aromatic hydrocarbons (PAHs). Only in one case, the presence of halocarbons (namely perchloroethylene) was detected. Conversely, research showed that landfills are well-known sources of halocarbons [
30,
31].
As the preliminary screening tended to exclude the contribution of exogenous emission sources to the presence of halocarbons in the Barricalla site, an analysis of waste disposal records was performed to identify possible waste typologies responsible for halocarbon emissions. With this purpose, data of the air quality monitoring of the site were compared to the documents reporting waste disposal. Given the high number of waste disposal records available, the analysis had to be restricted to a specific area and a specific period. The analysis was thus focused on the portion of lot 3 reported in
Figure 5, considering all records between June and December 2017. This period and area of study were selected considering the variation of the 1,2-dichloropropane concentration recorded in landfill gas (
Table 5). This variation of the concentration may be due to (i) the faster volatilization of halocarbons in summer than winter due to the higher temperature, so that these substances, if present, are emitted before the wastes reach the landfill; and (ii) the different composition of the conferred wastes. Nevertheless, the collection network of landfill gas does not have a horizontal direction, so landfill sub-portions are isolated, and gas is not transferred between sub-portions. Provided this, it was assumed that in this area and period, hazardous wastes possibly emitting halocarbons were conferred. The database of all the materials conferred in this portion of the landfill between June and December of 2017 was thus analyzed.
4. Discussion
The HRA applied to the ambient air inhalation of workers operating on the landfill site showed that the cumulative risk and hazard index were below the threshold limits indicated by current regulations. The joint contribution of 1,2-dichloroethane and 1,2-dichloropropane was 17.9% and 19.4% for the total risk and HI, respectively. The results found can be compared to other studies on MSW landfills, as no similar studies done on hazardous waste landfills were found in the bibliography. Previous research works mainly focused on aromatics. If halocarbons were considered, only a limited number of substances were included in the analysis. A study conducted on a large municipal solid waste landfill in Bejing, China [
5] calculated the health risk of VOC inhalation close to the tipping area. The following ranges of HI were found, depending on the period of the year: Trichloropropane, 4.9 × 10
−2; benzene, 5.5 × 10
−4–1.3 × 10
−2; and tetrachloroethylene, 1.3 × 10
−2–1.5 × 10
−1. Risk ranges were the following: Benzene, 1.3 × 10
−7–2.0 × 10
−5; and tetrachloroethylene, 9.5 × 10
−7–1.5 × 10
−6. The cumulative HI ranged between 2.5 and 5.7. The cumulative risk range was 1.0 × 10
−4–3.4 × 10
−4. Aromatics and halogenated compounds contributed the most to carcinogenic risk (79% and 21%, respectively). The cumulative HI was dominated by H
2S (67%), halocarbons (14%), and aromatics (10%). The results of benzene were similar to the average found in the present study. The cumulative risk and hazard index were around two orders of magnitude higher. The contribution of halocarbons to the cumulative risk and HI was similar. Palmiotto et al. [
11] presented an HRA of an MSW landfill located in central Italy. The cumulative cancer risk for residents living in the vicinity of the facility (around 1 km) ranged between 2.6 × 10
−9 and 3.6 × 10
−8 depending on the direction from the center of the landfill. The cumulative HI ranged between 8.1 × 10
−6 and 1.6 × 10
−4. These values are around two orders of magnitude lower than the present study, indicating that the risk is significantly affected by the exposure distance. The exposure to vinyl chloride monomer (VCM) indicated a specific risk and a HI range of 9.2 × 10
−11–8.8 × 10
−9 and 2.0 × 10
−7–4.0 × 10
−5, respectively. Liu et al. [
4] conducted an HRA of the exposure to BTEX in an MSW landfill in China at a distance of 0.5 km from the landfill borders. The result showed cumulative HI between 3.53 × 10
−2 and 1.77 × 10
−1 and cumulative risk between 9.23 × 10
−7 and 4.63 × 10
−6. Regarding the most hazardous substances, the results were the opposite compared to the present study. HI was dominated by toluene (HI = 2.81 × 10
−2). The risk of benzene exposure was 1.59 × 10
−6, lower than ethylbenzene (3.46 × 10
−6). Like the present study, the emission rates of toluene and p+m xylene fitted the log-normal distribution. Ethylbenzene fitted a gamma distribution. In another study on a Serbian MSW landfill, a cumulative risk of one order of magnitude lower than the present was found [
12]. HCH was the only halocarbon investigated, and its specific risk was 2.28 × 10
−8.
The results presented herein show similarities and differences if compared to existing studies. Both the exposure risk and HI are, except for the Beijing case, not significant. The contribution of halocarbons to the total risk and HI is limited, and BTEX contribute the most. Nevertheless, the analysis of 1,2-dichloroethane and 1,2-dichloropropane showed that even a limited quantity of these substances contributed to increasing the cumulative risk. In fact, considering
Table 6, the average concentrations of 1,2-dichloroethane and 1,2-dichloropropane were around 10 times lower than those of benzene and ethylbenzene. The differences between this and other studies may depend on different factors: Waste composition, landfill management, analysis methodology (substances considered, distance, exposure parameters), and features of the area. The methodology presented in this study improved the characterization of the uncertainty associated with HRA calculations, as it allowed definition of the site-specific most probable exposure concentrations of pollutants. The same approach could be extended to other exposure parameters, such as the inhalation rate and body weight. Regarding the area of study, the site location and meteorology are thought to affect the results. Considering site location, different sources of VOC are present in the area of study, in particular traffic emissions coming from the nearby highway. Additionally, this area is characterized by low winds and frequent atmospheric stability conditions, which fosters the accumulation of pollutants and limits dispersion. For these reasons, the presence of BTEX in the study area is also probably generated by exogenous sources, in particular traffic emissions. The bibliographic data reported in
Table 4 confirm that traffic can be associated with the emission of aromatic compounds.
To clarify this aspect, concentrations of BTEX measured at the Barricalla site were compared to those measured at the closest public monitoring station, namely the Torino Rebaudengo station, a distant of 6 km from the site. The results are reported in
Figure 9 and
Table 8.
Figure 9 shows that, except in June, benzene concentrations at the Barricalla site are lower or equal to those at the Torino Rebaudengo station.
Table 8 shows that, except for ethylbenzene, the average concentration of BTEX at the Barricalla site is lower than or equal to those at the Torino Rebaudengo station. Provided that further analyses are needed to clarify these aspects, these data indicate that BTEX emissions probably come from traffic and other external sources located in the urban area. Halocarbons are not measured in this or other nearby stations, so it was not possible to compare concentration trends of 1,2-dichloroethane, 1,2-dichloropropane, and other halogenated VOCs.
Within the scope of the continuous improvement of the environmental sustainability of the waste management activity at the Barricalla site, considering that this site is incorporated in a heavily anthropized area, some more consideration can be drawn on the characterization of halocarbon emissions done in this study. The spatial and temporal comparison between halocarbon concentrations and waste disposal records did not lead to a clear identification of the waste typologies that are responsible for the emissions. This is because, in many cases, wastes are subject to a partial stabilization process and enter into the landfill with the single comprehensive EWC code 19.03.04* (WHPS, hazardous waste partly stabilized). Besides, concentration measurements were not frequent enough to allow the implementation of a detailed statistical analysis of the concentrations/disposal events. Nevertheless, this study allowed the identification of some possible waste typologies responsible for halocarbon emissions.
1,2-dichloroethane and 1,2-dichloropropane emissions can be produced in different ways. Through the overlay of this information with the list of all the wastes reported in
Appendix A,
Table A1, it can be concluded that the following waste typologies are not excluded from contributing to halocarbon emissions from the Barricalla site:
Sludges from on-site effluent treatment containing hazardous substances;
Filter cakes coming from chemical surface treatment and the coating of metals and other materials;
Machining sludges and waste-blasting material coming from shaping and physical and mechanical surface treatment of metals and plastics;
Soil and stones containing hazardous substances;
Gas treatment wastes coming from incineration or pyrolysis of waste;
Sludges from physico-chemical treatment of hazardous waste; and
Sludges containing hazardous substances from the treatment of industrial wastewater.
Emissions of single waste typologies should be assessed by future research studies. Among these typologies, sludge coming from wastewater treatment plants is one of the major contributions in terms of the volume conferred. WWTP sludges are observed to emit halocarbons, including halogenated solvents. Halogenated compounds in industrial wastewater are generated by industrial solvents, varnish removers, refrigerants, soaps, and paints [
45]. This and other studies evidenced the presence of halogenated substances in the sludge. A consistent emission of 1,2-dichloroethane was also measured during the composting process of WWTP sludge [
30]. Given the high volume produced and the high costs of disposal, the valorization of WWTP sludge constitutes an important topic of research [
46,
47].
To confirm or refute these assumptions, it would be important to implement a model to improve the traceability of the incoming waste, to detect the process that generates it. Additionally, a deeper characterization of the incoming waste should be conducted. As explained before, most halocarbons are very volatile substances. Possible measurement techniques able to detect these substances, although expensive, are gas chromatography or infrared spectrometry [
48]. Finally, stabilization treatments play a key role in the minimization of residual emissions and the re-use of hazardous waste. Research efforts are being addressed to this scope. Some examples include the inertization of WWTP sludge into a ceramic matrix to use it for structural purposes [
49] or the removal of hazardous species from WWTP sludge through electrochemical dewatering [
50].
5. Conclusions
Halogenated VOCs or halocarbons are highly volatile compounds that produce negative effects on human health and contribute to the greenhouse effect. Monitoring and limiting the presence of these substances in the atmosphere is thus crucial, in particular where different types of emission sources are present. Fugitive emissions from the working face of hazardous waste landfills can include halocarbons that are originally contained in the waste. This study had a dual objective. The first was evaluating the potential contribution of halocarbons to the health risks for landfill workers. The second was the analysis of the possible waste typologies emitting halocarbons. The Barricalla site, a hazardous waste landfill close to the city of Turin, Italy, was used as a case study. In the first part of the study, a probabilistic approach was adopted to characterize the uncertainty associated with the method. In the case study analyzed, the most probable cumulative risk and hazard index were below the benchmark values. Halocarbons (1,2-dichloroethane and 1,2-dichloropropane) were not the major contributors to the total risk for the workers. Nevertheless, within the scope of the continuous improvement of the air quality in heavily anthropized areas, a deeper evaluation of the possible sources and remediation actions seems to be necessary. The second part of this study showed that different waste typologies can contribute to halocarbon emissions. Among these, sludge generated by industrial wastewater treatment may be significant. In the case study, the analysis showed that possible sources of halocarbons entered into the landfill as “partly stabilized waste” (EWC code 19.03.04*). This represented a criticism in the view of characterizing the processes originating these wastes. From this perspective, it is recommended that further research should focus on (i) improving the traceability of the waste treatment chain and (ii) improving the waste treatment processes (partial stabilization) in a way to limit fugitive emissions.
In conclusion, in hazardous landfill sites in which up-to-date environmental management is conducted, fugitive emissions of halocarbons should not represent a hazard for the health of workers or the nearby population. Nevertheless, in emission contexts where multiple pollution sources are present, different emerging and minor hazardous pollutants, including halocarbons, may be present. These substances may pose a risk to human health even at low concentrations. Their presence should thus be increasingly and extensively monitored, as their role in the overall emission context of urban and peri-urban areas is not negligible.


