Abstract
In the middle of 2019, Thailand introduced an urgent measure to solve the haze and fine particles problem caused by preharvest sugarcane. The measure is to eradicate the burning of sugarcane before harvesting within the next four years. This study focuses on estimation of future reduced air emissions from the implementation of this measure. The study results showed that without the implementation of the measure in the production season 2022/23, the amount of burned sugarcane will be as high as 102.4 ± 1.0 Mt/yr, resulting in the release of small particulate matter of 2.5 microns or less in diameter (PM2.5) emissions into the atmosphere at 30.6 ± 8.6 kt/yr, which is about a 21% increase in emissions from the 2018/19 season. However, with the government’s enforcement of the measure to reduce burned sugarcane, the amount of air emissions will immediately be reduced in the first year. In order to effectively implement the sugarcane burning reduction measure, in which the harvesting methods will change from cutting burned sugarcane to cutting fresh sugarcane with human labor and with machinery, the government must provide financial support, to farmers, of approximately 3.3 USD per ton of fresh sugarcane for the use of human labor and 2.9 USD per ton of fresh sugarcane for the use of machinery. The costs of investment to reduce PM2.5 emissions can be calculated in the range of 9.7−11.0 million USD per kiloton of PM2.5.
1. Introduction
In 2017, the Food and Agriculture Organization of the United Nations (FAO) reported that there were 102 countries with sugarcane cultivation, with a total of 26 million hectares (Mha) of sugarcane-cultivated land, and a total of 1842 million tons (Mt) of fresh sugarcane produced. The country that produced the most sugarcane was Brazil, which could produce up to 759 Mt (equivalent to 41% of total sugarcane), followed by India and China, which produced 306 Mt (17%) and 104 Mt (6%) respectively. Thailand was the fourth largest sugarcane producer, producing 103 Mt of sugarcane (6%) [1].
According to a report by the Office of Cane and Sugar Board (OCSB), in the production year 2018/2019 [2], Thailand had a total area of 2.0 Mha to produce fresh sugarcane as raw materials for 131 Mt. The sugarcane purchased from farmers by sugar factories was divided into fresh sugarcane and burned sugarcane, accounting for 51 Mt or 39% of total sugarcane and 80 Mt or 61% respectively. As of 2019, there were 56 sugar factories in operation in Thailand, producing a total of 1.46 Mt of sugar. Normally, sugar factories purchase sugarcane around late November to late April every year, which takes approximately 94−166 days depending on the production capacity and quantity of sugarcane around the area of each factory.
According to the information from the production season 2018/2019 [2], the sugar production process produces about 5.88 Mt of molasses (accounting for 44% of sugarcane raw material) and 48.4 Mt of bagasse (accounting for 37% of sugarcane raw materials). Molasses is used as raw material for ethanol production, while about 49% of bagasse is used as fuel to generate heat in sugar factories. The other 51% of the bagasse is used as fuel in thermal power plants. It can be seen that the agricultural waste produced in the production process is sufficient to be used as fuel for heat production in sugar factories, but the waste agricultural residues in cultivated areas, namely the sugarcane tops and leaves, have not been utilized in the energy sector.
Farmers usually burn sugarcane tops and leaves before harvesting to ease the cutting and transporting of sugarcane logs to sugar factories, even though the price paid at sugar factories for burned sugarcane is lower. In the production year 2018/19 [3], 1 United States Dollar (USD) (1 USD ~ 30.5 baht) was deducted for one ton of burned sugarcane sent to a sugar factory. Seventy per cent of the money was paid to farmers who sold fresh sugarcane to the factory, and the remaining 30% was paid to the farmers who sold burned sugarcane. Nevertheless, considering the reduction of labor costs in harvesting, most farmers still prefer to burn sugarcane tops and leaves before harvesting.
The high rate of preharvest sugarcane burning has been affecting the air quality in the surrounding area. Information has been collected in three monitoring stations located in the provinces with a lot of sugarcane cultivation area [4,5], namely Kanchanaburi Meteorological Station (79T) in Kanchanaburi province (harvested area in 2018 = 115 kilo hectares (kha)), the Regional Water Resources Office Station 4 (46T) in Khon Kaen province (102 kha), and the Regional Environment Office Station 8 (26T) in Ratchaburi province (29 kha) (Figure A1). According to the air quality measurement data gained from these stations, the monthly average of PM2.5 concentration in 2018 until June 2019 was in the range of 39−60 micrograms per cubic meter (µg/m3) during the time when sugar factories were open to buy sugarcane, and the monthly average PM2.5 was between 8−20 µg/m3 during the period when sugar factories were closed for buying sugarcane (Figure A2a). While, the World Health Organization (WHO) advises that the annual average PM2.5 value should not exceed 10 µg/m3, and the average amount in 24 hours should not exceed 25 µg/m3 [6]. Figure A2b shows the number of days in each month with PM2.5 exceeding 24-h mean concentration guideline levels. During the months when sugar factories were open to buy sugarcane, it can be seen that the 24-h PM2.5 concentration average was higher than the WHO guidelines levels in all three stations. However, please note that the daily average variation of particulate matter concentration is also related to the meteorological factors, such as relative humidity, temperature, and wind speed [7,8].
The concentration of PM2.5 that exceeds the guidelines levels has been affecting human health. The Bureau of Occupational and Environmental Diseases (BOED), the Ministry of Public Health, Thailand [9], has reported that in the northern region of Thailand, the number of patients hospitalized with chronic diseases of the lower respiratory tract (ICD−10 Code J40−J47) increased significantly between January and April, which was the time when the particles with a diameter of 10 microns or less (PM10) and PM2.5 value exceeded the guidelines levels for the 24-h average due to agricultural biomass burning and forest fires.
In addition, according to a report by José, C. et al. [10], air pollution from preharvest sugarcane burning in 1997−1998 affected the respiratory systems of children and the elderly. The increase in PM2.5 to 10.2 µg/m3 and the increase in PM10 to 42.9 µg/m3 has caused an increase in the number of children and the elderly diagnosed with respiratory diseases, approximately 21.4% and 31.03% respectively. The impact was higher during the time that sugarcane was burned than during the time of no burning. The information corresponds with a research by Silveira, H. et al. [11], which reported that the sugarcane burning during the harvest period affected the health of workers in sugarcane cultivation in Brazil. Also, according to Nicolella, A.C. and Belluzzo, W. [12], the reduction of preharvest sugarcane burning area brought about a decline in the number of patients in São Paulo, Brazil, and their study also found that the effects of fine particles from preharvest sugarcane burning had more health impacts than other emissions sources, such as transportation and industry.
The FAO has evaluated the amount of burned sugarcane biomass by setting the default value of the proportion of the burned sugarcane biomass per sugarcane yield to 0.65 for every country [13]. From the FAO’s data, it is roughly projected that in 2017, a total of 16.9 Mt of sugarcane biomass was burned worldwide, emitting 1.3 Mt of CO2, 45.6 kilotons (kt) of CH4, and 366 kt of N2O. It can be seen from these results that the countries with the most sugarcane biomass burning are listed in order of their sugarcane production capability. However, there are other factors influencing preharvest sugarcane burning such as the size of the plantation, the harvest method (use of machinery or human labor), labor costs, the amount of labor in each country, and environmental laws.
Evaluation of air emissions from preharvest sugarcane burning has been done in many countries with the highest sugarcane cultivation such as Brazil. Daniela, F. et al. [14] studied in São Paulo, the city with the most sugarcane cultivation in Brazil, by using remote sensing data to evaluate the burned area. The study reported that during 2006−2011, São Paulo had annual average air emissions from preharvest sugarcane burning as follows: 1130 kt of CO, 26 kt of NOX, 16 kt of CH4, 45 kt of PM2.5, 120 kt of PM10, and 154 kt of NMHC (nonmethane hydrocarbons).
In Thailand, Sornpoon, W. et al. [15] conducted an experiment by burning sugarcane biomass in 13 sugarcane plantations to study the amount of air pollution from the burning of biomass per unit area. The results showed that the sugarcane plantation areas had average air emissions per area of 766 grams per square meters (g/m2) of CO2, 46.5 g/m2 of CO, 1.4 g/m2 of CH4, 0.04 g/m2 of N2O, and 1.3 g/m2 of NOX. In addition, Kim Oanh, N.T. et al. [16] conducted air pollution assessments from crop residue burning in Southeast Asia (SEA) from 2010−2015, the study set SEA countries’ percentage of sugarcane residue subjected to open burning at 55% of total biomass production.
Because Thailand’s air quality exceeded the health standard, especially the PM2.5 concentration, on June 11, 2019, the Cabinet acknowledged this and agreed with the Ministry of Industry’s proposed measure to solve the burned sugarcane problem in Thailand by law enforcement [17]. That is, in the production season of the year 2019/20, the amount of burned sugarcane accepted by sugar factories cannot exceed 30% of total sugarcane per day, while in the production season of 2020/21, sugar factories can accept not more than 20% burned sugarcane per day, and in the production season 2021/22 the amount of burned sugarcane to be accepted will be reduced to 0−5% per day. This will eliminate burned sugarcane within three years.
Therefore, the situation of air emissions from preharvest sugarcane burning and the spatial and temporal distribution of sugarcane burning in each province are necessary pieces of information for effective planning and implementation of the measure, and the integration of information in all relevant sectors is as important. This study calculated the preharvest sugarcane burning emissions inventories during the production seasons 2007/08−2018/19 and estimated future air pollution emissions by comparing the amount of air pollution emissions in the scenario of preharvest sugarcane burning in usual business (business as usual or BAU) and in the scenario of the implementation of the government’s measure to reduce burned sugarcane in the next four production seasons (2019/20−2022/23). Moreover, the results also include a map of spatial and temporal distribution of air emissions from preharvest sugarcane burning in Thailand to be used as a database of air quality modelling and management work.
2. Methodology
2.1. Equation for Evaluating Emissions
Calculations of preharvest sugarcane burning emissions inventories used the following equation [18].
where Ei is the list of air emissions of species i from preharvest sugarcane burning (t), FB is fuel burned (t), EFi is the emission factor of species i (g/kg). The main parameter of FB in Equation (1) was estimated using Equations (2)−(4).
where FL is fuel load or the density of preharvest biomass residues which include sugarcane tops and leaves (t/ha), CC is combustion completeness (unitless), BA is harvested areas of burned sugarcane (ha), BS is burned sugarcane (t), Y is yield or sugarcane yield per harvest area (t/ha), B is the percentage burned sugarcane per total sugarcane (%), P is the total sugarcane production (t).
2.2. The Amount of Burned Sugarcane Production (BS)
The data on the amount of burned sugarcane (BS) and fresh sugarcane was collected at sugar factories and reported to the OCSB every month. This information was used to calculate compensation for farmers after the end of the sugarcane buying season. According to the data on burned sugarcane and fresh sugarcane reported by the OCSB [19], in the production seasons 2008/09−2018/19 sugar factories bought sugarcane (P) in the range of 66.5−134.9 Mt, with a tendency to increase continuously. The amount of sugarcane delivered to the factories decreased only during the production seasons 2015/16 and 2016/17 in which drought occurred, resulting in reduced sugarcane production. Considering the amount of burned sugarcane that sugar factories bought, it was found that during the buying seasons 2007/08−2018/19, sugar factories purchased burned sugarcane (BS) in the range of 42.3−89.4 Mt, accounting as a percentage of burned sugarcane per total sugarcane quantity (B) in the range of 61−67% (average of 64%, standard deviation (SD) = 2%). Sugar factories in the north of Thailand had the highest percentage of burned sugarcane purchase, with an average of 71% (SD = 5%), followed by factories in central and northeastern regions, with an average of 66% (SD = 4%) and 58% (SD = 3%) respectively. Figure A3 shows the trend of the burned sugarcane quantity (BS) and the percentage of burned sugarcane (B) classified by regions.
2.3. Forecast of Burned Sugarcane Quantity (BS) in the Future
The prediction of the amount of burned sugarcane (BS) each year was calculated by multiplying the total sugarcane (P) that is delivered into the sugar factory multiplied by the percentage of the burned sugarcane (B). According to the data on the trend of total sugarcane entering sugar factories reported by OCSB [19], the total amount of sugarcane had a tendency to increase continuously every year with a linear relationship. The sugarcane quantity was greatly reduced only in the production seasons 2015/16 and 2016/17 because of drought. According to a report of the Geo-Informatics and Space Technology Development Agency, in 2015 and 2016, agricultural area experienced drought about 383 kha/yr and 328 kha/yr respectively [20]. As a result, the amount of sugarcane harvested at the beginning of the following year was low, and the harvested area decreased as well.
In addition, the increase in sugarcane plantation areas and sugarcane quantity were also related to the increase in the amount of ethanol production for the transportation sector. Thailand has set out ethanol production plans in accordance with the Alternative Energy Development Plan 2015 (AEDP2015) [21]. According to Thailand Ethanol Situation in 2018 [22], Thailand produced 1480 million liters of ethanol in 2018 (more than the production in 2017, which was 1347 million liters). The 2018 production was separated into 867 million liters of ethanol produced from molasses and 71 million liters of sugarcane juice, while the rest was from cassava. In the 2017/2018 production season, 3.62 Mt of molasses and 0.95 Mt of sugarcane juice were used as raw materials for ethanol. According to the future ethanol production plan [21], Thailand should produce 4.88 million liters of ethanol per day from sugarcane and molasses by 2026. (In 2017, Thailand was able to produce 3.29 million liters of ethanol per day.) It is clear that under this ethanol production plan, sugarcane planting area and sugarcane quantity will have to increase in the future.
Since this is a short-term forecast (four years), the researchers predicted the sugarcane quantity in a time series relationship. That means the rate of sugarcane production growth is as consistent as that in the past. However, in case that a crop year is affected by natural disasters such as drought, flooding, disease, or insect epidemic that causes the decline of sugarcane production, the data for the following year was classified as a year with an abnormal situation (dummy variable). In creating the equation for multiple linear regression, the independent variable is the total sugarcane quantity (Mt/yr), the dependent variable is the harvesting year (yr), and dummy variable (unitless). Years 2016 and 2017 were defined as years with an abnormal situation. A year with an abnormal situation was set as a dummy and is equal to 1, and the normal year’s dummy is equal to 0. The equation is as follows:
where P is sugarcane production (Mt/yr), Yr is the year (yr), D is dummy variable (unitless), c is the y-intercept (constant term), and a and b are coefficient values. The regression data analysis tool in Excel is used to analyze a time series relationship between the sugarcane productions and year. For the prediction of the percentages of burned sugarcane (B), it can be seen from the graph in Figure A3 that the percentages of burned sugarcane do not change much. That is, the percentages are between 60% and 67% (SD = 2%). In forecasting burned sugarcane percentages in usual business (BAU) in the production seasons 2019/20−2022/23, the average of 64 ± 0.6% (SD = 2%) was used for every year.
2.4. The Average Yield of Cane Stalk (Y)
Sugarcane is considered to be a main economic crop of Thailand, whose data on cultivated areas, harvesting areas, production amount, and yield must be collected by the government every year. The data is reported in the Agricultural Statistics of Thailand by the Office of Agricultural Economic (OAE). According to the data, from 2008−2019 [23], the average yield of cane stalk (Y) ranged from 57.2−76.8 t/ha (with a mean of 69.7 ± 1.9 t/ha (SD = 6.7 t/ha)).
Figure A4 shows the trend of the average yield of cane stalk (Y) by regions and the average yield in Thailand from 2008−2019. The graph shows the inclining average yield of cane stalk in 2016 and 2017, showing abnormalities in cultivation. During those periods, Thailand experienced drought in the rainy season, causing a decrease in sugarcane production. From each region’s data, the average yield of cane stalk in the northeastern region of Thailand was the lowest. That is because there was no water management system in most of the planting areas outside the irrigated zone.
2.5. Fuel Load (FL) and Combustion Completeness (CC)
From a review of field experiments to determine the fuel load (FL) and combustion completeness (CC) of preharvest sugarcane burning and the results of an evaluation of air pollution caused by sugarcane biomass residues burning in the past, the FL and CC values are shown in Table A1.
Researchers of this study selected the FL and CC values from Sornpoon, W. et al. [15], in which an experiment was conducted to find the FL and CC values from the actual burning in 13 sugarcane plantations. The sample plantations were scattered across three regions of Thailand: seven plantations in the northern region, two plantations in the central region, and four plantations in the northeastern region. The average FL of the northern, central and northeastern regions were 8.5 t/ha, 8.0 t/ha, and 7.4 t/ha respectively (total average = 7.9 t/ha and standard error (SE) = 0.03), while the average CC of the northern region, the central region, and the northeastern region were 0.64, 0.60, and 0.71, respectively (total average = 0.64 and SE = 0.05).
2.6. Emission Factors (EF)
From the literature review of emission factors (EFs) related to agricultural biomass burning experiment results shown in Table A2, all EF values were obtained from the biomass burning experiment in the laboratory. The biomass included the sugarcane tops and leaves, and biomass from other types of plants such as rice and wheat, etc. In finding the EFs of sugarcane biomass, most of the materials were sugarcane cultivated in America and Brazil. Only a small amount of sugarcane biomass cultivated in China and Indonesia were used.
According to the data in Table A2, it was found that only two studies did experiments on sugarcane biomass burning while the rest used the EFs of other types of biomass as a substitute for sugarcane biomass. Therefore, the researchers chose the EFs (CO2, CO, PM2.5, PM10, and OC) from Zhang, Y. et al.’s [24] experiment, which burned two sugarcane leaves and tops in a laboratory. That is because the researchers of this study focused on evaluating small particulate emissions (PM2.5 and PM10) and, thus, wanted to use the data from an experiment in which the EF values of PM2.5 together with PM10 were evaluated. For the EF of NOX, the researchers used the results of a study done in Brazil by Daniela, F. et al. [25]. For the EFs of CH4, NH3, and SO2, the researcher used the data reported in the study of Zhou, Y. et al. [26], which was obtained from experiments with wheat biomass.
2.7. Spatial and Temporal Distribution of Burned Area and Air Emissions
This study evaluated the spatial and temporal distribution of sugarcane burning in the production season 2018/19. The researchers used Landsat 8 satellite imagery, which has high resolution (30−m resolution) to find preharvest sugarcane burning areas. Satellite images were collected from the middle of November 2018 until the end of April 2019, which was the time when sugar factories were open to buy sugarcane from farmers. The normalized burn ratio (NBR) proposed by Key, C. and Benson, N. [27] was used to evaluate the area of burning from the satellite imagery as follows.
where NBR is a normalized burn ratio, NIR is the reflectance of near-infrared (bands 5 of the OLI sensor) and SWIR is the shortwave infrared (bands 7 of the OLI sensor). The NBR has a theoretical range of −1.0 to +1.0. Next, after the burned areas of every period have been evaluated from the satellite imagery, the burned areas were overlapped with the land use data of sugarcane cultivation areas provided by the Land Development Department (LDD) in 2014 as shown in Figure A1 [28].
The temporal limitations of the LANDSAT 8 satellite made it impossible to determine the approximate burned areas that occurred daily. Therefore, to determine the daily temporal distribution of burned areas, the researchers used MODIS Burned Area Product collection 6 (MCD64A1) data [29], which has a high temporal resolution (daily) and is suitable for detecting small burned areas such as those within plantations. The MDC64A1 data is a global burned area product that provides spatial resolution at medium for 500-m grid cells, which gives data of daily burned areas. The data can be downloaded from the ftp server, ftp://ba1.geog.umd.edu [30]. The MCD64A1 data for sugarcane production season 2018/2019 from November 2018 to April 2019 was evaluated for burned areas and overlapped with sugarcane plantation information [28] (Figure A1) to classify them as sugarcane cultivation areas with biomass burning.
3. Results and Discussion
3.1. Projection of Burned Sugarcane Production (BS)
A time series relationship is used to forecast the amount of sugarcane sold to sugar factories during the production seasons 2019/20 to 2022/23. The equation is developed in this study as follows.
In forecasting the amount of sugarcane sold to sugar factories (P) during the production seasons 2019/20 to 2022/23, it is predicted that sugarcane production will reduce dramatically since cultivated areas in the central and northeastern regions of Thailand were affected by severe flooding in August and September 2019 [31] (production season 2019/20). Therefore, this study set the production season 2019/20 as the year with an abnormal situation (Dummy variable = 1). The results of sugarcane quantity projections are shown in Figure 1a. It can be seen in the graph that sugarcane production in the 2019/20 production season will be 114.7 Mt/yr, which is reduced from 2018/19 (131.0 Mt/yr) and will increase to normal in the 2020/21 production season (147.2 Mt/yr), in the 2021/22 production season (153.4 Mt/yr), and in the 2022/23 (159.5 Mt/yr) production season.
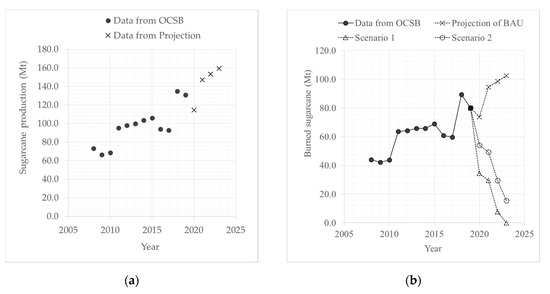
Figure 1.
The trend of the forecast results: (a) sugarcane production quantity and (b) burned sugarcane quantity in the production seasons 2019/20−2022/23.
The results of future calculation of burned sugarcane quantity (BS) in the production seasons 2019/20−2022/2023, shown in Figure 1b, showed that without the implementation of the measure in the production season 2022/23, it is expected that the total amount of burned sugarcane will be 102.4 ± 1.0 Mt.
Thailand’s government requires that the maximum percentage of burned sugarcane be 30% (B = 30%) in the production season 2019/20, reducing to 20%, 5%, and 0% in the production seasons 2020/21, 2021/22, and 2022/23 respectively. If this measure is successful (scenario 1, (SC 1)), the amounts of burned sugarcane will be 34.4 Mt/yr, 29.4 Mt/yr, 7.7 Mt/yr, and 0 Mt/yr in those seasons (Figure 1b).
In addition, this study has set scenario 2 (SC 2), in which only 50% of the sugar factories and farmers would comply with control measures. That is, in the production season 2019/20, there will still be 47% of sugarcane burned ((64% + 30%)/2). In scenario 2, the percentages of burned sugarcane will be 34%, 19%, and 10% in the production seasons 2020/21, 2021/22, and 2022/23 respectively. As a result, the total amounts of burned sugarcane will be 54.0 Mt/yr, 49.4 Mt/yr, 29.6 Mt/yr, and 15.4 Mt/yr respectively (Figure 1b).
The amount of burned sugarcane (BS) each year was used to calculate the amount of air pollution from preharvest sugarcane burning as shown in Equations (1)−(3), in which the average national yield is 69.7 ± 1.9 t/ha, the average FL is 7.9 ± 0.03 t/ha, and the average CC is 0.64 ± 0.05 (the average value from 2008−2019).
3.2. Amount of Air Pollutant Emissions
Table A3 shows the inventory of air pollutant emissions from preharvest sugarcane burning in Thailand in the production seasons 2007/08−2018/19. According to the results, there is a trend of continuous increase of air pollution every year in Thailand, depending on the amount of burned sugarcane sold to sugar factories. In the production season 2018/19, before the government enforced the measure to reduce burned sugarcane, Thailand had the highest air pollutant emissions, which included 7.1 ± 1.7 Mt of CO2, 23.9 ± 6.3 kt of CH4, 0.4 ± 0.1 kt of N2O, 246 ± 98 kt of CO, 9.2 ± 2.6 kt of NOX, 6.1 ± 1.6 kt of NH3, 3.2 ± 0.9 kt of SO2, 25.2 ± 7.1 kt of PM2.5, 34.6 ± 8.5 kt of PM10, 4.5 ± 1.2 kt of BC, and 7.7 ± 4.2 kt of OC.
Figure 2a shows the amount of PM2.5 emission in each region in Thailand. Seen from this figure, sugarcane burning in the central region emitted the most PM2.5, followed by the northeastern region and northern region. Considering the trend of PM2.5 emission, it was found that PM2.5 emission tended to increase in a linear manner in the central and northeastern regions. In contrast, it has been relatively stable in the northern region, especially since the production season 2014/15 onwards. From this data, it is seen that the overall PM2.5 emission has been increasing because of the emissions mainly occurring in the central and northeastern regions of Thailand.
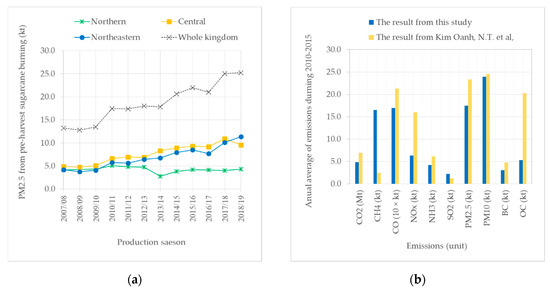
Figure 2.
The results of: (a) PM2.5 emission from preharvest sugarcane burning in each region; (b) Comparison of air emissions from preharvest sugarcane burning in Thailand between this study and that in Kim Oanh, N.T. et al. [16].
A comparison of the results of this study with that of Kim Oanh, N.T. et al. [14], which evaluated air emissions from agricultural biomass burning in Southeast Asia during the years 2010–2015, is shown in Figure 2b.
It is seen in Figure 2b that the selection of different data sources had an effect on the assessment of air emissions. That is, a study by Kim Oanh, N.T. et al. [16] used 55% as the fraction of dry matter of sugarcane residue that is subjected to open burning, which was about 10% lower than the data reported by OCSB [19]. In addition, choosing to use EF values from different data sources can lead to different results, especially the values of CH4 and OC.
In its evaluation of burned sugarcane biomass quantity [13], the FAO uses the same value for burned sugarcane biomass per the total sugarcane harvesting area in Thailand every year: 6.5 t/ha. As for this study, it can be calculated as 3.0−3.4 t/ha, depending on the region. It can be seen that the value of this study is lower than that of the FAO by about 50%.
3.3. Projection of Air Pollutant Emissions
The forecasts of the amount of air emissions are divided into two conditions, namely the normal conditions (business as usual, BAU) where no sugarcane burning reduction measure is implemented and the condition in which sugarcane burning reduction measure is implemented. The forecasts of air emissions under normal situation (without the measure implementation) are shown in Table A4. According to the results, the air emissions tend to continuously increase, with a drop in only the first year of the forecast due to reduced sugarcane production. From then, the amount of air emissions will increase. It is expected that in the production season 2022/23, the amount of air pollutants emissions will include 8.6 ± 2.0 Mt of CO2, 45.2 ± 7.6 kt of CH4, 0.5 ± 0.1 kt of N2O, 298 ± 119 kt of CO, 11.1 ± 3.1 kt of NOX, 9.7 ± 2.0 kt of NH3, 3.9 ± 1.0 kt of SO2, 30.6 ± 8.6 kt of PM2.5, 42.0 ± 10.3 kt of PM10, 5.4 ± 1.4 kt of BC, and 9.3 ± 5.0 kt of OC, which is about a 21% increase in emissions from the 2018/19 season.
The forecasts of air emissions under the government’s measure to reduce sugarcane burning during the production seasons 2019/20−2022/23 are shown in Table A4, where the results are based on two scenarios: the measure is 100% successful (SC 1) and the measure can decrease only 50% of the amount in the previous year (SC 2). It can be seen here that if the measure is successful, the amount of air emissions will drop sharply by 53% compared to BAU in the first year of the sugarcane purchase season. Finally, by the end of the 2022/23 production season, there will be no air emissions from preharvest sugarcane burning. The implementation of the measure to reduce sugarcane burning during the production seasons 2019/20−2022/23 can reduce total air emissions to be in the following the values: 24.9 ± 3.8 Mt of CO2, 84.2 ± 14.3 kt of CH4, 1.5 ± 0.3 kt of N2O, 865 ± 223 kt of CO, 32.4 ± 5.8 kt of NOX, 21.6 ± 3.7 kt of NH3, 11.4 ± 1.9 kt of SO2, 88.9 ± 16.0 kt of PM2.5, 121.9 ± 19.2 kt of PM10, 15.8 ± 2.7 kt of BC, and 27.0 ± 9.4 kt of OC.
Figure 3a shows the comparison of PM2.5 emissions under the implementation of the sugarcane reduction measure (SC 1 and SC 2) and the PM2.5 emissions without such a measure (BAU). The areas below the graph are the amount of reduced PM2.5. Figure 3b shows the percentage of PM2.5 emission reduction under the implementation of the sugarcane reduction measure (SC 1 and SC 2). In terms of SC 1, the percentage of PM2.5 emissions reduction in each production season would be 53%, 69%, 92%, and 100% respectively.
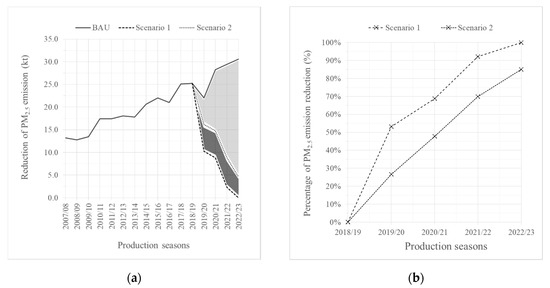
Figure 3.
Forecasting (a) the reduction of PM2.5 emissions and (b) the percentage of PM2.5 emission reduction from the implementation of the measures to reduce sugarcane burning.
3.4. Spatial and Temporal Distribution of Active Fires and Burned Area
According to the translation of LANDSAT 8 satellite images at the time that the sugar factories opened to buy sugarcane in the production year 2018/19, the total burned area was 391.6 kha, consisting of 89.6 kha in the northern region (23% of the total burned area), 89.4 kha in the central region (23%), and 212.6 kha in the northeastern region (54%). Figure 4a shows monthly temporal distribution of burned areas that occurred in sugarcane fields classified by regions. From the graph, January was the month with the most burning, with a total burned area of 124.5 kha (32%), followed by February and March, with burned areas of 121.8 kha (31%) and 79.7 kha (20%).
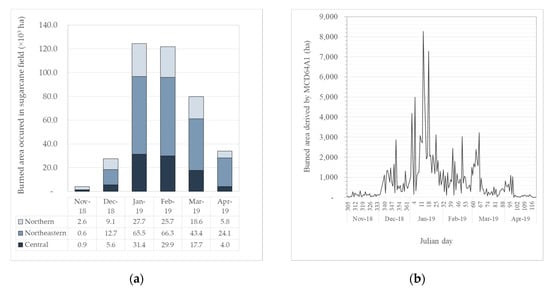
Figure 4.
Temporal distribution of burned area associated with preharvest sugarcane burning in Thailand derived from (a) the LANDSAT 8 satellite and (b) MODIS Burned Area Product collection 6 (MCD64A1) during November 2018 to April 2019.
The burned area evaluation result in the production season 2018/19 gained from the translation of LANDSAT 8 satellite imagery was compared to the OCSB’s data [2], and it was found that the burned area from LANDSAT 8 was about 3.1 times smaller than that from OCSB (The burned area reported by OCSB was 1228 kha). The reason why the satellite gave a smaller value of burned area is that the satellite has a 16-day repeat cycle, due to its orbit. As a consequence, the data of some burned areas were not collected during the time when the satellite was unable to take pictures, and the use of water with sugarcane stumps after cutting has made the equation used for translating satellite images unable to identify burned areas. In the future, if satellite images are needed for sugarcane burning area evaluation, the data should be taken from various satellites in order to maximize the amount of data.
By using MCD64A1’s data, it was found that the burned area during the 2018/19 was 150.7 kha. January 2019 was the month with the most burned area; which was 73.2 kha (49% of total burned area), followed by February 2019, and December 2018; with 24.8 kha (16%) and 22.7 kha (15%) respectively. As for the daily burned area, it was found that the burned area tended to increase depending on the sugar factories’ purchasing power. The dates with the highest burning were 13 and 18 January 2019, with approximately 8.3 kha and 7.3 kha respectively. Figure 4b shows the daily temporal distribution of burned area associated with preharvest sugarcane burning derived from MCD64A1.
When comparing the overall burned area data derived from both MCD64A1 and LANDSAT 8 with the calculated results from the use of OCSB’s national statistical data, it was found that, in the production season 2018/19, MCD64A1’s data on burned area was about 2.6 times less than LANDSAT 8’s and 8.2 times less than the result from OCSB. The different results mean that using the top-down approach (remote-sensing data) to evaluate burned area provides lower results than using the bottom-up approach (statistical data).
For example, global fire emissions databases that are commonly used for satellite data in evaluating burned areas include the Global Fire Emissions Database (GFED) [32], the Global Fire Assimilation System (GFAS) [33], the Fire Inventory from NCAR (FINN) [34], and the Global Inventory for Chemistry-Climate studies (GICC) [35]. Therefore, it is worth knowing that when using satellite data to evaluate the burned area and agricultural biomass burning emissions, the amount of emissions may be lower than the actual emissions.
3.5. Spatial and Temporal Distribution of Emissions
Figure 5a–e show monthly temporal distribution of PM2.5 emission associated with preharvest sugarcane burning in Thailand during production season 2018/2019. It is seen in the figures that in December 2018, the beginning of sugar factories’ sugarcane purchase, PM2.5 in all the regions started to be emitted. During January to March 2019, the amount of PM2.5 emission was noticeably increased and spread throughout cultivated areas in all three regions. When reaching the final month of sugarcane purchase, the amount of PM2.5 emission began to decrease.
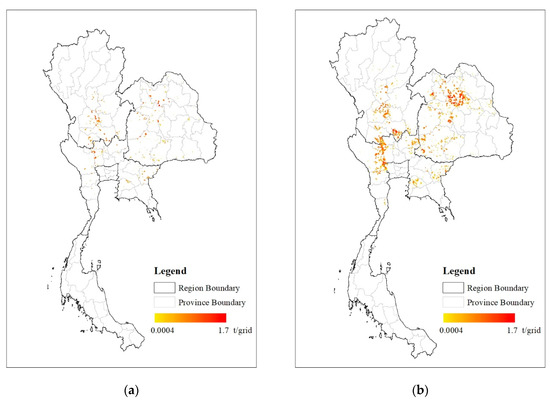
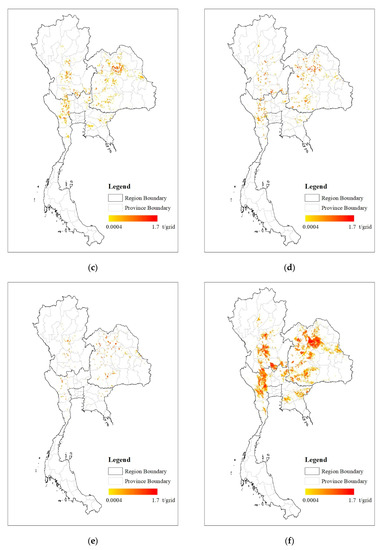
Figure 5.
Monthly temporal distribution of PM2.5 grid emission associated with preharvest sugarcane burning in Thailand in (a) December 2018, (b) January 2019, (c) February 2019, (d) March 2019, (e) April 2019, and (f) during production season 2018/2019.
Figure 5f shows the density of PM2.5 emission throughout the sugarcane production season 2018/19. It can be seen from the figure that PM2.5 was densely emitted in the lower northern region and continuing to the west side of the central region, where a lot of sugarcane was cultivated. The PM2.5 was also densely emitted in the east side of the central region. In the northeastern region, PM2.5 was densely emitted throughout the west side of the region, which is the boundary connecting the northern and the central regions. This high-resolution grid emission map (1 km × 1 km) can be used as a database for creating air quality model predictions and management.
3.6. Analysis of Farmers’ Burden as a Result of the Implementation of Sugarcane Burning Reduction Measure
In the measure to reduce sugarcane burning, the government has set the percentage of burned sugarcane sold to sugar factories to be 30% in the production season of 2019/20, which is a rapid decline from an average of 64%. That means farmers will have to change their harvest methods from human labor in cutting burned sugarcane to cutting fresh sugarcane, or they will have to use sugarcane harvester machines instead. In addition, within three sugarcane production seasons, the percentage of burned sugarcane must be reduced to 0%−5%.
According to a study on sugarcane cultivation costs done by the OCSB in collaboration with Khon Kaen University during the production season 2014/15 [36], in which 1547 farmers in all three sugarcane cultivating regions were interviewed, the difference between labor costs in cutting fresh sugarcane and burned sugarcane was about 234 USD/ha. In this calculation, the labor cost for cutting fresh sugarcane = 0.1 USD per bundle, and that for cutting burned sugarcane = 0.05 USD per bundle; one bundle of sugarcane weighs around 15 kg; yield = 70 t/ha. Thus, in harvesting one hectare of sugarcane, the labor costs for cutting fresh and burned sugarcane are 467 USD/ha (0.1 USD/bundle × 70 t/ha × 103/15 kg) and 233 USD/ha (0.05 USD/bundle × 70 t/ha × 103/15 kg) respectively). Based on the information earlier, farmers will have to bear the additional cost of harvesting sugarcane by approximately 234 USD/ha (467−233 USD/ha) or 3.3 USD per ton of fresh sugarcane (234 USD/ha/70 t/ha) from employing labor to cut fresh sugarcane without burning.
In addition, if farmers hire a sugarcane harvester machine, the cost of the harvest is around 436 USD/ha or 6.2 USD/t. It is obvious that hiring a harvester machine costs more than using labor to cut burned sugarcane about 203 USD/ha (436–233 USD/ha) or 2.9 USD per ton of fresh sugarcane (203 USD/ha/70 t/ha). The government must find ways to help farmers with the increased harvest cost while they try to successfully comply with the measure set by the government. These numbers are additional costs that the sugarcane farmers will have to pay when the government’s sugarcane burning reduction measure is implemented. However, the government’s subsidized money to help with farmers’ increased harvesting cost can be calculated as the amount of money paid for reduced PM2.5 in the range of 9.7−11.0 million USD per kilotons of PM2.5 (using Equation (8)).
where CE is costs of reducing emissions (million USD per kilotons of emissions), BSbau is burned sugarcane in usual business (t), BSSC1 is burned sugarcane in scenario 1 (t), AC is additional cost (USD per ton of fresh sugarcane), ER is emissions reduction (kt of emissions).
4. Conclusions
In this study, the researchers have selected the appropriate value for each variable related to the evaluation of air pollution from preharvest sugarcane burning by reviewing numerous past studies that are suitable for the Thailand context. The results showed that, during the production seasons 2007/08−2018/19, burned sugarcane in Thailand tended to continuously increase, resulting in more air pollution, and it can be predicted that air emissions will continue to increase in the future. That is, in the production season 2022/23, the amount of emissions is expected to increase by approximately 21% compared to that in the production season 2018/19. However, if the government enforces the sugarcane burning reduction measure during the production seasons 2019/20−2022/23, farmers must immediately reduce preharvest sugarcane burning, which will reduce the amount of air emissions compared to BAU in each year by 53%, 69%, 92%, and 100% respectively.
The results also showed the differences between the use of the top-down approach and the bottom-up approach to evaluate burned area. That is, the bottom-up approach gave approximately a three times higher value of the burned area than the top-down approach did. Therefore, when using the value gained from the top-down approach in evaluating the air emissions, the results may be lower than the fact. However, the satellite can be used to monitor the spatial and temporal distribution of sugarcane burning adequately.
Finally, all the results should be useful for those who are involved in energy and environmental policies and agricultural economic policies to make effective decisions. Furthermore, in order to improve Thailand’s air quality in the future, the government should also have measures to reduce other types of biomass burning, especially rice straw biomass, which is also considered as a source of air pollution like sugarcane tops and leaves biomass. The government should also support the use of sugarcane tops and leaves biomass materials in the renewable energy sector, which could help farmers earn income from selling biomass scraps and to help reduce their cost of harvesting.
Author Contributions
A.J. and J.P. devised the project, the main conceptual ideas and proof outline. They worked out almost all of the technical details, and performed the numerical calculations. S.G. supervised the findings of this work. All authors have read and agreed to the published version of the manuscript.
Funding
This research was funded by the Development of Thailand’s Air Pollutants and Greenhouse Gases (GHGs) Emission Inventory and Projection for use in Air Quality Models Project.
Acknowledgments
This study was supported by King Mongkut’s University of Technology Thonburi (KMUTT) through the “KMUTT 55th Anniversary Commemorative Found” and the Mahidol University (MU).
Conflicts of Interest
The authors declare no conflict of interest.
Appendix A

Table A1.
Comparisons of the fuel load (FL) and combustion completeness (CC) values of sugarcane tops and leaves from past studies.
Table A1.
Comparisons of the fuel load (FL) and combustion completeness (CC) values of sugarcane tops and leaves from past studies.
| References | FL (t/ha) | CC | Notes |
|---|---|---|---|
| Sornpoon, W. et al. [15] | 7.90 | 0.64 | Thirteen field experiments in three regions of Thailand in 2012. |
| DEDE [37] | 11.80 1 | − | Field experiment in Thailand, 2015. |
| Kim Oanh, N.T. et al. [16] | 15.70 2 | 0.68 | They referred to the results based on a study in North Sulawesi, Indonesia. |
| IPCC 2006 [38] | 6.50 | 0.80 | Expert assessment by authors. |
| Zhou, Y. et al. [26] | 9.26 3 | 0.68 | They referred to the results derived by Han, L.J. et al. [39]. |
| Zhang, X. et al. [40] | 7.14 4 | 0.90 | They referred to the results derived by Zhang, Y. et al. [24]. |
| Daniela, F. et al. [14] | 10.70 | − | Eight field experiments in Brazil, 2010. |
1 The FL was calculated using the equation FL = (RPR × P)/A, where RPR is the residue per product ratio in dry weight which DEDE [37] presented and equals 0.17, P is the sugarcane production, and A is the harvested area of sugarcane which OAE [23] reported. The sugarcane production in 2015 = 106.3 Mt and harvested area = 1.53 Mha. 2 The FL was calculated using equation FL = (RPR×D×P)/A, where RPR is the residue per product ratio and D is dry matter to crop residue ratio which Kim Oanh, N.T. et al. [14] presented and RPR = 0.3 and D = 0.71, P is the sugarcane production and A is the harvested area of sugarcane during 2010−2015 which the FAO [1] reported, and the sugarcane production during 2010−2015 = 93.5 Mt and harvested area = 1.27 Mha. 3 The FL was calculated using equation FL = (RPR×D×P)/A. Zhou, Y. et al. [26] used the value of RPR derived by Han, L.J. et al. [39]. They provided the RPR = 0.3 and D = 0.45. The FAO [1] reported that the P and A of China in 2012 = 123.7 Mt and 1.80 Mha respectively. 4 The FL was calculated using equation FL = (RPR×D×P)/A. Zhang, X. et al. [40] used the value of RPR derived by Zhang, Y. et al. [24]. Zhang, Y. et al. [24] referred to the results from the study of Liu, G and Shen, L. [41]. They used RPR = 0.10 and D = 0.90. The FAO [1] reported that the P and A of China in 2014 = 125.6 Mt and 1.76 Mha respectively.
Table A2.
Comparisons of the emission factors used to assess air emissions from sugarcane biomass burning in past studies (g/kg).
Table A2.
Comparisons of the emission factors used to assess air emissions from sugarcane biomass burning in past studies (g/kg).
| Previous Studies | CO2 | CH4 | N2O | CO | NOX | NH3 | SO2 | PM2.5 | PM10 | BC | OC |
|---|---|---|---|---|---|---|---|---|---|---|---|
| Kanabkaew, T. and Kim Oanh, N.T. [42] 1 | − | 0.4 | − | 34.7 | 2.6 | 1.0 | − | 3.8 | 4.0 | − | − |
| Daniela, F. et al. [14] | 1303 | − | − | 65 | 1.5 | − | − | 2.6 | − | − | − |
| ±218 | − | − | ±14 | ±0.4 | − | − | ±1.6 | − | − | − | |
| Zhang, Y. et al. [24] | 1152.5 | − | − | 40.1 | − | − | − | 4.12 | 5.65 | − | 1.25 |
| ±258 | − | − | 15.7 | − | − | ±1.10 | ±1.30 | − | ±0.67 | ||
| Zhou, Y. et al. [26] 2 | 1410 | 3.9 | − | 40.08 | 3.16 | 1.0 | 0.53 | 6.79 | 6.93 | − | 3.3 |
| Zhang, X. et al., [40] 3 | 1152.5 | 4.31 | − | 40.08 | 3.49 | 1.39 | 0.43 | 4.12 | 6.29 | 0.73 | 1.25 |
| Yokelson, R.J. [43] | 1838 | 0.93 | − | 50.4 | − | − | − | 2.17 | − | − | − |
| IPCC 2006 [38] | 1515 | 2.7 | 0.07 | 92 | 2.5 | − | − | − | − | − | − |
| ±177 | − | − | ±84 | ±1.0 | − | − | − | − | − | − | |
| This study | 1152.5 | 3.9 | 0.07 | 40.1 | 1.5 | 1.0 | 0.53 | 4.12 | 5.65 | 0.73 | 1.25 |
| ±258 | − | − | ±15.7 | ±0.4 | − | − | ±1.10 | ±1.30 | − | ±0.67 |
1 Kanabkaew, T. and Kim Oanh, N.T. [42] used the EFs from Dennis, A. et al., [44], who studied the EFs of wheat straw residue in Texas USA. 2 Zhou, Y. et al. [26] used the EFs of PM2.5 and PM10 suggested in the Guide for Compiling Atmospheric Pollutant Emission Inventory for Biomass Burning created by Environmental Protection Department (EPD) in China [45], used EF of CO from a study done by Zhang, Y. et al. [24], and used EFs of CO2 CH4 OC NOX and SO2 from the results of a study done by Li, X.H. et al. [46], which mainly experimented with corn and wheat biomass as a substitute for sugarcane biomass. 3 Zhang, X. et al., [40] used all EFs (except PM2.5 and PM10) obtained from rice straw burning cultivated in China, while EFs of PM2.5 and PM10 were obtained from Zhang, Y. et al., [24], from an experiment in which two sugarcane biomass samples, cultivated in the Pearl River Delta Region, China, were burned. Zhang, Y. et al., [24] used EFs from the sugarcane leaves burning experiment in a laboratory by using sugarcane grown in the Pearl River Delta Region, China. Samples of postharvest sugarcane leaves were left to dry for one to two days, and two tests were conducted.
Table A3.
Air pollutant emissions inventory associated with preharvesting sugarcane burning.
Table A3.
Air pollutant emissions inventory associated with preharvesting sugarcane burning.
| Production Season | CO2 | CH4 | N2O | CO | NOX | NH3 | SO2 | PM2.5 | PM10 | BC | OC |
|---|---|---|---|---|---|---|---|---|---|---|---|
| (Mt) | (kt) | (kt) | (kt) | (kt) | (kt) | (kt) | (kt) | (kt) | (kt) | (kt) | |
| 2007/08 | 3.7 | 12.5 | 0.2 | 129 | 4.8 | 3.2 | 1.7 | 13.2 | 18.1 | 2.3 | 4.0 |
| ± 0.9 | ± 3.3 | ± 0.1 | ± 51 | ± 1.3 | ± 0.8 | ± 0.4 | ± 3.7 | ± 4.4 | ± 0.6 | ± 2.2 | |
| 2008/09 | 3.6 | 12.1 | 0.2 | 124 | 4.7 | 3.1 | 1.6 | 12.8 | 17.5 | 2.3 | 3.9 |
| ± 0.9 | ± 3.2 | ± 0.1 | ± 50 | ± 1.3 | ± 0.8 | ± 0.4 | ± 3.6 | ± 4.3 | ± 0.6 | ± 2.1 | |
| 2009/10 | 3.8 | 12.7 | 0.2 | 131 | 4.9 | 3.3 | 1.7 | 13.5 | 18.5 | 2.4 | 4.1 |
| ± 0.9 | 3.4 | ± 0.1 | ± 52 | ± 1.4 | ± 0.9 | ± 0.5 | ± 3.8 | ± 4.5 | ± 0.6 | ± 2.2 | |
| 2010/11 | 4.9 | 16.5 | 0.3 | 170 | 6.3 | 4.2 | 2.2 | 17.4 | 23.9 | 3.1 | 5.3 |
| ± 1.2 | ± 4.4 | ± 0.1 | ± 68 | ± 1.8 | ± 1.1 | ± 0.6 | ± 4.9 | ± 5.9 | ± 0.8 | ± 2.9 | |
| 2011/12 | 4.9 | 16.5 | 0.3 | 170 | 6.3 | 4.2 | 2.2 | 17.4 | 23.9 | 3.1 | 5.3 |
| ± 1.2 | ± 4.3 | ± 0.1 | ± 68 | ± 1.8 | ± 1.1 | ± 0.6 | ± 4.9 | ± 5.8 | ± 0.8 | ± 2.9 | |
| 2012/13 | 5.0 | 17.1 | 0.3 | 176 | 6.6 | 4.4 | 2.3 | 18.0 | 24.7 | 3.2 | 5.5 |
| ± 1.2 | ± 4.5 | ± 0.1 | ± 70 | ± 1.8 | ± 1.2 | ± 0.6 | ± 5.0 | ± 6.1 | ± 0.8 | ± 3.0 | |
| 2013/14 | 5.0 | 16.9 | 0.3 | 173 | 6.5 | 4.3 | 2.3 | 17.8 | 24.4 | 3.2 | 5.4 |
| ± 1.2 | ± 4.4 | ± 0.1 | ± 69 | ± 1.8 | ± 1.1 | ± 0.6 | ± 5.0 | ± 6.0 | ± 0.8 | ± 2.9 | |
| 2014/15 | 5.8 | 19.5 | 0.4 | 201 | 7.5 | 5.0 | 2.7 | 20.6 | 28.3 | 3.7 | 6.3 |
| ± 1.4 | ± 5.1 | ± 0.1 | ± 80 | ± 2.1 | ± 1.3 | ± 0.7 | ± 5.8 | ± 6.9 | ± 1.0 | ± 3.4 | |
| 2015/16 | 6.2 | 20.8 | 0.4 | 214 | 8.0 | 5.3 | 2.8 | 22.0 | 30.2 | 3.9 | 6.7 |
| ± 1.5 | ± 5.5 | ± 0.1 | ± 86 | ± 2.2 | ± 1.4 | ± 0.7 | ± 6.2 | ± 7.4 | ± 1.0 | ± 3.6 | |
| 2016/17 | 5.9 | 19.9 | 0.4 | 204 | 7.6 | 5.1 | 2.7 | 21.0 | 28.8 | 3.7 | 6.4 |
| ± 1.4 | ± 5.2 | ± 0.1 | ± 82 | ± 2.1 | ± 1.3 | ± 0.7 | ± 5.9 | ± 7.0 | ± 1.0 | ± 3.5 | |
| 2017/18 | 7.0 | 23.7 | 0.4 | 244 | 9.1 | 6.1 | 3.2 | 25.1 | 34.4 | 4.4 | 7.6 |
| ± 1.7 | ± 6.3 | ± 0.1 | ± 98 | ± 2.6 | ± 1.6 | ± 0.9 | ± 7.0 | ± 8.4 | ± 1.2 | ± 4.1 | |
| 2018/19 | 7.1 | 23.9 | 0.4 | 246 | 9.2 | 6.1 | 3.2 | 25.2 | 34.6 | 4.5 | 7.7 |
| ± 1.7 | ± 6.3 | ± 0.1 | ± 98 | ± 2.6 | ± 1.6 | ± 0.9 | ± 7.1 | ± 8.5 | ± 1.2 | ± 4.2 |
Remark; the result shows the range of emissions which calculated by using the propagation of errors method. Providing is the function which shown the relation of factor variables (BA, FL, CC, and EF). Calculations of the uncertainty of emissions estimation used the following equation.
Table A4.
Air pollutant emissions projection associated with preharvesting sugarcane burning.
Table A4.
Air pollutant emissions projection associated with preharvesting sugarcane burning.
| Measure | Production Season | CO2 | CH4 | N2O | CO | NOX | NH3 | SO2 | PM2.5 | PM10 | BC | OC |
|---|---|---|---|---|---|---|---|---|---|---|---|---|
| (Mt) | (kt) | (kt) | (kt) | (kt) | (kt) | (kt) | (kt) | (kt) | (kt) | (kt) | ||
| BAU | 2019/20 | 6.2 | 20.8 | 0.4 | 214 | 8.0 | 5.3 | 2.8 | 22.0 | 30.2 | 3.9 | 6.7 |
| ± 1.5 | ± 5.5 | 0.1 | ± 86 | ± 2.2 | ± 1.4 | ± 0.7 | ± 6.2 | ± 7.4 | ± 1.0 | ± 3.6 | ||
| 2020/21 | 7.9 | 26.7 | 0.5 | 275 | 10.3 | 6.9 | 3.6 | 28.2 | 38.7 | 5.0 | 8.6 | |
| ± 1.9 | ± 7.0 | 0.1 | ± 110 | ± 2.9 | ± 1.8 | ± 1.0 | ± 7.9 | ± 9.5 | ± 1.3 | ± 4.6 | ||
| 2021/22 | 8.2 | 27.9 | 0.5 | 286 | 10.7 | 7.1 | 3.8 | 29.4 | 40.3 | 5.2 | 8.9 | |
| ± 2.0 | ± 7.3 | 0.1 | ± 115 | ± 3.0 | ± 1.9 | ± 1.0 | ± 8.2 | ± 9.9 | ± 1.4 | ± 4.8 | ||
| 2022/23 | 8.6 | 29.0 | 0.5 | 298 | 11.1 | 7.4 | 3.9 | 30.6 | 42.0 | 5.4 | 9.3 | |
| ± 2.0 | ± 7.6 | ± 0.1 | ± 119 | ± 3.1 | ± 2.0 | ± 1.0 | ± 8.6 | ± 10.3 | ± 1.4 | ± 5.0 | ||
| SC 1 | 2019/20 | 2.9 | 9.7 | 0.2 | 100 | 3.7 | 2.5 | 1.3 | 10.3 | 14.1 | 1.8 | 3.1 |
| ± 1.1 | ± 4.0 | ± 0.1 | ± 63 | ± 1.6 | ± 1.0 | ± 0.5 | ± 4.5 | ± 5.4 | ± 0.8 | ± 2.7 | ||
| 2020/21 | 2.5 | 8.3 | 0.1 | 86 | 3.2 | 2.1 | 1.1 | 8.8 | 12.1 | 1.6 | 2.7 | |
| ± 1.0 | ± 3.7 | ± 0.1 | ± 58 | ± 1.5 | ± 0.9 | ± 0.5 | ± 4.1 | ± 5.0 | ± 0.7 | ± 2.4 | ||
| 2021/22 | 0.6 | 2.2 | 0.0 | 22 | 0.8 | 0.6 | 0.3 | 2.3 | 3.1 | 0.4 | 0.7 | |
| ± 0.6 | ± 2.2 | ± 0.0 | ± 22 | ± 0.8 | ± 0.6 | ± 0.3 | ± 2.3 | ± 3.0 | ± 0.4 | ± 0.7 | ||
| 2022/23 | 0.0 | 0.0 | 0.0 | 0 | 0.0 | 0.0 | 0.0 | 0.0 | 0.0 | 0.0 | 0.0 | |
| − | − | − | − | − | − | − | − | − | − | − | ||
| SC 2 | 2019/20 | 4.5 | 15.3 | 0.3 | 157 | 5.9 | 3.9 | 2.1 | 16.1 | 22.1 | 2.9 | 4.9 |
| ± 1.1 | ± 4.0 | ± 0.1 | ± 63 | ± 1.6 | ± 1.0 | ± 0.5 | ± 4.5 | ± 5.4 | ± 0.8 | ± 2.7 | ||
| 2020/21 | 4.1 | 14.0 | 0.3 | 144 | 5.4 | 3.6 | 1.9 | 14.8 | 20.2 | 2.6 | 4.5 | |
| ± 1.0 | ± 3.7 | ± 0.1 | ± 58 | ± 1.5 | ± 0.9 | ± 0.5 | ± 4.1 | ± 5.0 | ± 0.7 | ± 2.4 | ||
| 2021/22 | 2.5 | 8.4 | 0.2 | 86 | 3.2 | 2.1 | 1.1 | 8.8 | 12.1 | 1.6 | 2.7 | |
| ± 0.6 | ± 2.2 | ± 0.0 | ± 34 | ± 0.9 | ± 0.6 | ± 0.3 | ± 2.5 | ± 3.0 | ± 0.4 | ± 1.5 | ||
| 2022/23 | 1.3 | 4.3 | 0.1 | 45 | 1.7 | 1.1 | 0.6 | 4.6 | 6.3 | 0.8 | 1.4 | |
| ± 0.3 | ± 1.1 | ± 0.0 | ± 18 | ± 0.5 | ± 0.3 | ± 0.2 | ± 1.3 | ± 1.5 | ± 0.2 | ± 0.8 |

Figure A1.
Sugarcane cultivation area from the Land Development Department (LDD) and the location of ambient air quality monitoring stations.
Figure A1.
Sugarcane cultivation area from the Land Development Department (LDD) and the location of ambient air quality monitoring stations.


Figure A2.
Data of PM2.5 concentration measured at the monitoring stations 26T, 46T, and 79T during Jan 2017−May 2019; (a) the monthly average of PM2.5 concentration and (b) the number of days in each month with PM2.5 exceeding 24-h mean concentration guideline levels.
Figure A2.
Data of PM2.5 concentration measured at the monitoring stations 26T, 46T, and 79T during Jan 2017−May 2019; (a) the monthly average of PM2.5 concentration and (b) the number of days in each month with PM2.5 exceeding 24-h mean concentration guideline levels.


Figure A3.
Burned sugarcane quantity and the percentage of burned sugarcane per total sugarcane purchased by sugar factories. Column charts display the burned sugarcane and line charts display the percent of burned sugarcane.
Figure A3.
Burned sugarcane quantity and the percentage of burned sugarcane per total sugarcane purchased by sugar factories. Column charts display the burned sugarcane and line charts display the percent of burned sugarcane.


Figure A4.
Trend of average yield of cane stalk by regions during the production seasons 2007/08−2018/19.
Figure A4.
Trend of average yield of cane stalk by regions during the production seasons 2007/08−2018/19.

References
- Food and Agriculture Organization (FAO). FAOSTAT Agricultural Database—Crops; Food and Agriculture Organization (FAO): Rome, Italy, 2020; Available online: http://faostat.fao.org/static/syb/syb_216.pdf (accessed on 5 January 2020).
- Office of Cane and Sugar Board (OCSB). Report of the Comparison of Sugarcane and Sugar Production Efficiency of Sugar Factories in Thailand in the Production Year 2018/19; Office of Cane and Sugar Board (OCSB): Bangkok, Thailand, 2020; Available online: http://www.sugarzone.in.th/ccs/cp6061/cp_index60.asp (accessed on 4 January 2020).
- Office of Cane and Sugar Board (OCSB). Announcement of Office of Cane and Sugar Board—Rules and Procedures Regarding Money Deducted from Burned Sugarcane, Long Tops Sugarcane and Sugarcane with Leaves; Office of Cane and Sugar Board (OCSB): Bangkok, Thailand, 2020; Available online: http://www.ocsb.go.th/upload/law/fileupload/8408-8586.pdf (accessed on 4 January 2020).
- Pollution Control Department (PCD). Thailand’s Air Quality and Situation Reports; Pollution Control Department (PCD): Bangkok, Thailand, 2019; Available online: http://air4thai.pcd.go.th/ (accessed on 1 December 2019).
- Office of Agricultural Economics (OAE). Agricultural Statistics of Thailand 2018; Office of Agricultural Economics (OAE): Bangkok, Thailand, 2018; Available online: http://www.oae.go.th/assets/portals/1/ebookcategory/27_yearbook2561/#page=1 (accessed on 4 December 2019).
- World Health Organization (WHO). WHO Air Quality Guidelines for Particulate Matter, Ozone, Nitrogen Dioxide and Sulfur Dioxide; World Health Organization (WHO): Geneva, Switzerland, 2005; Available online: https://apps.who.int/iris/bitstream/handle/10665/69477/WHO_SDE_PHE_OEH_06.02_eng.pdf;jsessionid=E4460199523C2AC8C73E07B20B8919BE?sequence=1 (accessed on 15 December 2019).
- Aman, N.; Manomaiphiboon, K.; Pengchai, P.; Suwanathada, P.; Srichawana, J.; Assareh, N. Long-Term Observed Visibility in Eastern Thailand: Temporal Variation, Association with Air Pollutants and Meteorological Factors, and Trends. Atmosphere 2019, 10, 122. [Google Scholar] [CrossRef]
- Wang, J.; Ogawa, S. Effects of Meteorological Conditions on PM2.5 Concentrations in Nagasaki, Japan. Int. J. Environ. Res. Public Health 2015, 12, 9089–9101. [Google Scholar] [CrossRef] [PubMed]
- Bureau of Occupational and Environmental Diseases (BOED). Study on the Relationship between Particulate Matter Smaller than 10 Microns (PM10) and Patients with Chronic Respiratory Diseases (ICD-10 Code J40-J47) in 8 Northern Provinces of Thailand; Ministry of Public Health: Nonthaburi, Thailand, 2015; Available online: http://envocc.ddc.moph.go.th/contents/view/451 (accessed on 5 January 2020).
- José, C.; Paulo, S.; Luiz, P.; Luciene, L.; Paulo, A.; Luiz, A.M.; Marcos, A.A.; Antonella, Z.; Alfesio, B. The Impact of Sugar Cane–Burning Emissions on the Respiratory System of Children and the Elderly. Environ. Health Perspect. 2006, 114, 725–729. [Google Scholar]
- Silveira, H.; Marina, S.C.; Ervald, H.S.; Cristovam, S.N.; Adhemar, L.F.; Andre, L.C.; Rui, R.; Paulo, S. Emissions generated by sugarcane burning promote genotoxicity in rural workers: A case study in Barretos, Brazil. Environ. Health 2013, 12, 87. [Google Scholar] [CrossRef]
- Nicolella, A.C.; Belluzzo, W. The effect of reducing the pre-harvest burning of sugar cane on respiratory health in Brazil. Environ. Dev. Econ. 2014, 20, 127–140. [Google Scholar] [CrossRef]
- Food and Agriculture Organization (FAO). FAOSTAT Agricultural Database—Burning—Crop Residues; Food and Agriculture Organization (FAO): Rome, Italy, 2020; Available online: http://www.fao.org/faostat/en/#data/GB (accessed on 5 January 2020).
- Daniela, F.; Karla, L.; Bernardo, R.; Daniel, A.; Saulo, F.; Rafael, S.; Gabriel, P. Pre-harvest sugarcane burning emission inventories based on remote sensing data in the state of Sao Paulo, Brazil. Atmos. Environ. 2014, 99, 456–466. [Google Scholar]
- Sornpoon, W.; Bonnet, S.; Kasemsap, P.; Prasertsak, P.; Garivait, S. Estimation of Emissions from Sugarcane Field Burning in Thailand Using Bottom-Up Country-Specific Activity Data. Atmosphere 2014, 5, 669–685. [Google Scholar] [CrossRef]
- Kim Oanha, N.T.; Permadia, D.A.; Philip, K.H.; Kirk, R.S.; Donga, P.H.; Danga, A.N. Annual emissions of air toxics emitted from crop residue open burning in Southeast Asia over the period of 2010–2015. Atmos. Environ. 2018, 187, 163–173. [Google Scholar] [CrossRef]
- Secretariat of the Cabinet (SOC). Measure to Reduce Burned Sugarcane; Secretariat of the Cabinet (SOC): Bangkok, Thailand, 2020; Available online: https://cabinet.soc.go.th/soc/Program2-3.jsp?top_serl=99332688 (accessed on 4 January 2020).
- Seiler, W.; Crutzen, P.J. Estimates of gross and net fluxes of carbon between the biosphere and the atmosphere from biomass burning. Clim. Chang. 1980, 2, 207–247. [Google Scholar] [CrossRef]
- Office of Cane and Sugar Board (OCSB). Report of the Comparison of Sugarcane and Sugar Production Efficiency of Sugar Factories in Thailand during the Production Year 2008/09−2018/19; Office of Cane and Sugar Board (OCSB): Bangkok, Thailand, 2020; Available online: http://www.sugarzone.in.th (accessed on 4 January 2020).
- Geo-Informatics and Space Technology Development Agency (GISTDA). Thailand Drought Monitoring System; Geo-Informatics and Space Technology Development Agency (GISTDA): Bangkok, Thailand, 2020; Available online: http://drought.gistda.or.th/ (accessed on 10 January 2020).
- Department of Alternative Energy Development and Energy Conservation (DEDE). Alternative Energy Development Plan (AEDP2015); Department of Alternative Energy Development and Energy Conservation (DEDE): Bangkok, Thailand, 2015; Available online: https://www.dede.go.th/download/files/AEDP2015_Final_version.pdf (accessed on 5 January 2020).
- Office of Cane and Sugar Board (OCSB). Thailand Ethanol Situation in 2018; Office of Cane and Sugar Board (OCSB): Bangkok, Thailand, 2018; Available online: http://www.ocsb.go.th/upload/bioindustry/fileupload/10208-8459.pdf (accessed on 5 January 2020).
- Office of Agricultural Economics (OAE). Agricultural Statistics of Thailand during 2008−2019; Office of Agricultural Economics (OAE): Bangkok, Thailand, 2020; Available online: http://www.oae.go.th (accessed on 4 January 2020).
- Zhang, Y.; Shao, M.; Lin, Y.; Luan, S.; Mao, N.; Chen, W.; Wang, M. Emission inventory of carbonaceous pollutants from biomass burning in the Pearl River Delta Region, China. Atmos. Environ. 2013, 76, 189–199. [Google Scholar] [CrossRef]
- Daniela, F.; Karla, L.; Turibio, N.; José, S.; Saulo, R.F.; Bernardo, R.; Ely, C.; Edson, A.; João, C. Pre-Harvest Sugarcane Burning: Determination of Emission Factors through Laboratory Measurements. Atmosphere 2012, 3, 164–180. [Google Scholar]
- Zhou, Y.; Xing, X.; Lang, J.; Chen, D.; Cheng, S.; Wei, L.; Wei, X.; Liu, C. A comprehensive biomass burning emission inventory with high spatial and temporal resolution in China. Atmos. Chem. Phys. 2017, 17, 2839–2864. [Google Scholar] [CrossRef]
- Key, C.; Benson, N. Landscape assessment: Remote sensing of severity, the Normalized Burn Ratio and ground measure of severity, the Composite Burn Index. In FIREMON: Fire Effects Monitoring and Inventory System; Lutes, D., Keane, R., Caratti, J., Key, C., Benson, N., Sutherland, S., Gangi, L., Eds.; USDA Forest Service, Rocky Mountain Research Station: Ogden, UT, USA, 2006; pp. LA 1–LA 51. [Google Scholar]
- Land Development Department (LDD). Geographic Information System Soil and Land Use of Thailand; Land Development Department (LDD): Bangkok, Thailand, 2014; Available online: http://www.go.th/gisweb/ (accessed on 10 November 2019).
- Giglio, L.; Loboda, T.; Roy, D.P.; Quayle, B.; Justice, C.O. An active-fire based burned area mapping algorithm for the MODIS sensor. Remote Sens. Environ. 2009, 113, 408–420. [Google Scholar] [CrossRef]
- Giglio, L.; Boschetti, L.; Roy, D.P.; Hoffmann, A.A.; Humber, M.L.; Justice, C.O. The Collection 6 MODIS burned area mapping algorithm and product. Remote Sens. Environ. 2018, 217, 72–85. [Google Scholar] [CrossRef] [PubMed]
- Geo-Informatics and Space Technology Development Agency (GISTDA). Thailand Flood Monitoring System; Geo-Informatics and Space Technology Development Agency (GISTDA): Bangkok, Thailand, 2020; Available online: http://flood.gistda.or.th/ (accessed on 10 January 2020).
- van der Werf, G.R.; Randerson, J.T.; Giglio, L.; Collatz, G.J.; Mu, M.; Kasibhatla, P.S.; Morton, D.C.; DeFries, R.S.; Jin, Y.; van Leeuwen, T.T. Global fire emissions and the contribution of deforestation, savanna, forest, agricultural, and peat fires (1997−2009). Atmos. Chem. Phys. 2010, 10, 11707–11735. [Google Scholar] [CrossRef]
- Kaiser, J.W.; Heil, A.; Andreae, M.O.; Benedetti, A.; Chubarova, N.; Jones, L.; Morcrette, J.J.; Razinger, M.; Schultz, M.G.; Suttie, M.; et al. Biomass burning emissions estimated with a global fire assimilation system based on observed fire radiative power. Biogeosciences 2012, 9, 527–554. [Google Scholar] [CrossRef]
- Wiedinmyer, C.; Akagi, S.K.; Yokelson, R.J.; Emmons, L.K.; Al-Saadi, J.A.; Orlando, J.J.; Soja, A.J. The Fire INventory from NCAR (FINN): A high resolution global model to estimate the emissions from open burning. Geosci. Model. Dev. 2011, 4, 625–641. [Google Scholar] [CrossRef]
- Mieville, A.; Granier, C.; Liousse, C.; Guillaume, B.; Mouillot, F.; Lamarque, J.F.; Gregoire, J.M.; Petron, G. Emissions of gases and particles from biomass burning during the 20th century using satellite data and an historical reconstruction. Atmos. Environ. 2010, 44, 1469–1477. [Google Scholar] [CrossRef]
- Office of Cane and Sugar Board (OCSB). Cost Production and Knowledge Transfer to Reduce Sugarcane Production Costs in Production Season 2014/2015; Office of Cane and Sugar Board (OCSB): Bangkok, Thailand, 2015; Available online: http://www.ocsb.go.th/upload/learning/fileupload/5336-6947.pdf (accessed on 10 January 2020).
- Department of Alternative Energy Development and Efficiency (DEDE). Using of Rice Straw, Sugarcane Tops and Leaves, and Maize Leaves to Produce Renewable Energy; Department of Alternative Energy Development and Efficiency (DEDE): Bangkok, Thailand, 2016; Available online: http://e-lib.dede.go.th (accessed on 10 January 2020).
- IPCC. 2006 IPCC Guidelines for National Greenhouse Gas Inventories; National Greenhouse Gas Inventories Programme; Eggleston, H.S., Buendia, L., Miwa, K., Ngara, T., Tanabe, K., Eds.; IGES: Kanagawa, Japan, 2006. [Google Scholar]
- Han, L.J.; Yan, Q.J.; Liu, X.Y.; Hu, J.Y. Straw Resources and Their Utilization in China. Trans. CSAE 2002, 18, 87–91. [Google Scholar]
- Zhang, X.; Lu, Y.; Wang, Q.; Qian, X. A high-resolution inventory of air pollutant emissions from crop residue burning in China. Atmos. Chem. Phys. 2019, 213, 207–214. [Google Scholar] [CrossRef]
- Liu, G.; Shen, L. Quantitive appraisal of biomass energy and its geographical distribution in China. J. Nat. Resour. 2007, 22, 10–19. [Google Scholar]
- Kanabkaew, T.; Kim Oanh, N.T. Development of Spatial and Temporal Emission Inventory for Crop Residue Field Burning. Environ. Model. Assess. 2011, 16, 453–464. [Google Scholar] [CrossRef]
- Yokelson, R.J.; Christian, T.J.; Karl, T.G.; Guenther, A. The tropical forest and fire emissions experiment: Laboratory fire measurements and synthesis of campaign data. Atmos. Chem. Phys. 2008, 8, 3509–3527. [Google Scholar] [CrossRef]
- Dennis, A.; Fraser, M.; Anderson, S.; Allen, D. Air pollutant emissions associated with forest, grassland, and agricultural burning in Texas. Atmos. Environ. 2002, 36, 3779–3792. [Google Scholar] [CrossRef]
- Environmental Protection Department. Guide for Compiling Atmospheric Pollutant Emission Inventory for Biomass Burning; Environmental Protection Department: Hong Kong, China, 2014. [Google Scholar]
- Li, X.H.; Wang, S.X.; Duan, L.; Hao, J.; Li, C.; Chen, Y.S.; Yang, L. Particulate and trace gas emissions from open burning of wheat straw and corn stover in China. Environ. Sci. Technol. 2007, 41, 6052–6058. [Google Scholar] [CrossRef]


© 2020 by the authors. Licensee MDPI, Basel, Switzerland. This article is an open access article distributed under the terms and conditions of the Creative Commons Attribution (CC BY) license (http://creativecommons.org/licenses/by/4.0/).