Article

Oxidative Potential Sensitivity to Metals, Br, P, S, and Se in PM10 Samples: New Insights from a Monitoring Campaign in Southeastern Italy

1
Department of Mathematics and Physics, University of Salento, 73100 Lecce, Italy
2
Department of Chemistry, University of Florence, 50019 Sesto Fiorentino, Florence, Italy
3
Department of Physics, University of Florence, 50019 Sesto Fiorentino, Florence, Italy
4
Department of Chemical and Pharmaceutical Sciences, University of Ferrara, 44121 Ferrara, Italy
*
Author to whom correspondence should be addressed.
Atmosphere 2020, 11(4), 367; https://doi.org/10.3390/atmos11040367
Submission received: 15 March 2020 / Revised: 5 April 2020 / Accepted: 7 April 2020 / Published: 9 April 2020
(This article belongs to the Special Issue Recent Advances of Air Pollution Studies in Italy)

Abstract

:
Different analytical techniques were used in this work to investigate the relationships between oxidative potential (OP) and metal, Br, P, S, and Se concentration in PM10 samples. Dithiothreitol and ascorbic acid acellular assays were used to determine the oxidative potential (OP) in PM10 samples. The particle-induced X-ray emission technique was used to estimate the mass concentration of specific chemical elements. PM10 samples were collected in Lecce, a coastal site of the Central Mediterranean away from large sources of local pollution. Both winter and spring samples were analyzed to study the seasonal dependence of the relationships between OP values and chemical element concentrations. The Redundancy Discriminant Analysis (RDA) was applied to (volume- and mass-normalized) OP values as response variables and metal, Br, P, S, and Se concentrations as explanatory variables. RDA triplots allowed to visualize the main relationships between PM10 OP values and corresponding chemical element concentrations. Spearman correlation coefficients were also used to investigate the relationships between OP values and metal, Br, P, S, and Se concentrations, besides comparing RDA outcomes. The integrated approach based on two different techniques allowed to better highlight the potentially harmful effects associated with specific metals and other chemical elements in PM10 samples.

1. Introduction

Particulate matter (PM) is a complex mixture of particles with different characteristics (e.g., mass, size, shape, surface area, solubility, acidity, and number) and different chemical components. Metals come from impurities derived from fuel additives and/or brakes and tires attrition, and they can be generally found adhered to PM particles [1,2]. Iron (Fe), nickel (Ni), vanadium (V), chromium (Cr), and copper (Cu) are the most studied and analyzed transition metals due to their potential to produce reactive oxygen species (ROS) in biological systems [3]. Fe, Cu, Ni, and V in fine PM have been found to be associated with cardiovascular and respiratory hospital admissions and mortality [4,5], as well as increased heart rate and decreased lung function [6]. Heavy metals such as cadmium (Cd), lead (Pb), and mercury (Hg) are generally produced by industrial, combustion, extraction, and processing activities. They are also able to exert their toxic effects by the production of ROS [1]. These toxic effects are generally quantified by oxidative potential (OP), which is a measure of the capacity of PM to deplete certain antioxidant molecules such as ascorbic acid (AA) or dithiothreitol (DTT) in synthetic airway fluid and to generate ROS ([7,8] and references therein). OP has been proposed as a more relevant exposure metric that is closely related to biological responses to PM exposure compared to PM mass concentration [9,10]. In fact, oxidative stress is considered to be the main link between PM exposure and associated diseases [11,12,13]. PM OP was found to contribute to oxidative stress and inflammation in cultured human lung carcinoma cells [14]. Significant variations in PM OP levels were reported in the Netherlands and Belgium [15,16], London (UK) [17], Hungary [18], Chamonix (France) [19,20], and Canada [21,22]. Daher et al. [23] explained that the differences in the OP levels of PM samples are mostly related to transition metal content. In fact, the measurement of OP involves the redox activity of transition metals and organic chemicals, and it reflects interactions between different metals in the reaction [2].
In this study, two common acellular techniques based on low-cost spectrophotometric UV–Vis measurements, dithiothreitol ([24]) and ascorbic acid ([25]) assays were used to determine PM OP responses and study their relationships with metal, Br, P, S, and Se mass concentrations. Several studies have been devoted to the analysis of the relationships between the main features of the PM OP values and specific metals ([23] and references therein). Liu et al. [22] performed an explanatory study in Toronto (Canada) and proved that the metal constituents in ambient PM may have partially contributed to the generation of OP and its adverse effects like systemic inflammation, oxidative stress, the perturbation of neural function, and physiological stress. Nishita-Hara et al. [26] carried out a continuous sampling of both fine and coarse PM particles in spring 2016 in Fukuoka (Japan) to study the effects of the main chemical components of Asian dust on PM OP. In particular, they investigated the contributions of both total and water-soluble metals to the OP determined by the DTT assay activity. They found a significant increase of OP during the analyzed Asian dust events, but the water-soluble transition metals were only responsible for 37% and 60% of the measured OP of the fine and coarse PM fraction, respectively. Saffari et al. [27] performed a year-long sampling campaign of quasi-ultrafine particles (with an aerodynamic diameter of less than 0.25 µm) at 10 distinct sites with different characteristics near Los Angeles (USA). They observed, particularly during winter, a strong correlation between DTT activity and transition metals (Cr, Mn, V, Fe, Cu, Cd, and Zn) generally associated with the vehicular traffic source. Calas et al. [20] reported the main findings related to the seasonal OP variations from both the DTT and AA acellular assays, as well as their correlations with PM chemical composition over a one-year period in seven French urban background sites. They also found that correlation between volume-normalized OP and metal mass concentration was strongly seasonal-, assay-, and location-dependent.
Two previous works defined the main features of PM OP over Southeastern Italy at the same site of this study. First, Pietrogrande et al. [8] investigated the OP measured with both the AA and DTT assays in PM10 samples collected from December 2014 to October 2015 in order to highlight the sensitivity of both acellular methods. The seasonal dependence of the PM10 OP responses was also analyzed in relation to chemical composition and meteorological parameters. Then, Perrone et al. [28] simultaneously evaluated the OP responses of both PM10 and PM2.5 samples. They compared the DTT- and AA-OP responses to associate changes in the OP activity with particle size and the concentration of the redox-active species in PM10 and PM2.5 fractions. Being carried out at the center of the Mediterranean area, the main results of these last works could be considered representative of Mediterranean coastal sites away from large sources of local pollution [29]. With respect to the two previous works related to OP characterization over Southeastern Italy, this study is mainly related to the association of OP response sensitivity with several metal and Br, P, S, and Se mass concentrations by using two different analytical techniques: the Redundancy Discriminant Analysis (RDA) and Spearman correlation coefficients. To the best of our knowledge, this study was the first to apply RDA to relate PM OP responses with specific metal and Br, P, S, and Se mass concentrations. The RDA outcomes were compared with Spearman correlation coefficients to highlight benefits and limits of both used methodologies. The seasonal variations of the relationships between (volume- and mass-normalized) OP and chemical element concentration were also evaluated since the PM10 samples were collected both in winter and in spring.

2. Experiments

2.1. Site Description and Sample Collection

The measurements analyzed in this study were performed at the Aerosol and Climate Laboratory of the Mathematics and Physics Department of the Salento University in Lecce (40.33° N, 18.11° E, 30 m a.s.l.) in Southeastern Italy. The monitoring site is located in a flat peninsular area, about 6 km away from the city center of Lecce, 20 km away from both the Ionian and Adriatic seas, and 100 and 800 km away from the Balkan and North African coasts, respectively. Therefore, the study site could be considered as representative of coastal sites of the Central Mediterranean, away from large sources of local pollution [30,31].
A low volume (2.3 m3 h−1) Hydra dual-sampler (FAI Instruments, Fonte Nuova, Rome, Italy) was used to simultaneously collect 72-h winter and 48-h spring PM10 samples on two different 47-mm-diameter filters. Polytetrafluoroethylene (PTFE) filters (TEFLO W/RING 2 μ from VWR International, Radnor, Pennsylvania, USA) and quartz filters (Tissuquartz from PALLFLEX, Putnam, Connecticut, USA) were used to determine the chemical element mass concentrations and the OP responses, respectively. Both filters are characterized by an excellent aerosol collection efficiency [32]. Ten PM10 samples were collected, approximately once a week, both in winter (from January to March 2018) and in spring (from May to June 2018) to study the seasonal impact on the analyzed parameters. The PM10 mass concentrations of this study (Supplementary Table S1) were in reasonable agreement with previous data [8,33] and, therefore, could be considered as representative of PM10 measurements at the study site.

2.2. Chemical Element Mass Concentrations and Oxidative Potential Acellular Assays

Metal (Al, As, Ba, Ca, Cd, Cr, Cu, Fe, K, Mn, Mo, Ni, Pb, Rb, Si, Sr, Ti, V, Zn, and Zr) and Br, P, S, and Se mass concentrations in each PM10 sample (Supplementary Table S1) were determined by the particle-induced X-ray emission (PIXE) technique at the INFN (Istituto Nazionale di Fisica Nucleare) LABEC (LAboratorio di tecniche nucleari applicate ai BEni Culturali) laboratory in Florence, Italy [34,35]. Each sample was irradiated with a 3.0 MeV proton beam (10–150 nA intensity) for 90 s. The beam was collimated to ~2 mm2, and filter scanning was carried out to analyze most of the deposit area. Elemental concentrations were obtained by a calibration curve from a set of thin standards. Measurement accuracy was tested by the use of a NIST RM 8785 (National Institute of Standards and Technology, USA) standard. The minimum detection limits (MDLs) were of the order of few ng m−3 for the low Z elements, down to a minimum value of 0.2 ng m−3 for Cu–Zn. The total uncertainties on elemental concentrations were determined by the sum of independent uncertainties on sample thickness (5%), deposition area (2%), air flow (2%), and X-ray counting statistics (2%–20%). The uncertainties increased when concentrations approached minimum detectable limits (MDLs). More details about the used methodology can be found in [34,35].
The oxidative potential responses of the collected PM10 samples were determined by the DTT and AA acellular assays (Supplementary Table S1). Both the assays were performed on 3 mL of the aqueous extract of a quarter of the sampled filters (extracted for 15 min in an ultrasonic bath using 10 mL of a 0.1 M buffer at pH 7.4). The extract was filtered on a regenerate cellulose syringe filter (13 mm and 0.22 µm, Kinesis) to remove the suspended solid particles, and then it was introduced into an amber vial at a constant temperature of 37 °C using a dry bath. The OP response was evaluated as the antioxidant depletion rate of a known quantity of DTT and AA, according to the experimental procedure described in [8]. In more detail, both DTT and AA depletion rates were determined by linear fitting the reagent concentration as a function of time using five experimental points (at 5, 10, 15, 25, and 40 min). A good linearity was, on average, found with correlation coefficient R2 ≥ 0.98 [36]. Both DTT and AA depletion rates were also determined for blank quartz filters (Table S1) and subtracted from the response of each real PM10 sample in order to estimate the detection limits of the two used methods. The obtained OP values were then normalized to the total volume of sampled air, i.e., volume-normalized OPV (expressed in nmol min−1 m−3), and to the PM10-sampled mass, i.e., mass-normalized OPm (expressed in nmol min−1 μg−1), as reported in Table S1. In particular, the volume-normalized OPV provides a measure of the atmospheric concentration of PM OP response, while the mass-normalized OPm represents a measure of the intrinsic OP of the overall PM10 contribution [8] (i.e., an indication of the PM10 “toxicity” in terms of OP). Therefore, the OPV response is an extensive parameter depending on the PM10 mass concentration, as proven by [8,28], while the intrinsic OPm can also provide insight on contributions of specific sources to the overall PM oxidative potential.

2.3. Data Analysis

The Redundancy Discriminant Analysis represents a widespread chemometric procedure to compare different types of data as chemical species or meteorological parameters [37,38]. The RDA could be considered as the multivariate extension of a simple linear regression applied to some sets of variables [39]. More specifically, the application of RDA needs the combination of two datasets: “species data” as response (or dependent) variables and “environmental variables” as explanatory (or predictive) variables [40]. In this work, the RDA technique was used to investigate the relationships between oxidative potential as “species data” and metal, Br, P, S, and Se mass concentrations as “environmental variables.” The RDA analysis was applied to the selected datasets using the Fathom Toolbox for MATLAB [41]. In particular, the selected datasets were first standardized and then used as input (samples as rows and variables as columns) of the function f_rda included in the Fathom Toolbox estimating all the statistical parameters needed for the RDA triplot. As described by [38], Monte Carlo tests were also used by setting 499 unrestricted permutations as input for the f_rda function. Then, the structure of outputs from f_rda function, the datasets of the transformed response variables, the weighted average scores, and a selected scaling factor (optimized to better visualize data) represented the inputs of the f_rdaPlot function. This latter was used to plot two RDA outputs on the same graphical framework: the sample and the OP datasets represented the response variables in the first and in the second plot, respectively, while the chemical dataset represented the predictive variables in both plots. This overlap of two plots representing three variables (in this work, sample dataset as points, OP and chemical species dataset as arrows) is generally called an RDA triplot.
The regression analyses performed on the parameters used in this study were based on the non-parametric Spearman correlation coefficients, which are strictly related to rank and not dependent on data distribution. The thresholds of the p-value were 10%, 5%, and 1% for the statistical tests (Supplementary Table S2).

3. Results and Discussion

The main features of the metal, Br, P, S, and Se mass concentrations and DTT and AA volume- and mass-normalized oxidative potential responses (OPV and OPm, respectively) were analyzed in this Section. RDA and Spearman correlation coefficients were the tools used to analyze major relationships between chemical element mass concentrations and oxidative potential responses. The changes of the relations between the winter and spring PM10 samples were also investigated.

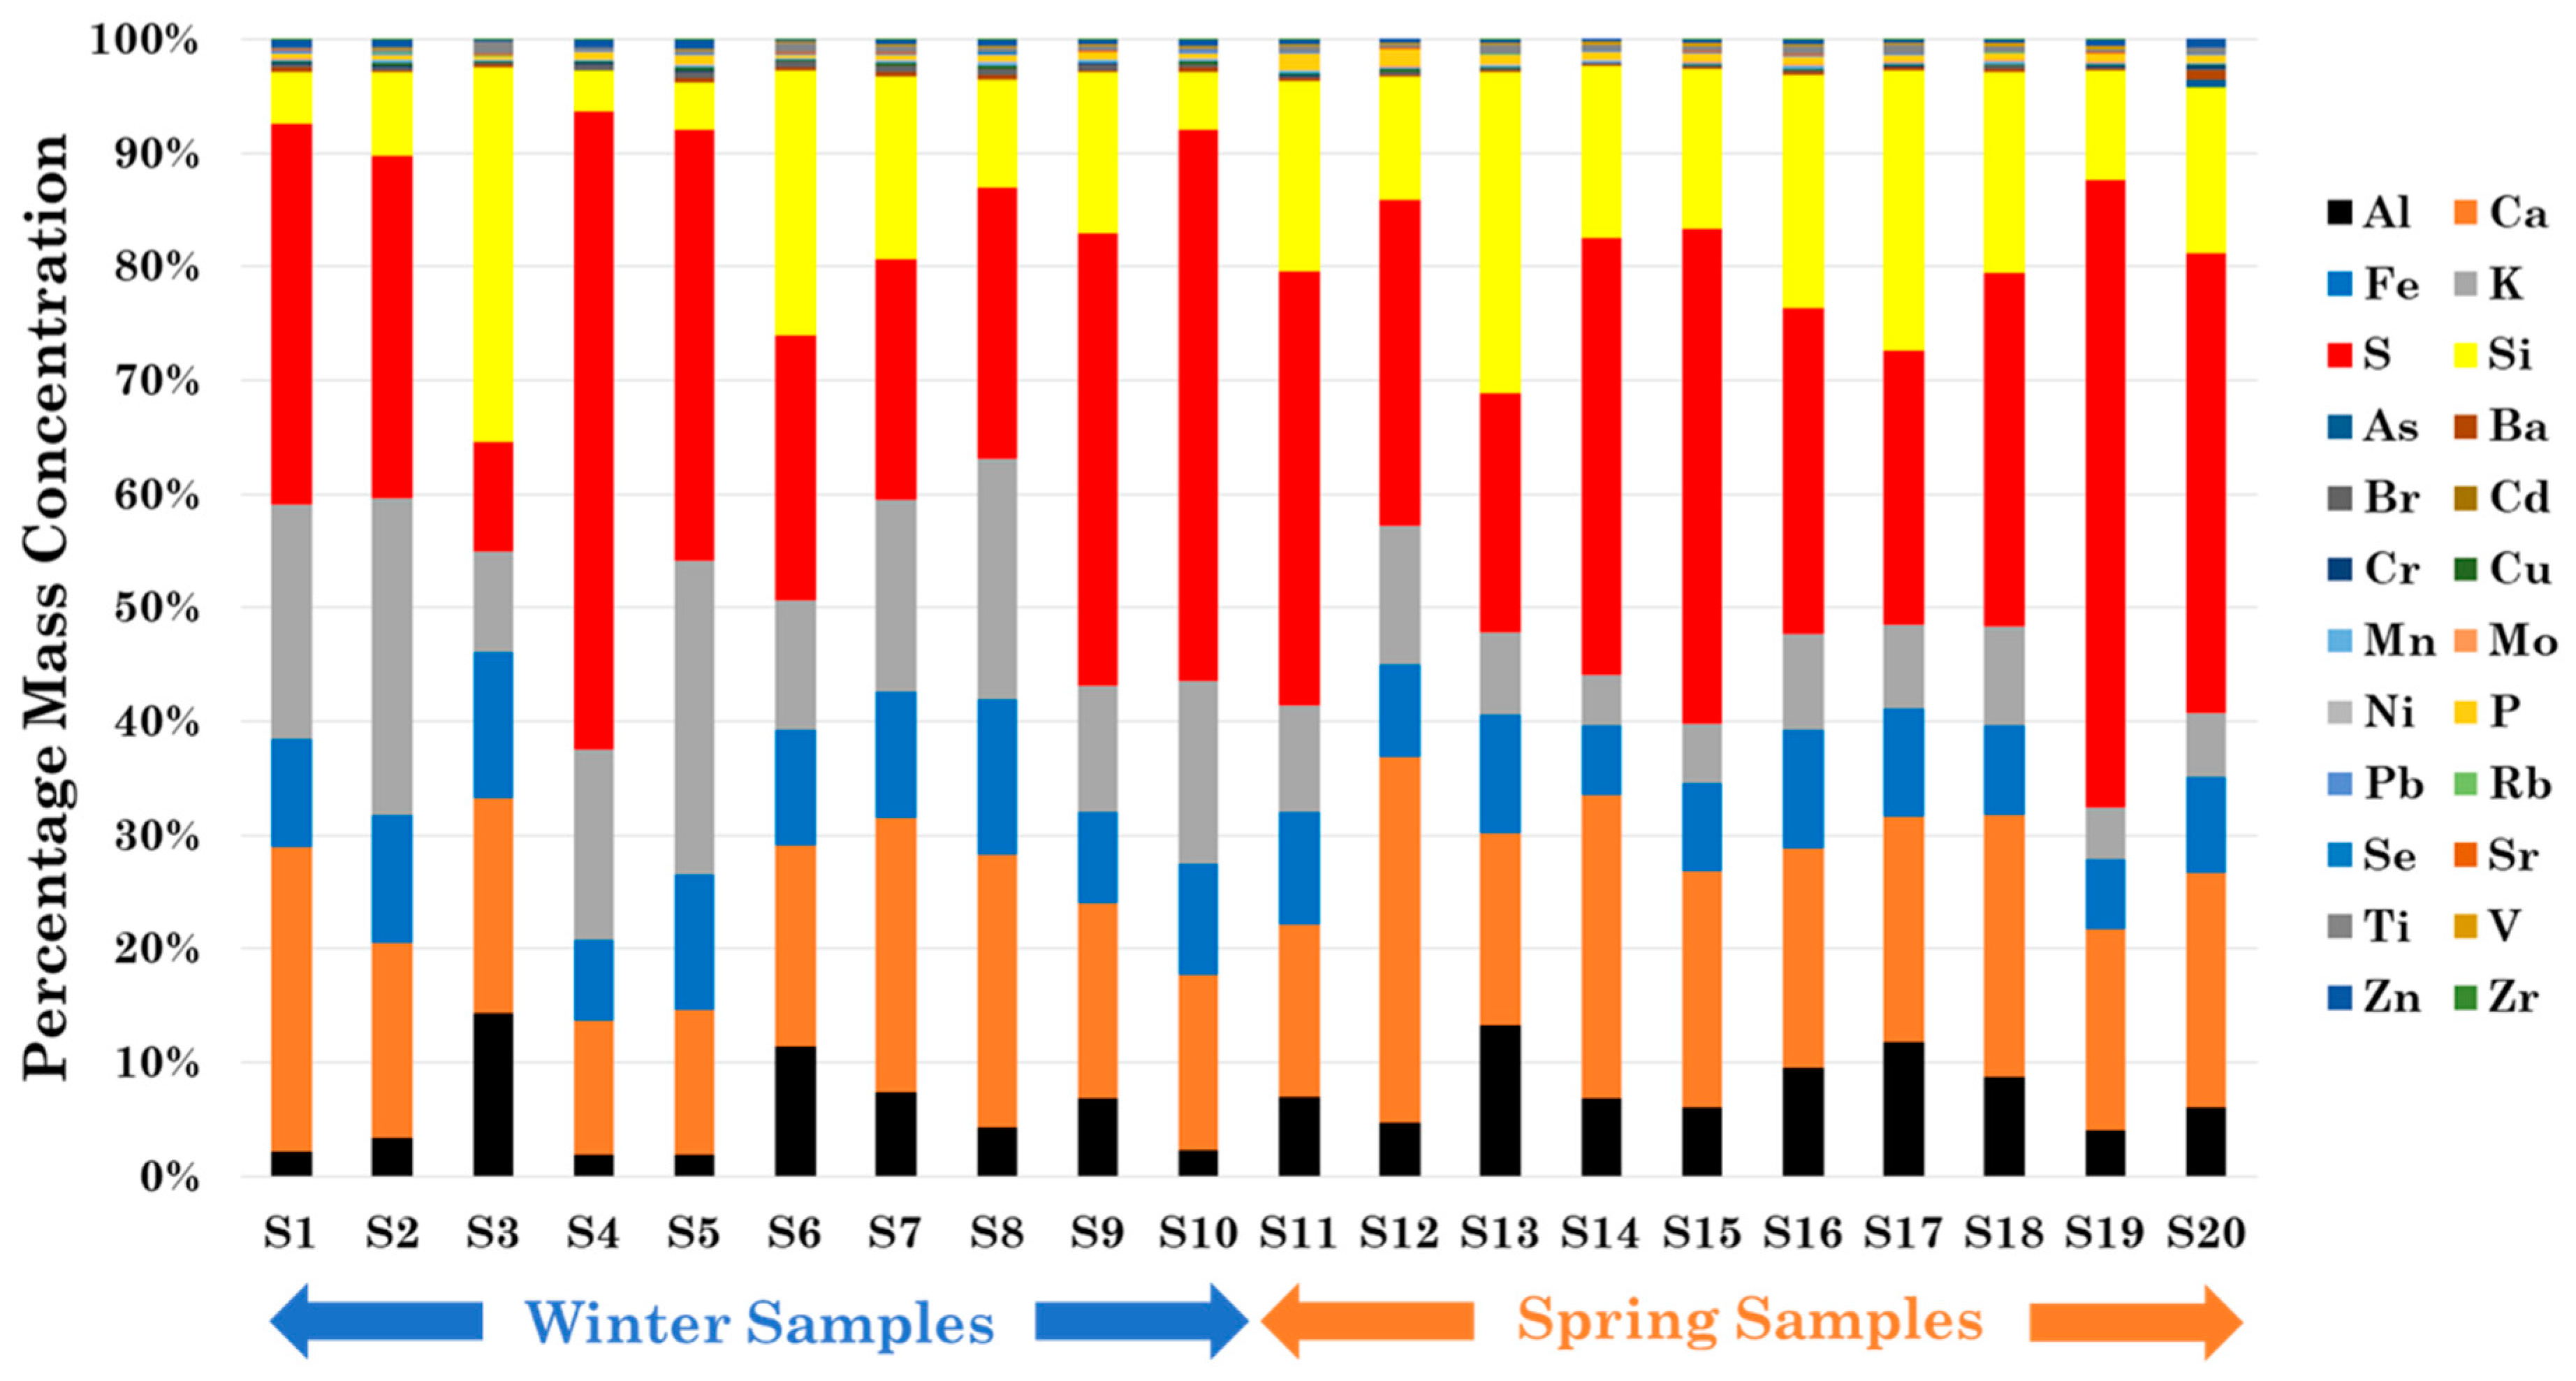
3.1. Metal, Br, P, S, and Se Mass Concentration Characterization

Figure 1 shows the percentage mass concentrations of the analyzed chemical elements in winter and spring PM10 samples. Al, Ca, Fe, K, S, and Si were the most abundant elements in the analyzed samples. All the other chemical components were characterized by a not significant relative abundance of, in total, less than 3%. In particular, among the analyzed chemical elements, S, Ca, and Si showed the highest relative abundance (28%, 19%, and 16%, respectively, in winter and 35%, 21%, and 18%, respectively, in spring). According to [42], the most abundant chemical elements in this study (S, Ca, and Si) can be associated with the “Agriculture Soil” and the “Natural Soil” sources characterized by respective abundancies larger than 1% in both sources (Table 1). Anthropogenic contributions were likely significant, since Al, Ca, Fe, K, S, and Si can also be associated with the “Paved Road Dust,” “Unpaved Road Dust,” and “Construction” sources (Table 1). Road dust typically consists of particles deposited over the street pavement and resuspended into the atmosphere by passing vehicles [43]. Road dust represents one of the main components of anthropogenic coarse-mode PM [44], as also proven at the study site [29]. Al, Ca, Fe, K, S, and Si can also be related to the “Motor Vehicle,” “Coal-Fired Boiler,” and “Oil Fired Power Plant” sources (Table 1), but with a lower percentage contribution, according to [42].
According to [45], the PM10 samples analyzed in this study can be associated with five different clusters, which are listed in Table 1. Main pollution sources contributing to each identified cluster are also given in Table 1, in addition to the main chemical fingerprints of each source [42]. Romano et al. [45] identified the sample clusters listed in Table 1 by mainly using the four-day analytical air mass back-trajectories (Figures SI9–SI23 of their paper). They used the HYbrid Single-Particle Lagrangian Integrated Trajectory (HYSPLIT) model version 4.8 from NOAA/ARL (https://www.ready.noaa.gov/; [46]). They identified a “desert dust” cluster composed of samples S3, S6, and S12 that were mainly characterized by a high concentration of elements associated with the “Natural Soil” source (Table 1). Samples S4, S7, and S8 represented the “marine” cluster (Table 1), characterized by Al, Ca, Fe, K, and Si abundances larger than 1%, as well as a reduced S abundance, according to [42]. Then, the “continental” cluster composed of samples S1, S2, and S10 was also characterized by significant abundances of Al, Ca, Fe, K, S, and Si, all generally associated with anthropogenic-related pollution sources. The “late spring” cluster was mainly composed of chemical components typically associated with the “Natural Soil,” “Agricultural Soil,” and “Vegetative Burning” PM sources (Table 1). A “heavy rain” cluster was also identified by [45] during the analyzed monitoring campaign (Table 1).
Significant seasonal variations of the investigated chemical element mass concentrations can be observed from Figure 1: the winter samples (S1–S10) were clearly characterized by a larger variability with respect to the spring samples (S11–S20). In fact, in winter, low air temperatures associated with cloudy, wet, and stormy days likely contributed to the marked changes of the chemical species’ mass concentrations in the collected samples. In contrast, the meteorological conditions occurring in spring all over the Mediterranean basin favored the air mass aging, enhanced natural and anthropogenic dust resuspension, and limited the removal of atmospheric particles by wet deposition. Therefore, the spring meteorological conditions contributed to a decrease of the PM chemical composition variability. Different previous works related to the PM main features at the study site proved the above-reported comments [28,33,47].

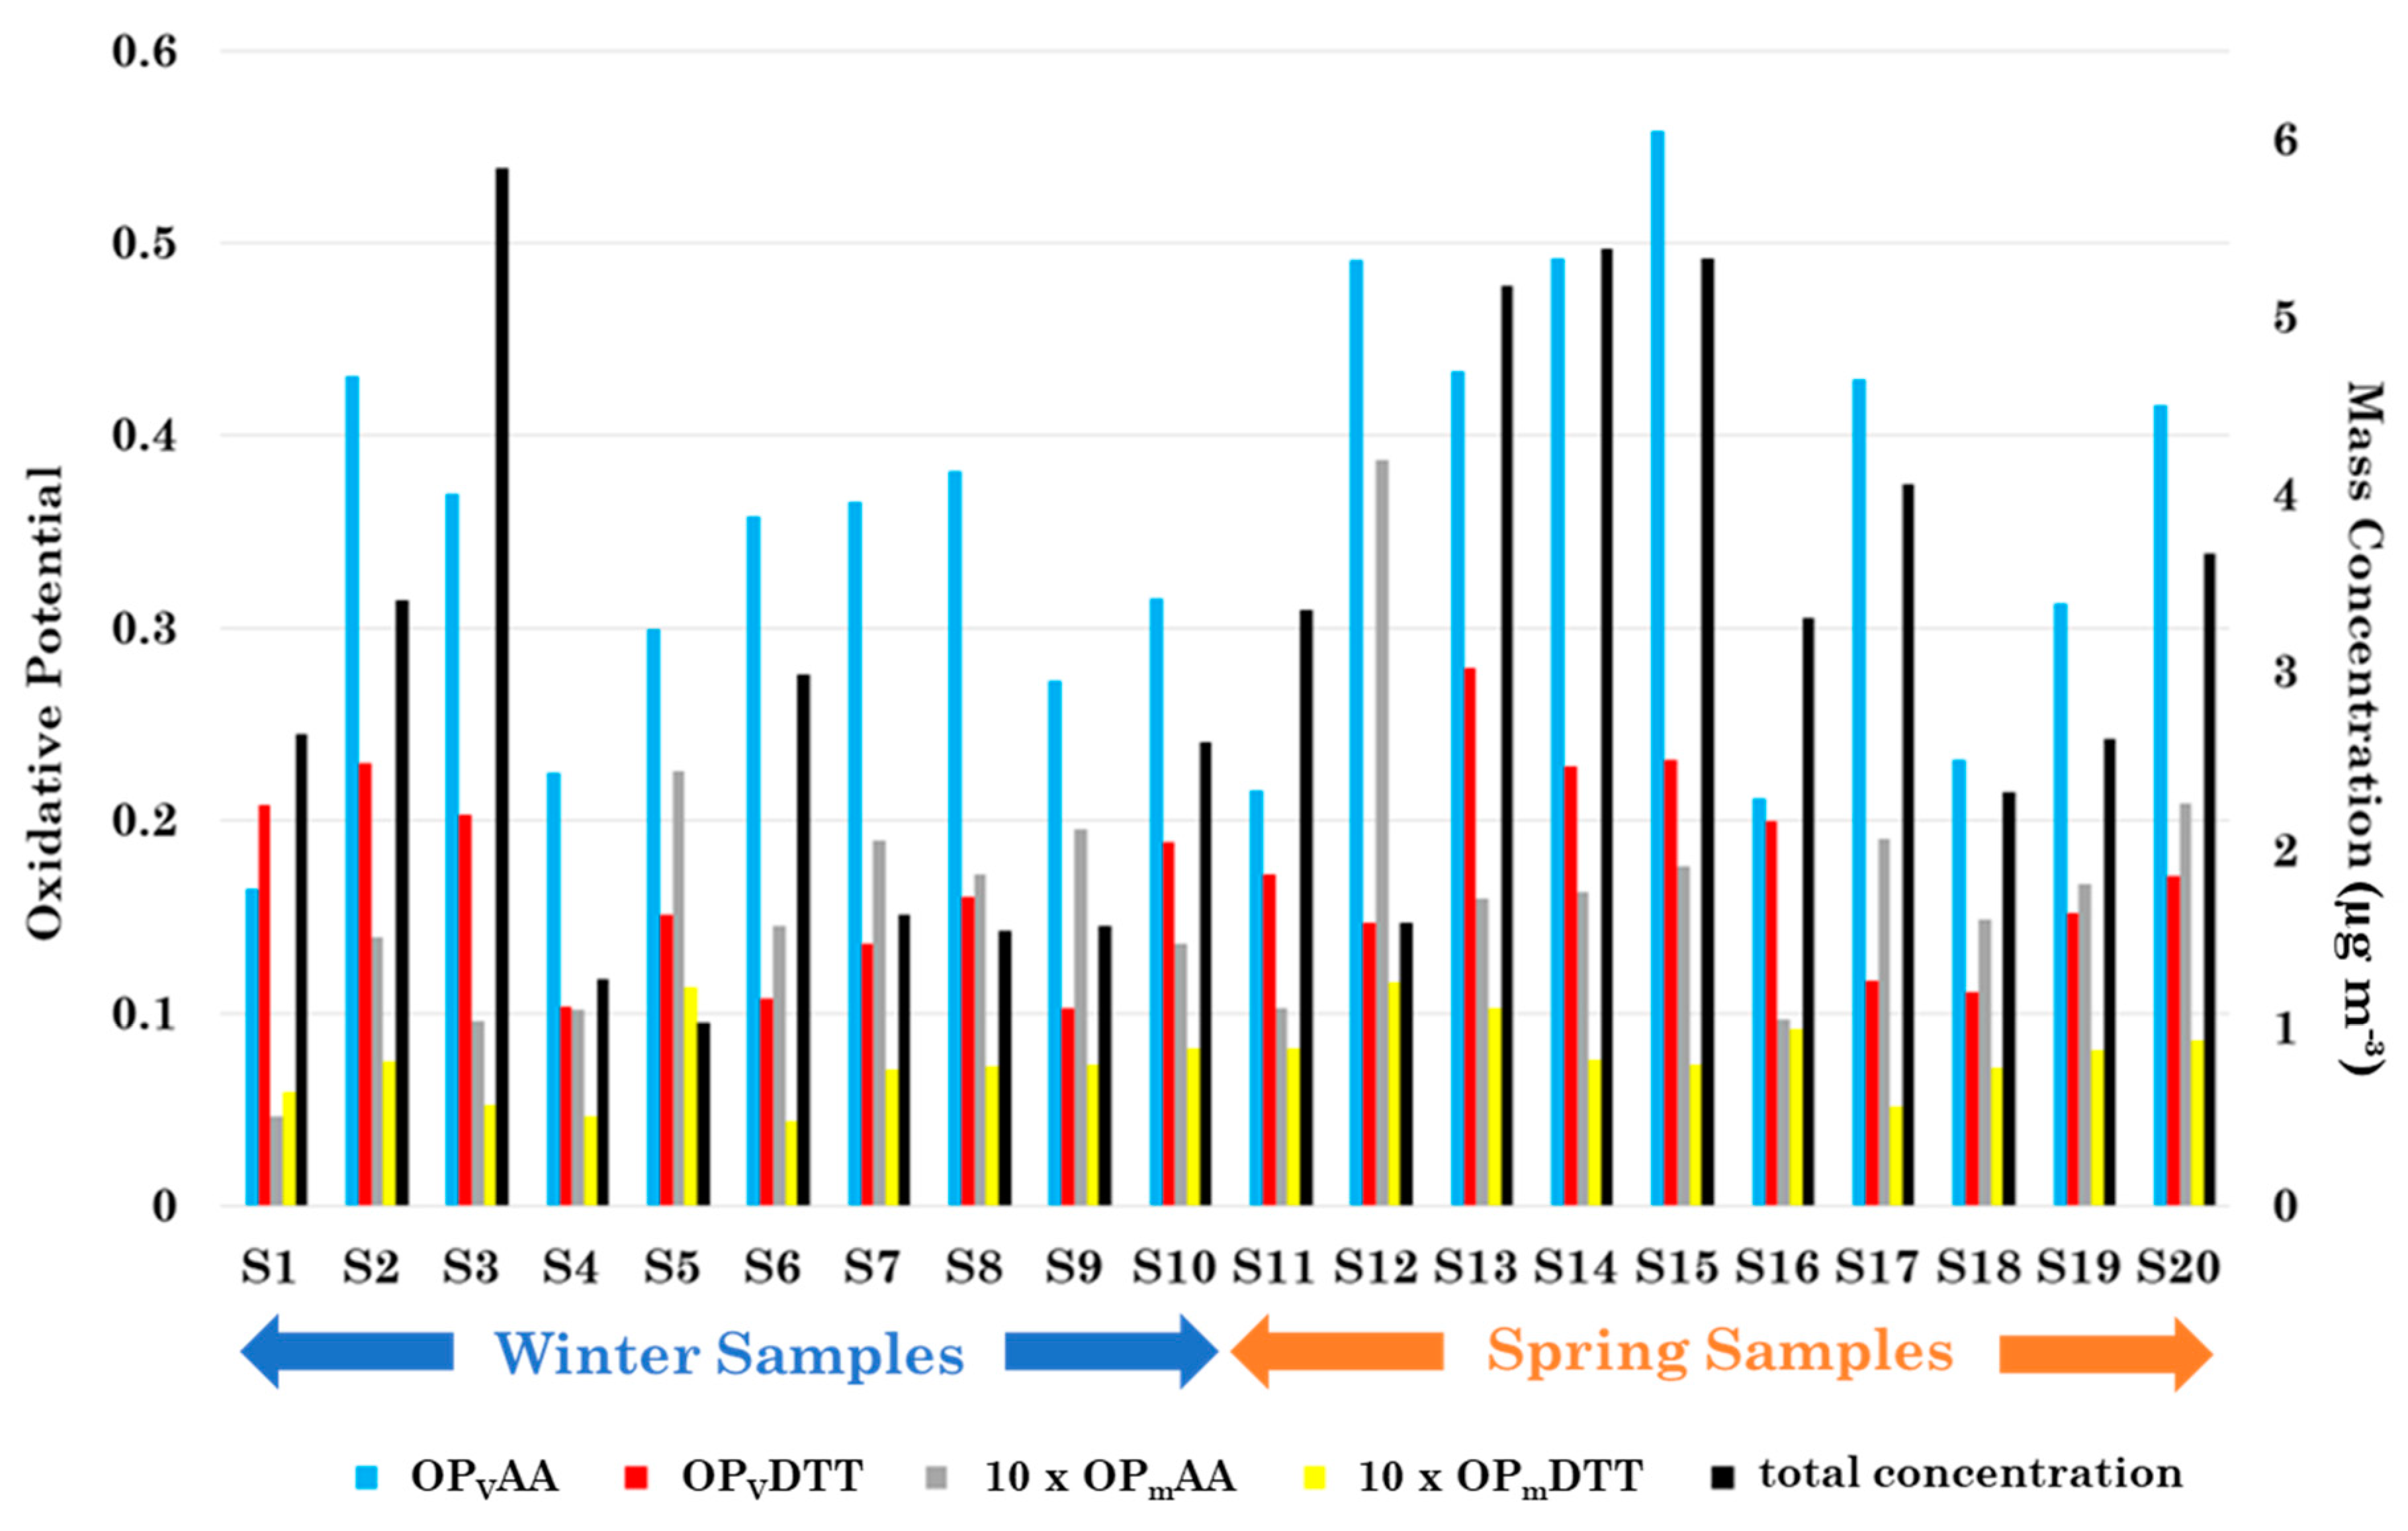
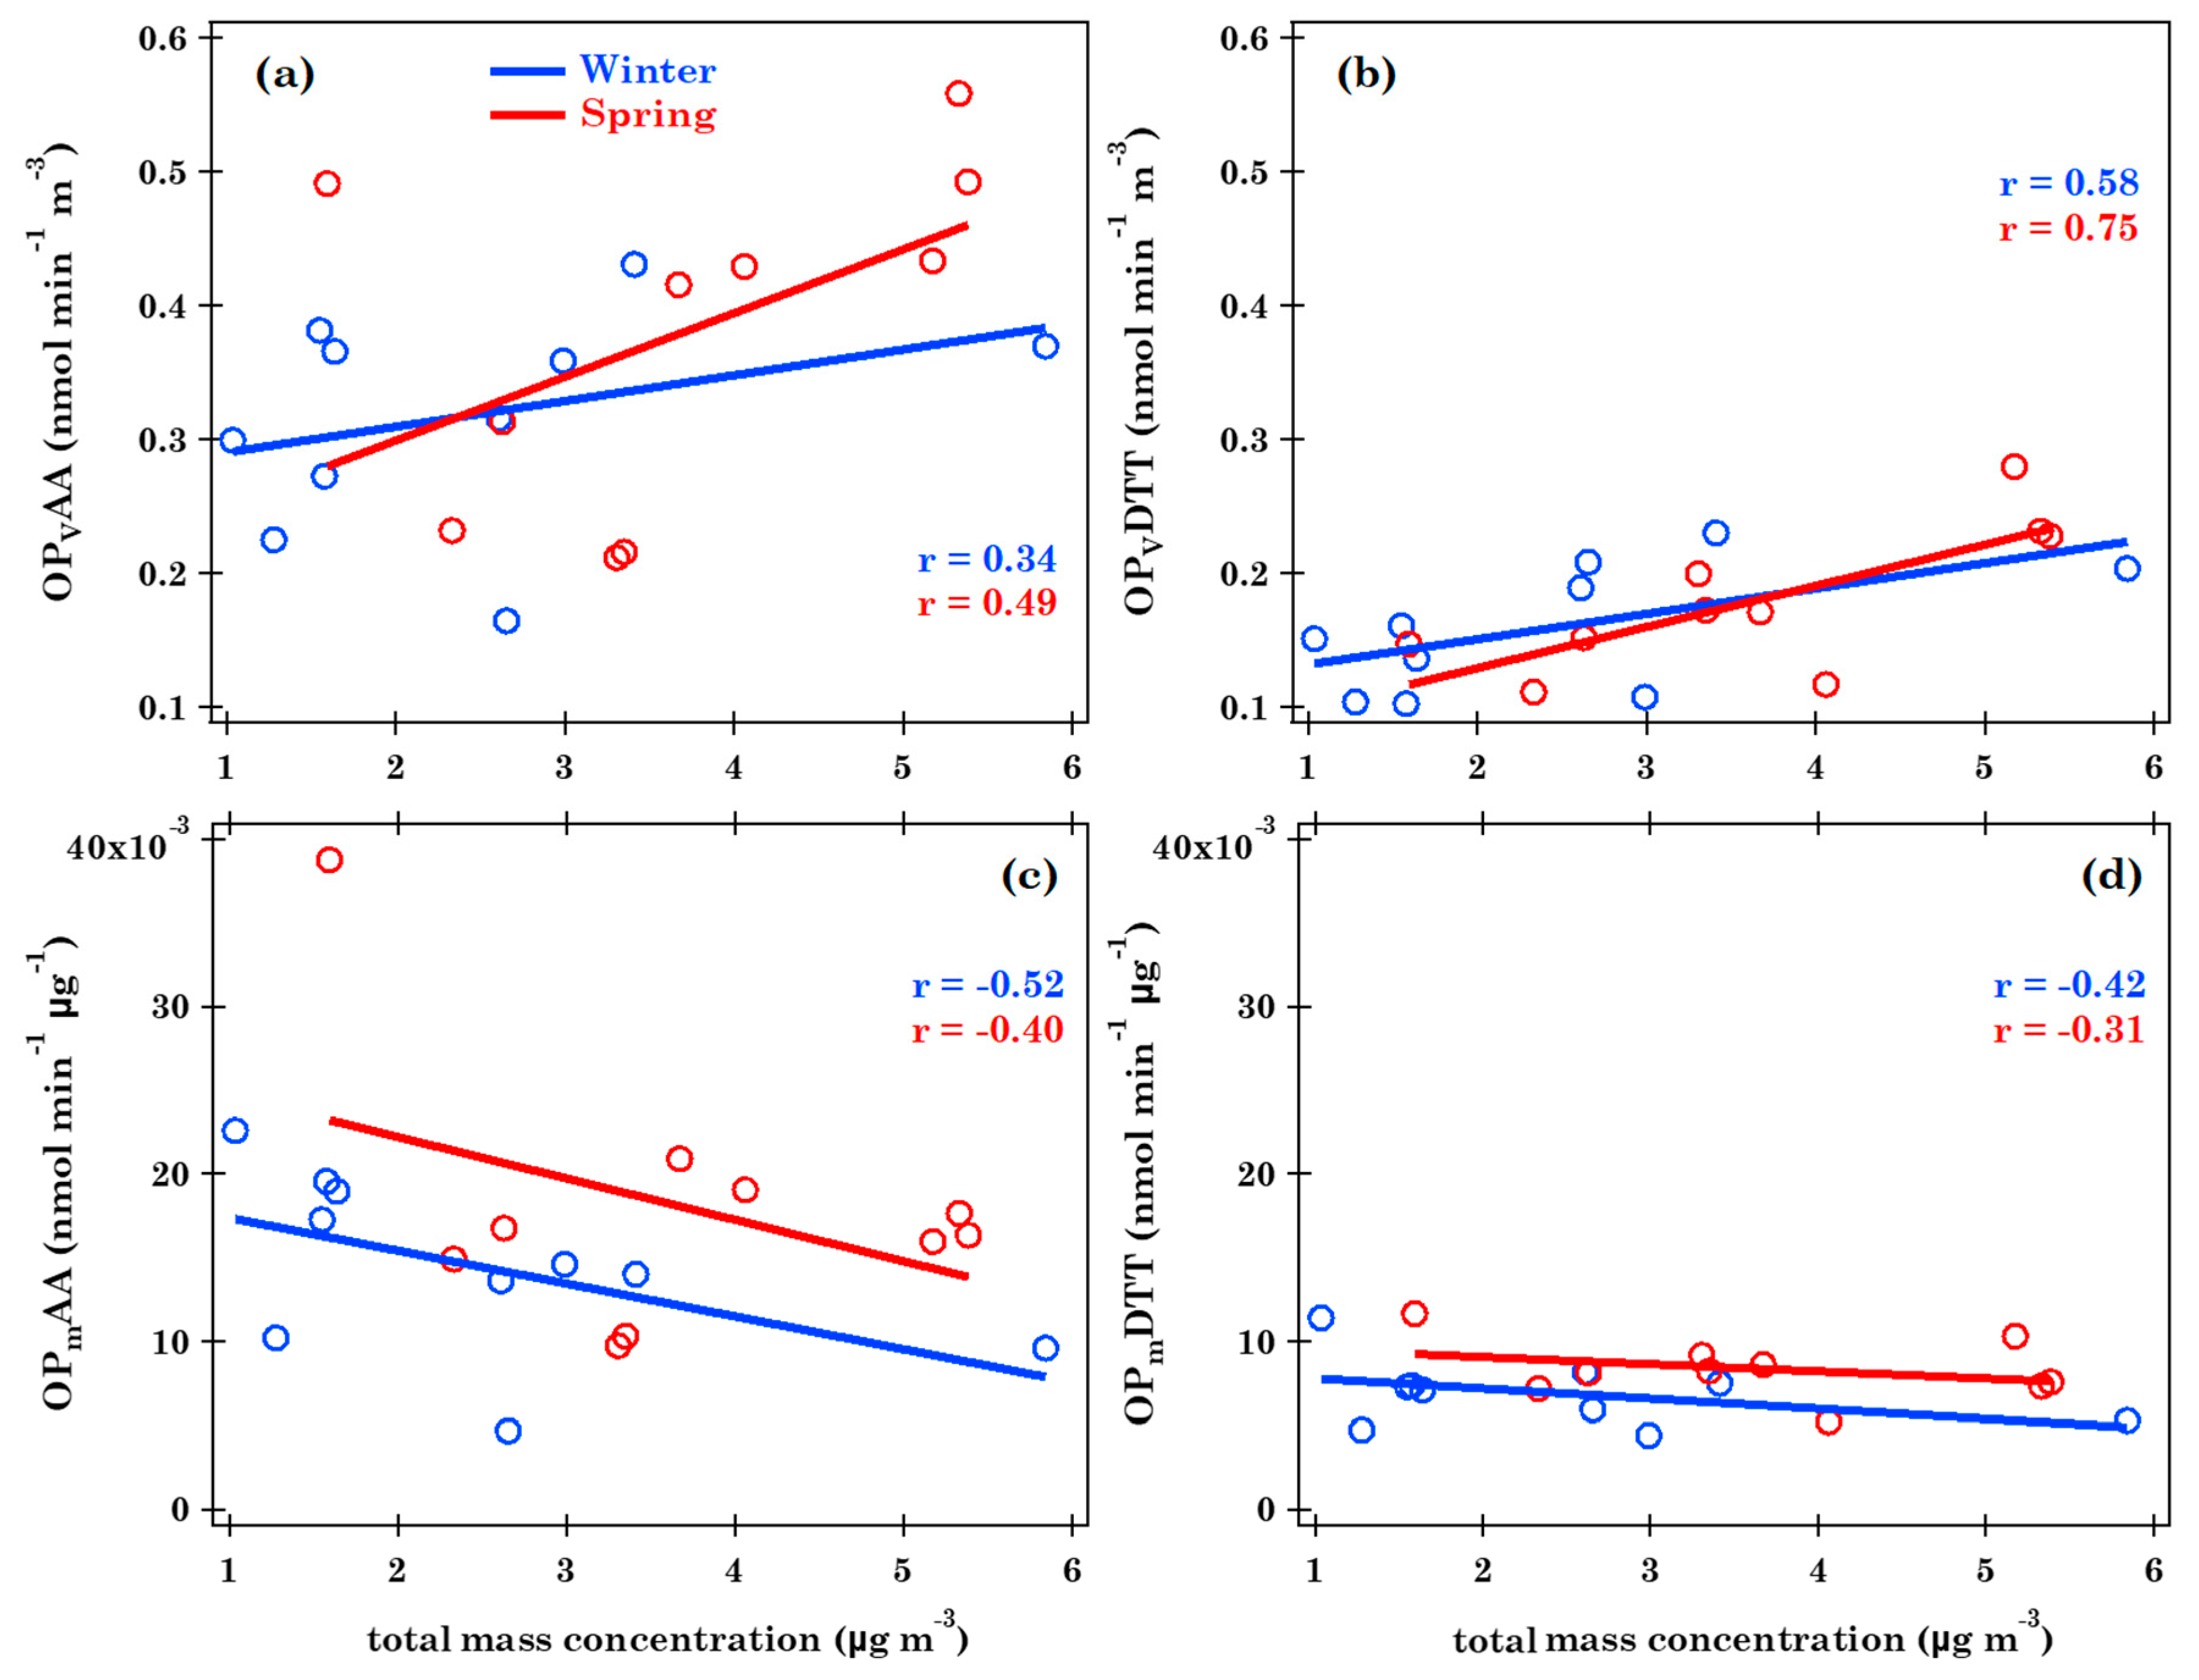
3.2. Oxidative Potential Characterization and Relationships with Metal, Br, P, S, and Se Total Concentration

Figure 2 shows the temporal evolution of the DTT and AA volume- and mass-normalized OP responses during the analyzed period from January to June 2018. Observe from Figure 2 that OPVDTT and OPVAA values largely varied among the analyzed samples, both in winter and in spring. Such a large variability was probably due to the specific characteristics of the study site, where both the PM concentration and chemical composition were characterized by a high variability. The impact of long-range transported air masses from Northern and/or Eastern Europe (likely characterized by high anthropogenic pollution contributions) and from desert regions and the Mediterranean Sea (all surrounding Southeastern Italy) could be considered responsible for these results [29,31,48,49,50]. Figure 2 also shows that the OPVAA response was, on average, significantly larger than the corresponding OPVDTT response (with mean values ± standard deviation (SD) equal to 0.35 ± 0.11 and 0.17 ± 0.05 nmol min−1 m−3, respectively, as reported in Table 2). Perrone et al. [28] found a similar result when investigating autumn–winter PM10 OPV values. They explained that the larger OPVAA values compared to those of OPVDTT were mainly related to a different sensitivity of the two assays to some chemical species. In particular, they demonstrated by multi-linear regression analyses that the OPVAA sensitivity to K+ was significantly greater than that of OPVDTT. In this study, a significant seasonal variation was found only for the OPVAA values (mean value equal to 0.32 ± 0.08 in winter and to 0.38 ± 0.13 in spring; Table 2). Different results were found by the authors of [51], who investigated the seasonal variability of OPVDTT and OPVAA values for PM10 samples monitored in Chamonix (France). They observed OPVAA values that were significantly greater in winter than in summer, in contrast with the finding of this study. Note also from Figure 2 that the OPm assumed a lower variability range than OPv, both for DTT and for AA assays.
The main features of OPV and OPm previously described in this section were consistent with those reported by [8,28] at the same site. In particular, Pietrogrande et al. [8] investigated the OPV and OPm seasonal trend in relation to the meteorological and atmospheric conditions and the PM10 chemical composition over a full year (from November 2014 to October 2015). They also proved that the OPV values from the DTT and AA assays had a similar association with the distinct chemical species analyzed in the PM10 samples, as also found by [15,52]. The two previous works on the OP characterization at the same site also demonstrated that the OPV response is an extensive parameter depending on the PM10 mass concentration, since high OPV responses were associated with high PM10 mass concentrations, according to [52]. Consequently, it is also particularly interesting to compare the OPV relationships with the total mass concentration of all analyzed chemical elements (black bars in Figure 2), which were also characterized by high variability during the analyzed period, as previously discussed in Section 3.1. In detail, the seasonal variation of the total mass concentration of all analyzed chemical components between winter and spring analyzed samples could be considered significant, as also proven by its corresponding mean values (2.5 and 3.7 µg m−3, respectively, as shown in Table 2). The larger mean value of the chemical element mass concentration found in spring was mostly due to the larger occurrence of desert dust outbreaks that were responsible for the transport of crustal matter during the sampling time [8,29,31]. The seasonal variation of the total mass concentration was in agreement with the corresponding average increase of OPVAA from winter to spring, as previously reported. In fact, observe from Figure 2 that the spring samples characterized by the highest total mass concentration (more than 5 µg m−3 for S13, S14, and S15) also presented larger values of OPVAA and OPVDTT responses. Romano et al. [45] grouped S13, S14, and S15 as a “late spring sample” cluster (Table 1). S3 and S12, which were identified as “desert dust” samples by [45], assumed the largest value of the total mass concentration of the analyzed elements (5.8 µg m−3) and the largest value of OPmAA (0.039 nmol min−1 µg−1). The “marine samples” S4, S7, and S8 (Table 1) assumed the lowest values of total mass concentration (less than 2 µg m−3), but they were also characterized by larger values of OPVAA. Conversely, the “continental samples” S1, S2, and S10 presented the highest value of total mass concentration of all analyzed chemical elements and the highest value of OPVDTT among the winter samples. A similar variability between “desert dust” and “continental” PM10 samples was also found by the authors of [28], who analyzed the main features of OPVAA, OPVDTT, and PM chemical composition at the same site.

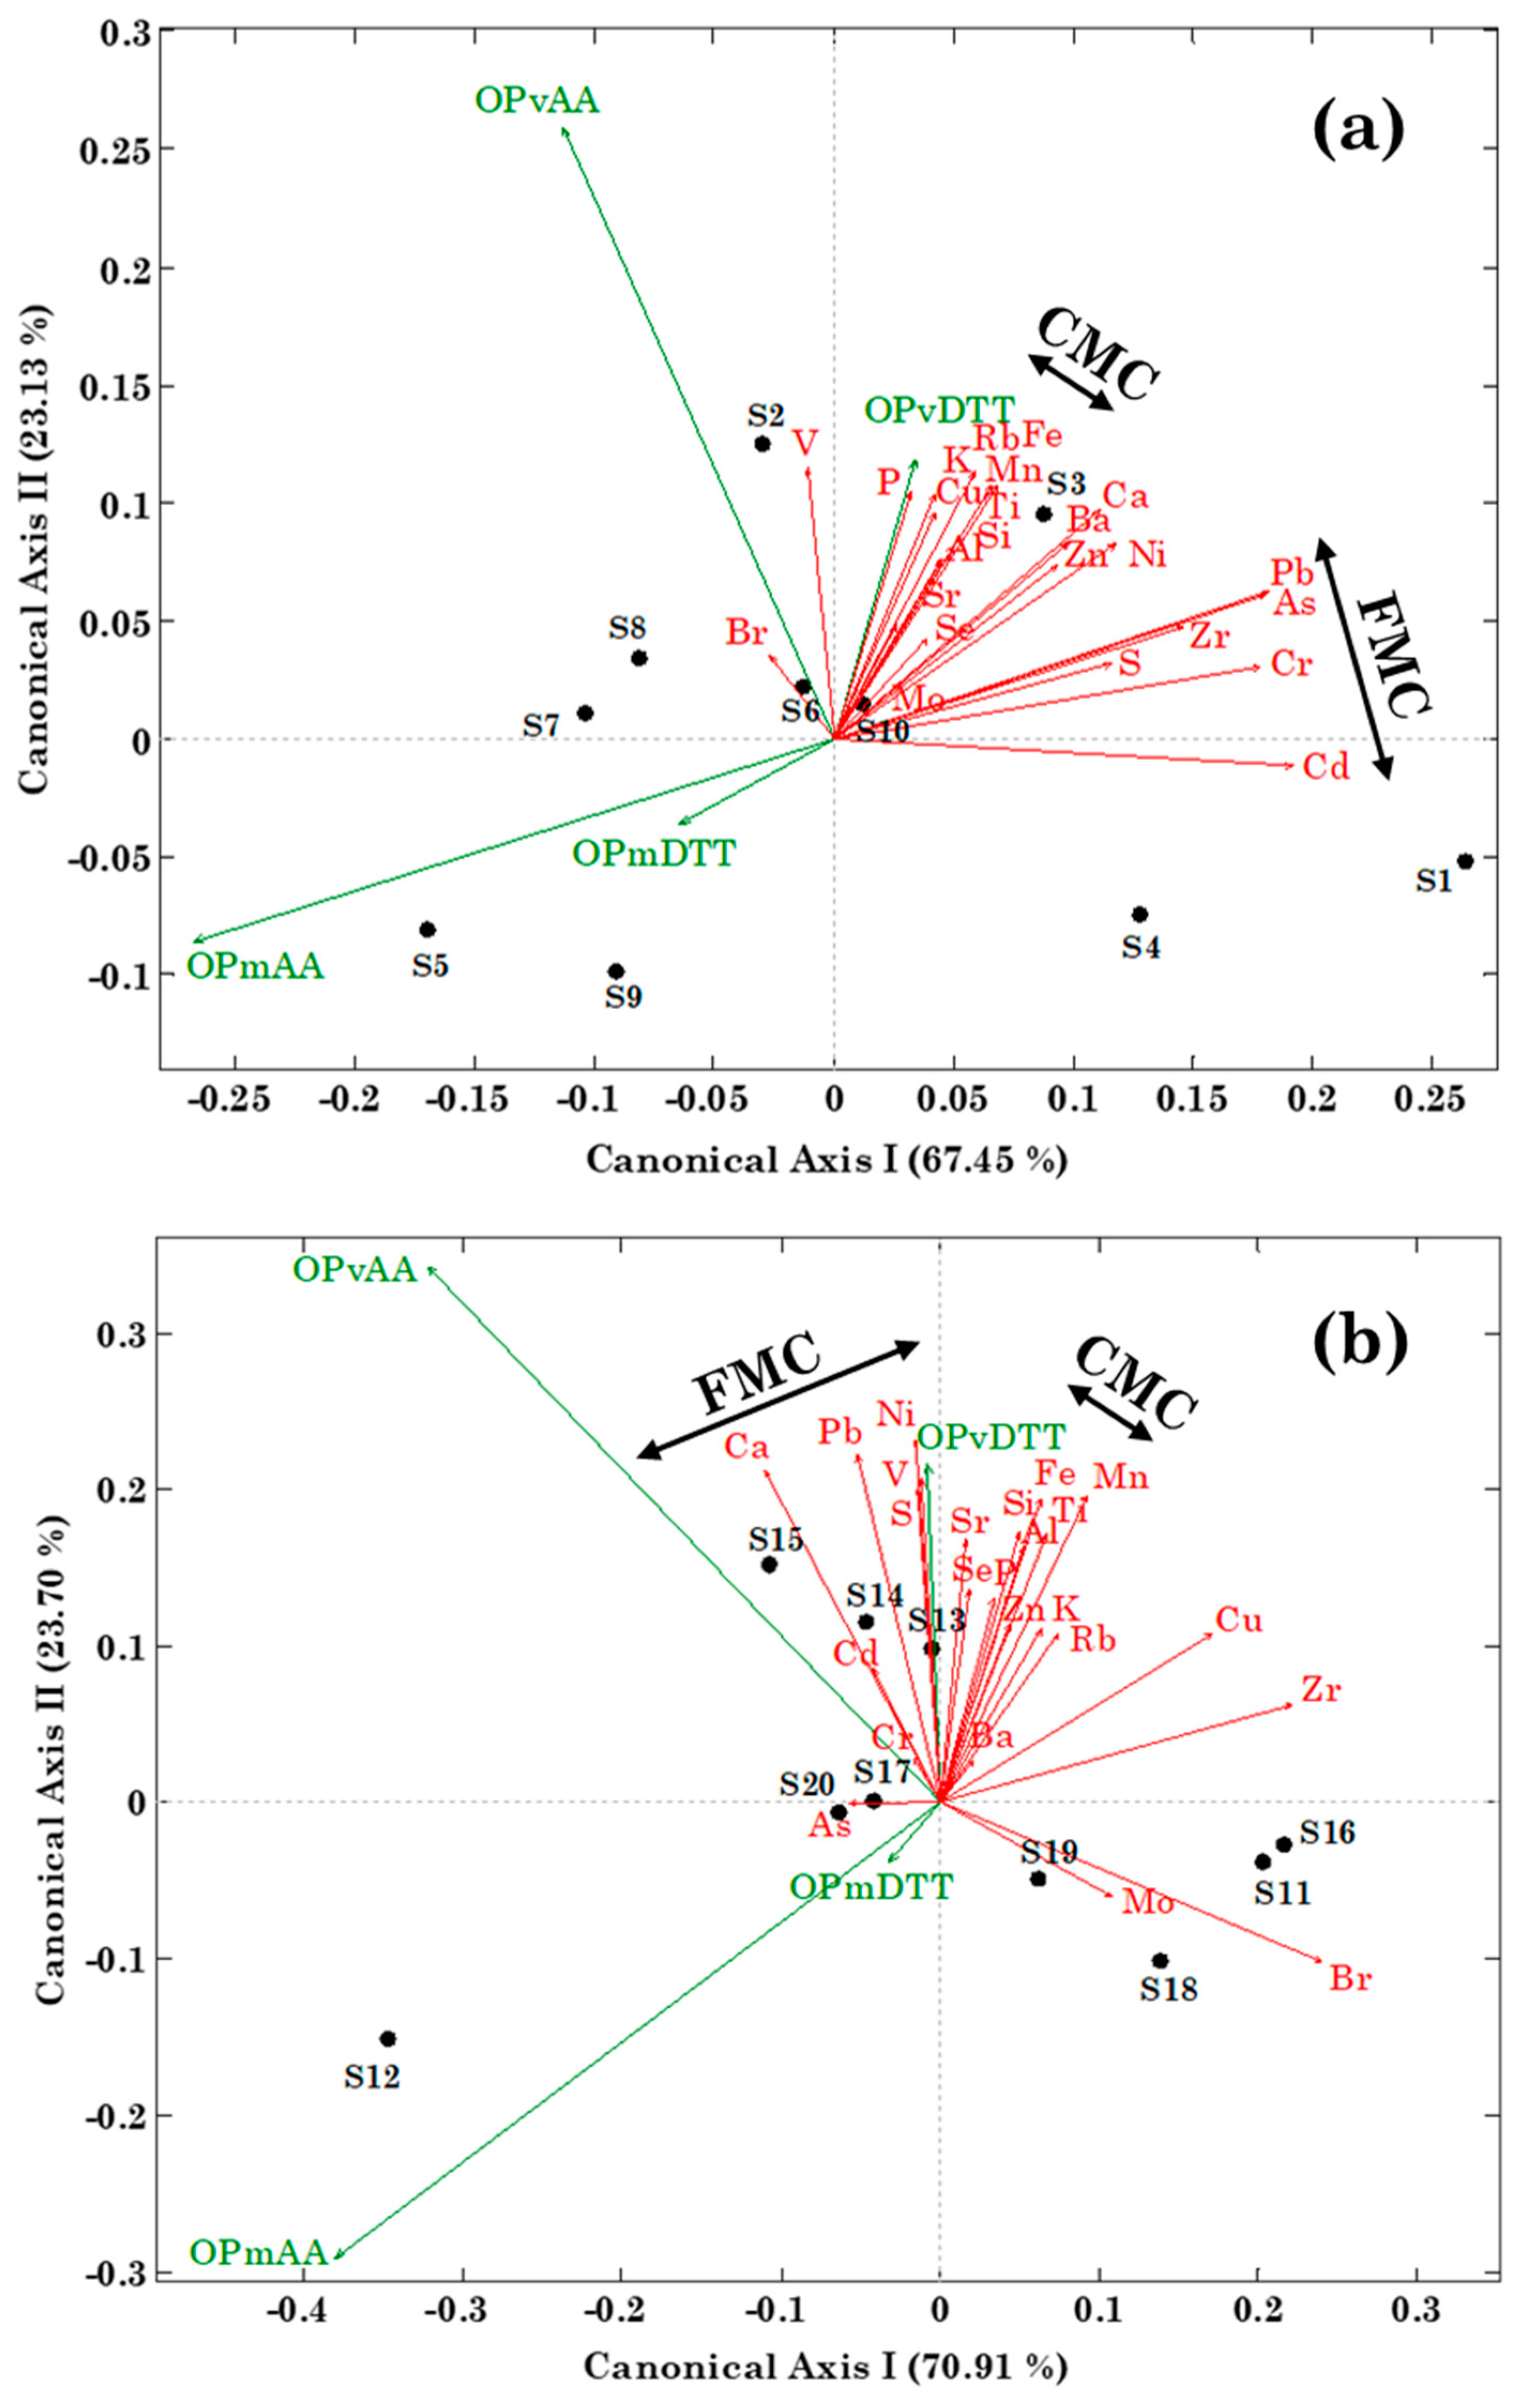
3.3. Relationships between Metal, Br, P, S, and Se Concentration and Oxidative Potential by RDA

A graphical view of the chemical element mass concentration–oxidative potential relationships is provided by the RDA triplot shown in Figure 3. As described in Section 2.3, this technique was applied to the metal, Br, P, S, and Se concentration dataset as predictive variables and the oxidative potential dataset as dependent variables. More specifically, Figure 3 shows the RDA triplot relating the AA and DTT OPV and OPm responses (green arrows, dependent variables) to chemical element mass concentrations (red arrows, predictive variables) in (a) winter and (b) spring. Note that the arrow length and direction are strictly related to the variance that can be explained by analyzed variables [40]. Stronger correlations between two parameters involve a greater absolute value of the cosine of the angle between the two corresponding arrows. Arrows in the same and in the opposite direction suggest a positive and a negative correlation, respectively, among the corresponding variables [53].
Figure 3 shows that the red arrows associated with the analyzed chemical elements were, on average, spread in the canonical axis plane over a wider area in spring than in winter. The typical spring–summer air mass aging over the Mediterranean favored the mixing of particles of different types/sources [29,50] and, therefore, likely contributed to this result. In contrast, OP green arrows were spread over a similar area of the canonical axis plane in winter and in spring (Figure 3a,b, respectively). Both OP response and chemical element arrow lengths were, on average, similar among winter and spring samples likely because the corresponding variables assumed a similar value of the explained variance among the two analyzed seasons. Conversely, OP responses (mainly for the AA assay) experienced a larger explained variance with respect to the analyzed chemical species concentrations, both in winter and in spring, as proven by their larger arrow length. In addition, note from Figure 3 that the OPV and the OPm arrows are located in a different region of the RDA triplot, proving their different features in relation to the metal, Br, P, S, and Se concentrations. In fact, as reported in Section 2.2, OPV represents an extensive parameter depending on the total mass concentration of the analyzed chemical elements, and, hence, this can likely be responsible for the lower angles between OPV and chemical element arrows in the RDA triplot. Conversely, OPm represents an intrinsic sample parameter that is not dependent on the total mass concentration of the analyzed chemical species, and, therefore, the corresponding arrows are located in a different area of the RDA triplot. Note also that the lower OPm variability range with respect to OPv, both for the DTT and AA assays (as shown in Figure 2 and discussed in Section 3.2), could also have contributed to this last result. The angles between OPVAA and OPVDTT arrows and the angles between OPmAA and OPmDTT arrows are small and, likely, they highlight similar characteristics in relation to metal, Br, P, S, and Se concentrations. It is worth observing that these last relations are not dependent on the season, since they were similar both in winter and in spring (Figure 3a,b, respectively).
The RDA triplots reported in Figure 3 also allowed for the identification of some clusters of chemical species that could be associated with different pollution sources according to [42] and Table 1. In particular, both in winter and in spring, two main clusters of chemical components can be clearly identified: a cluster related to both natural and anthropogenic sources mainly composed of Al, Fe, Mn, Si, and Ti (metals generally associated with coarse-mode crustal matter and/or road dust, denoted as CMC in Figure 3) and an anthropogenic source-related cluster that consists of As, Cd, Cr, Pb, and S (generally associated with fine-mode PM, denoted as FMC in Figure 3). According to the classification reported in [42], the main components of the metal coarse-mode cluster are included in the sources “Agriculture Soil,” “Natural Soil,” “Paved Road Dust,” and “Unpaved Road Dust”. Conversely, the chemical components of the fine-mode cluster are mainly associated with the sources “Smelter Fine,” “Motor Vehicle,” and “Oil Fire Power Plant”. The selected clustering can be considered consistent with those reported in previous studies related to the characterization of PM sample chemical composition [54,55].
Winter and spring PM10 samples are also reported in Figure 3a,b, respectively, by black full dots. Only two main sample clusters could be identified in the winter RDA triplot (Figure 3a), according to the classification reported by [45]: the “marine” cluster composed of S7 and S8 and the “heavy rain” cluster composed of S5 and S9 (Table 1). The samples S7 and S8 were associated with air masses that crossed the Atlantic and the Mediterranean Sea before reaching the study site, according to [45]. In particular, the location of S7 and S8 is, on average, close to the OPVAA arrow, which assumed higher values in the corresponding days, as previously discussed in Section 3.2. In fact, note that the location of the samples in the RDA triplot is close to the arrows associated with the metals and/or the other chemical elements that reached the highest concentrations in that sample and/or with the arrows related to the OP responses that assumed the highest values in that sample. Consequently, the winter sample S3, associated with the “desert dust” cluster by [45], is located very close to the arrows related to the “crustal matter” metals (Al, Fe, Mn, Si, and Ti). Analogously, Figure 3a shows that the winter sample S1 (classified among the “continental” samples by [45]) is close to the “anthropogenic source-related” metals (As, Cd, Cr, Pb) and S. In contrast, Figure 3b shows a larger variability in the location of the spring samples. As reported in Section 3.2, S13, S14, and S15 were the spring samples characterized by the highest total mass concentration of all the analyzed elements and also presented larger values of OPVAA and OPVDTT responses. As a consequence, the location of S13, S14, and S15, all grouped by [45] as “late spring samples” (Table 1) and characterized by a larger occurrence of desert dust advections, is close to the “crustal matter” metal, OPVAA, and OPVDTT arrows. The highest value of OPmAA measured during the day of the “desert dust” sample S12 explains its location in the RDA triplot. Note that the impact of long-range transported air masses on the ion and metal speciation of PM samples collected at the study site has been widely reported/discussed in several previous works [29,31,56].
The oxidative potential response association with specific chemical elements represents one of the main outcomes of the RDA triplot. As previously discussed, the metals Al, Fe, Mn, Si, and Ti were strongly correlated with each other, ultimately defining a coarse-mode cluster CMC, while the strong correlation among As, Cd, Cr, Pb, and S defined an anthropogenic source-related fine-mode cluster FMC. The RDA triplot reported in Figure 3 shows that the OPVDTT arrow was located near the arrows related to the elements associated with the CMC (both in winter and in spring). The highest values of OPVDTT associated with the highest values of the total mass concentration of the tested elements (S1, S2, and S10 in winter and S13, S14, and S15 in spring) could have contributed to this last result. Conversely, the location of OPVAA in the RDA triplot is in a different area with respect to the chemical elements associated with the CMC and FMC clusters in winter (Figure 3a). In fact, the winter OPVAA arrow is close to the “marine” cluster composed of S7 and S8 that is characterized by low concentrations of metals, Br, P, S, and Se. In spring, the OPVAA arrow is close to the FMC arrows, probably strictly related to higher OPVAA values associated with higher total mass concentration of the tested chemical elements (in particular, samples S13, S14, and S15), as shown in Figure 2. Different relationships between OPm and specific chemical elements, with similar seasonal features, can be observed in the RDA triplot. In fact, both OPmAA and OPmDTT arrows are located in opposite directions with respect to both metal CMC and FMC clusters (Figure 3), showing out an anti- correlation between OPm responses and the analyzed chemical element concentrations. Note that, as previously discussed, OPm is an intrinsic parameter that is not related to the mass concentration of specific chemical species. In conclusion, Figure 3 and the above reported comments show that the clustering of some chemical elements in the analyzed PM10 samples allowed for the inference of the main pollution sources and, hence, their association with OP values.

3.4. Relationships between Metal, Br, P, S and Se Concentration and Oxidative Potential by Spearman Correlation Coefficients

The relationships between oxidative potential responses and chemical element concentrations were also analyzed by Spearman correlation coefficients (r) for both winter and spring samples. The main goals of this section are to highlight the relationship strengths, identify the main elements responsible for the relationships, and compare the results from the correlation coefficient analysis with corresponding RDA results. Table 3 summarizes significant positive and negative relationships between OP responses and metal, Br, P, S, and Se mass concentrations for both winter and spring samples. The Spearman correlation coefficients, with values significant at p-levels of <0.01 and 0.05 in bold and in bold–italic, respectively, are reported in Table S2 for all the analyzed parameters.
According to the Spearman correlation coefficients reported in Table 3, different relationships between OP responses and specific chemical element concentrations could be found in winter and in spring. The OPVDTT values were correlated with a larger number of elements in winter than in spring. More specifically, the winter OPVDTT values were characterized by strong correlations with metals associated with the anthropogenic sources (such as Cr, Ni, Cu, and Zn) and chemical elements associated with the natural sources (such as K and P), according to [42]. This last result is consistent with those reported by [8,28] at the study site. The previous results outlined from the Spearman correlation coefficients appear to contrast with the RDA outcomes, indicating strong correlations of winter OPVDTT, but only with some elements related to natural sources and/or road dust. Significant winter OPVDTT-related Spearman correlation coefficients with lower p-values were also found with other metals generally associated with some natural sources and/or road dust (such as Ca, Mn, and Fe) and metals characterized by very low concentrations (such as Ba, Rb, and Zr). As one can observe from Table 3, a smaller amount of chemical elements (Pb, P, Ca, Fe, and Zn) was correlated with OPVDTT in spring. Nishita-Hara et al. [26] sampled both fine and coarse PM particles in spring 2016 in Fukuoka (Japan). According to the results of this study, they found a significant correlation of OPVDTT with Fe in the PM coarse-mode fraction, which they mainly associated with mineral dust events. They also found that OPVDTT was associated with Pb in PM fine-mode fraction, likely due to anthropogenic combustion sources. Calas et al. [19] also reported a strong correlation between OPVDTT response and Fe mass concentration (r = 0.71, significant with a p-level < 0.01) in PM10 samples monitored in Chamonix (France). The latter results from Spearman correlation coefficients are not consistent with the previously reported RDA outcomes (Figure 3), thus indicating relationships between spring OPVDTT and several element concentrations, related to both natural and anthropogenic sources. Note also from Table 3 that OPVDTT was correlated with PM10 mass concentration both in winter and in spring, since it represents an extensive parameter (Section 2.2). Accordingly, the highest values of OPVDTT were associated with the highest values of the total mass concentration of all the analyzed chemical elements (S1, S2, and S10 in winter and S13, S14, and S15 in spring), as shown in Figure 2. Janssen et al. [52] also found a strong correlation between OPVDTT and PM10 mass concentration (r = 0.75, significant with p-level < 0.01) when analyzing some PM10 samples from March to October 2009 in different sites of the Netherlands.
The main results from Spearman correlation coefficient analysis on the winter OPVAA relationships with chemical components were in reasonable accordance with the corresponding ones from RDA. In fact, OPVAA response did not present any correlations with specific element concentrations in winter. The higher values of OPVAA found in relation to the “marine” cluster composed of S7 and S8 that was characterized by low chemical element mass concentrations could have likely contributed to this last result. In spring, OPVAA assumed an inverse correlation with Br, which is generally associated with anthropogenic sources according to [42]. Accordingly, the RDA outcomes indicated a strong relation between OPVAA and the anthropogenic cluster in spring (Figure 3b).
The winter OPmAA was anti-correlated with the mass concentration of some chemical species generally associated with anthropogenic sources (As, Cd, Pb, S, and Zn), in agreement with the RDA outcomes (Figure 3a). OPmDTT did not present correlations with any element concentrations, both in winter and in spring. The corresponding small length of the OPmDTT arrow in the RDA triplot is consistent with this result, indicating a reduced variance explained by OPmDTT in the analyzed samples.
Table 3 showed that the relations of a given OP response with a specific chemical element presented some seasonal characteristics, in accordance with RDA results. To further investigate these mean seasonal variations among the analyzed parameters, Figure 4a,b shows the OPV responses, and Figure 4c,d shows the OPm responses as a function of the total mass concentration of the analyzed chemical elements for both the winter (blue circles) and spring (red circles) samples. OPVDTT assumed the largest correlation coefficients with respect to the total mass concentration due to all chemical species (r = 0.58 in winter and r = 0.75 in spring, both significant at a p-level < 0.05), as suggested by the large number of specific mass concentrations correlated with OPVDTT responses (Table 3). As shown in Figure 2, the highest values of OPVDTT associated with the highest values of chemical species mass concentration (S1, S2, and S10 in winter and S13, S14, and S15 in spring) also likely contributed to this last result. OPVAA also showed an increasing trend as a function of total mass concentration (Figure 4a), but it was characterized by a not significant correlation coefficient (r = 0.34 in winter and r = 0.49 in spring). The higher winter values of OPVAA were found in relation to the “marine” samples S7 and S8 that were characterized by low total mass concentrations, and, therefore, this could have probably contributed to the low r value in winter. The low number of specific elements correlated with OPVAA also confirmed the results of Figure 4a. A slight decreasing trend of OPm response as a function of the total mass concentration was found (Figure 4c,d). Only the correlation coefficient between OPmAA and total concentration in winter (r = −0.52) was significant (at a p-level < 0.10), in agreement with the larger number of specific element concentrations anti-correlated with OPmAA (Table 3).
The results previously reported in this section showed some contrasting results between the analysis of Spearman correlation coefficients and RDA about the determination of relationship strengths and the identification of the main chemical elements responsible for the relationships with oxidative potential responses. The discrepancies between Spearman coefficient results (Table 3) and RDA triplots (Figure 3) were likely due to the fact that the location of a specific arrow in the RDA triplot is dependent on more factors (mainly the sample location in the plot, the chemical element relationships with other elements, and the relationships of OP values with chemical elements) that may contrast among them. Conversely, Spearman correlation coefficients link the relationship between two specific parameters.

4. Conclusions

Redundancy Discriminant Analysis and Spearman correlation coefficients were used in this work to investigate the oxidative potential sensitivity to the mass concentration of specific chemical elements (metals, Br, P, S, and Se) in PM10 samples. The monitoring was performed from January to June 2018 in an Italian coastal site of the Central Mediterranean away from large sources of local pollution. Dithiothreitol and ascorbic acid acellular assays and the particle-induced X-ray emission technique were used to estimate oxidative potential responses and mass concentrations of 24 specific chemical elements, respectively. The main results of this study are reported below.
Al, Ca, Fe, K, S, and Si were the most abundant chemical elements among those analyzed in the detected samples, both in winter and in spring. They were associated both with natural sources like soil and/or desert dust and with anthropogenic sources like road dust. Total and specific mass concentrations assumed significant seasonal variations: winter samples were clearly characterized by a larger variability with respect to spring samples, mainly because of the different meteorological conditions.
OPVDTT and OPVAA were both characterized by a large variability among the analyzed samples, both in winter and in spring, a variability that was, in turn, related to the large variability of PM concentration and chemical composition. The OPVAA response was, on average, significantly larger than the corresponding OPVDTT response, and its significant seasonal variation was consistent with that of the total mass concentration of all the analyzed chemical elements. OPm assumed a lower variability range than OPv, both for the DTT and AA assays.
The RDA—which was applied to oxidative potential responses as dependent variables and metal, Br, P, S, and Se concentrations as explanatory variables—allowed to visualize main relations between PM10 oxidative potential and the corresponding concentration of specific chemical elements. A coarse-mode cluster related to both natural and anthropogenic sources (such as desert dust and road dust, respectively) and a fine-mode cluster related only to anthropogenic sources were identified by RDA. OPVDTT was mainly related to the chemical elements associated with the coarse-mode cluster (both in winter and in spring), while OPVAA was associated with the fine-mode cluster only in spring.
Spearman correlation coefficients were used to compare the main RDA results contributing to the evaluation of benefits and limits of both used techniques. According to Spearman correlation coefficients, winter OPVDTT was characterized by strong correlations with metals associated with anthropogenic sources (such as Cr, Ni, Cu, and Zn) and with chemical elements related to natural sources (such as K and P). Conversely, less element mass concentrations (Pb, P, Ca, Fe, and Zn) were correlated with OPVDTT in spring. OPVAA response did not present any correlations with specific element mass concentrations. Both RDA triplots and Spearman coefficients suggested an anti-correlation between OPm responses and specific chemical element concentrations.
In conclusion, this work has contributed to the validation of the main results from previous studies related to the OP characterization over Southeastern Italy. In addition, it represents the first work relating PM OP responses and specific chemical elements (metals, Br, P, S, and Se) by the RDA technique. Its main results have demonstrated that the integrated approach based on both RDA and Spearman correlation coefficients can provide new insights about the relations between OP responses and chemical element concentrations. We are aware that the RDA technique can be affected by different factors (e.g., sample location in the plot, chemical element relationships with other elements, OP relationships with all the analyzed chemical elements), while the Spearman correlation coefficients depend only on the relations between two specific parameters. However, their integration can contribute to the better evaluation of harmful effects associated with specific chemical components in PM samples.

Supplementary Materials

The following are available online at https://www.mdpi.com/2073-4433/11/4/367/s1, Table S1: Dataset of PM10 mass concentration, ascorbic acid and dithiothreitol volume- and mass-normalized oxidative potential, and mass concentration of all analyzed chemical elements, Table S2: Spearman correlation coefficients between PM10 mass concentration, ascorbic acid and dithiothreitol volume- and mass-normalized oxidative potential, and mass concentration of all analyzed chemical elements.

Author Contributions

Conceptualization, S.R.; methodology, S.R., S.B., F.L., and M.R.; software, S.R.; formal analysis, S.R.; investigation, S.R.; measurements, S.B., F.L., and M.R.; writing—original draft preparation, S.R.; supervision, S.R. and M.C.P. All authors have read and agreed to the published version of the manuscript.

Funding

S. Romano has carried out this work with the support of a Temporary Researcher position financed by the Italian “Programma Operativo Nazionale (PON) Ricerca e Innovazione 2014–2020 (Azione I.2—Attrazione e Mobilità dei Ricercatori)”. The work was partially supported by the PON project “PER-ACTRIS-IT—Potenziamento della componente italiana dell’Infrastruttura di Ricerca Aerosol, Clouds and Trace Gases Research Infrastructure” and by the Italian INFN (Istituto Nazionale Fisica Nucleare), in the frame of the projects TRACCIA (Time Resolved Aerosol Characterisation: Challenging Improvements and Ambitions) and IS-ABS (Integrated System for Aerosol and Bioaerosol Studies at the Pierre Auger Observatory).

Conflicts of Interest

The authors declare no conflict of interest. The funders had no role in the design of the study; in the collection, analyses, or interpretation of data; in the writing of the manuscript; or in the decision to publish the results.

References

  1. Kelly, F.J.; Fussell, J.C. Size, source and chemical composition as determinants of toxicity attributable to ambient particulate matter. Atmos. Environ. 2012, 60, 504–526. [Google Scholar] [CrossRef]
  2. Fortoul, T.I.; Rodriguez-Lara, V.; Gonzalez-Villalva, A.; Rojas-Lemus, M.; Colin-Barenque, L.; Bizarro-Nevares, P.; García-Peláez, I.; Ustarroz-Cano, M.; López-Zepeda, S.; Cervantes-Yépez, S.; et al. Health Effects of Metals in Particulate Matter. Curr. Air Qual. Issues 2015. [Google Scholar] [CrossRef] [Green Version]
  3. Englert, N. Fine particles and human health—A review of epidemiological studies. Toxicol. Lett. 2004, 149, 235–242. [Google Scholar] [CrossRef] [PubMed]
  4. Lippmann, M.; Chen, L.-C.; Gordon, T.; Ito, K.; Thurston, G.D. National Particle Component Toxicity (NPACT) Initiative: Integrated epidemiologic and toxicologic studies of the health effects of particulate matter components. Res. Rep. Health Eff. Inst. 2013, 177, 5–13. [Google Scholar]
  5. Zhou, J.; Ito, K.; Lall, R.; Lippmann, M.; Thurston, G. Time-Series Analysis of Mortality Effects of Fine Particulate Matter Components in Detroit and Seattle. Environ. Health Perspect. 2011, 119, 461–466. [Google Scholar] [CrossRef]
  6. Cakmak, S.; Dales, R.; Kauri, L.M.; Mahmud, M.; Van Ryswyk, K.; Vanos, J.; Liu, L.; Kumarathasan, P.; Thomson, E.; Vincent, R.; et al. Metal composition of fine particulate air pollution and acute changes in cardiorespiratory physiology. Environ. Pollut. 2014, 189, 208–214. [Google Scholar] [CrossRef] [Green Version]
  7. Ayres, J.G.; Borm, P.; Cassee, F.R.; Castranova, V.; Donaldson, K.; Ghio, A.; Harrison, R.M.; Hider, R.; Kelly, F.; Kooter, I.M.; et al. Evaluating the Toxicity of Airborne Particulate Matter and Nanoparticles by Measuring Oxidative Stress Potential—A Workshop Report and Consensus Statement. Inhal. Toxicol. 2008, 20, 75–99. [Google Scholar] [CrossRef]
  8. Pietrogrande, M.C.; Perrone, M.R.; Manarini, F.; Romano, S.; Udisti, R.; Becagli, S. PM10 oxidative potential at a Central Mediterranean Site: Association with chemical composition and meteorological parameters. Atmos. Environ. 2018, 188, 97–111. [Google Scholar] [CrossRef]
  9. Borm, P.J.A.; Kelly, F.; Künzli, N.; Schins, R.P.F.; Donaldson, K. Oxidant generation by particulate matter: From biologically effective dose to a promising, novel metric. Occup. Environ. Med. 2007, 64, 73–74. [Google Scholar] [CrossRef] [Green Version]
  10. Janssen, N.A.H.; Strak, M.; Yang, A.; Hellack, B.; Kelly, F.J.; Kuhlbusch, T.A.J.; Harrison, R.M.; Brunekreef, B.; Cassee, F.R.; Steenhof, M.; et al. Associations between three specific a-cellular measures of the oxidative potential of particulate matter and markers of acute airway and nasal inflammation in healthy volunteers. Occup. Environ. Med. 2015, 72, 49–56. [Google Scholar] [CrossRef]
  11. Brook, R.D.; Rajagopalan, S.; Pope, C.A.; Brook, J.R.; Bhatnagar, A.; Diez-Roux, A.V.; Holguin, F.; Hong, Y.; Luepker, R.V.; Mittleman, M.A.; et al. Particulate Matter Air Pollution and Cardiovascular Disease: An Update to the Scientific Statement From the American Heart Association. Circulation 2010, 121, 2331–2378. [Google Scholar] [CrossRef] [PubMed] [Green Version]
  12. Nel, A. Air Pollution-Related Illness: Effects of Particles. Science 2005, 308, 804–806. [Google Scholar] [CrossRef] [PubMed]
  13. Weichenthal, S.A.; Godri Pollitt, K.; Villeneuve, P.J. PM2.5, oxidant defence and cardiorespiratory health: A review. Environ. Health 2013, 12, 40. [Google Scholar] [CrossRef] [PubMed] [Green Version]
  14. Crobeddu, B.; Aragao-Santiago, L.; Bui, L.-C.; Boland, S.; Baeza Squiban, A. Oxidative potential of particulate matter 2.5 as predictive indicator of cellular stress. Environ. Pollut. 2017, 230, 125–133. [Google Scholar] [CrossRef] [PubMed]
  15. Yang, A.; Jedynska, A.; Hellack, B.; Kooter, I.; Hoek, G.; Brunekreef, B.; Kuhlbusch, T.A.J.; Cassee, F.R.; Janssen, N.A.H. Measurement of the oxidative potential of PM2.5 and its constituents: The effect of extraction solvent and filter type. Atmos. Environ. 2014, 83, 35–42. [Google Scholar] [CrossRef] [Green Version]
  16. Yang, A.; Wang, M.; Eeftens, M.; Beelen, R.; Dons, E.; Leseman, D.L.A.C.; Brunekreef, B.; Cassee, F.R.; Janssen, N.A.H.; Hoek, G. Spatial Variation and Land Use Regression Modeling of the Oxidative Potential of Fine Particles. Environ. Health Perspect. 2015, 123, 1187–1192. [Google Scholar] [CrossRef] [PubMed]
  17. Kelly, F.; Armstrong, B.; Atkinson, R.; Anderson, H.R.; Barratt, B.; Beevers, S.; Cook, D.; Green, D.; Derwent, D.; Mudway, I.; et al. The London low emission zone baseline study. Res. Rep. Health Eff. Inst. 2011, 163, 3–79. [Google Scholar]
  18. Szigeti, T.; Óvári, M.; Dunster, C.; Kelly, F.J.; Lucarelli, F.; Záray, G. Changes in chemical composition and oxidative potential of urban PM2.5 between 2010 and 2013 in Hungary. Sci. Total Environ. 2015, 518–519, 534–544. [Google Scholar] [CrossRef]
  19. Calas, A.; Uzu, G.; Kelly, F.J.; Houdier, S.; Martins, J.M.F.; Thomas, F.; Molton, F.; Charron, A.; Dunster, C.; Oliete, A.; et al. Comparison between five acellular oxidative potential measurement assays performed with detailed chemistry on PM 10 samples from the city of Chamonix (France). Atmos. Chem. Phys. 2018, 18, 7863–7875. [Google Scholar] [CrossRef] [Green Version]
  20. Calas, A.; Uzu, G.; Besombes, J.-L.; Martins, J.M.F.; Redaelli, M.; Weber, S.; Charron, A.; Albinet, A.; Chevrier, F.; Brulfert, G.; et al. Seasonal Variations and Chemical Predictors of Oxidative Potential (OP) of Particulate Matter (PM), for Seven Urban French Sites. Atmosphere 2019, 10, 698. [Google Scholar] [CrossRef] [Green Version]
  21. Weichenthal, S.; Crouse, D.L.; Pinault, L.; Godri-Pollitt, K.; Lavigne, E.; Evans, G.; van Donkelaar, A.; Martin, R.V.; Burnett, R.T. Oxidative burden of fine particulate air pollution and risk of cause-specific mortality in the Canadian Census Health and Environment Cohort (CanCHEC). Environ. Res. 2016, 146, 92–99. [Google Scholar] [CrossRef] [PubMed] [Green Version]
  22. Liu, L.; Urch, B.; Szyszkowicz, M.; Evans, G.; Speck, M.; Van Huang, A.; Leingartner, K.; Shutt, R.H.; Pelletier, G.; Gold, D.R.; et al. Metals and oxidative potential in urban particulate matter influence systemic inflammatory and neural biomarkers: A controlled exposure study. Environ. Int. 2018, 121, 1331–1340. [Google Scholar] [CrossRef] [PubMed]
  23. Daher, N.; Saliba, N.A.; Shihadeh, A.L.; Jaafar, M.; Baalbaki, R.; Shafer, M.M.; Schauer, J.J.; Sioutas, C. Oxidative potential and chemical speciation of size-resolved particulate matter (PM) at near-freeway and urban background sites in the greater Beirut area. Sci. Total Environ. 2014, 470–471, 417–426. [Google Scholar] [CrossRef] [PubMed]
  24. Charrier, J.G.; Anastasio, C. On dithiothreitol (DTT) as a measure of oxidative potential for ambient particles: Evidence for the importance of soluble transition metals. Atmos. Chem. Phys. 2012, 12, 9321–9333. [Google Scholar] [CrossRef] [Green Version]
  25. Mudway, I.S.; Stenfors, N.; Duggan, S.T.; Roxborough, H.; Zielinski, H.; Marklund, S.L.; Blomberg, A.; Frew, A.J.; Sandström, T.; Kelly, F.J. An in vitro and in vivo investigation of the effects of diesel exhaust on human airway lining fluid antioxidants. Arch. Biochem. Biophys. 2004, 423, 200–212. [Google Scholar] [CrossRef]
  26. Nishita-Hara, C.; Hirabayashi, M.; Hara, K.; Yamazaki, A.; Hayashi, M. Dithiothreitol-Measured Oxidative Potential of Size-Segregated Particulate Matter in Fukuoka, Japan: Effects of Asian Dust Events. GeoHealth 2019, 3, 160–173. [Google Scholar] [CrossRef] [Green Version]
  27. Saffari, A.; Daher, N.; Shafer, M.M.; Schauer, J.J.; Sioutas, C. Seasonal and spatial variation in dithiothreitol (DTT) activity of quasi-ultrafine particles in the Los Angeles Basin and its association with chemical species. J. Environ. Sci. Health A 2014, 49, 441–451. [Google Scholar] [CrossRef]
  28. Perrone, M.R.; Bertoli, I.; Romano, S.; Russo, M.; Rispoli, G.; Pietrogrande, M.C. PM2.5 and PM10 oxidative potential at a Central Mediterranean Site: Contrasts between dithiothreitol- and ascorbic acid-measured values in relation with particle size and chemical composition. Atmos. Environ. 2019, 210, 143–155. [Google Scholar] [CrossRef]
  29. Perrone, M.R.; Romano, S.; Orza, J.A.G. Columnar and ground-level aerosol optical properties: Sensitivity to the transboundary pollution, daily and weekly patterns, and relationships. Environ. Sci. Pollut. Res. 2015, 22, 16570–16589. [Google Scholar] [CrossRef]
  30. Basart, S.; Pérez, C.; Cuevas, E.; Baldasano, J.M.; Gobbi, G.P. Aerosol characterization in Northern Africa, Northeastern Atlantic, Mediterranean Basin and Middle East from direct-sun AERONET observations. Atmos. Chem. Phys. 2009, 9, 8265–8282. [Google Scholar] [CrossRef] [Green Version]
  31. Perrone, M.R.; Romano, S.; Orza, J.A.G. Particle optical properties at a Central Mediterranean site: Impact of advection routes and local meteorology. Atmos. Res. 2014, 145–146, 152–167. [Google Scholar] [CrossRef]
  32. Burton, N.C.; Grinshpun, S.A.; Reponen, T. Physical collection efficiency of filter materials for bacteria and viruses. Ann. Occup. Hyg. 2007, 51, 143–151. [Google Scholar] [CrossRef] [PubMed] [Green Version]
  33. Perrone, M.R.; Romano, S.; Genga, A.; Paladini, F. Integration of optical and chemical parameters to improve the particulate matter characterization. Atmos. Res. 2018, 205, 93–106. [Google Scholar] [CrossRef]
  34. Lucarelli, F.; Calzolai, G.; Chiari, M.; Giannoni, M.; Mochi, D.; Nava, S.; Carraresi, L. The upgraded external-beam PIXE/PIGE set-up at LABEC for very fast measurements on aerosol samples. Nucl. Instrum. Methods B 2014, 318, 55–59. [Google Scholar] [CrossRef]
  35. Lucarelli, F.; Calzolai, G.; Chiari, M.; Nava, S.; Carraresi, L. Study of atmospheric aerosols by IBA techniques: The LABEC experience. Nucl. Instrum. Methods B 2018, 417, 121–127. [Google Scholar] [CrossRef]
  36. Visentin, M.; Pagnoni, A.; Sarti, E.; Pietrogrande, M.C. Urban PM2.5 oxidative potential: Importance of chemical species and comparison of two spectrophotometric cell-free assays. Environ. Pollut. 2016, 219, 72–79. [Google Scholar] [CrossRef]
  37. Wang, T.; Cai, G.; Qiu, Y.; Fei, N.; Zhang, M.; Pang, X.; Jia, W.; Cai, S.; Zhao, L. Structural segregation of gut microbiota between colorectal cancer patients and healthy volunteers. ISME J. 2012, 6, 320–329. [Google Scholar] [CrossRef] [Green Version]
  38. Innocente, E.; Squizzato, S.; Visin, F.; Facca, C.; Rampazzo, G.; Bertolini, V.; Gandolfi, I.; Franzetti, A.; Ambrosini, R.; Bestetti, G. Influence of seasonality, air mass origin and particulate matter chemical composition on airborne bacterial community structure in the Po Valley, Italy. Sci. Total Environ. 2017, 593–594, 677–687. [Google Scholar] [CrossRef]
  39. Van den Wollenberg, A.L. Redundancy analysis an alternative for canonical correlation analysis. Psychometrika 1977, 42, 207–219. [Google Scholar] [CrossRef]
  40. Paliy, O.; Shankar, V. Application of multivariate statistical techniques in microbial ecology. Mol. Ecol. 2016, 25, 1032–1057. [Google Scholar] [CrossRef] [Green Version]
  41. Jones, D.L. Fathom Toolbox for MATLAB: Software for Multivariate Ecological and Oceanographic Data Analysis; College of Marine Science, University of South Florida: St. Petersburg, FL, USA, 2017; Available online: https://www.marine.usf.edu/research/matlab-resources/ (accessed on 2 December 2019).
  42. Chow, J.C. Measurement Methods to Determine Compliance with Ambient Air Quality Standards for Suspended Particles. J. Air Waste Manag. Assoc. 1995, 45, 320–382. [Google Scholar] [CrossRef] [PubMed] [Green Version]
  43. Amato, F.; Pandolfi, M.; Escrig, A.; Querol, X.; Alastuey, A.; Pey, J.; Perez, N.; Hopke, P.K. Quantifying road dust resuspension in urban environment by Multilinear Engine: A comparison with PMF2. Atmos. Environ. 2009, 43, 2770–2780. [Google Scholar] [CrossRef]
  44. Lyamani, H.; Olmo, F.J.; Alados-Arboledas, L. Physical and optical properties of aerosols over an urban location in Spain: Seasonal and diurnal variability. Atmos. Chem. Phys. 2010, 10, 239–254. [Google Scholar] [CrossRef] [Green Version]
  45. Romano, S.; Di Salvo, M.; Rispoli, G.; Alifano, P.; Perrone, M.R.; Talà, A. Airborne bacteria in the Central Mediterranean: Structure and role of meteorology and air mass transport. Sci. Total Environ. 2019, 697, 134020. [Google Scholar] [CrossRef]
  46. Stein, A.F.; Draxler, R.R.; Rolph, G.D.; Stunder, B.J.B.; Cohen, M.D.; Ngan, F. NOAA’s HYSPLIT Atmospheric Transport and Dispersion Modeling System. Bull. Am. Meteorol. Soc. 2015, 96, 2059–2077. [Google Scholar] [CrossRef]
  47. Perrone, M.R.; Vecchi, R.; Romano, S.; Becagli, S.; Traversi, R.; Paladini, F. Weekly cycle assessment of PM mass concentrations and sources, and impacts on temperature and wind speed in Southern Italy. Atmos. Res. 2019, 218, 129–144. [Google Scholar] [CrossRef]
  48. Becagli, S.; Anello, F.; Bommarito, C.; Cassola, F.; Calzolai, G.; Iorio, T.D.; di Sarra, A.; Gómez-Amo, J.-L.; Lucarelli, F.; Marconi, M.; et al. Constraining the ship contribution to the aerosol of the central Mediterranean. Atmos. Chem. Phys. 2017, 17, 2067–2084. [Google Scholar] [CrossRef] [Green Version]
  49. Chirizzi, D.; Cesari, D.; Guascito, M.R.; Dinoi, A.; Giotta, L.; Donateo, A.; Contini, D. Influence of Saharan dust outbreaks and carbon content on oxidative potential of water-soluble fractions of PM2.5 and PM10. Atmos. Environ. 2017, 163, 1–8. [Google Scholar] [CrossRef]
  50. Romano, S.; Perrone, M.R.; Pavese, G.; Esposito, F.; Calvello, M. Optical properties of PM2.5 particles: Results from a monitoring campaign in southeastern Italy. Atmos. Environ. 2019, 203, 35–47. [Google Scholar] [CrossRef] [Green Version]
  51. Calas, A.; Uzu, G.; Martins, J.M.F.; Voisin, D.; Spadini, L.; Lacroix, T.; Jaffrezo, J.-L. The importance of simulated lung fluid (SLF) extractions for a more relevant evaluation of the oxidative potential of particulate matter. Sci. Rep. 2017, 7, 1–12. [Google Scholar] [CrossRef]
  52. Janssen, N.A.H.; Yang, A.; Strak, M.; Steenhof, M.; Hellack, B.; Gerlofs-Nijland, M.E.; Kuhlbusch, T.; Kelly, F.; Harrison, R.; Brunekreef, B.; et al. Oxidative potential of particulate matter collected at sites with different source characteristics. Sci. Total Environ. 2014, 472, 572–581. [Google Scholar] [CrossRef] [PubMed] [Green Version]
  53. Sun, Y.; Xu, S.; Zheng, D.; Li, J.; Tian, H.; Wang, Y. Effects of haze pollution on microbial community changes and correlation with chemical components in atmospheric particulate matter. Sci. Total Environ. 2018, 637–638, 507–516. [Google Scholar] [CrossRef] [PubMed]
  54. Okuda, T.; Kato, J.; Mori, J.; Tenmoku, M.; Suda, Y.; Tanaka, S.; He, K.; Ma, Y.; Yang, F.; Yu, X. Daily concentrations of trace metals in aerosols in Beijing, China, determined by using inductively coupled plasma mass spectrometry equipped with laser ablation analysis, and source identification of aerosols. Sci. Total Environ. 2004, 330, 145–158. [Google Scholar] [CrossRef] [PubMed]
  55. Gao, J.; Tian, H.; Cheng, K.; Lu, L.; Zheng, M.; Wang, S.; Hao, J.; Wang, K.; Hua, S.; Zhu, C.; et al. The variation of chemical characteristics of PM2.5 and PM10 and formation causes during two haze pollution events in urban Beijing, China. Atmos. Environ. 2015, 107, 1–8. [Google Scholar] [CrossRef]
  56. Perrone, M.R.; Becagli, S.; Garcia Orza, J.A.; Vecchi, R.; Dinoi, A.; Udisti, R.; Cabello, M. The impact of long-range-transport on PM1 and PM2.5 at a Central Mediterranean site. Atmos. Environ. 2013, 71, 176–186. [Google Scholar] [CrossRef]
Figure 1. Bar plot of the mass concentration percentages of the investigated chemical elements in the 20 analyzed samples (S1–S10 in winter and S11–S20 in spring). The reported percentages are referred to the total sampled mass of all the 24 analyzed chemical elements.
Atmosphere 11 00367 g001
Figure 2. Temporal evolution of volume-normalized ascorbic acid- and dithiothreitol-oxidative potential (OPVAA and OPVDTT, respectively, expressed in nmol min−1 m−3), mass-normalized ascorbic acid- and dithiothreitol-oxidative potential (OPmAA and OPmDTT, respectively, expressed in nmol min−1 µg−1), and the total mass concentration of all the analyzed chemical elements. OPmAA and OPmDTT values were multiplied by 10 to better visualize data.
Atmosphere 11 00367 g002
Figure 3. Ordination triplot based on the Redundancy Discriminant Analysis (RDA) between the mass concentrations of all analyzed chemical elements as predictive variables (red arrows), ascorbic acid and dithiothreitol volume-normalized oxidative potential (OPVAA and OPVDTT, respectively) and mass-normalized oxidative potential (OPmAA and OPmDTT, respectively) as response variables (green arrows), and detected samples (black full dots) in (a) winter and (b) spring. Black arrows indicate the two identified clusters (coarse-mode cluster (CMC) and fine-mode cluster (FMC)) based on the sources associated with the analyzed chemical elements. The total variance explained by the two RDA axes is also reported in parentheses.
Atmosphere 11 00367 g003
Figure 4. Scatterplot of the (a) ascorbic acid and (b) dithiothreitol volume-normalized oxidative potential (OPVAA and OPVDTT, respectively) and the (c) ascorbic acid and (d) dithiothreitol mass-normalized oxidative potential (OPmAA and OPmDTT, respectively) as a function of the mass concentration of all the analyzed chemical elements (Al, As, Ba, Br, Ca, Cd, Cr, Cu, Fe, K, Mn, Mo, Ni, P, Pb, Rb, S, Se, Si, Sr, Ti, V, Zn, and Zr) for the 10 winter samples (blue circles) and the 10 spring samples (red circles). The correlation coefficients r and the corresponding fitting lines are also reported in each plot.
Atmosphere 11 00367 g004
Table 1. Clustering of the 20 PM10 samples analyzed in this study, according to Romano et al. [45]. Main pollution sources and corresponding chemical fingerprints (according to the Chow [42] classification) are also reported.
ClusterSamplesPM SourcesChemical Fingerprints
AnthropogenicS1, S2, S10Road Dust, Construction,
Motor Vehicle, Coal-Fired Boiler,
Oil Fired Power Plant
Al, Ca, Fe, K, Pb, S, Si
Heavy RainS5, S9, S11, S13
Desert DustS3, S6, S12Natural SoilAl, Ca, Fe, K, Mg, P, S, Si, Ti
MarineS4, S7, S8MarineAl, Ba, Ca, Cu, Fe, K, Si, Zn
Late SpringS14, S15, S16, S17, S18, S19, S20Natural Soil,
Agricultural Soil,
Vegetative Burning
Al, Ca, Fe, K, Mg, P, S, Si, Ti
Table 2. Mean values and standard deviations (SD) of PM10 volume- and mass-normalized oxidative potential responses (OPV and OPm, respectively) obtained from ascorbic acid (AA) and dithiothreitol (DTT) assays and total mass concentration of all the analyzed metals (Al, As, Ba, Ca, Cd, Cr, Cu, Fe, K, Mn, Mo, Ni, Pb, Rb, Si, Sr, Ti, V, Zn, and Zr) and Br, P, S, and Se. The data related to the total analyzed period, the 10 winter samples (from January to March 2018), and the 10 spring samples (from May to June 2018) are reported. Values with a significant seasonal difference (with p-value < 0.10) are marked in bold.
Oxidative PotentialTOTALWINTERSPRING
MeanSDMeanSDMeanSD
OPVAA
(nmolAA min−1 m−3)
0.350.110.320.080.380.13
OPVDTT
(nmolDTT min−1 m−3)
0.170.050.160.050.180.05
OPmAA
(nmolAA min−1 µg−1)
0.0160.0070.0140.0050.0180.008
OPmDTT
(nmolDTT min−1 µg−1)
0.0080.0020.0070.0020.0080.002
Total Mass
Concentration
(µg m−3)
3.11.52.51.43.71.3
Table 3. AA and DTT volume- and mass-normalized oxidative potential responses (OPV and OPm, respectively) positively and negatively correlated with total (all analyzed chemical elements) and PM10 mass concentration for the 10 winter samples and the 10 spring samples. Spearman correlation coefficients are reported in brackets (values significant at p-levels of < 0.01 and 0.05 are in bold and in italics, respectively).
WINTERSPRING
OPVAA OPmAA (0.67), Br (−0.65)
OPVDTTPM10 (0.67), Ba (0.68), Cr (0.85), Ni (0.85), Pb (0.70), P (0.85), K (0.97), Ca (0.73), Mn (0.65), Fe (0.69), Cu (0.94), Zn (0.85), Rb (0.84), Zr (0.67)PM10 (0.82), Pb (0.80), P (0.76), Ca (0.72), Fe (0.63), Zn (0.66)
OPmAAPM10 (−0.77), As (−0.87), Cd (−0.86), Pb (−0.92), S (−0.63), Zn (−0.70)OPVAA (0.67)
OPmDTT

