Abstract
The aim of this study is to assess the distribution of dust over the Mediterranean region, with a special focus on the territory of Romania. Two parameters are analyzed—Dust Load (DL) and Aerosol Optical Depth (AOD), the data is obtained from the dust forecast model BSC-DREAM8b v2.0, for the period between December 2015 and February 2019. The main geographical features of dust occurrence in the Mediterranean region are presented at the monthly and annual scale. The results show that, for Romania, the dust load is high from February to June, when it reaches its annual maximum. The atmospheric circulation inducing intense dust events over Romania have also been assessed using an objective classification method. A key element for the dust transport from the Sahara toward South-Eastern Europe is represented by the development of a deep cyclone South of Italy, following thereafter a North-East path towards the Balkan peninsula. The results at the regional scale are analyzed in connection with the aerosol optical properties at the local scale (e.g., aerosol optical depth at 440 nm, Absorption Ångström Exponent and Scattering Ångström Exponent at 440 nm and 675 nm, respectively) retrieved from the Aerosol Robotic Network (AERONET-NASA) for Romania, using data from ACTRIS-RO monitoring sites from Iași, Cluj–Napoca, and Bucharest. The differences between the forecast model and the observational data are also explored. Our results also show that the contribution of the natural mineral dust to air pollution in Romania is small, representing not more than 10% of all kinds of aerosols detected over the observation points from the ACTRIS-RO network.
1. Introduction
The atmospheric cycle of dust particles is a complex geophysical process, strongly influenced by the combined effects of soil erosion in an arid region and atmospheric conditions [1]. Due to its impact on the climate and the environment, the topics related to the dust of desert origin are currently the subject of active research.
Under favorable weather conditions, the quantities of dust carried can be impressive [2]. Early estimations [3] indicated that annually, at a global scale, one billion tons of desert dust is transported into the lower and middle troposphere. Due to the low visibility induced in the atmosphere, such events affect several human activities that depend on air visibility, like ground transportation or aviation. Also, they represent a net contributor to air pollution, leading to significant increases in particulate matter concentrations [4], with a direct impact on human health, mostly causing respiratory problems and cardiovascular complaints [5].
Mineral dust particles also have an indirect effect on the atmospheric humidity, leading to uncertainties in the studies of climate systems and models at global and regional levels [6,7]. According to some authors [8], large quantities of mineral dust particles in the atmosphere induce an important radiative impact on the Earth’s surface associated with a sharp decrease of the temperature on the surface [9].
The mineral dust found in the troposphere has its origins, mainly in the arid regions of the Earth. Among the regions representing the source for the largest part of mineral dust at European scale, the most important one is the Saharan desert, along with its surrounding margins in North Africa [8]. Under certain weather conditions over this region, the dust is lifted to the lower and middle troposphere and transported over long distances. Small dust particles can be lifted, drifted, and carried by the wind over long distances, hundreds, and even thousands of kilometers, especially in the lower and middle troposphere. The geographical regions most exposed to these phenomena are the Caribbean, the North Atlantic region, and the Mediterranean Sea [10]. The dust transport can reach up to 5–6 km altitude. In contrast, particles that are larger are deposited relatively quickly near the source region [11].
The main synoptic pattern which leads to such transports of mineral dust over the Mediterranean and Southern Europe—in few cases reaching even Northern Europe—is one in which an Atlantic low-pressure trough extends far South to the Western coast of Morocco, and then couples with a high-pressure ridge over Northern Africa and the Mediterranean [12]. As a result, a strong convergence may help keep a northerly flow towards Central or South-Eastern Europe for several days, transporting along its way high quantities of mineral dust particles [13]. A better understanding of these synoptic conditions could help in the future to improve the dust packages in atmospheric models [4] or to increase the capacity to forecast extreme dust events.
Nowadays, forecast models are used worldwide, while only a few of them also provide their data freely to the public. The BSC-DREAM8b v2.0 model forecasts the atmospheric life cycle of the eroded desert dust, being freely accessible on the official website of the Barcelona Dust Forecast model [14]. Also, the AERONET (AErosol RObotic NETwork) offers the possibility to monitor the dust load at regional and local scales over multiple observation points at a global scale. Combining the model data and AERONET observation can bring a comprehensive idea on dust load both at the continental and local scale. In the current study we used these kinds of data for three monitoring sites from Romania in order to offer a comprehensive image of dust load at the local scale. This way, one can obtain a detailed image of the presence of dust, from a spatial and temporal perspective, for Romania and additionally to offer an idea on its possible contribution to air pollution in this region.
2. Data and Methodology
2.1. Study Area
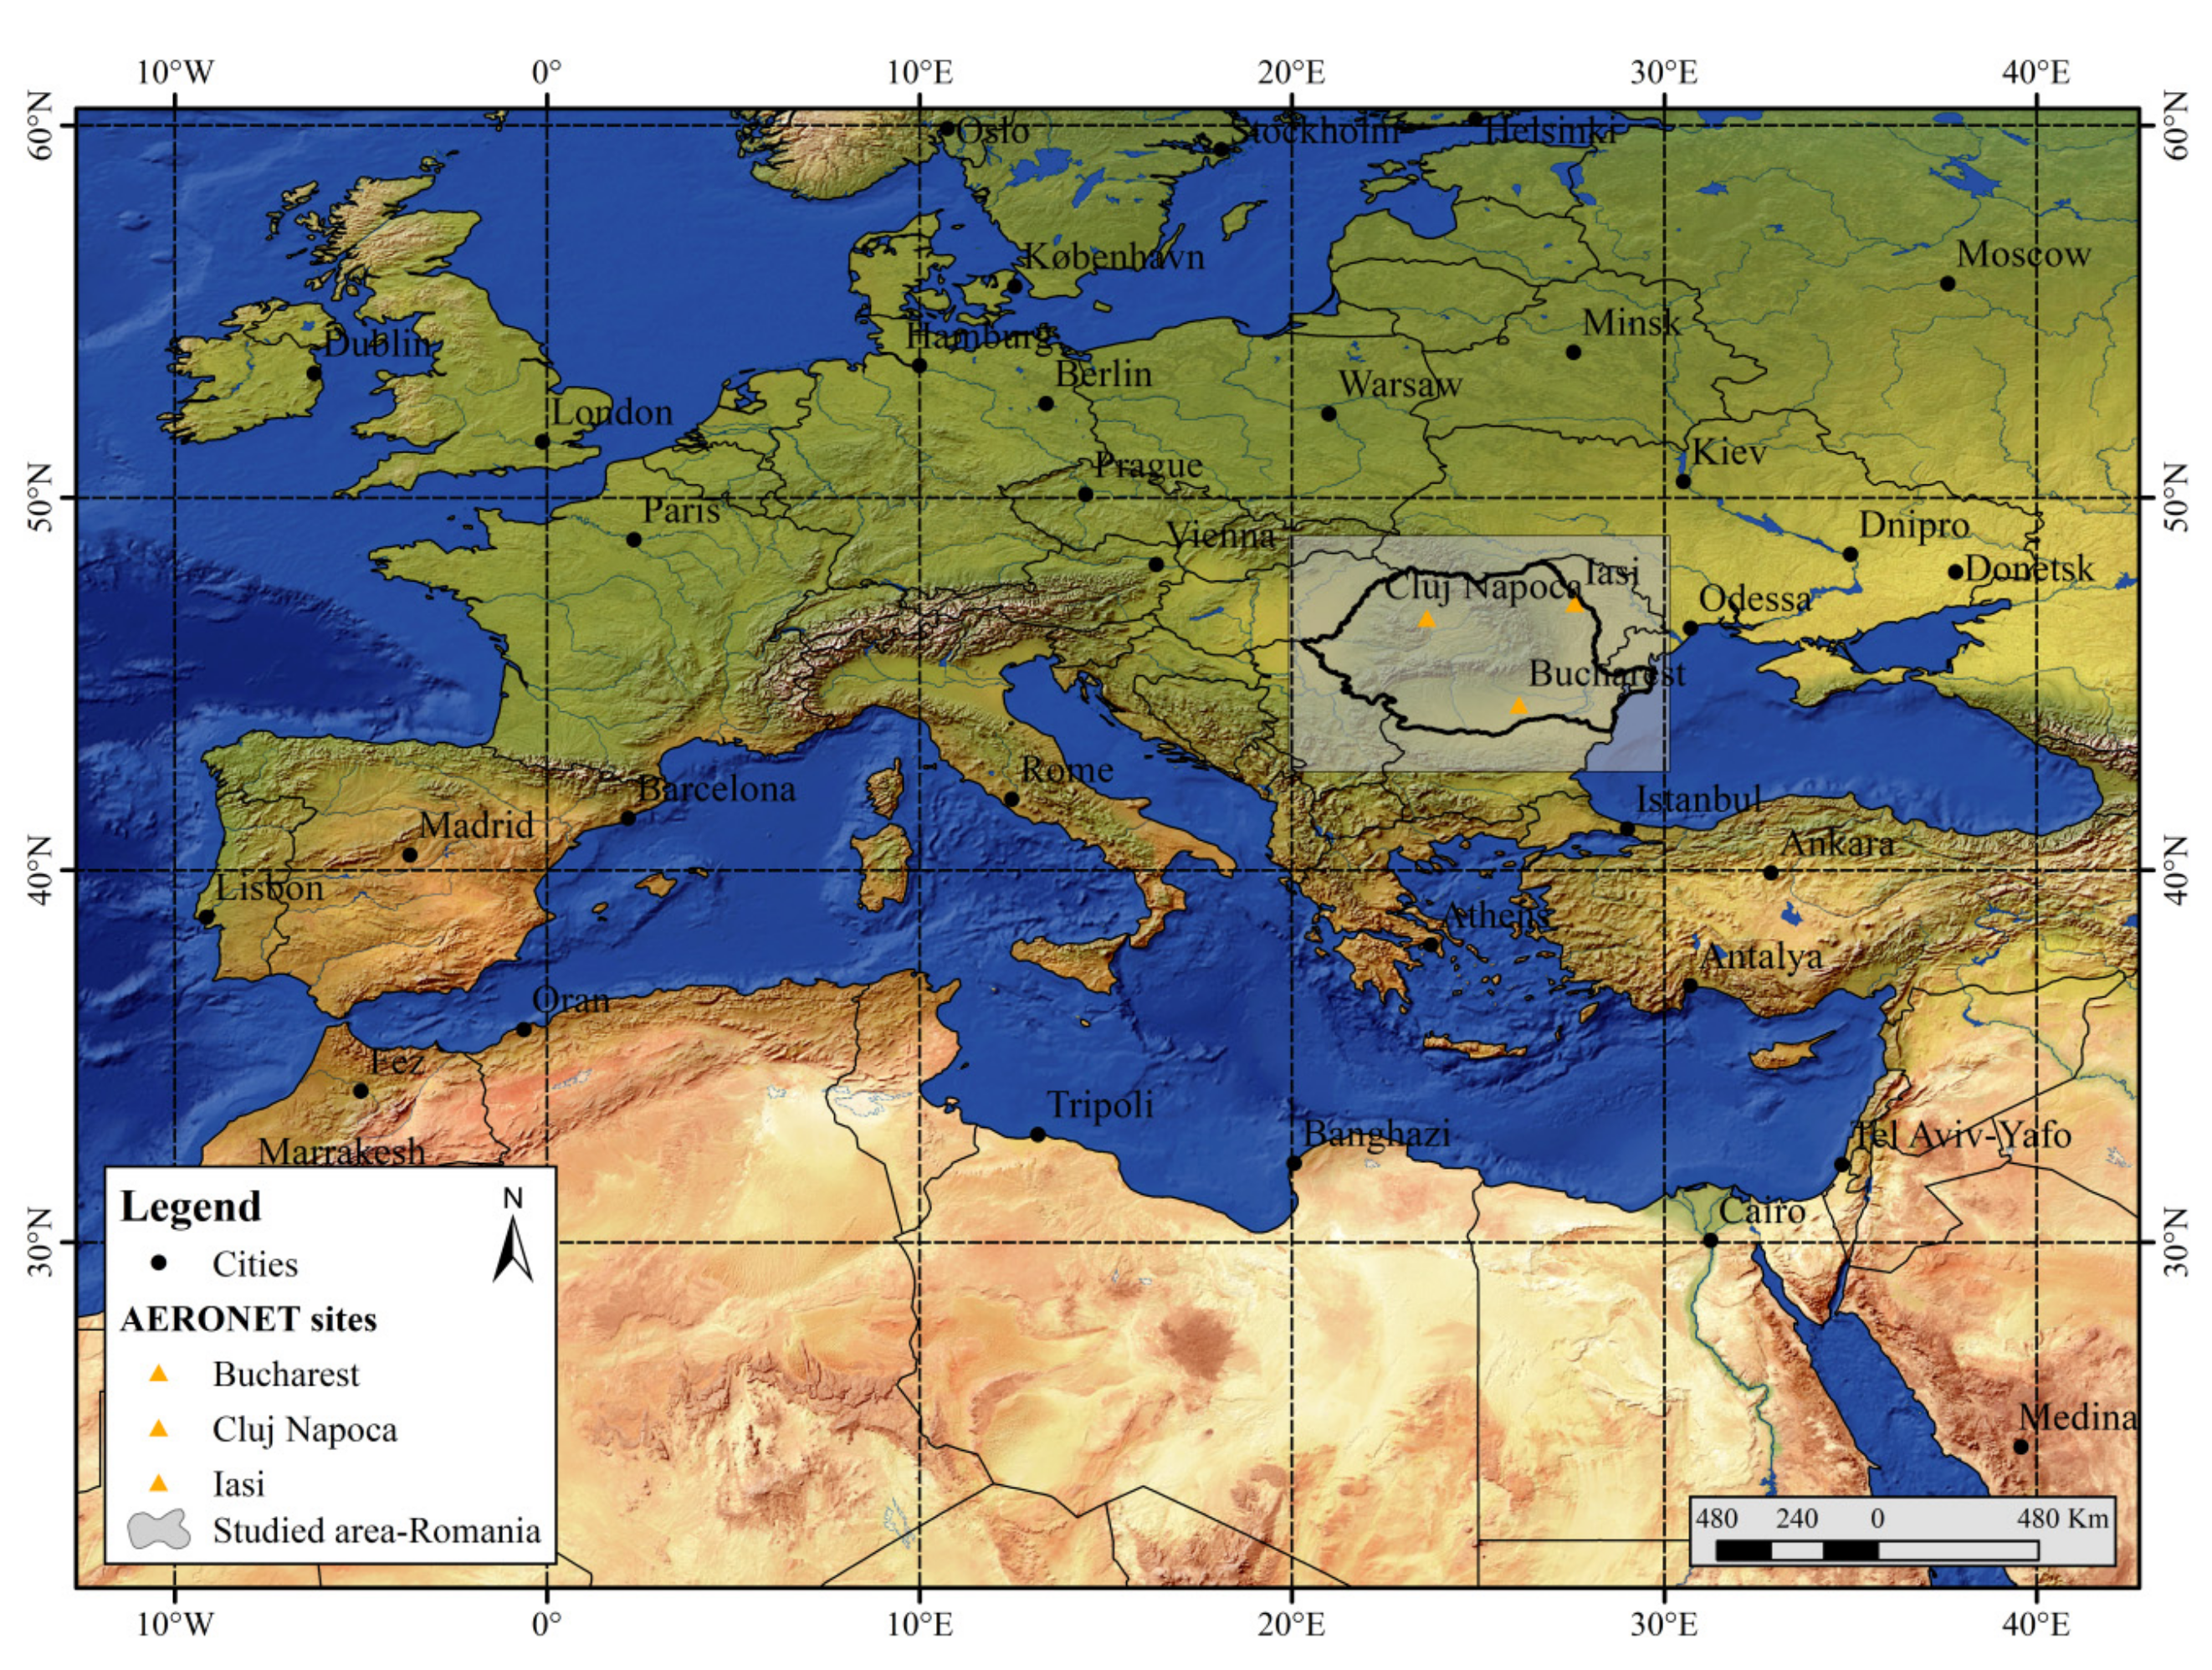
Dust particles come from arid regions with the largest source of dust for Europe represented by North Africa, due to the vicinity of the Sahara Desert. The dust particles are transported from this region toward the Mediterranean Sea and Europe [12,13], including Romania. Taking this into account, the main study area of this paper covers northern Africa, the Mediterranean Sea basin, and Europe, the northern limit is represented by the Baltic Sea and Scandinavia, where very few particles of Saharan dust are detected. A secondary study region, within the first larger one, in the region of Romania, with its proximity zones, chosen to illustrate more clearly the quantitative effect of the transport of Saharan dust over long distances (Figure 1).
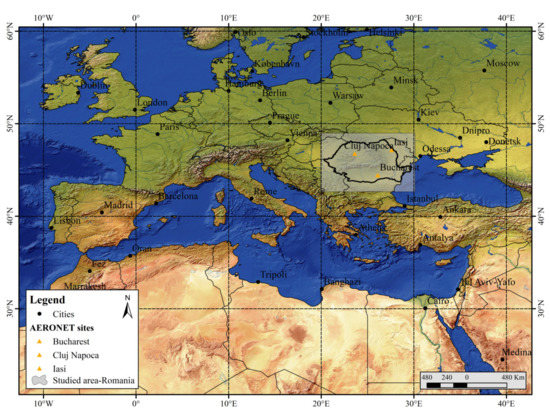
Figure 1.
Study area domain with the focus region including Romania and the AERONET sites.
2.2. Dust Data from BSC-DREAM8b.v2
The parameters analyzed in order to illustrate the distribution of long-distance transport of dust particles are represented by the Dust Load (DL) and the Aerosol Optical Depth (AOD). The data is provided by the BSC-DREAM8b v2.0 dust model [14] which was developed by the Spanish State Meteorological Agency (AEMET) through the Barcelona Supercomputing Center (BSC-CNS), in order to create the first Regional Specialized Meteorological Center with a special activity on the Atmospheric Sand and Dust Forecast (RSMC-ASDF). The model generates predictions for Northern Africa, Middle East, and Europe (Figure 1) and offers archived daily data with a 10 × 10 km2 spatial resolution, which was extracted and used in our study for the period between December 2015 and February 2019.
The distribution of aerosol sizes can be estimated in the model from the optical depth of the aerosols, generally between 440 nm and 870 nm. The data provided by the BSC-DREAM8b v2.0 model is at 550 nm. The aerosol size distribution is estimated with the help of the Ångstrom parameter. Values greater than 2.0 indicate fine particles of smoke or sulfates, and values close to 0 indicate the presence of coarse particles like desert dust [15].
DL (g/m2) represents the dust that is vertically integrated into the atmosphere [14]. This parameter is used in all Saharan dust forecast models, including SKIRON [16], BSC-DREAM8b v2.0, and NMMB/BSC Dust, the latter two being part of the Barcelona Supercomputing Center (BSC-CNS). DL is a basic parameter in the evaluation of concentrations and transport of Saharan dust in the lower and middle troposphere.
AOD represents the degree to which aerosols prevent the transmission of light by its absorption or scattering and is defined as the integrated extinction coefficient over a vertical column of unit cross-section [17].
The daily data for these two parameters were aggregated at monthly, seasonal, and yearly levels for both parameters analyzed in the study (AOD and DL), and monthly mean values were obtained. The same process was repeated for the absolute maximum values and the resulted values, were aggregated into the absolute maximum values for the entire analyzed interval at the annual level.
The Climate Data Operator software (CDO) from Max-Planck Institüt fur Meteorologie [18] was used in order to extract the data regarding DL and AOD and their representative statistical parameters (averages and absolute maximum values for monthly and seasonal levels).
Also, for mapping the dust parameters, the data were manipulated in the QGIS software (2.6.0 version), assigned the WGS 84 geographic reference system and then saved in raster format. Finally, they were classified in the ArcGIS 10.3 software, and the map layouts with all of the necessary elements were produced. This way, a set of monthly and seasonal maps was created.
Additionally, the annual variations of tropospheric dust over Romania, as indicated by the dust model, were obtained extracting data from points corresponding to Bucharest, Iași, and Cluj-Napoca.
Overall, the evaluation of the dust forecast model indicates a 0.51 correlation coefficient between the model outputs and the in-situ observations for 2014–2018, with a tendency of the model to underestimate the dust load [19]. However, due to this low value of the correlation coefficient, in order to reinforce our analysis for the region of Romania, we have also used ACTRIS-RO observation besides the model data.
2.3. Sun Photometer Data
The data obtained from the BSC-DREAM8b v2.0 model were analyzed at the local scale for Romania in relation to those obtained from three sun photometers’ data in Romania. In this study, normalized values from March 1, 2015, to July 31, 2018, of AOD daily average at 440 nm from three Romanian AERONET monitoring sites (part of ACTRIS-RO) were considered as follows: Iasi (Site: Iasi_LOASL, Latitude: 47.19° North, Longitude: 27.55° East, Elevation: 175.0 m), Cluj-Napoca (Site: CLUJ_UBB, Latitude: 46.76° North, Longitude: 23.55° East, Elevation: 405.0 m), and Bucharest (Site: Magurele_Inoe, Latitude: 44.34° North, Longitude: 26.03° East, Elevation: 90.0 m).
The dust present in the atmosphere is identified using the optical parameters from AERONET inversion products, level 1.5 inversion data (version 3) with AOD (at 440 nm) values greater than 0.1. Based on the clustering approach widely accepted by literature [20,21,22,23,24,25], the Absorption Ångström Exponent (AAE) and Scattering Ångström Exponent (SAE) were calculated based on the two wavelengths 440 and 675 nm for estimating the type aerosol classification.
In order to link variability in AOD to atmospheric circulation, data quality level 1.0 (version 3) from AERONET AOD (at 440 nm) measurements was used. A total of 3390 daily averaged AOD values from all three monitoring sites were analyzed. All the data were normalized (transformed into percentage), considering the highest value of AOD (equivalent to each monitoring site) from the analyzed data series.
Since level 1.0 AOD data can be considered cloud contaminated and include a wide range of atmospheric conditions [21,22], we used these apparent AOD values as AODapp normalized. The normalization was necessary taken to account that during the overcast or rainy days, the sun-photometer did not collect data (please see the case study from Section 3.5). Therefore, for these days, the value of 100% of AODapp was assigned, considering that the atmospheric transparency is close to zero during these days (that represents 28% from the daily averaged AOD values). An approximative 30% of the AODapp normalized values were associated with dust occurrence, according to the BSC-DREAM8b.v2 (Iași: 30%, Cluj–Napoca: 26%, Bucharest: 35%). Without this normalization, it would have been impossible to compare the results obtained from the model—which includes all the days regardless of the cloud cover, and the sun quality assured AERONET data—which give information only for sunny days. However, we have also analyzed the level 1.5 data from AERONET in their relation with atmospheric circulation.
Several Saharan dust studies over Romania involving remote sensing techniques [24,26,27,28,29] were already performed. In this regard, our study is meant to bring complementary information about dust load transported over long distances in relation to the atmospheric circulation. As can be observed below, no pure dust can be found over the monitoring sites, and based on the specific literature, a selection of this type of aerosols was made [20,21,22,23,24,25,30,31]. An immediate perspective of this study will be to understand the impact of mineral dust on cloud droplets development and hence on the amount of precipitation over Romania.
2.4. Atmospheric Circulation Classification
In this study, Gross Wetter Typen (GWT)—an objective method based on threshold criteria—was used as classification scheme of atmospheric circulations [32,33]. This classification was constructed using the daily mean-sea-level-pressure at 12 UTC (MSLP) data from ERA-Interim reanalysis [34] and manipulated by the cost733class software [35]. The basic idea for GWT classification is to characterize the circulation patterns in terms of varying degrees of zonality, meridionally, and vorticity of the large scale mean sea level pressure field [33].
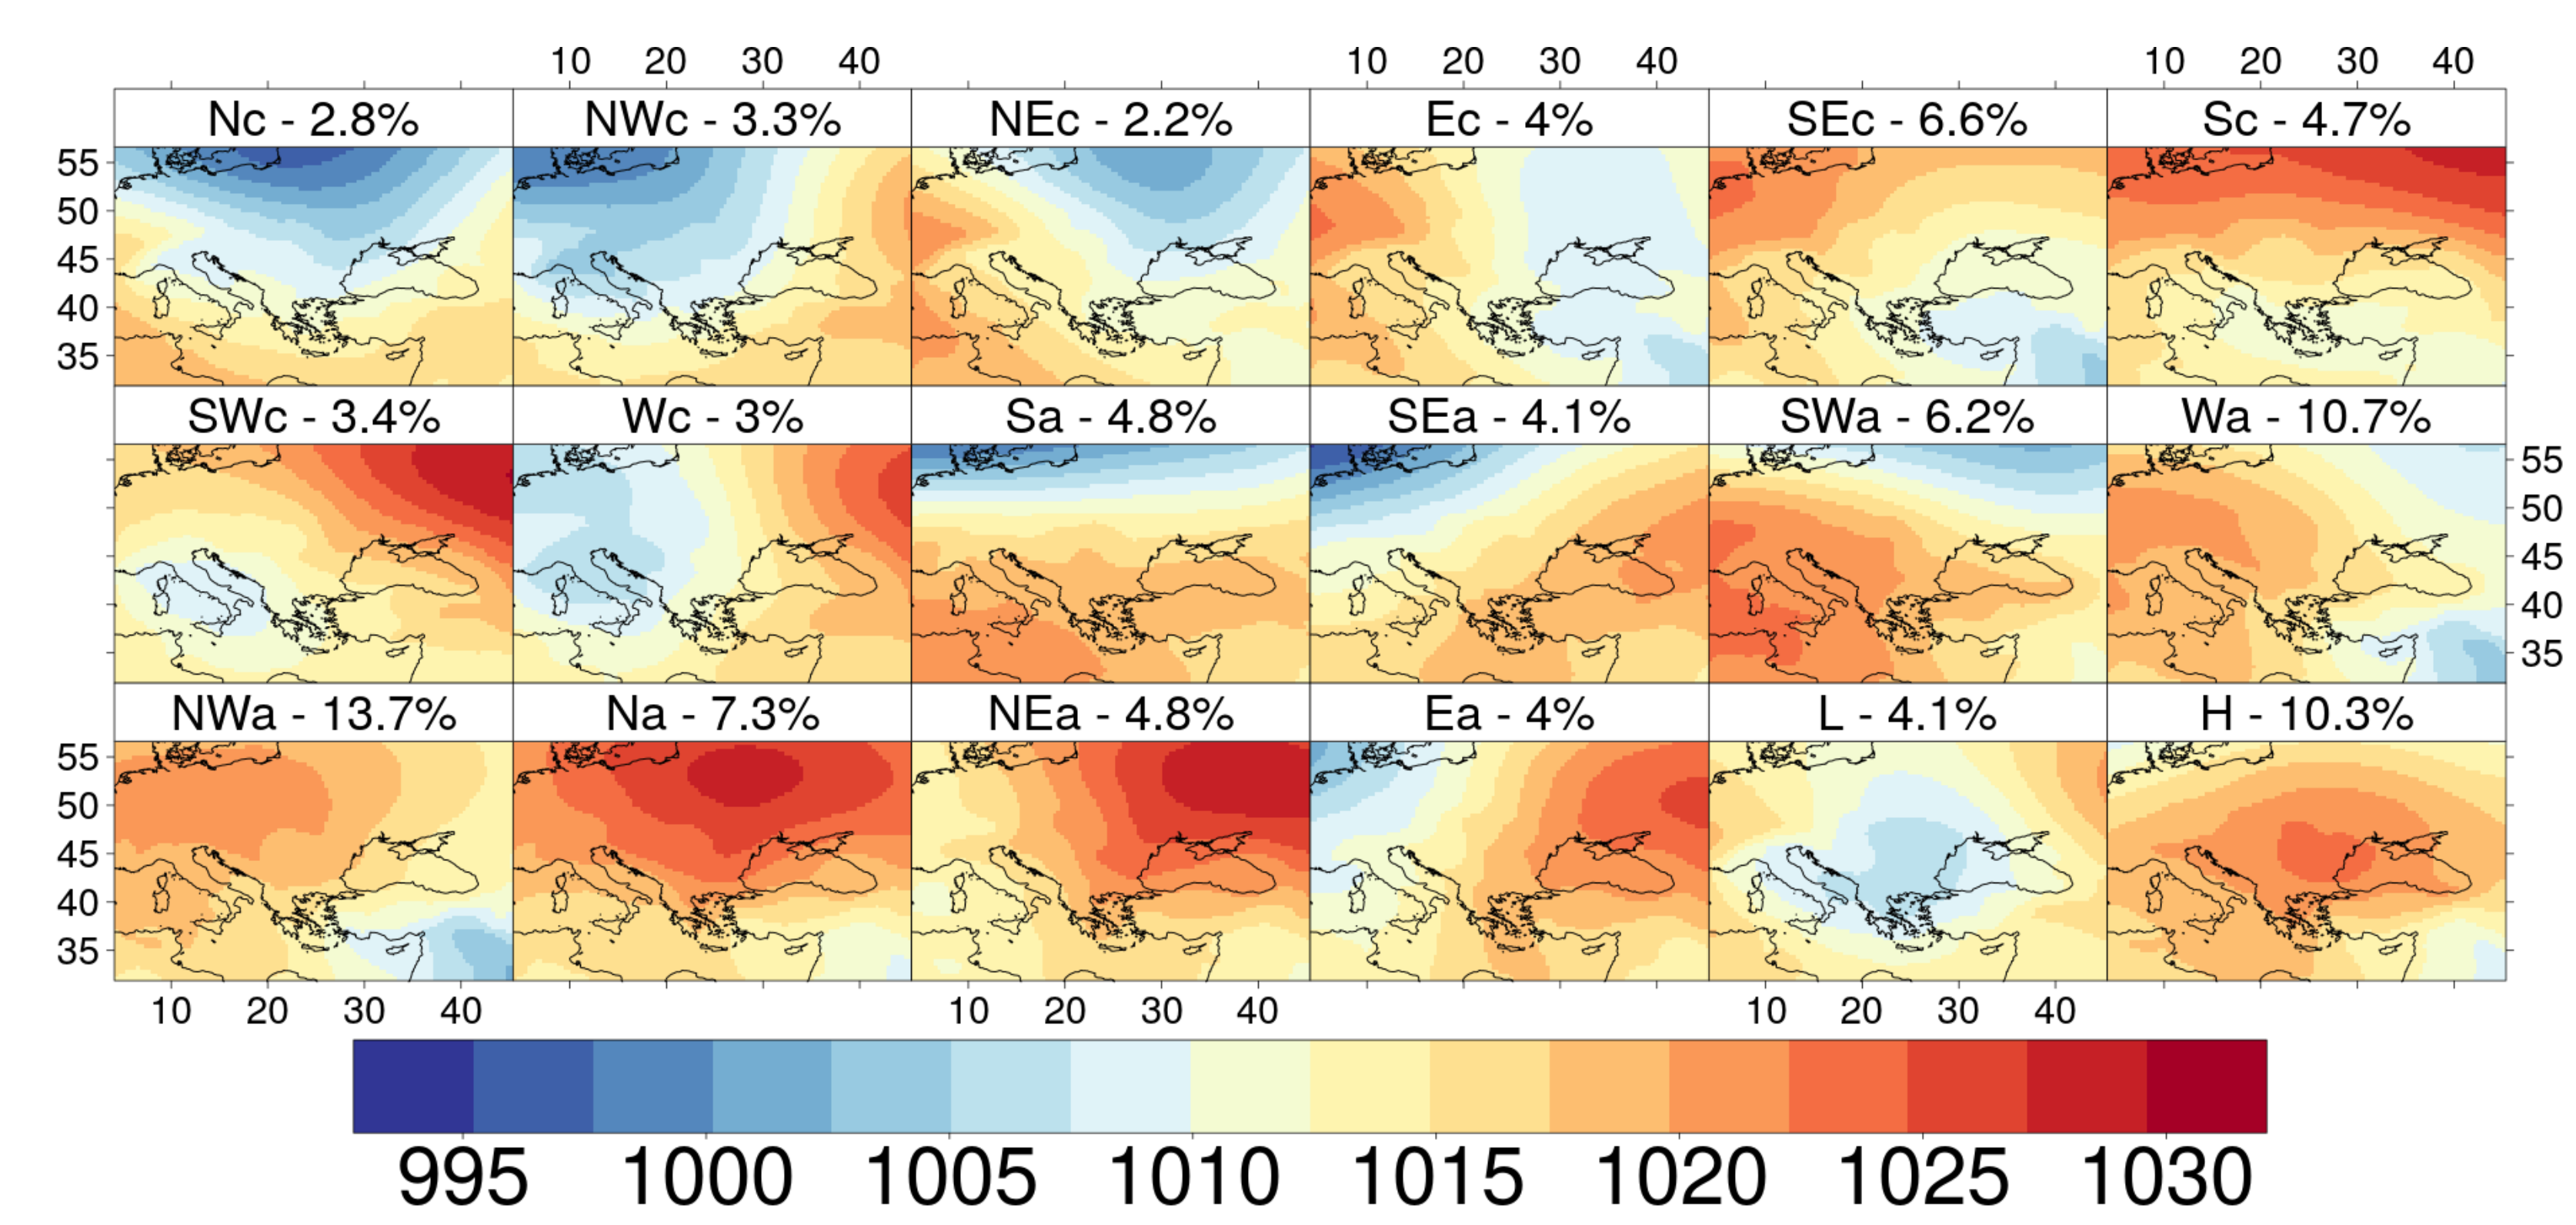
This way, a so-called objective classification of the daily synoptic pattern was conceived, having the territory of Romania in its center. This classification has 18 atmospheric circulation types, as described in Figure 2. They include cyclonic circulation types (from 1 to 9), anticyclonic circulation types (from 9 to 16), Center Low (type 17), and Center High (type 18). The classification was carried for the period 1979–2017, from which only 2015–2019 data were selected.
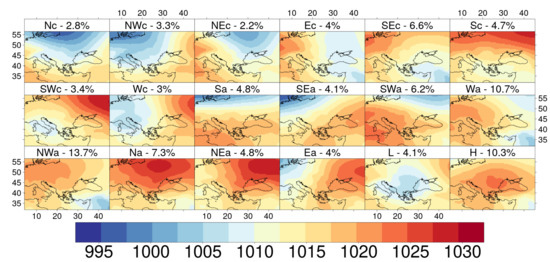
Figure 2.
Types of atmospheric circulation according to GWT classification for the region of Romania based on Sea Level Pressure (hPa); cyclonic (c) and anticyclonic (a) subtypes are separated based on the cardinal position of the pressure centers towards the center of the domain (N-north, NE-north-east, E-east, SE-south-east, S-south, SW-south-west, W-west, NW-north-west) next to cyclonic (L) and anticyclonic (H) types when these pressure centers are located over the territory of Romania.
3. Results and Discussions
3.1. The Dust over the Mediterranean Region the from Forecast Model
In order to obtain an illustration of the distribution and transport of the Saharan dust particles over Northern Africa, Mediterranean Sea basin, and most of Europe, monthly and annual maps were created for DL and AOD.
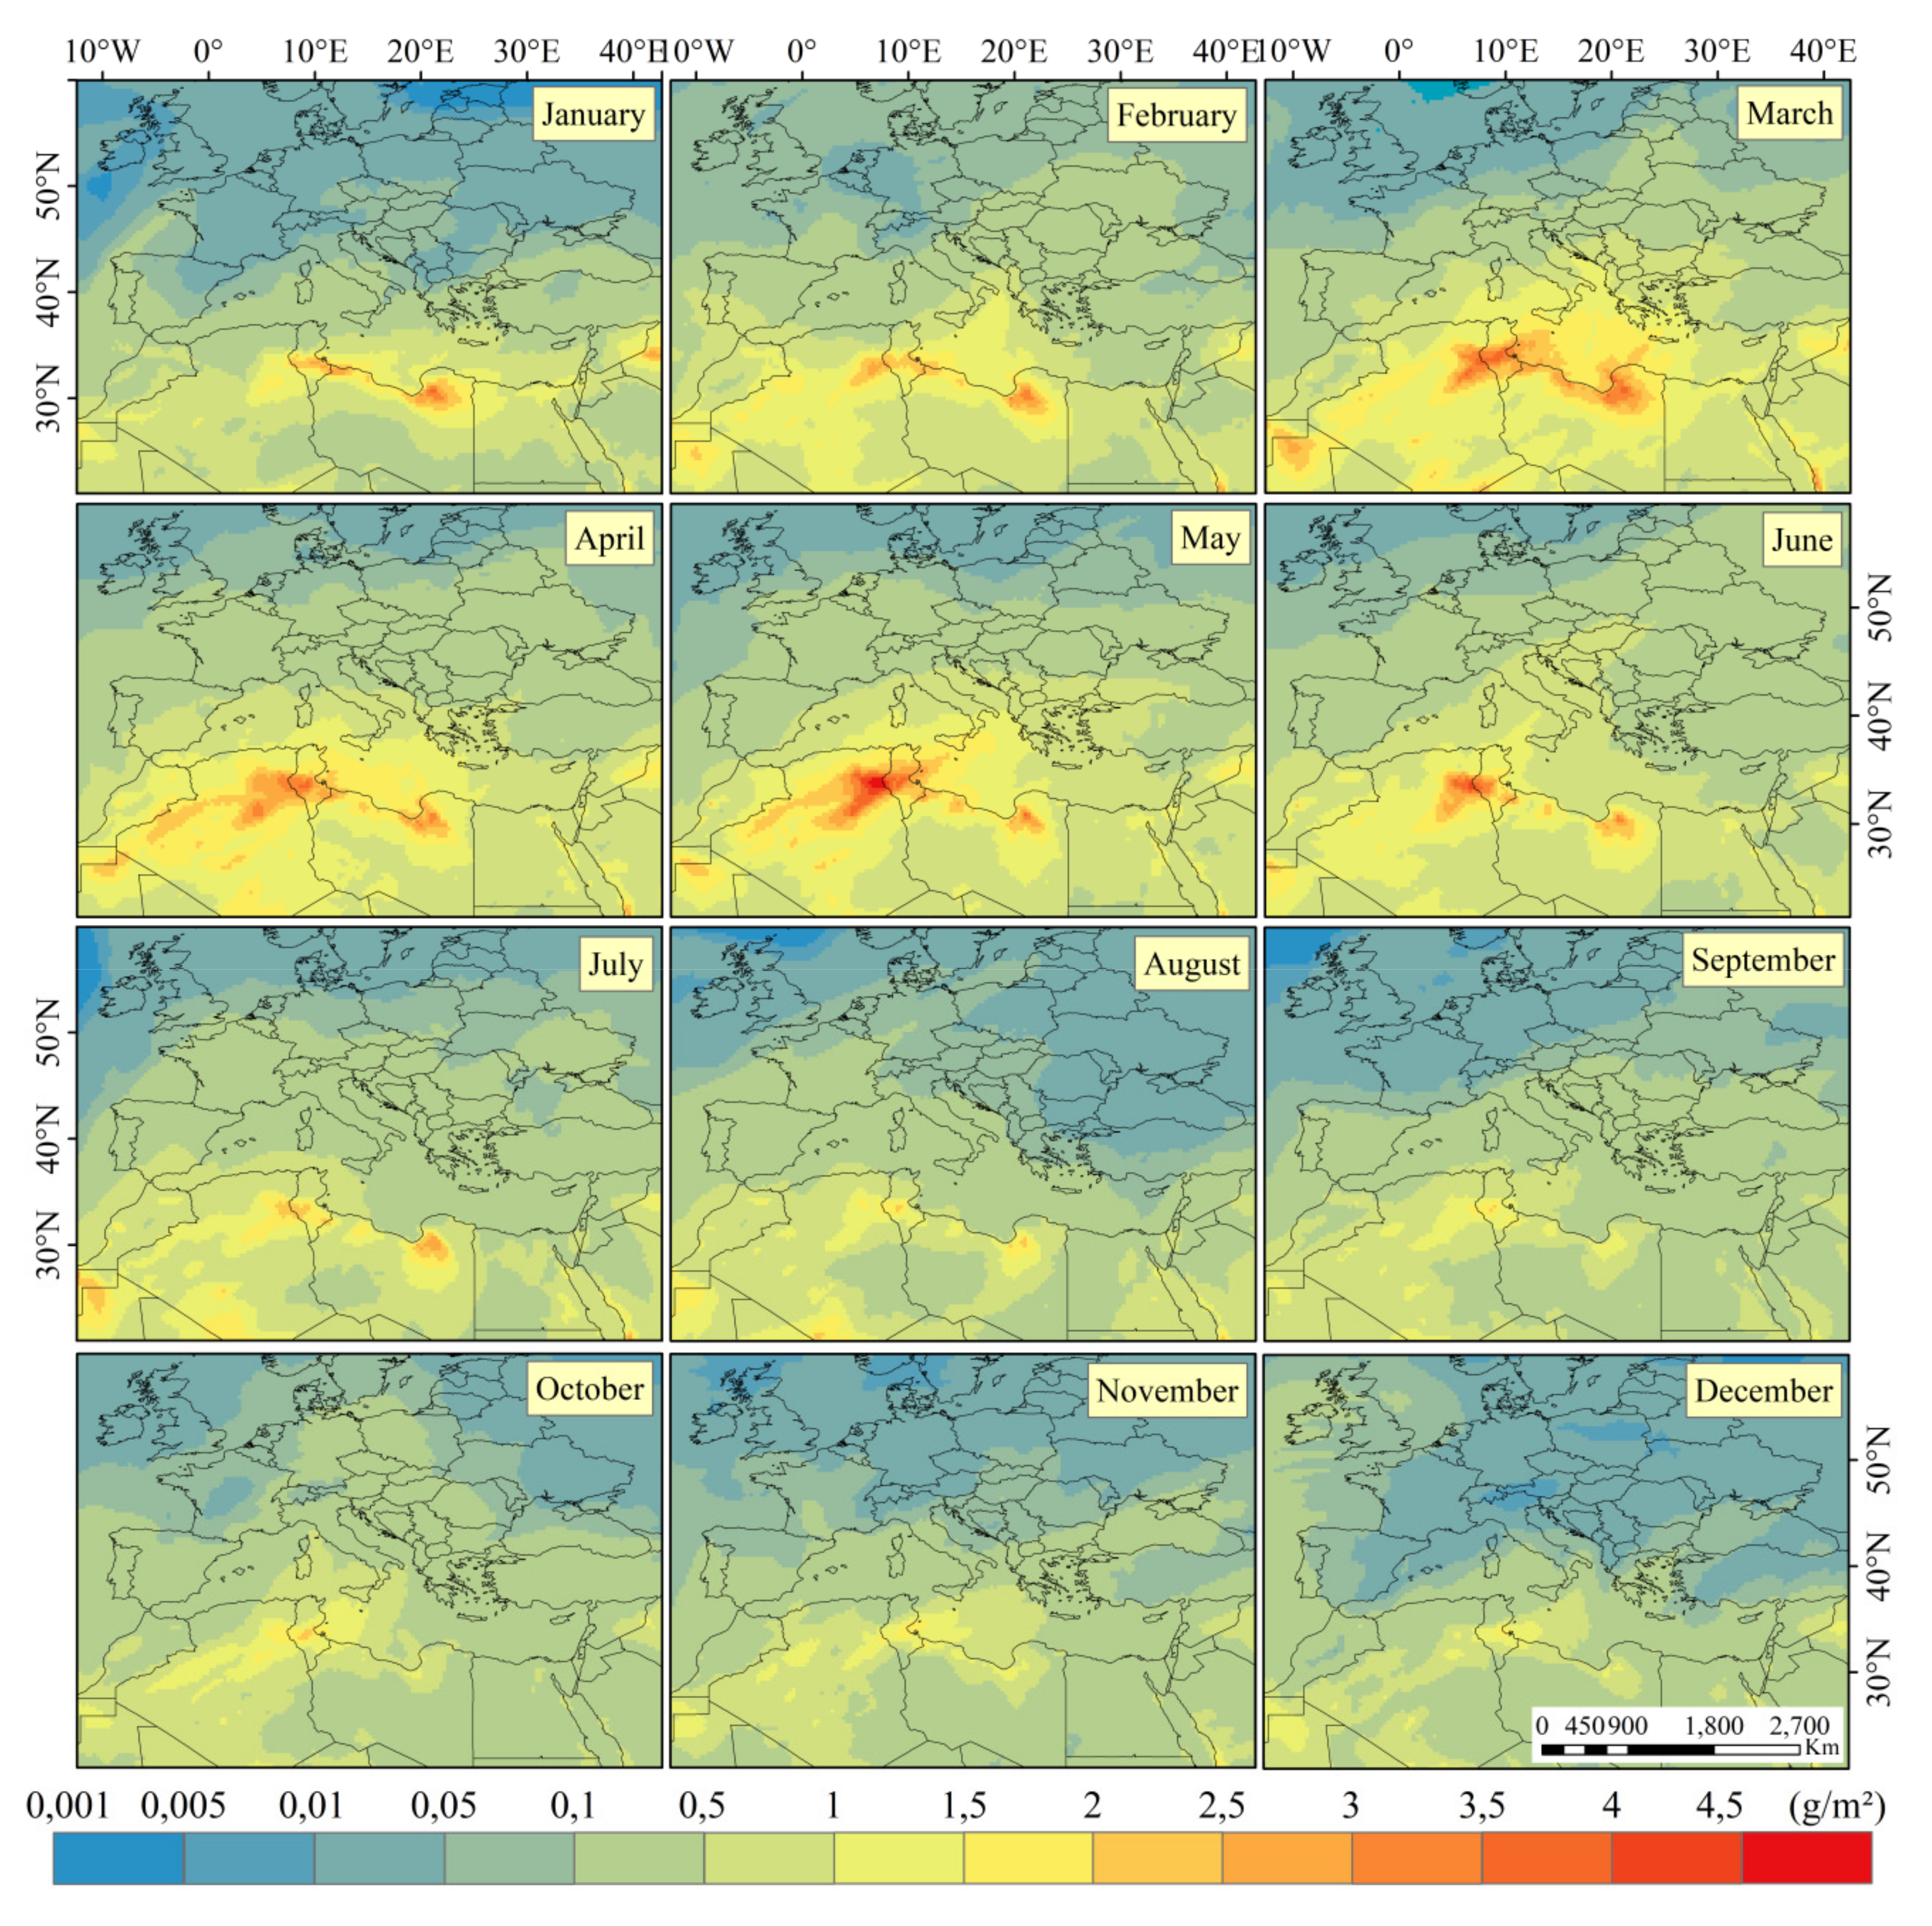
The mean maximum dust load over the study region (Figure 3) has a maximum peak from January to June, while the minimum is reached during the autumn and the beginning of winter. This temporal distribution is due to the characteristics of the atmospheric circulation during winter and spring. Throughout this period, the Mediterranean basin and the surrounding areas are under the influence of two types of jet streams: one of polar origin, which is usually located over the Northern and Central Europe, and a second one, the subtropical jet stream, being usually located above Northern Africa. The combined effects of these two jet streams favor the extension of the Mediterranean cyclones with their strong pressure gradient on the ground level, inducing a higher chance for the transport of dust particles over the Mediterranean Sea and the neighboring regions [36].
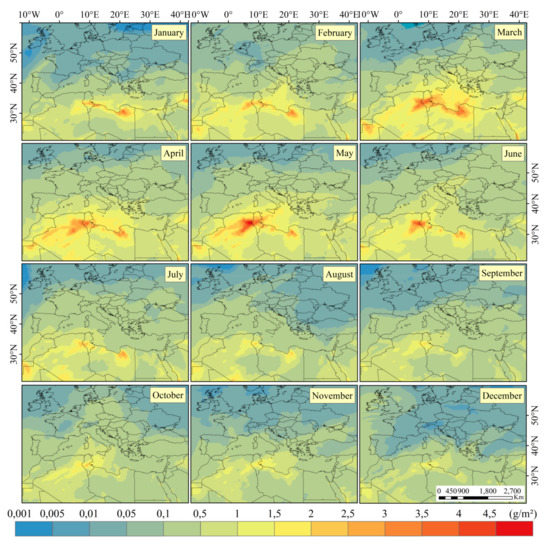
Figure 3.
Spatial distribution of the monthly mean maximum DL (December 2015–February 2019).
From a spatial point of view, it is obvious that the highest dust load over the entire analyzed region is centered on the Great Oriental Erg over Algeria. Especially from March to June, this region represents the most important source of Saharan dust. The Northern position of this erg in the Saharan desert favors the dust transport, due to the strong air pressure gradients within the Mediterranean cyclones that can spread over the region. High dust load values are also found along the Mediterranean coast of the Libyan desert, especially in March, when the Mediterranean cyclones are more intense and frequent over this region.
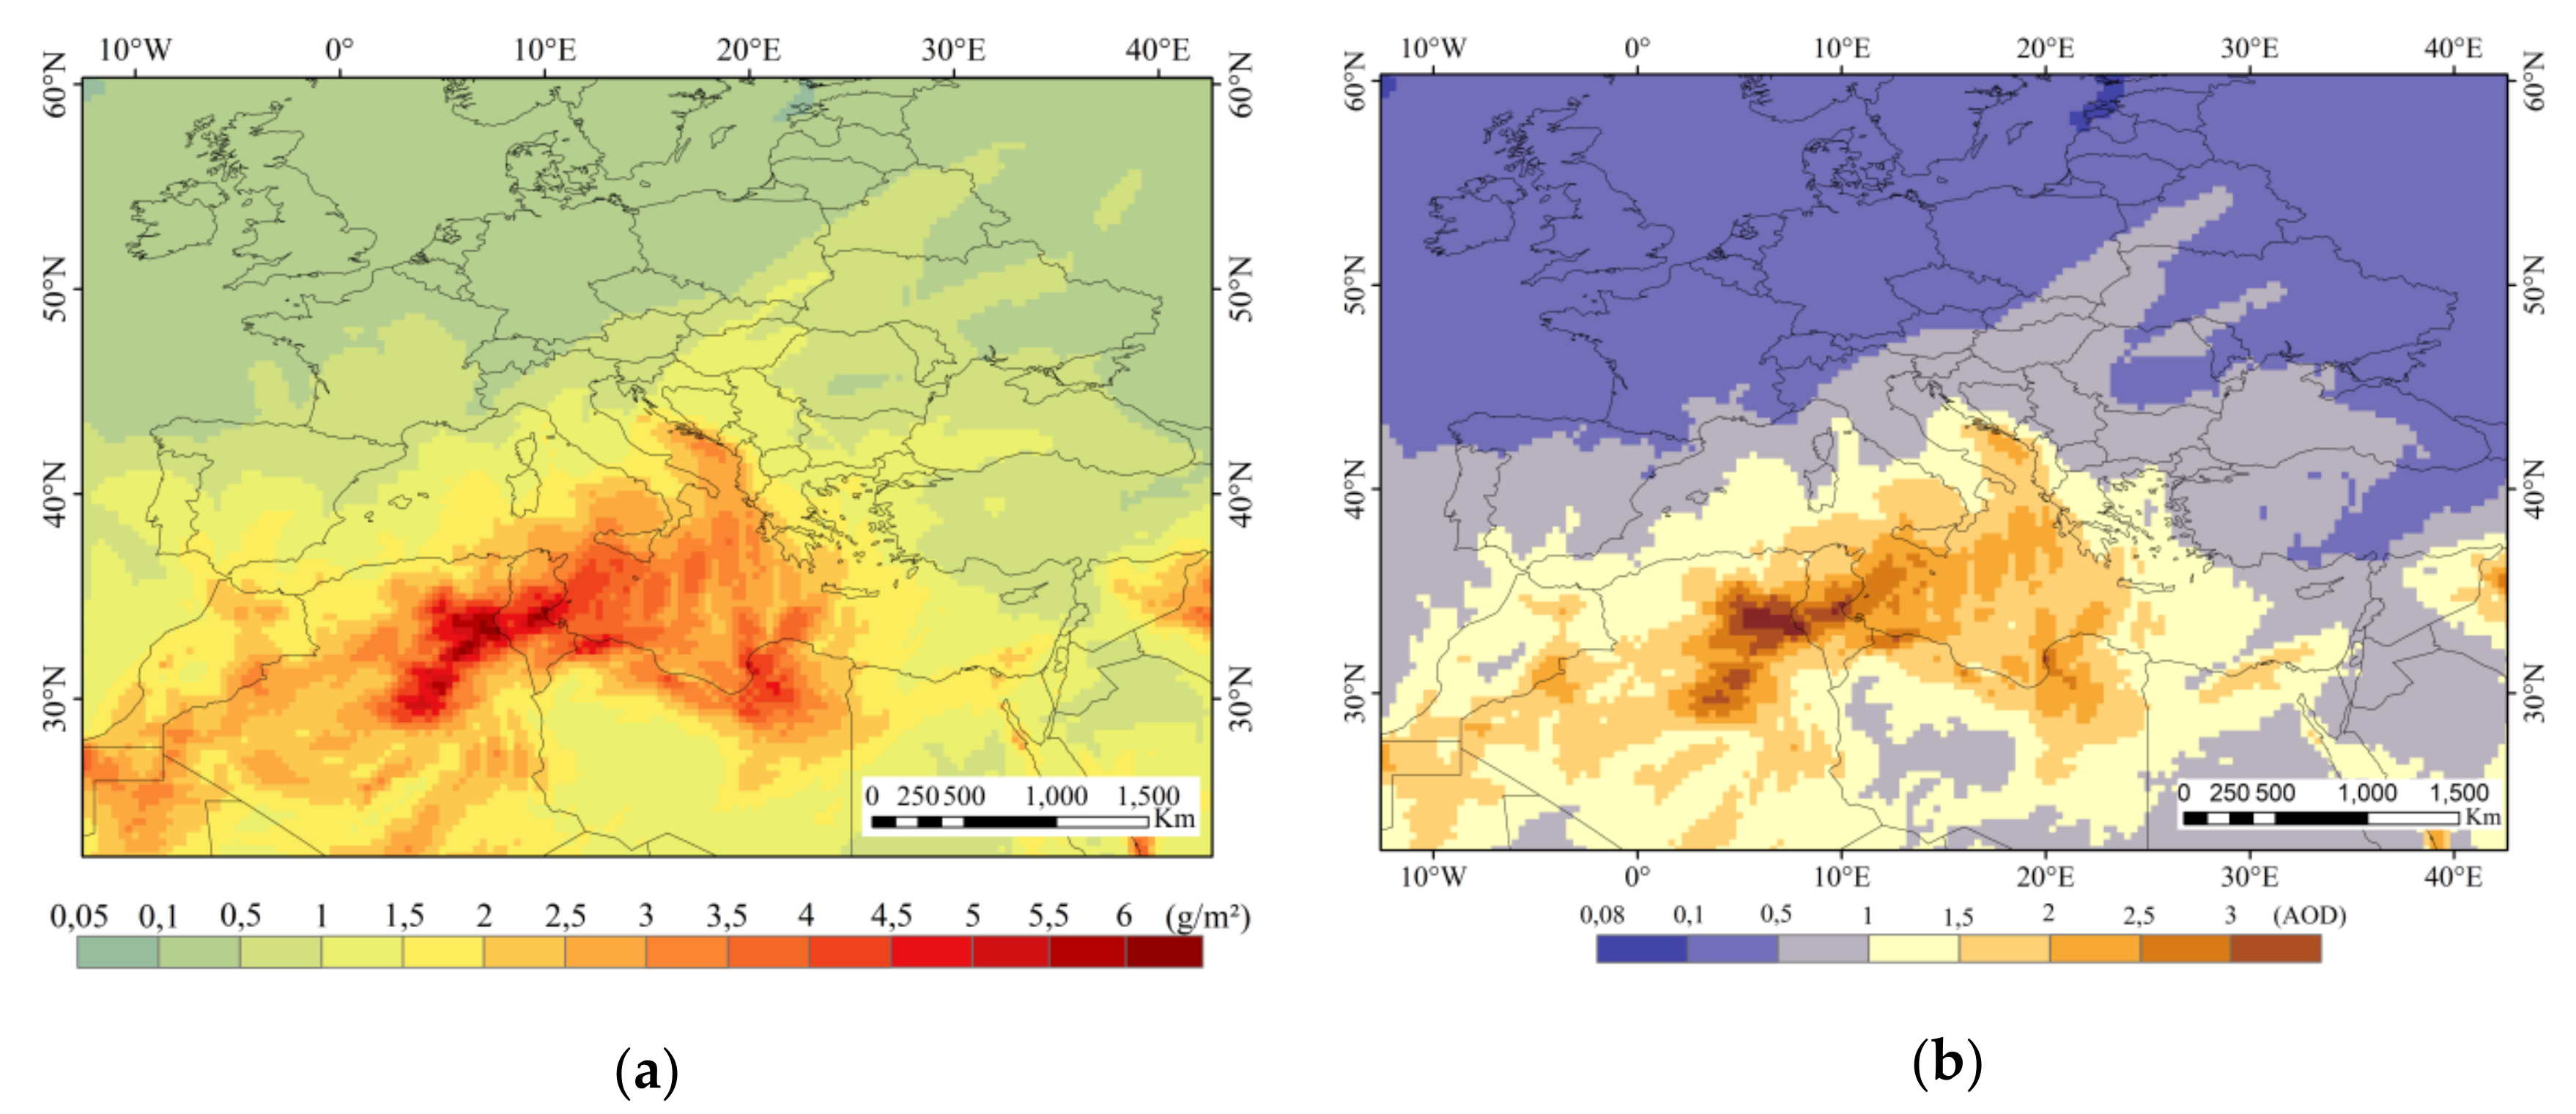
The spatial distribution of the AOD shows that the area with dust particles transport replicates quite well that of the DL (Figure 4). However, considering the fact that we represented the maximum absolute values of both parameters, we should underline that these values could be imprinted by some extreme dust events recorded during the study period.
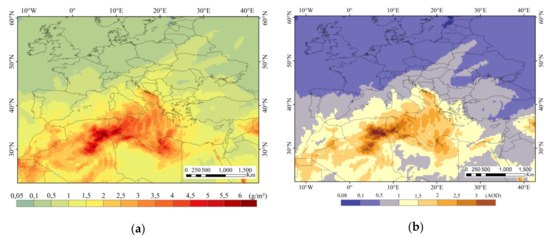
Figure 4.
Spatial distribution of the absolute maximum multi-annual values of the DL (a) and AOD (b) between December 2015–February 2019.
At the same time, we consider that illustrating the distribution of the absolute maximum multi-annual values is the most representative because it highlights the main synoptic cause of the intensive transport of the Saharan dust particles towards Europe indirectly. Therefore, analyzing Figure 4, it can be easily be observed that the higher dust load is recorded in central and North-Eastern Algeria, Tunisia, and the Mediterranean coast of Libya towards the central Mediterranean on a south-west-north-east direction. Also, the highest dust load is reached over the main source region of dust—the above-mentioned Grand Oriental Erg in Algeria—where values of dust load can reach up to 6.5 g/m2, while the values of optical depth can reach 3.5 for AOD. A higher dust load is also found over the Central Mediterranean (3–5 g/m2; 1.5–2.5 for AOD) from Sicily to Crete with increased values over the Southern part of the Adriatic Sea. Toward the North-East, the limit is very clearly imposed by the Western part of the Balkan Peninsula, where the mountains alter the dust transport through orographic convection and the resulted precipitation.
3.2. The Dust Load over Romania from Forecast Model
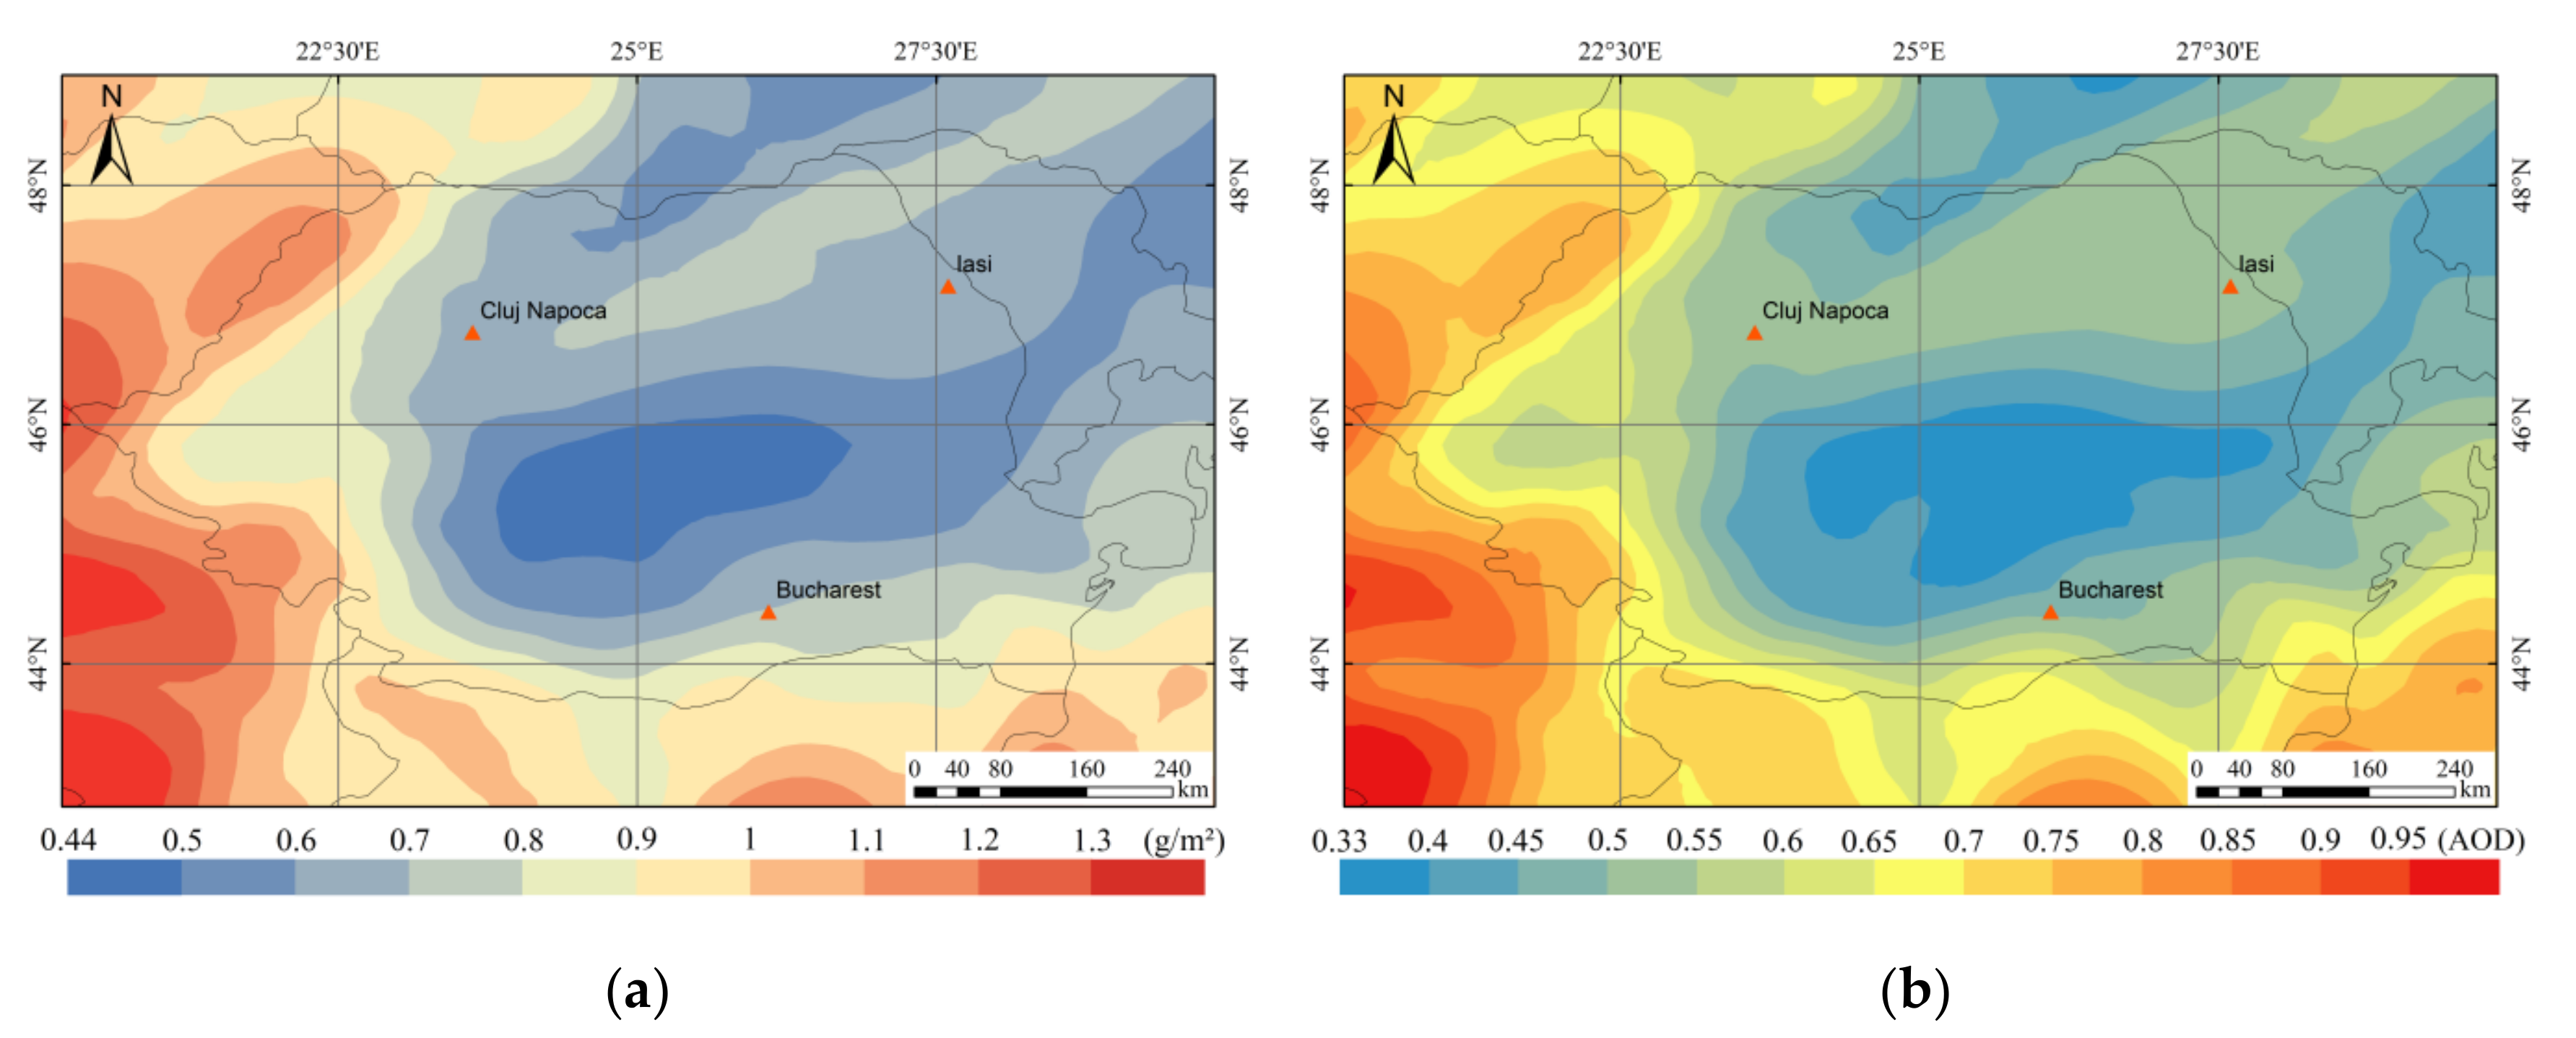
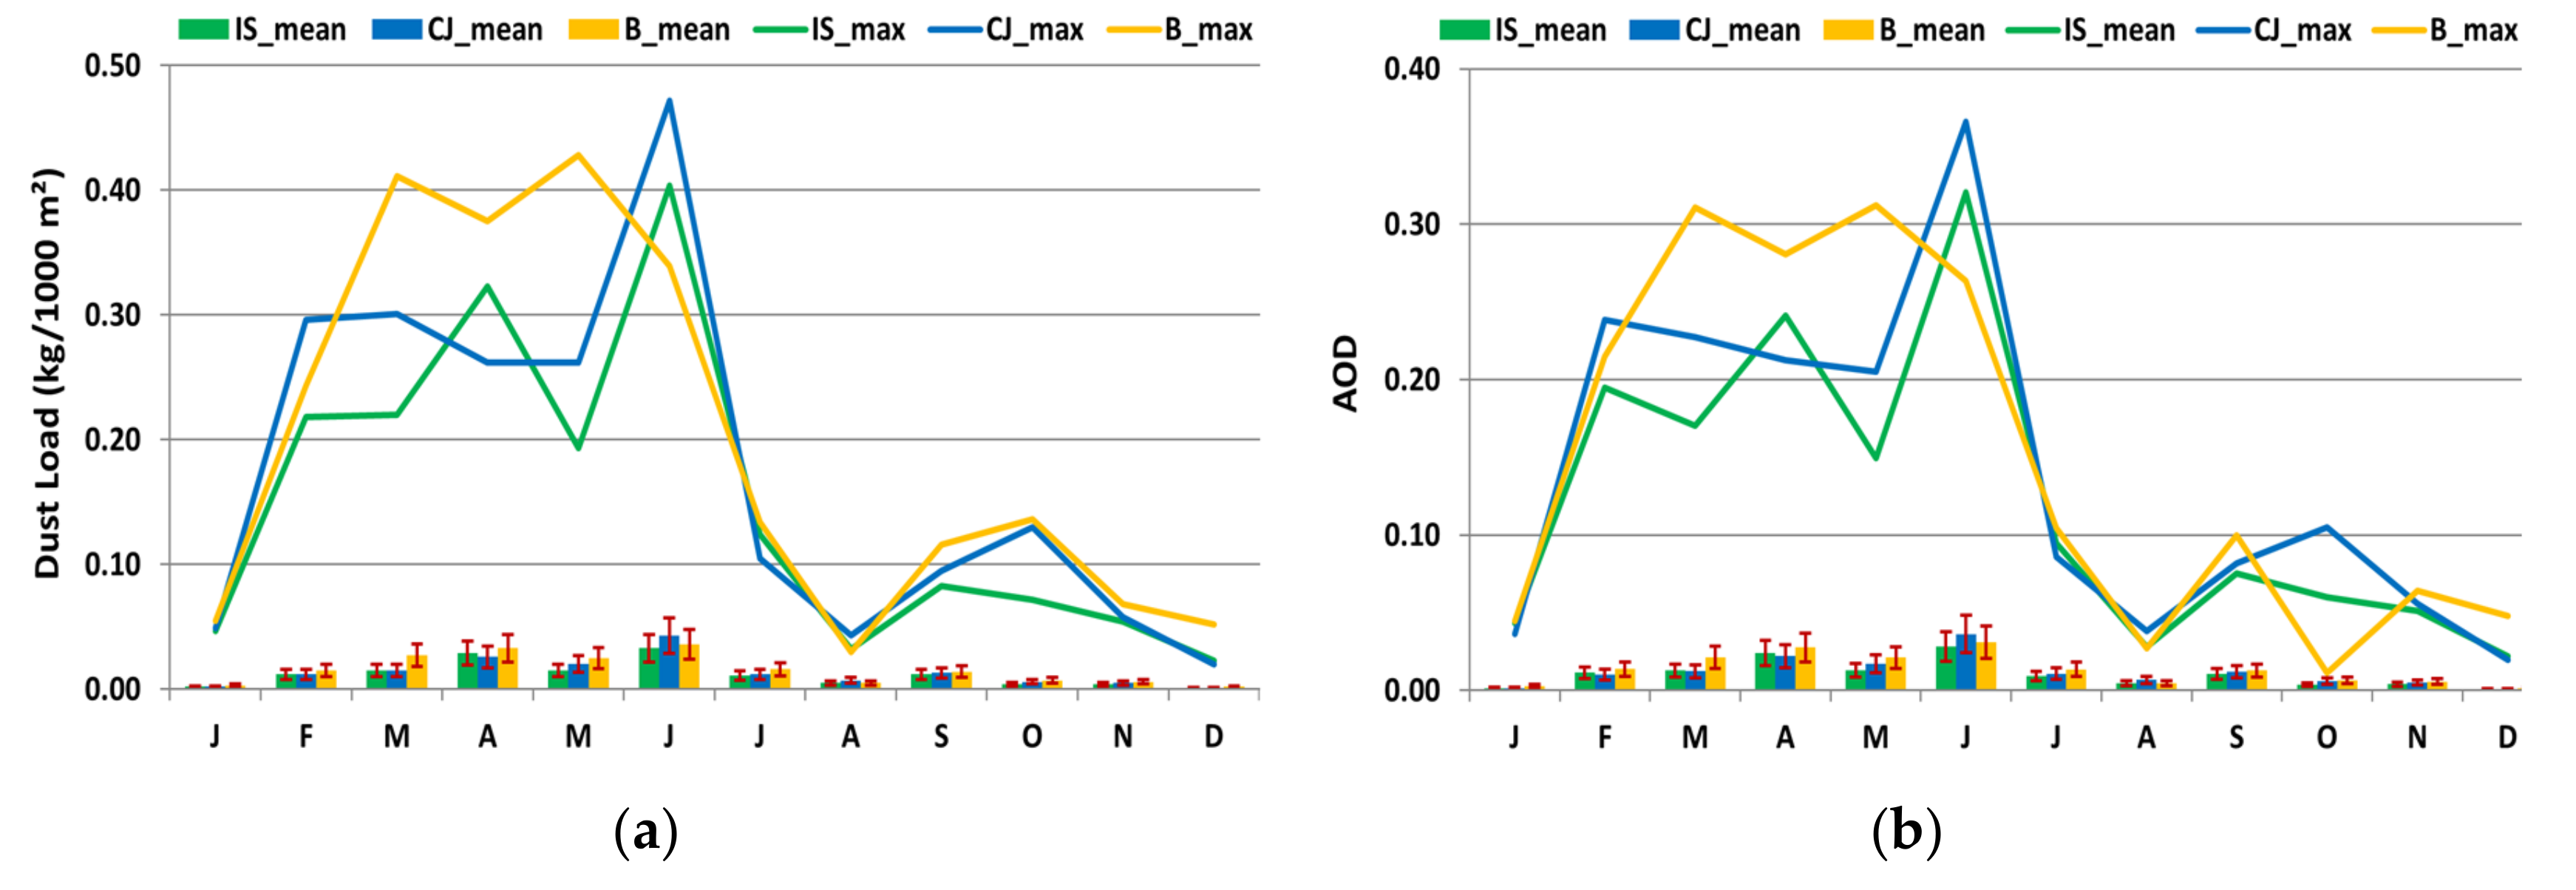
Since the territory of Romania is placed on the pathway of the North-Eastward dust transport from the North of Africa, it is more probable that a higher dust load can occur more frequently in the Western and Southern parts of the country, as we can see in Figure 5. We can observe the highest values of DL and AOD being located just along the Southern and Western Romania. Therefore, the dust load could be sometimes higher in Bucharest and Cluj-Napoca than in Iași (Figure 6).
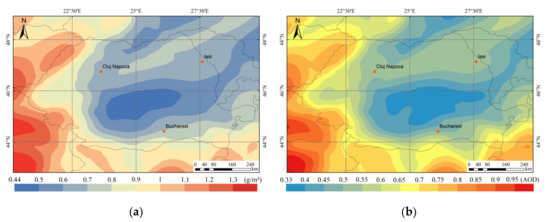
Figure 5.
The distribution of the absolute maximum values of DL (a) and AOD (b) over Romania between December 2015–February 2019.
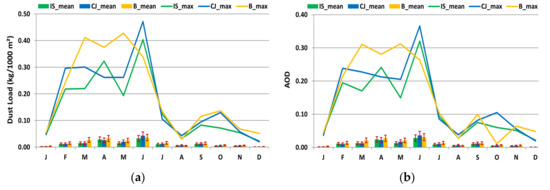
Figure 6.
The distribution of the multi-monthly mean (columns) and absolute maximum (lines) for DL (a) and AOD (b) between December 2015–February 2019 over Iași (IS), Cluj-Napoca (CJ), and Bucharest (B).
It is worth mentioning that the territory of Romania represents a region marking a steep decrease of the dust load north of the Mediterranean in the region of the Balkan Peninsula. This decrease is most probably due to the orographic barrier in the region of Romania, the dust particles being retained South of the Balkan Mountains, Dinaric Alps, and after that by the Carpathian Mountains. Mostly due to this effect, in Romania, the lowest values of the analyzed parameters are recorded in the North-East of the country. Consequently, in Iași (situated in the Northeastern part of Romania), a smaller amount of dust particles with the Saharan origin is recorded, since the advection of air masses from southern Europe must cross a longer path until this point.
Also, it can be observed that the dust season on the territory of Romania extends mainly from February to June (Figure 6). Due to this pattern of dust advections and the higher values of precipitation amount during May and June [37], the dust events from February to April are easier to be observed, as the orange snow event from March 2018 [26], since a certain amount of dust has a bigger chance to be dispersed in a smaller amount of precipitation. Cluj-Napoca and Iași have the highest values in June for both DL and AOD, while over Bucharest, the values of the two parameters are more uniformly distributed from March to May. A cause for these higher values in the South of Romania, especially during the spring season, is represented by the high occurrence of the Mediterranean cyclones that cross the Balkan peninsula, transporting dust particles from Northern Africa and affecting only the Southern part of Romania [38].
From this data, we can observe that the contribution of natural mineral dust to air pollution in Romania is overall minor also because they occur during spring when the dispersion is higher due to higher wind speed in the region of Romania [36].
3.3. Dust Occurrence over Romania from AERONET—ACTRIS-RO Observations
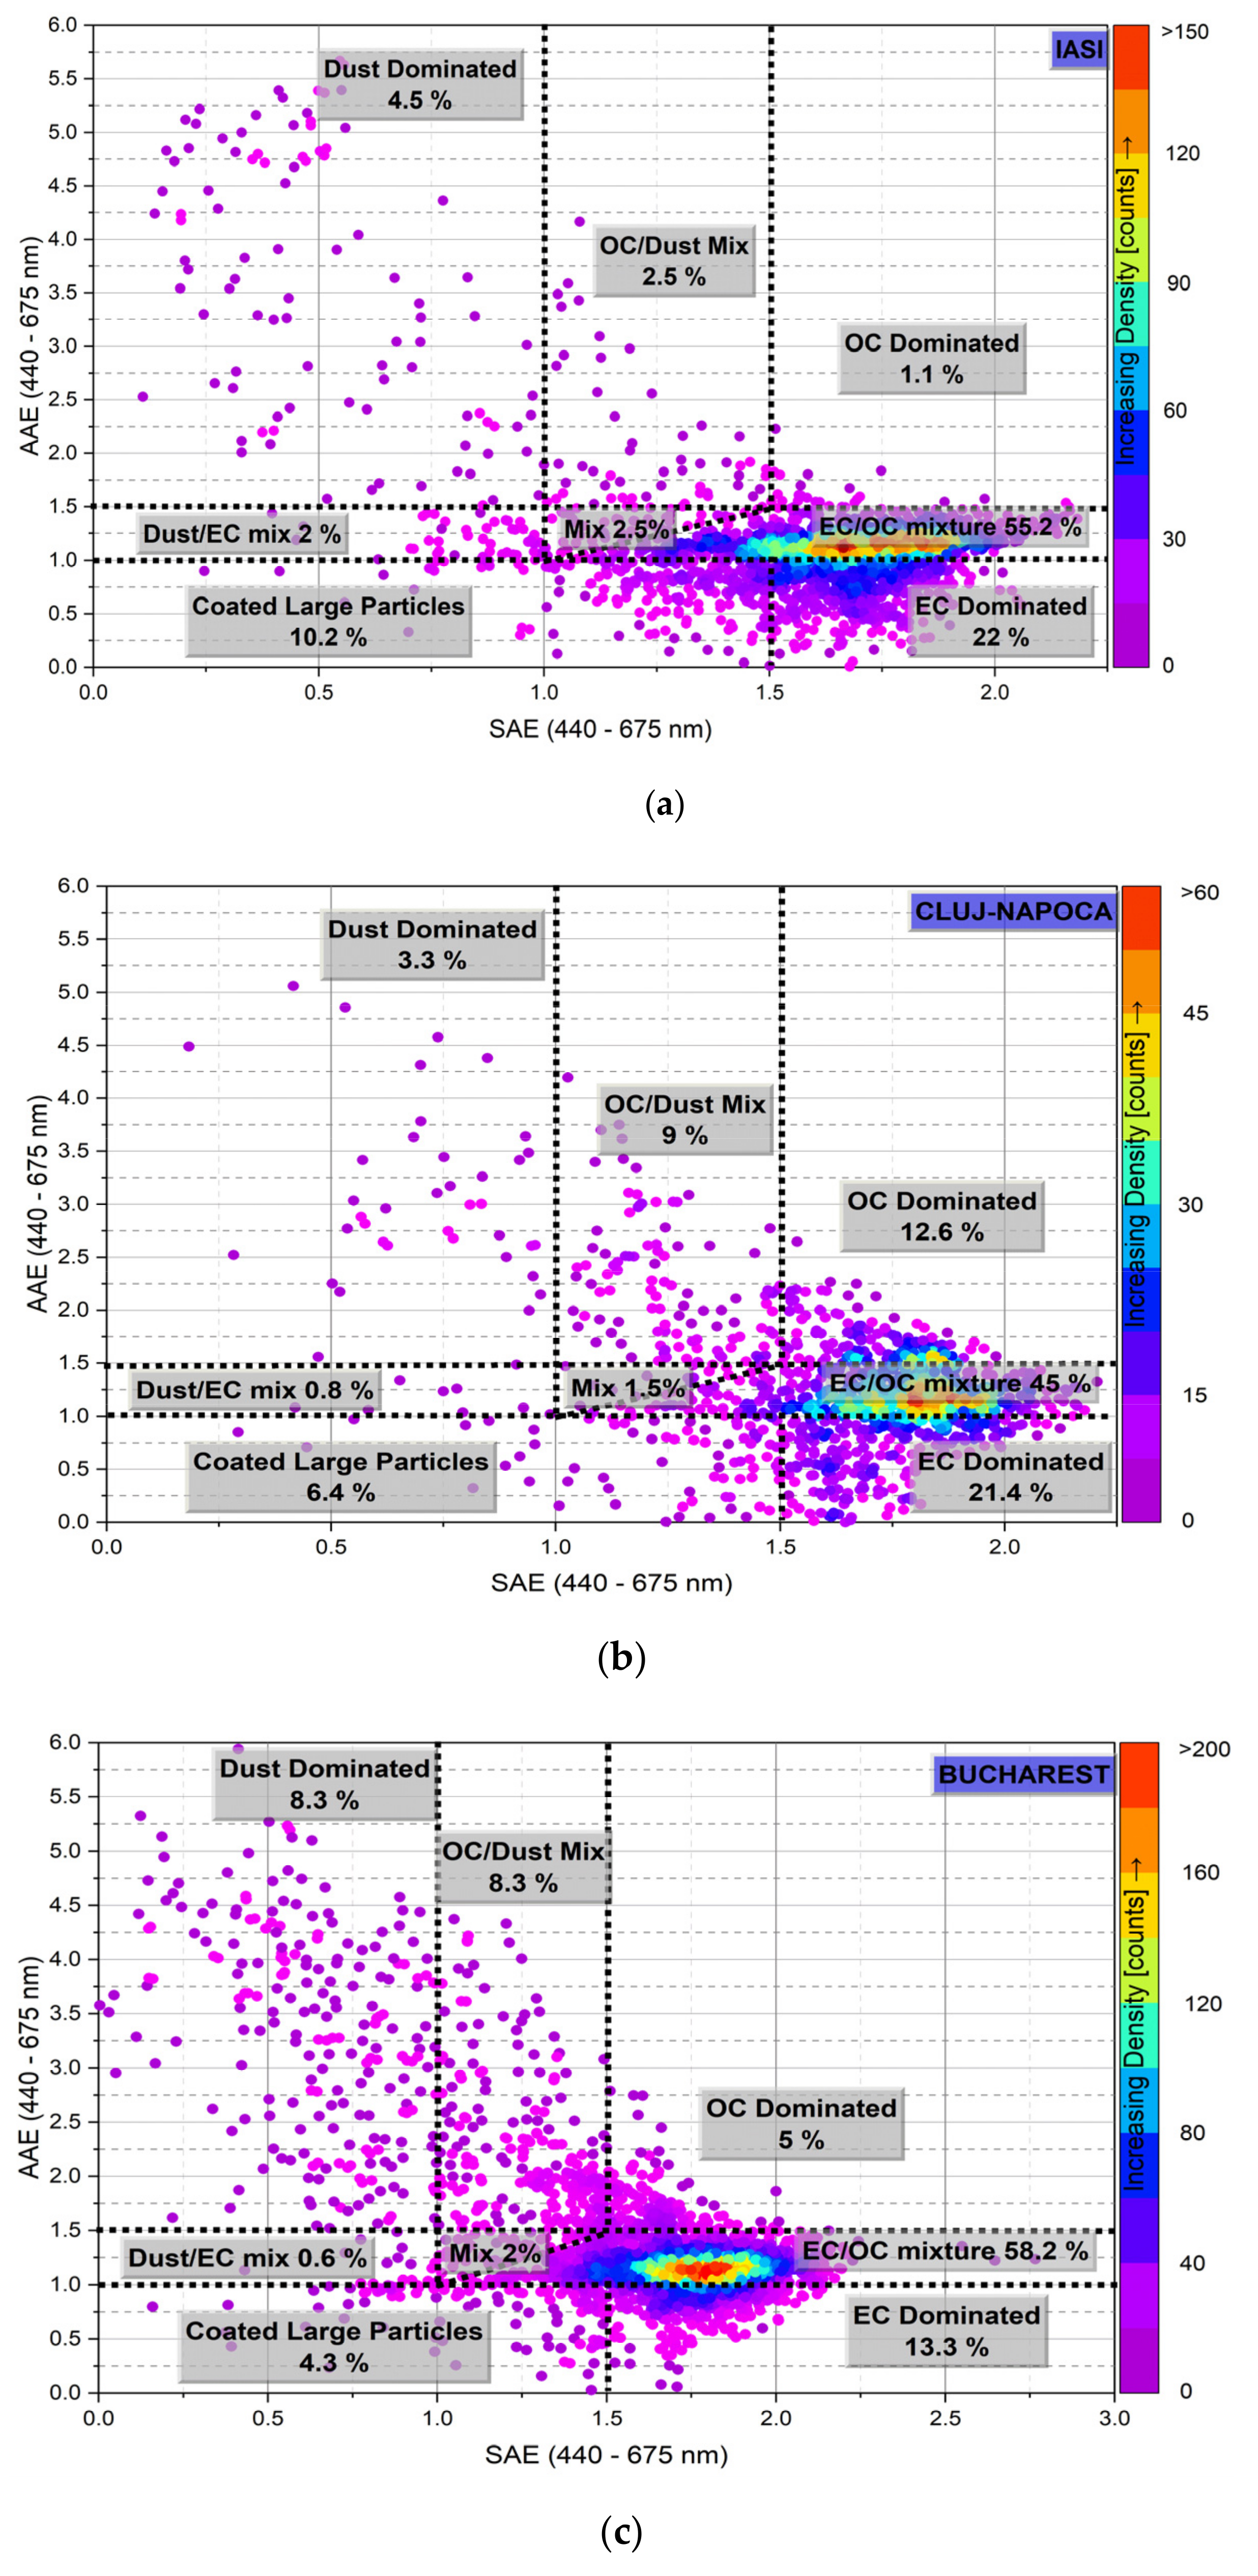
Based on the clustering approach about the aerosol type identification uncertainness [19,20,21,22,23,24,29,30], the Iași_LOASL, Cluj_UBB and Măgurele_Inoe data of all measurements during the March 2015–July 2018 period can be characterized as dominated by the occurrence of the elemental carbon (EC) and organic carbon (OC) mixture (fine mode particles) in the 55.2%, 45.1% and 58.2% of cases, respectively (see EC/OC mixture from Figure 7). Sfîcă et al. [25] already reported for the Iași site that the EC/OC mixture type dominates the division of AAE vs. SAE in number density plot. One of the reasons for the EC/OC mixture occurrence is the presence of urban/industrial aerosols type (e.g., combustion of fossil fuel from urban/industrial processes) over the ACTRIS-RO monitoring sites that have been mostly observed in recent years through aerosol type classification and its optical properties studies by using the AERONET data [39,40,41,42].
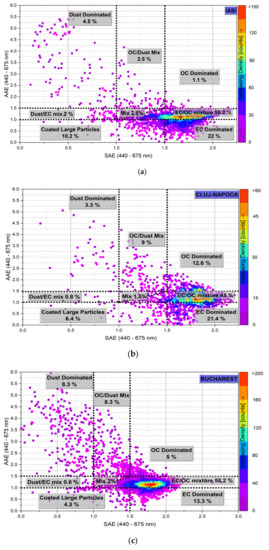
Figure 7.
Division of the Absorption Ångström Exponent [AAE at 440–675 nm] Scattering Ångström Exponent [SAE at 440–675 nm] in the number density plot [March of 2015–July of 2018] from (a) Iasi, Iasi_LOASL monitoring site (b) Cluj–Napoca, Cluj_UBB monitoring site, and (c) Bucharest, Magurele_INOE monitoring site.
The fine particles, labeled as “EC dominated” in Figure 7, indicate the biomass burning or the soot particle’s presence. High EC episodes occurred around 22.1% and 21.4% at the Iași and Cluj–Napoca, respectively. Reported case studies have shown that the presence of fine particles type is specific for the spring and winter seasons [25,30,40,41,43,44]. In contrast, for Bucharest, the EC dominated occurred with a presence of up to 13.3%.
Since no pure EC or OC can be found over the monitoring sites, the fine particles emitted from primary and secondary fossil fuel sources can be found as classified as “OC dominated” in Figure 7 beside EC and EC/OC mixtures. For Cluj-Napoca, almost 13% of the aerosol contribution corresponds to an OC dominated. On the other hand, for Bucharest and Iași, the OC dominated impact occurs up to 5% and 1% of cases, respectively.
Marked as “Coated Large Particles”, this type of AAE vs. SAE division occurs in the 10.2%, 6.4% and 4.3% of cases to Iași, Cluj–Napoca, and Bucharest, respectively. According to the literature, coated large particles are strong absorbers of direct solar radiation (i.e., coated black carbon, polluted dust) [20,44].
In brief, despite the fact that the optical parameters are affected by a major contribution of the urban/industrial activity (EC, OC and EC/OC mixture summing up to 78.3% for Iași, 79.1% for Cluj-Napoca and 76.5% for Bucharest), a small but considerable proportion of OC/dust mix (Iași: 2.5%, Cluj–Napoca: 9.0%, Bucharest: 8.3%), and dust/EC mix (Iași: 2.1%, Cluj–Napoca: 0.8%, Bucharest: 0.6%) occur. This sum up 4.6% for Iași, 9.8% for Cluj–Napoca, and 8.9% for Bucharest. As a preliminary observation and in the context of missing additional experimental data, it seems that based on the SAE-AAE scatter plots, aerosol over the Iasi site shows a predominant mixing of dust with EC (about 2%), whereas for Cluj–Napoca and Bucharest the dominance is of OC mixed with dust (about 9% and about 8.3 %, respectively). Due to the cumulative effect from several pollution sources and physical and chemical processes, the impact over the entire atmosphere is difficult to distinguish, and a mixed state between the other aerosols types occurs as follows: Iași: 2.5%, Cluj–Napoca: 1.5%, and Bucharest: 2.0%. Pure mineral dust over these sites is not a considerable source, but the coarse particles labeled as “Dust dominated” occur with Saharan dust intrusion events. Thus, almost 4.5% of the dust dominated is present at Iași, of 3.3% at Cluj–Napoca and of 8.4% at Bucharest, which is in line with data obtained from the dust model previously. These data underline once again that the direct contribution of Saharan dust to the air pollution in Romania is minor and occasional. Also, these values correspond to a higher dust load within the aerosol types assessed for Europe from the European Aerosol Research Lidar Network (EARLINET) measurements [30].
The above results are complementary to the results already reported in scientific studies, confirming Saharan dust intrusion events [24,26,27,29,41]. Due to the main influence of the local air pollution sources, when certain Saharan dust events occurs, the optical parameters are affected. Thus, the correlations with circulation types are useful in order to observe the main influence of long-range transport over to the AOD values.
3.4. Dust Driven by Atmospheric Circulation
As mentioned above, the maps in Figure 4 highlight the synoptic causes, which lead to dust transport over Europe. According to Ansmann et al. [12], the most favorable conditions for an intensive long-range dust transport are the ones where an Atlantic trough is extending southward, reaching the West coast of Morocco, and then coupling with an anticyclonic formation over North Africa or even over the Mediterranean Sea basin. This coupling, associated with a strong pressure gradient on the ground, having the capacity of rising the dust particles into the atmosphere, can lead to an intensive southerly circulation over Europe, which sometimes lasts for a few days and has the capacity of transporting the dust particles over long distances.
This type of synoptic pattern at a continental scale usually generates heat waves over South and South-Eastern Europe, including the territory of Romania. The associated atmospheric circulation can transport dust particles from Libya at surface level, as well as from Northern Africa up to 1500 and 5000 m altitude [45]. In order for this to take place, there must be a strong pressure gradient over the dust particles source region. Thus, the intensity of the wind caused by the baric gradient has the capacity of carrying dust particles from the ground to very high altitudes and transport them over long distances.
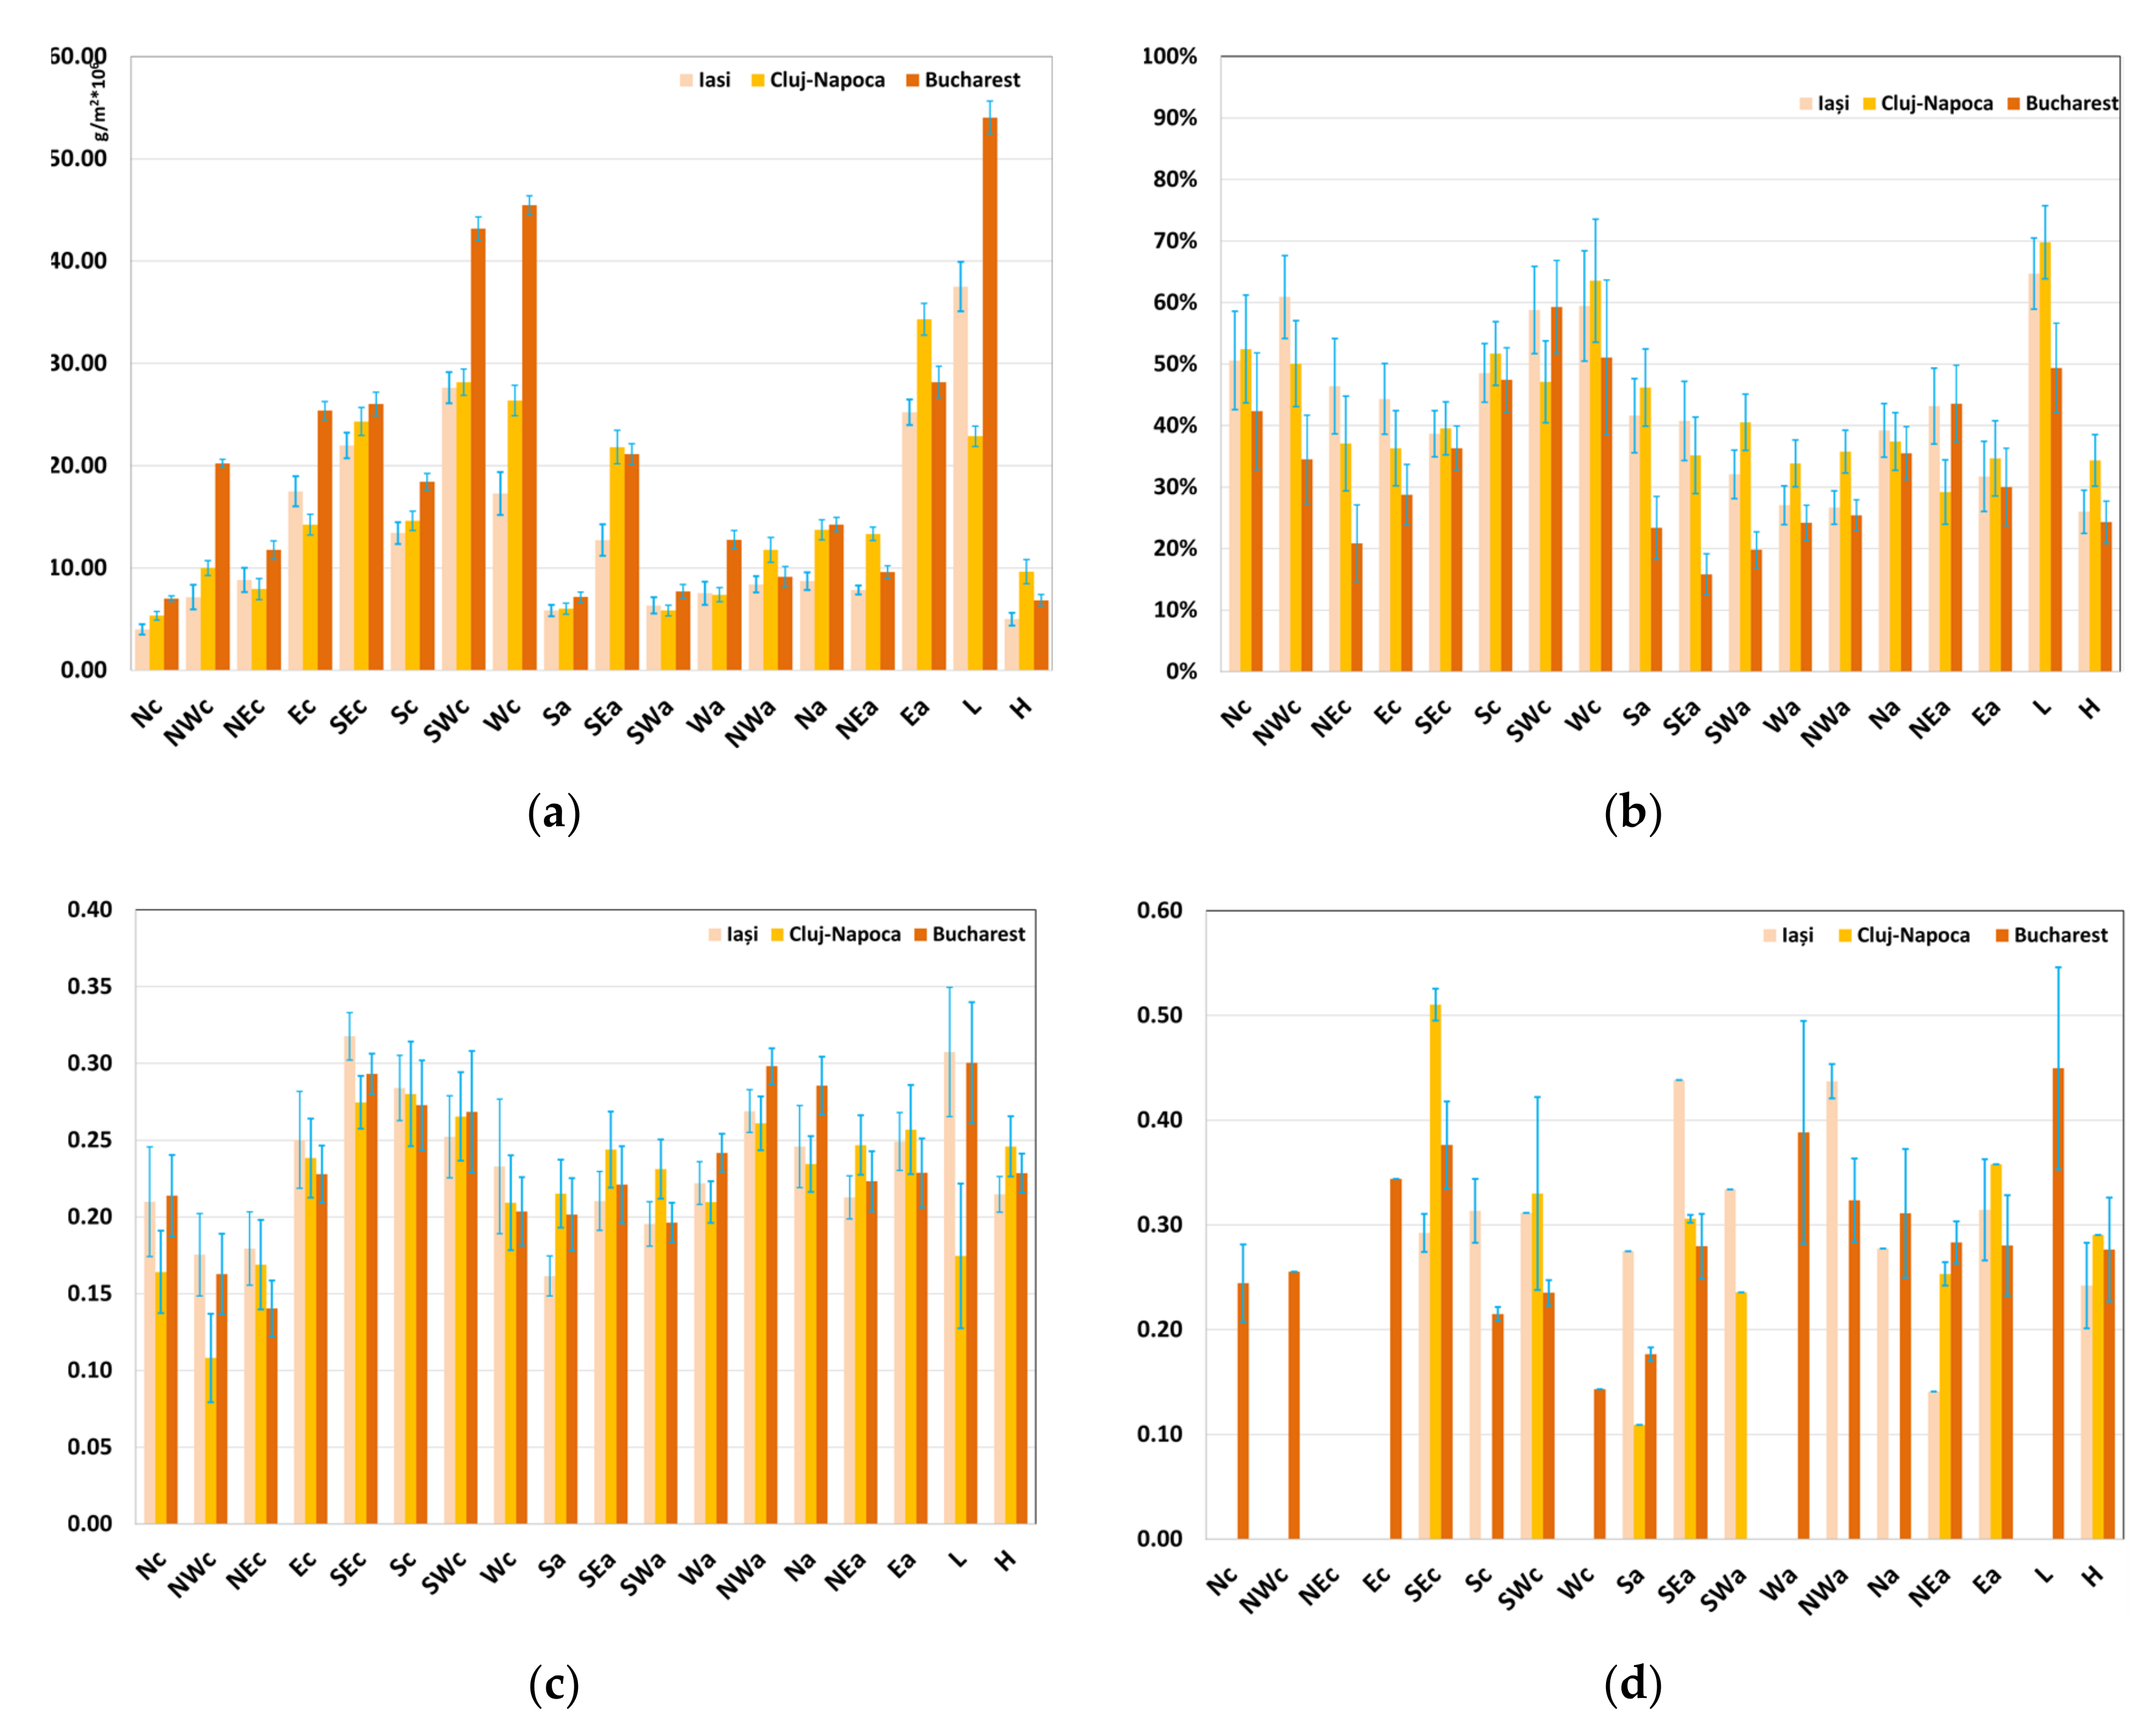
However, the Saharan dust transport toward Europe is clearly more complex regarding the atmospheric circulation conditions. In order to underline this complexity, GWT circulation types were used to search for the general synoptic patterns associated with these events. Regarding the forecast model data, it is not surprising that the circulation types inducing southerly advection are the most common types associated with these events in Romania. When the forecast model data are analyzed, we see that the circulation type SWc and Wc induce a high dust load of the Saharan origins over Bucharest and Cluj-Napoca (Figure 8a). We can also see on the AODapp data (Figure 8b) that these two circulation types are associated with a low transparency of the troposphere, most probably due to higher DL. These two circulation types are characterized by a deep pressure low centered on the region of Italy, either isolated or embedded in a long-wave trough extended on the Central and Western Europe. As well, both types of data (forecast model and ACTRIS network) show a similar role of L circulation type for high dust load of Saharan dust and low transparency of troposphere, respectively (Figure 8a,b).
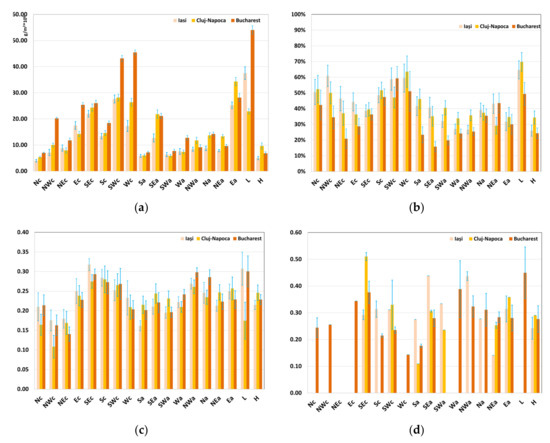
Figure 8.
Mean dust load from BSC-DREAM8b model (a) normalized values of AODapp daily average at 440 nm (version 3, level 1.0). (b) AOD daily average at 440 nm (version 3, level 1.5 inversion). (c) selected AOD daily average at 440 nm (version 3, level 1.5) considered for mineral dust intrusion. (d) for each Grosswettertypes circulation type in Iași, Cluj–Napoca, and Bucharest from March 1, 2015, to July 31, 2018.
This L type of atmospheric circulation represents basically a low pressure centered over Romania, being probably the result of the north-easterly shift of the low-pressure system over Italy from circulation-type Wc. In brief, these types of atmospheric circulation represent phases of the same synoptic pattern associated with high dust transportation in south-east Europe and the region of Romania.
The comparison between the two data sets underlines other relevant aspects concerning the image of troposphere transparency. For instance, we can observe that other types of South or South-westerly atmospheric circulation are not associated with Saharan dust occurrence due to the simple fact that these circulation types are not rooted in the north of Africa, but over the Mediterranean. This is the case for circulation types Nc and NWc (Figure 8a). However, they are associated with a low transparency of the troposphere in Romania, as reflected by AERONET data (Figure 8b), probably due to higher clouds covering cyclonic conditions, or more probably because of the non-Saharan dust transportation from the regions surrounding the observation points (most probably uncovered arable land in winter and spring).
On the contrary, two types of atmospheric circulation inducing South-westerly circulations (SEa and Ea) are associated with higher Saharan dust load, but the AODapp data indicate higher transparency of the troposphere. In this situation, we can assume an overestimation of the dust transport from Sahara on these types of atmospheric circulation by the forecast model. Other causes, as the modification of the dust transport by the orographic effect of the Dinaric Alps or the Balkan Mountains, should also be taken into consideration.
The low values of Saharan dust load, also supported by higher values of air transparency, are specific for northern and North-Westerly atmospheric circulation types (NEc, Ec, SWa, and Wa). This is in line with the fact that the AERONET data are mostly available in the region of Romania during the days with circulation conditions inducing Westerly and North-westerly wind directions on the ground level [30]. These atmospheric circulation conditions are bringing polar oceanic air masses advection, which are characterized by a lack of dust and aerosols and high visibility and transparency of the atmospheric air - inside the continent (over Romania as well).
When we analyze the level 1.5 (version 3) data of the AERONET network in Romania in their connection with GWT atmospheric circulation types (Figure 8c,d) we can observe that the maximum values of AOD are recorded during SEc, Sc and SWc circulation types. While SWc is also associated with high dust load on the forecast model data being related with Saharan dust, SEc and Sc indicate easterly air mass advection. Therefore, indicate that the highest values of AOD from sun photometer data are not determined by the Saharan dust transport, being related more to the dust transport from the region situated on the north of the Black Sea. For raw data on level 1.0 high values of AOD are specific for NWa and Na circulation types, which are associate with anticyclonic conditions. Hence, most probably in these conditions, the high values of AOD are associated with local atmospheric pollution or with local transport of dust. For the level 1.0 data, Nc, NWc and NEc are characterized by the lowest values of AOD, which confirms that their higher values on the AODapp are determined by the high amount of cloud cover specific to these cyclonic circulations.
3.5. Case study: The Saharan Dust Transport over Romania on 22–23 March 2018
As a case study of a long-range dust transport with Saharan origins towards Romania, the episode occurred on the 23rd of March 2018 is a very interesting one. Besides being a late winter episode similar to that described by Caian and Andrei [46] at the end of March, the advection from the South-West to the North-East was strong enough to transport a high amount of Saharan dust, expressed in high values of DL and AOD.
The synoptic context associated with this transport was represented by the intensification of a low-pressure system over the Northern Africa, and its subsequent movement, starting with the 21st of March 2018, towards the central basin of the Mediterranean Sea [26].
On the 22nd of March the center of the cyclone had a pressure of 1000 hPa, and it had reached to the South of the Balkan peninsula, where, around 10 AM UTC, divided itself into two separate baric systems with enclosed isobars, both with a pressure depth of 1000 hPa. On the 23rd of March, the cyclone with the 1000 hPa isobar reached the geographical region of Romania. At the same time, this cyclone enhanced on its Eastern side the advection of a warm air mass, with an SW-NE direction, heavily loaded with dust particles of Saharan origin. Also, due to the low pressure coupled with an anticyclone from the West of the Azores, there was an advection of a cold air mass from the North-East to the South-West.
Due to the favorable synoptic conditions, a significant amount of Saharan dust particles was transported and deposited on the ground during the night and morning of the 23rd of March 2018 in the region of Romania. As stated by Mărmureanu et al. [26], the dust advection took place between 9 PM UTC on the 22nd of March and 3 PM UTC on the 23rd of March, with maximum values of Optical Depth reaching 0.1–0.2 AOD over Bucharest and even 1.0–1.5 over southeastern Romania.
According to the GWT atmospheric circulation, classification of the SWc circulation type prevailed in the region from 17 to 20 March. This induced a first episode of higher dust load over the region of Romania on March 20 and 21, but with no ground deposition. After that, a low pressure developed rapidly on the Libyan coast on 22 of March and moved rapidly towards North-East, enhancing intensive dust transport towards the Balkan Peninsula and the Western part of the Black Sea. This way, on March 23, the L circulation-type manifested in the region of Romania, being associated with the highest dust deposition. It is worth mentioning that during the first episode of dust transport the load of particles over Bucharest reached 450 g/m2 on the 18th of March, while during the second episode, it only reached 160 g/m2, according to the forecast dust model. However, the second episode was enhanced by the precipitation event and consequently became more impressive as orange snow [26].
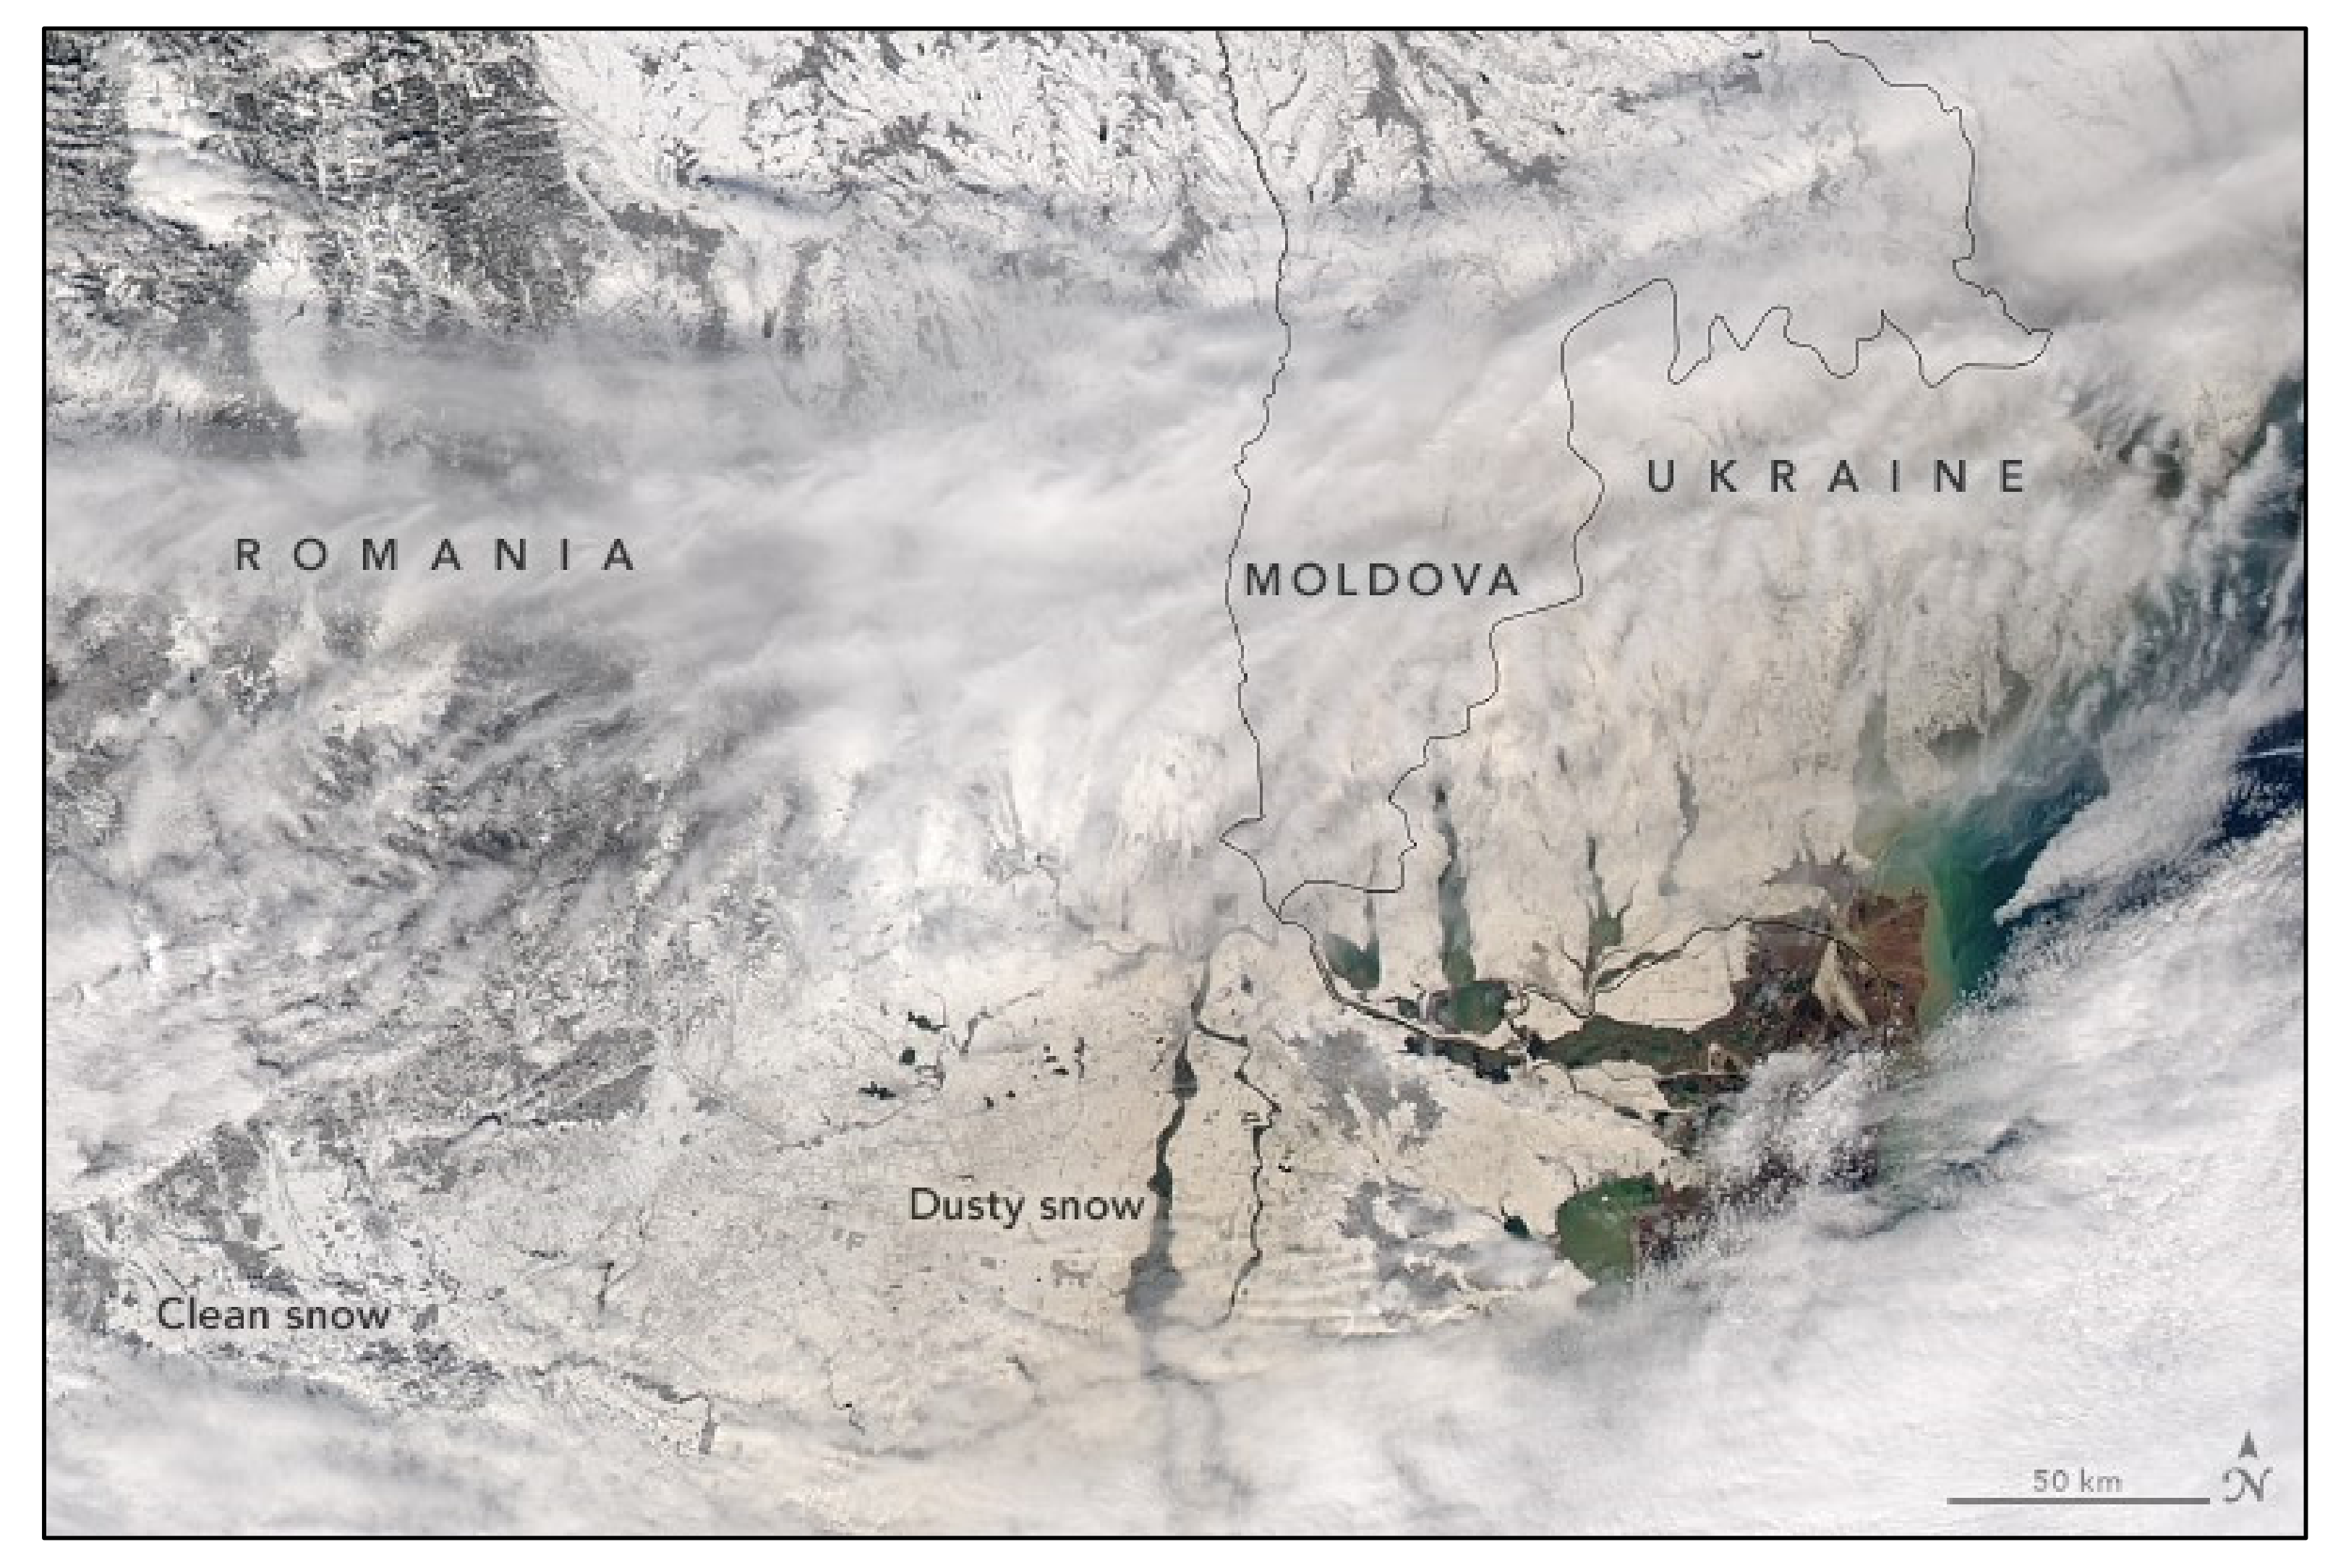
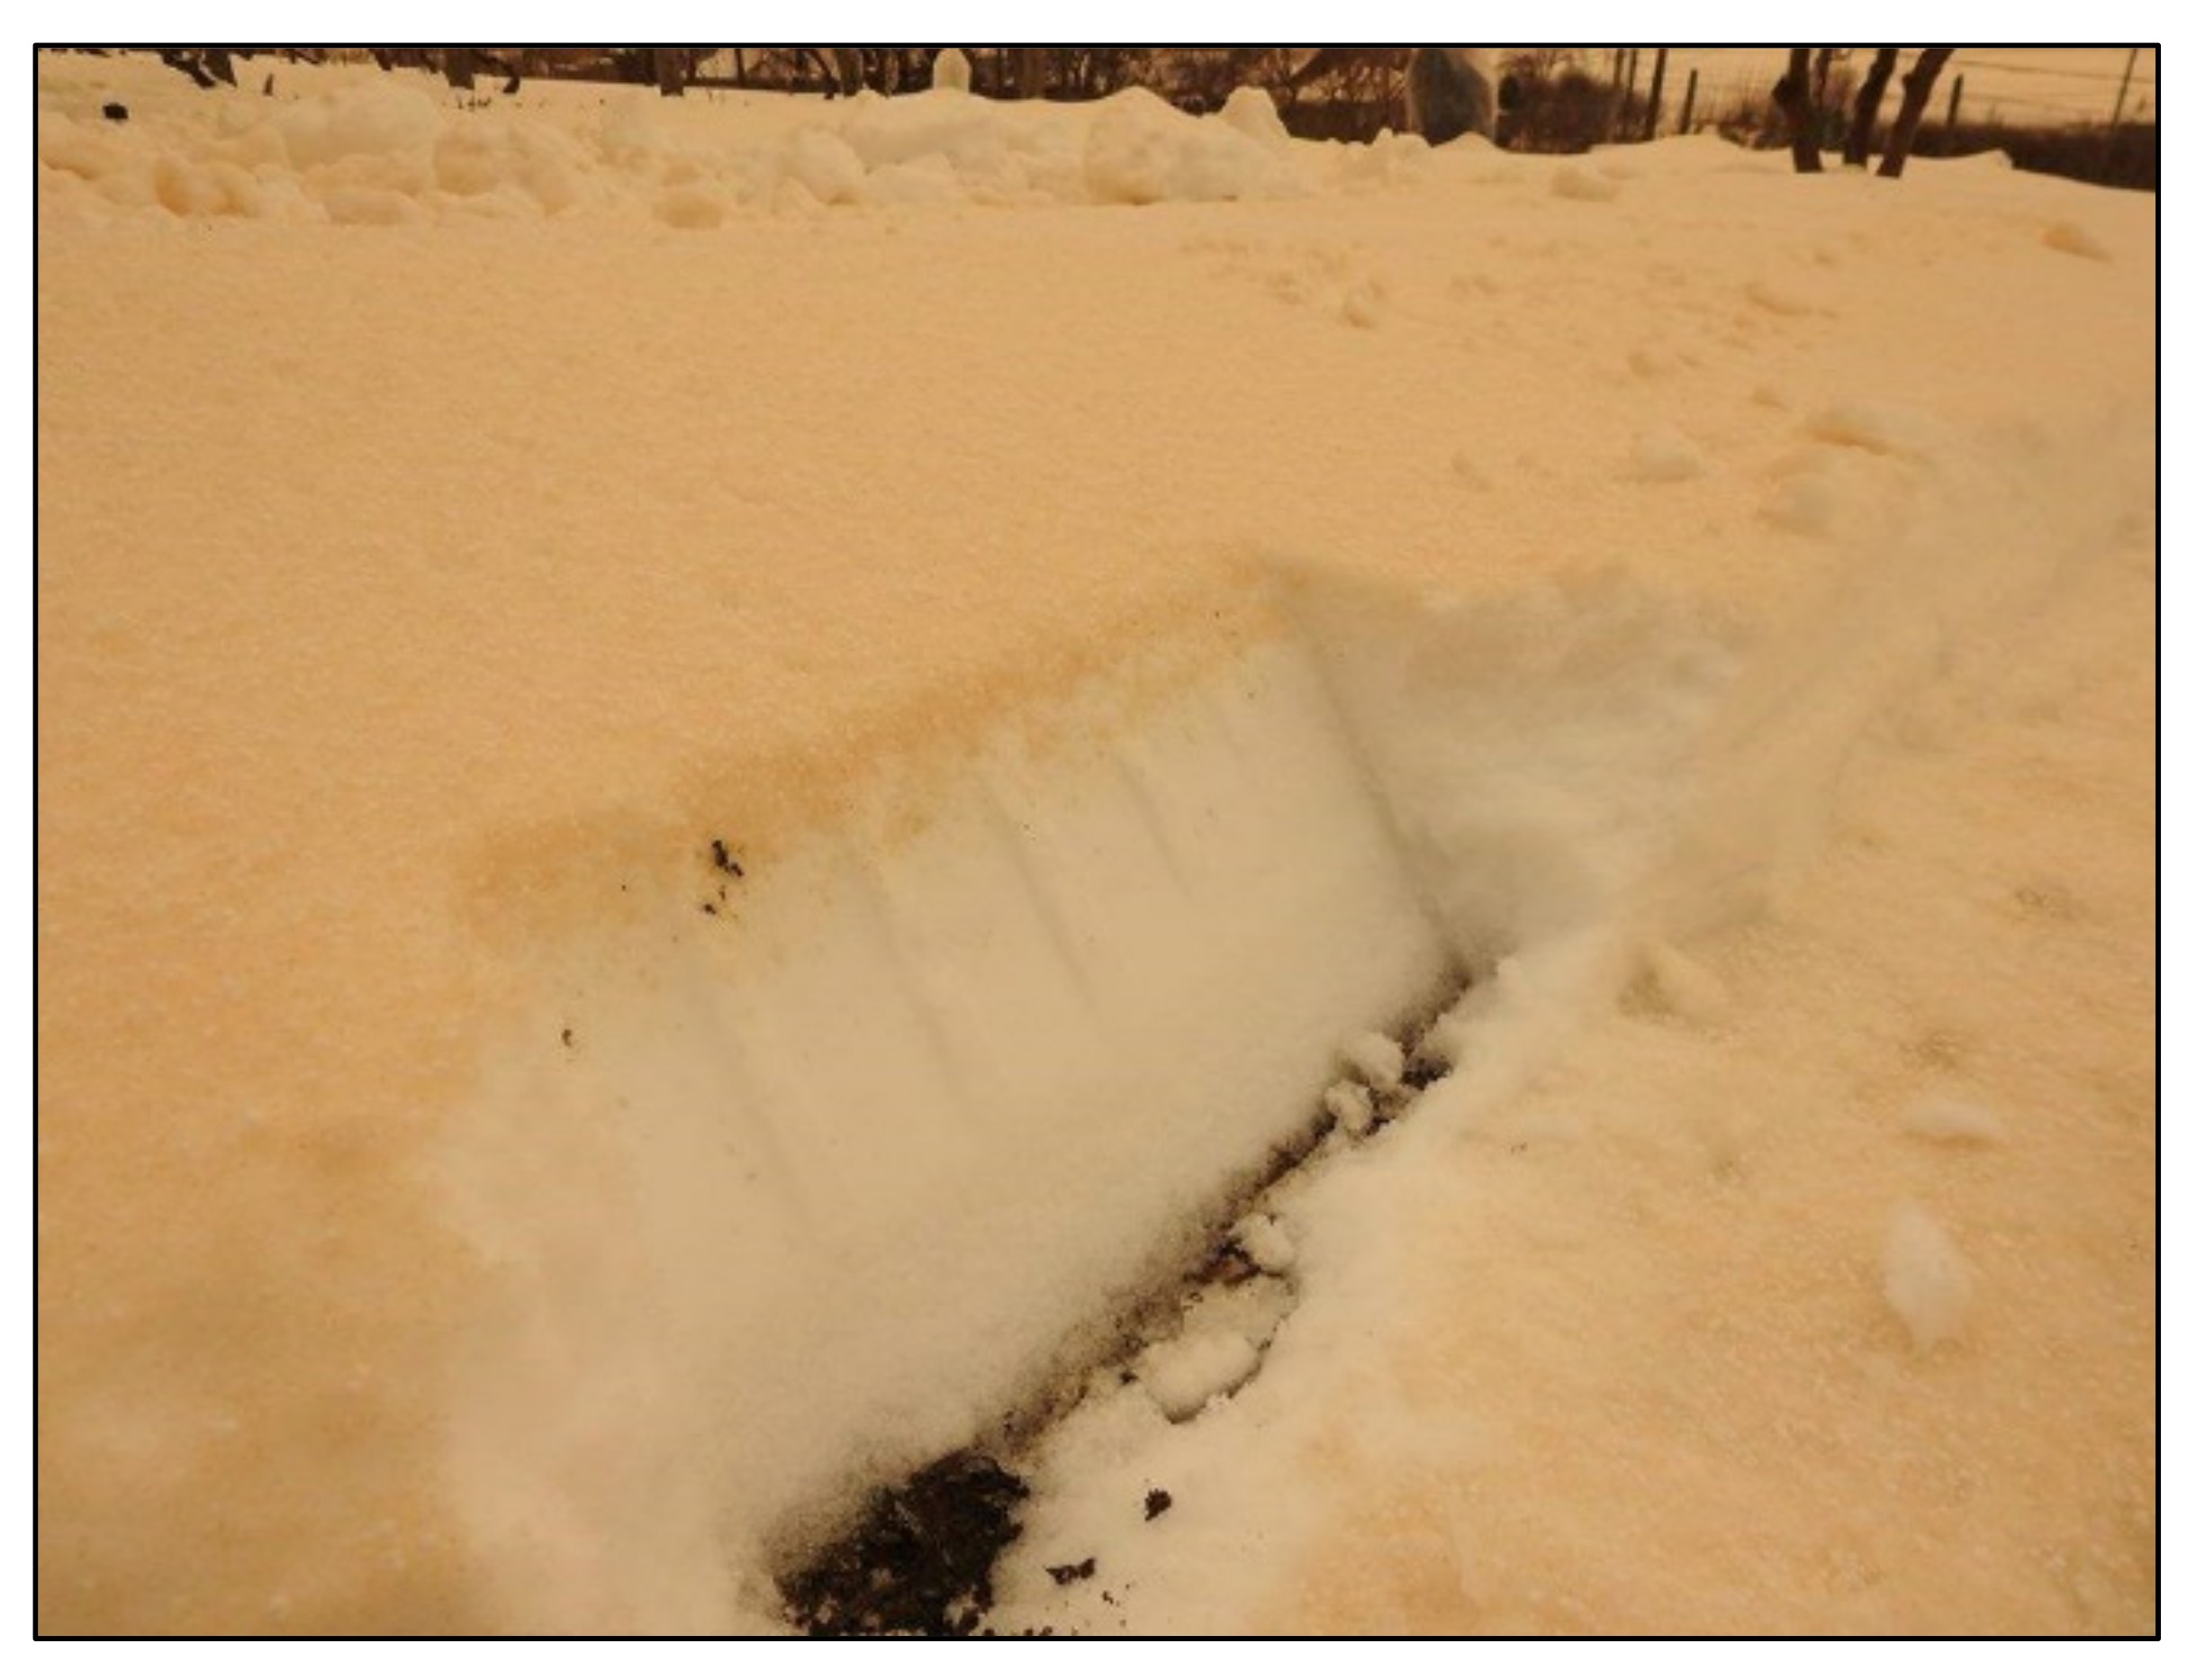
The high amounts of deposited snow led to a high amount of dust particles which were also deposited on the ground, mixed with the snow, especially in the South-East of Romania. This phenomenon was detected in satellite images too (Figure 9) so that one could clearly observe that the Eastern part of Romania was covered in ‘orange’ snow, while the rest of the country had only deposits of ‘clean’ snow on the ground. In many areas, the events led to impressive winter scenery as in the northern part of Dobrogea (Figure 10).
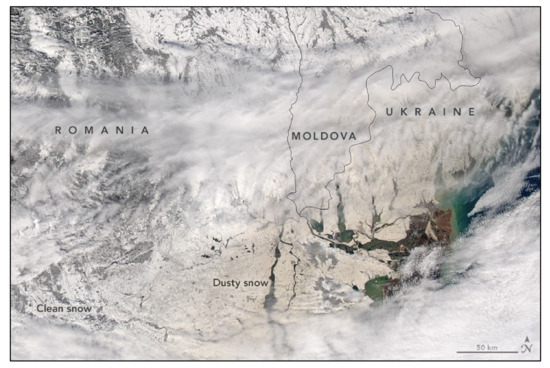
Figure 9.
Satellite image from the 24th of March 2018, indicating the area covered by orange snow extended from the South-East of Romania to the Black Sea over the Ukraine [17,47].
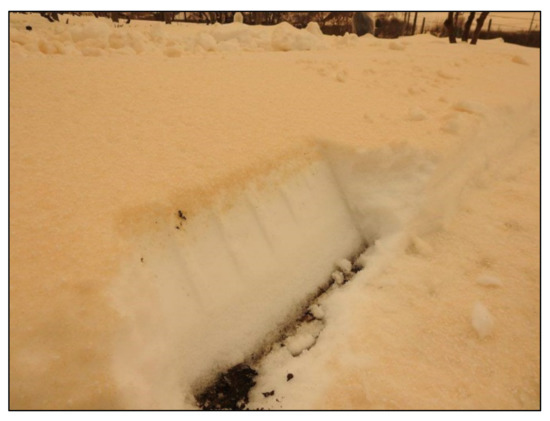
Figure 10.
Saharan dust associated with snow deposit in Isaccea, southeastern Romania, on the 23rd of March 2018. Photo: Bolboacă, L.-E.
4. Conclusions
The results of this study, based on the BSC-DREAM v 2.0 forecast model, prove that distribution and the quantities of the two parameters (DL and AOD) are valuable tools for the assessment of dust climatology in the Mediterranean region. The results obtained emphasize the importance of the Sahara region as the main source of dust transported towards Europe, especially the role of the Great Oriental Erg region formed by extensive sand dunes. The highest dust load is reached in the central Mediterranean and neighboring areas, from Sicily to Crete, and extended to the North until the margins of the Balkan Peninsula. The propagation of dust transported is strongly influenced by the mountain ranges as the Dinaric Alps or the Balkan Mountains. Due to this orographic barrier, the dust load over Romania is consistently diminished, with higher values in the South and West of the country. In Romania, the dust season extends from February to June, with maximum absolute values reached in the latter.
Our results also show that the dust transport from Sahara towards the region of Romania is enhanced by South-westerly atmospheric circulation rooted in the Northern part of Africa. The development of a deep cyclone over south Italy is capable of increasing the baric gradient over North Africa sufficiently for the displacement of large fine particles. On the contrary, for the region of Romania, the North-westerly atmospheric circulation is associated with minimum dust loads. The dust forecast model results are generally similar to those obtained using aerosol characteristics derived from sun-photometer observations when we used AODapp data. Since SWc and L circulation types are associated with high cloud cover, the sun photometer cannot offer sun quality-assured data, and some of the Saharan dust transport events cannot be confirmed by analyzing the AERONET optical parameters.
Hence, one important conclusion of this study is represented by the fact that forecast model data can be used with confidence to construct a climatology of dust presence and characteristics over the Mediterranean region, while sun-photometer data are limited in this regard.
Regarding the air pollution aspects, the sun-photometer data show that the dust aerosols are marginal in comparison to other sources of aerosols at the local scale in Romania (between 3.2% and 8.4%), hence, they have a minor contribution to atmospheric pollution, which is determined mostly by anthropogenic factors.
Author Contributions
All authors contributed equally to this research paper. S.Ț. and L.S. conceived and designed the experiments; R.-V.D. worked on mapping of data; M.-M.C. interpreted the photometry data from ACTRIS network; A.-I.N. and M.-V.B. evaluated the atmospheric circulation conditions. S.Ț., L.S. and M.-M.C. prepared the first draft of the manuscript. All authors have read and agreed to the published version of the manuscript.
Funding
Marius-Mihai Cazacu’s contribution to this study was supported by a research grant of the TUIASI, project number GnaC2018_65/2019.
Acknowledgments
The authors acknowledge the Barcelona Dust Forecast Model for the free data available for this study. The authors would like also to thank the PI(s) (Doina Nicolae, Nicolae Ajtai, Dan Costin, Silviu Gurlui) and Co-I(s) for their effort in establishing and maintaining Magurele_Inoe (Magurele), CLUJ_UBB (Cluj-Napoca), Iasi_LOASL (Iasi) AERONET sites, part of ACTRIS-RO. As well, the authors acknowledge equally the Department of Geography from the Faculty of Geography and Geology of the “Alexandru Ioan Cuza” University of Iași for the financial support offered for the publication of this study.
Conflicts of Interest
The authors declare no conflicts of interest.
References
- Tsoar, H.; Bagnold, R.A. The Physics of Blown Sand and Desert Dunes, Methuen: London, UK, 1941. Prog. Phys. Geog. 1994, 18, 91–96. [Google Scholar] [CrossRef]
- Barkan, J.; Alpert, P.; Kutiel, H.; Kishcha, P. Synoptics of dust transportation days from Africa toward Italy. J. Geophys. Res. 2005, 110, D07208. [Google Scholar] [CrossRef]
- D’Almeida, G.A. Model for Saharan Dust Transport. J. Climate. Appl. Meteor. 1986, 25, 903–916. [Google Scholar] [CrossRef]
- Rodrıguez, S.; Querol, X.; Alastuey, A.; Kallos, G.; Kakaliagou, O. Saharan dust contributions to PM10 and TSP levels in Southern and Eastern Spain. Atmos. Environ. 2001, 35, 2433–2447. [Google Scholar] [CrossRef]
- Goudie, A.S. Dust storms and human health. In Extreme Weather Events and Human Health; Akhtar, R., Ed.; Springer: Cham, Germany, 2020. [Google Scholar] [CrossRef]
- Labzovskii, L.; Toanca, F.; Stefan, S. Determination of saharan dust properties over Bucharest, Romania part 1: Procedures and algorithms. Rom. J. Phys. 2014, 59, 1084–1096. [Google Scholar]
- Labzovskii, L.; Toanca, F.; Nicolae, D. Determination of saharan dust properties over Bucharest, Romania part 2: Study cases analysis. Rom. J. Phys. 2014, 59, 1097–1108. [Google Scholar]
- Pitari, G.; Di Genova, G.; Coppari, E.; De Luca, N.; DiCarlo, P.; Iarlori, M.; Rizi, V. Desert dust transported over Europe: Lidar observations and model evaluation of the radiative impact. J. Geophys. Res. Atmos. 2015, 120, 2881–2898. [Google Scholar] [CrossRef]
- Karagulian, F.; Temimi, M.; Ghebreyesus, D.; Weston, M.; Kondapalli, N.K.; Valappil, V.K.; Aldababesh, A.; Lyapustin, A.; Chaouch, N.; Hammadi, F.; et al. Analysis of a severe dust storm and its impact on air quality using WRF-Chem modeling, satellite imagery, and ground observations. Air. Quality. Atmos. Health 2019, 12, 453–470. [Google Scholar] [CrossRef]
- Prospero, J.M.; Ginoux, P.; Torres, O.; Nicholson, S.E.; Gill, T.E. Environmental characterization of global sources of atmospheric soil dust identified with the Nimbus 7 Total Ozone Mapping Spectrometer (TOMS) absorbing aerosol product. Rev. Geophy. 2002, 40, 1002. [Google Scholar] [CrossRef]
- Marinică, I. Saharan dust transport over Romania. Air. Water. Compon. Environ. 2017, 85–92. [Google Scholar] [CrossRef]
- Ansmann, A.; Bösenberg, J.; Chaikovsky, A.; Camerón, A.; Eckhardt, S.; Eixmann, R.; Freudenthaler, V.; Ginoux, P.; Komguem, L.; Linné, H.; et al. Long-range transport of Saharan dust to northern Europe: The 11–16 October 2001 outbreak observed with EARLINET. J. Geophys. Res. 2003, 108, 4783. [Google Scholar] [CrossRef]
- Michaelidis, S.; Evripidou, P.; Kallos, G. Monitoring and predicting Saharan Desert dust events in the eastern Mediterranean. R. Meteorol. Soc. 1999, 54, 359–365. [Google Scholar] [CrossRef]
- Barcelona Dust Forecast Center. Available online: https://dust.aemet.es/ (accessed on 1 October 2019).
- Eck, T.F.; Holben, B.N.; Reid, J.S.; Dubovik, O.; Smirnov, A.; O’neill, N.T.; Slutsker, I.; Kinne, S. Wavelength dependence of the optical depth of biomass burning, urban, and desert dust aerosols. J. Geophys. Res. Atmos. 1999, 104, 31333–31349. [Google Scholar] [CrossRef]
- Dust Forecast Model from University of Athens. Available online: https://forecast.uoa.gr (accessed on 1 July 2019).
- NASA, EarthData Portal. Available online: https://disc.gsfc.nasa.gov (accessed on 1 November 2019).
- Schulzweida, U. CDO User Guide (version 1.9.8), 2019. Available online: http://doi.org/10.5281/zenodo.3539275 (accessed on 2 April 2020).
- Barcelona Dust Forecast Center. Available online: https://dust.aemet.es/forecast-evaluation/annual-scores?date=201601-201612 (accessed on 14 January 2020).
- Cazorla, A.; Bahadur, R.; Suski, K.J.; Cahill, J.F.; Chand, D.; Schmid, B.; Ramanathan, V.; Prather, K.A. Relating aerosol absorption due to soot, organic carbon, and dust to emission sources determined from in-situ chemical measurements. Atmos. Chem. Phys. 2013, 13, 9337–9350. [Google Scholar] [CrossRef]
- Dubovik, O.; Holben, B.; Eck, T.F.; Smirnov, A.; Kaufman, Y.J.; King, M.D.; Tanré, D.; Slutsker, I. Variability of Absorption and Optical Properties of Key Aerosol Types Observed in Worldwide Locations. J Atmos. Sci. 2002, 59, 590–608. [Google Scholar] [CrossRef]
- Giles, D.M.; Sinyuk, A.; Sorokin, M.G.; Schafer, J.S.; Smirnov, A.; Slutsker, I.; Eck, T.F.; Holben, B.N.; Lewis, J.R.; Campbell, J.R.; et al. Advancements in the Aerosol Robotic Network (AERONET) Version 3 database - Automated near-real-time quality control algorithm with improved cloud screening for Sun photometer aerosol optical depth (AOD) measurements. Atmos. Meas. Tech. 2019, 12, 169–209. [Google Scholar] [CrossRef]
- Russell, P.B.; Bergstrom, R.W.; Shinozuka, Y.; Clarke, A.D.; DeCarlo, P.F.; Jimenez, J.L.; Livingston, J.M.; Redemann, J.; Holben, B.; Dubovik, O.; et al. Absorption Angstrom Exponent in AERONET and related data as an indicator of aerosol composition. Atmos. Chem. Phys. 2010, 10, 1155–1169. [Google Scholar] [CrossRef]
- Cazacu, M.M.; Timofte, A.; Unga, F.; Albina, B.; Gurlui, S. AERONET data investigation of the aerosol mixtures over Iasi area, One-year time scale overview. J. Quant. Spectrosc. Radiat. Transf. 2015, 153, 57–64. [Google Scholar] [CrossRef]
- Sfîcă, L.; Iordache, L.; Ichim, P.; Leahu, A.; Cazacu, M.-M.; Gurlui, S.; Trif, C.-T. The influence of weather conditions and local climate on particulate matter (PM10) concentration in metropolitan area of Iași, Romania. Pres. Environ. Sustain. Develop. 2018, 11, 109–117. [Google Scholar] [CrossRef]
- Mărmureanu, L.; Marin, C.A.; Andrei, S.; Antonescu, B.; Ene, D.; Boldeanu, M.; Vasilescu, J.; Vițelaru, C.; Cadar, O.; Levei, E. Orange Snow—A Saharan Dust Intrusion over Romania During Winter Conditions. Rem. Sens. 2019, 11, 2466. [Google Scholar] [CrossRef]
- Cazacu, M.M.; Tudose, O.G.; Timofte, A.; Rusu, O.; Apostol, L.; Leontie, L.; Gurlui, S. A case study of the behavior of aerosol optical properties under the incidence of a Saharan dust intrusion event. Appl. Ecol. Environ. Res. 2016, 14, 183–194. [Google Scholar] [CrossRef]
- Unga, F.; Cazacu, M.M.; Timofte, A.; Bostan, D.; Mortier, A.; Dimitriu, D.G.; Gurlui, S.; Goloub, P. Study of tropospheric aerosol types over Iasi, Romania, during summer of 2012. Environ. Eng. Manag. J. 2013, 12, 297–303. [Google Scholar]
- Papayannis, A.; Nicolae, D.; Kokkalis, P.; Binietoglou, I.; Talianu, C.; Belegante, L.; Tsaknakis, G.; Cazacu, M.M.; Vetres, I.; Ilic, L. Optical, size and mass properties of mixed type aerosols in Greece and Romania as observed by synergy of lidar and sunphotometers in combination with model simulations: A case study. Sci. Total Environ. 2014, 500, 277–294. [Google Scholar] [CrossRef] [PubMed]
- Brown, H.; Liu, X.; Feng, Y.; Jiang, Y.; Wu, M.; Lu, Z.; Wu, C.; Murphy, S.; Pokhrel, R. Radiative effect and climate impacts of brown carbon with the Community Atmosphere Model (CAM5). Atmos. Chem. Phys. 2018, 18, 17745–17768. [Google Scholar] [CrossRef]
- Nicolae, V.; Talianu, C.; Andrei, S.; Antonescu, B.; Ene, D.; Nicolae, D.; Dandocsi, A.; Toader, V.E.; Ștefan, S.; Savu, T.; et al. Multiyear typology of long-range transported aerosols over Europe. Atmosphere 2019, 10, 482. [Google Scholar] [CrossRef]
- Beck, C. Zirkulations dynamische Variabilität im Bereich Nordatlantik-Europa seit 1780-dissertation; Selbstverlag des Instituts für Geographie: Würzburg, Germany, 2000. [Google Scholar]
- Beck, C.; Jacobeit, J.; Jones, P.D. Frequency and within-type variations of large-scale circulation types and their effects on low-frequency climate variability in Central Europe since 1780. Int. J. Clim. 2007, 27, 473–491. [Google Scholar] [CrossRef]
- Dee, D.P.; Uppala, S.M.; Simmons, A.J.; Berrisford, P.; Poli, P.; Kobayashi, S.; Andrae, U.; Balmaseda, M.A.; Balsamo, G.; Bauer, P.; et al. The ERA-Interim reanalysis: Configuration and performance of the data assimilation system. Quart. J. Roy. Meteor. Soc. 2011, 137, 553–597. [Google Scholar] [CrossRef]
- Philipp, A.; Bartholy, J.; Beck, C.; Erpicum, M.; Esteban, P.; Fettweis, X.; Coauthors. Cost733cat–A database of weather and circulation type classifications. Phys. Chem. Earth. Parts A/B/C 2010, 35, 360–373. [Google Scholar] [CrossRef]
- Kallos, G.; Astitha, M.; Katsafados, P.; Spyrou, C. Long range tranport of anthropogenically and naturally produced partciulate matter in the Mediterranean and North Atlantic: Current state of knowledge. J. Appl. Meteorol. Climatol. 2007, 46, 1230–1251. [Google Scholar] [CrossRef]
- Sandu, I. Climate of Romania; Romanian Academy Publishing House: Bucharest, Romania, 2008. [Google Scholar]
- Dobri, R.V.; Sfîcă, L.; Ichim, P.; Harpa, G.V. The distribution of the monthly 24-hour maximum amount of precipitation in Romania according to their synoptic causes. Geogr. Tech. 2017, 12, 62–72. [Google Scholar] [CrossRef][Green Version]
- Ajtai, N.; Stefanie, H.; Ozunu, A. Description of aerosol properties over Cluj-Napoca derived from AERONET sun photometric data. Environ. Eng. Manag. J. 2013, 12, 227–232. [Google Scholar] [CrossRef]
- Ajtai, N.; Stefanie, H.; Arghius, V.; Meltzer, M.; Costin, D. Characterization of aerosol optical and microphysical properties over North-Western Romania in correlation with predominant atmospheric circulation patterns, International Multidisciplinary Scientific Geo Conference. Surv. Geol. Min. Ecol. Manag. 2017, 17, 375–382. [Google Scholar]
- Belegante, L.; Cazacu, M.M.; Timofte, A.; Toanca, F.; Vasilescu, J.; Rusu, M.I.; Ajtai, N.; Stefanie, H.I.; Vetres, I.; Ozunu, A.; et al. Case study of the first volcanic ash exercise in Romania using remote sensing techniques. Environ. Eng. Manag. J. 2015, 14, 2503–2504. [Google Scholar]
- Nemuc, A.; Belegante, L.; Radulescu, R. One year of sunphotometer measurements in Romania. Rom. J. Phys. 2011, 56, 550–562. [Google Scholar]
- Roșu, I.A.; Cazacu, M.M.; Prelipceanu, O.; Agop, M. A Turbulence-Oriented Approach to Retrieve Various Atmospheric Parameters Using Advanced Lidar Data Processing Techniques. Atmosphere 2019, 10, 38. [Google Scholar] [CrossRef]
- Lack, D.A.; Cappa, C.D. Impact of brown and clear carbon on light absorption enhancement, single scatter albedo and absorption wavelength dependence of black carbon. Atmos. Chem. Phys. 2010, 10, 4207–4220. [Google Scholar] [CrossRef]
- Sfîcă, L.; Croitoru, A.E.; Iordache, I.; Ciupertea, A.F. Synoptic Conditions Generating Heat Waves and Warm Spells in Romania. Atmosphere 2017, 8, 50. [Google Scholar] [CrossRef]
- Caian, M.; Andrei, M.D. Late-Spring severe blizzard events over eastern Romania: A conceptual model of development. Atmosphere 2019, 10, 770. [Google Scholar] [CrossRef]
- WMO Sand and Dust storm warning advisory and Assessment System. Available online: https://sds-was.aemet.es (accessed on 1 August 2019).
© 2020 by the authors. Licensee MDPI, Basel, Switzerland. This article is an open access article distributed under the terms and conditions of the Creative Commons Attribution (CC BY) license (http://creativecommons.org/licenses/by/4.0/).

