Article

Community Structure and Influencing Factors of Airborne Microbial Aerosols over Three Chinese Cities with Contrasting Social-Economic Levels

1
Center for Atmospheric Chemistry Study, Shanghai Key Laboratory of Atmospheric Particle Pollution and Prevention (LAP3), Department of Environmental Science and Engineering, Fudan University, Shanghai 200433, China
2
Third Institute of Oceanography, Ministry of Natural Resources, Xiamen 361005, China
3
Education and Research office of Health Centre, Minnan Normal University, Zhangzhou 363000, China
4
Fujian Provincial Key Laboratory of Marine Ecological Conservation and Restoration, Xiamen 361005, China
5
Department of Biological Technology and Engineering, HuaQiao University, Xiamen 361021, China
6
Institute of Eco-Chongming (IEC), Shanghai 202162, China
7
Institute of Atmospheric Sciences, Fudan University, Shanghai 200433, China
*
Authors to whom correspondence should be addressed.
Ying Rao and Heyang Li contributed equally to this work.
Atmosphere 2020, 11(4), 317; https://doi.org/10.3390/atmos11040317
Submission received: 6 February 2020 / Revised: 10 March 2020 / Accepted: 11 March 2020 / Published: 25 March 2020
(This article belongs to the Section Aerosols)

Abstract

:
As an important part of atmospheric aerosol, airborne bacteria have major impacts on human health. However, variations of airborne community structure due to human-induced activities and their possible impact on human health have not been well understood. In this study, we sampled atmospheric microbial aerosols in three Chinese cities (Shanghai, Xiamen, and Zhangzhou) with contrasting social-economic levels and analyzed the bacterial composition using high-throughput sequencing methods. A high similarity of the predominant phyla was observed in three cities but the relative abundances were quite different. At the genus level, the most dominant genus in Shanghai and Xiamen was Deinococcus while the most dominant genus in Zhangzhou was Clostridium. The different characteristics of airborne bacterial in the three cities above may be ascribed to the environmental variables affected by human over-activities such as the vehicle exhausts and coal-burning emissions in Shanghai, the tourist aggregation and construction works in Xiamen, the extensive uses of chemical fertilizers, and agricultural activities in Zhangzhou. The variation of the bacterial community and the pathogenic bacteria detected in three cities would have a potential threat to human health.

Graphical Abstract

1. Introduction

Atmospheric microbial aerosols are closely related to air pollution, biosphere, cloud chemistry, climate, and human health [1,2,3]. The diffusion and transport of microbial aerosols in the atmosphere can lead to various adverse effects on human health such as infectious, allergic, and occupational diseases [4,5]. In terms of the pathogenic effects of microbial aerosols on human health and being an important index to evaluate urban air quality [6,7], the diversity, compositions, and sources of microbial aerosols are nowadays the focus of many environmental microbial studies worldwide.
Microbial aerosols include bacterial aerosol, fungal aerosol, viral aerosol, etc. [8]. They are usually characterized by the diversity of species, multiphase of sources, variability of activity, three-dimensional dissemination, regeneration of deposits, and widespread infection [9]. The dominant groups in the bacterial aerosol are mainly Proteobacteria, Actinobacteria, Firmicutes, and Bacteroidetes. Among them, Bacillus is a dominant genus of the Firmicutes, while α-, β-, and γ- groups are the common bacteria of the Proteobacteria [10]. Global emissions of MA vary greatly in the range of 10–1000 Tg a−1, in which bacterial aerosol emissions are around 0.4–2.8 Tg a−1 [11]. There are great differences in the distribution of microbial aerosols among different cities. For example, in Shenzhen of southern China, the total microbial and bacterial concentrations were 61,622 CFU (colony-forming units)/m3 and 59,893 CFU/m3, respectively. The bacterial concentration in Tongling of eastern China was 4496 CFU/m3, while it was only 1200 CFU/m3 in Jiujiang of southeastern China. As for the fungal aerosol, the fungal concentration in Lushan Mountain of southeastern China was 11,900 CFU/m3 while it was 131 CFU/m3 in Tianshui of southeastern China, about 720 CFU/m3 in Nanjin and 3197 CFU/m3 in Beijing [12]. Yamaguchi [13] found that the classification and the community structure of bacteria in downstream dust samples were similar to those in soil and the particulate matter samples in dust source areas. Substantial loads of microbes over the oceans were traced from land via long-range transport [14]. The studies on the transport of microbial aerosols were mainly limited to horizontal transport but much less on vertical transport [11]. Microbial aerosols can be removed by both dry deposition [15] and wet deposition via precipitation, snow, or hail [15,16,17]. The deposition rates of bacteria depended on sources (e.g., marine or terrestrial), meteorological conditions, aerosol chemical components, etc. [18,19]. As shown in a study over the Red Sea, depositions of prokaryotes were more efficient over the ocean than its offshore areas [20]. The deposition of airborne microbes accounted for a significant proportion of bacterial production and N2-fixation rates in the ocean [21]. Atmospheric deposition can stimulate Alphaproteobacteria, Betaproteobacteria, and Cyanobacteria in marine bacteria [22,23]. The spread of microbial aerosols in the atmosphere can lead to the epidemic spread of human acute and chronic diseases, as well as animal and plant diseases, including infectious diseases, allergic diseases, or other adverse reactions [24,25]. For instance, marine blooms of Cyanobacteria, which was the probable source of endotoxin, can affect human health in the on-shore areas [26].
While there was a number of studies on microbial aerosol in New York, Milan, and Chinese urban cities such as Beijing, Qingdao, Xiamen, and Xi’an [27,28,29,30,31,32,33,34,35,36], very few comparative studies examined the characteristics of microbial aerosols in multiple Chinese cities by using the identical analytical method. In addition, the research methods in most of the previous studies were the traditional culture methods or the molecular methods, such as RFLP (Restriction Fragment Length Polymorphism), T-RFLP (Terminal Restriction Fragment Length Polymorphism), and DGGE (Denaturing Gradient Gel Electrophoresis). Based on those methods, there were fewer microbial groups being detected and analyzed, and it could have more shortcomings and biases in the cognition of microbial diversity.
This study selected three cities, i.e., Shanghai, Xiamen, and Zhangzhou with different economic development levels in China. As of 2018, the annual GDP of Shanghai, Xiamen, and Zhangzhou was around 460 billion, 70 billion, and 55 billion US dollars, respectively. Financial business, trade, and transportation are the core industries of Shanghai. Xiamen is a famous tourism city with income mainly from petroleum, electronics, and construction businesses. As for Zhangzhou, its agriculture accounts for about 20% of its GDP, much higher than the other two cities. Hence, it would be interesting to compare the structural characteristics of atmospheric microbial aerosols in those three cities with contrasting social-economic levels and explore the possible influencing factors. We found that the bacterial aerosols in all three cities contained pathogenic bacteria or conditional pathogenic bacteria, which would potentially threaten the survival and working environment of human beings.

2. Materials and Methods

2.1. Microbial Aerosol Sampling

Microbial aerosol samples were collected in three Chinese cities as shown in Figure 1. The site in Shanghai was located on the roof of a teaching building (~20 m above the ground level) in Fudan University (121°29′ E, 31°14′ N). The site in Xiamen was located on the roof of the old Complex Building (~20 m above the ground level and about 100 m from the coast) of the Third Institute of Oceanography of Ministry of Natural Resources (118°5′ E, 24°26′ N). The site in Zhangzhou was located on the roof of the Complex Building (~25 m above the ground level and 300 m from the bank of Jiulong River) of Minnan Normal University (117°39′ E, 24°31′ N). No strong point emission sources were located close to these three sites. These three sites have been selected to represent typical Chinese urban/suburban environments with contrasting social-economic levels. Shanghai is well known as a financial metropolis of China. Xiamen is a rapidly developing tourism city which attracts lots of tourists all year round. As for Zhangzhou, it is a typical agricultural city. Microbial aerosol samples were collected using the sampler (Model: XMX-CV, Dycor, Canada; air flow rate: 530 L/min) with an aseptic filter membrane (mixed fiber membrane, model: FMCE (Filter membrane of Mix Cellulose Esters); filter hole: 0.8 μm; diameter: 37 mm). It was tested that the sampling duration of more than 5 h can ensure high-throughput detection. For days with worse air quality, the sampling duration could be shortened. Table S1 shows the detailed sampling information of this study. After the collection, the filter membrane samples, as well as the negative control filter samples, were removed with aseptic tweezers and placed in the filter box. They were sealed and stored in the refrigerator under 4 °C until analysis.

2.2. Bacterial Genomic DNA Extraction

Bacterial genomic DNA of the aerosol sample was extracted by using FastDNA® Spin Kit for Soil (MP Biomedicals, Co., Ltd, Santa Ana, CA, USA). Briefly, the fibers were cut into pieces, then placed into a Lysing Matrix E tube. DNA extractions were then conducted according to the manufacturer’s instruction. Finally, 50 μL of sterile ddH2O (pH = 8) was used to elute the purified DNA into a clean catch tube. The DNA was stored at −20 °C prior to further experiment.
The concentration and purity of the DNA solutions extracted from different samples were determined by a nucleic acid analyzer. The DNA solutions of atmospheric microbial aerosol samples that meet the high-throughput detection requirements were cryopreserved in ice boxes and then were sent to Shanghai Meiji Biomedical Technology Co., Ltd. for high-throughput sequencing analysis.

2.3. Amplification and Sequencing

The 16S rRNA (16S ribosomal RNA) gene high-throughput sequencing method (also known as the second generation sequencing technique, NGS) was applied in this study. NGS could uncover millions or even billions of gene sequences and has advantages for analyzing the composition and relative abundance of microorganisms in complex environments [37]. On the contrary, fingerprint technology such as DGGE, typically revealed fewer than 100 sequences and had limitations of detecting the important but rare groups [38]. Hence, NGS was applied in this study with the expectation of obtaining more sequences and higher sensitivity of the determination of bacteria in the atmospheric environment as well as the accuracy of relative abundance calculation.
The conserved sequence of bacterial 16S rRNA gene V3-V4 region was PCR (Polymerase Chain Reaction) amplificated based on the primers 338F (5’-ACTCCTACGGGAGGCAGCA-3’) and 806R (5’-GGACTACHVGGGTWTCTAAT-3’). PCR reactions, containing 1 U TransStartFastpfu DNA Polymerase (Transgen Biotech, Co. Ltd., Beijing, China), 4 μL 5 × FastPfu Buffer, 2 μL dNTPs (deoxy-ribonucleoside triphosphate) (2.5 mM), 0.8 μL each primer (5 mM), and 1 μL DNA template (10 ng/μL) in a volume of 20 µL, were amplified by thermocycling: 3 min at 95 °C for initialization; 27 cycles of 30 s denaturation at 95 °C, 30 s annealing at 35 °C, and 45 s extension at 72 °C; followed by 10 min final elongation at 72 °C. Three replicates per sample and each PCR products of the same sample were mixed. The length and concentration of the PCR product were detected by 2% agarose gel electrophoresis. Samples with a bright main strip between 400 and 450 bp can be used for further experiments. PCR products were purified with AxyPrepDNA Gel Extraction Kit (Axygen Bioscience, Union city, CA, USA). Sequencing libraries were generated using NEBNext® Ultra™ DNA Library Prep Kit for Illumina® (New England Biolabs, Inc, USA) following the manufacturer’s recommendations and index codes were added. The library quality was assessed on the QuantiFluor™ -ST Fluorometer (Promega, Madison, WA, USA). At last, the library was sequenced on an Illumina Miseq platform and 300 bp paired-end reads were generated.
For a total of 26 atmospheric microbial aerosol samples collected in three cities, a 16S rRNA gene amplicon library with one primer set covering the V3–V4 region of bacteria was generated to detect the bacterial community composition and diversity. A total of 685,995 sequence bands with about 3 × 10⁸ bp were obtained. The average reading length of the sequences was 433.78 bp, and about 99.95% of the sequence length was between 421 and 460 bp. The average number of sequencing strips was 26,000/sample and the minimum was above 15,000/sample.

2.4. Data Processing and Statistical Analysis

Quality filtering on the paired-end raw reads was performed under specific filtering conditions to obtain the high-quality clean reads according to the Trimmomatic (V0.33), [39] quality-controlled process. At the same time, sequences were assigned to each sample based on their unique barcode and primer, after which the barcodes and primers were removed and got the paired-end clean reads. Paired-end clean reads were merged using FLASH (V1.2.11) [40] according to the relationship of the overlap between the paired-end reads; when at least 10 of the reads overlap, the read generated from the opposite end of the same DNA fragment, the maximum allowable error ratio of the overlap region of 0.2, and the spliced sequences were called raw tags. Quality filtering on the spliced sequences was performed under the Trimmomatic software to obtain effective clean tags. All sequences were deposited in the National Center for Biotechnology Information (NCBI) GenBank under SRA (Sequence ReadArchive) accession number of SRP219061.
Alpha diversity which consists of Chao1 and ACE species abundance estimator, Shannon and Simpson species diversity indices, and rarefaction curve reflects the richness and diversity of a single sample species. Alpha diversity analysis was carried out using Mothur (V.1.30.1) software [41]. A Venn diagram was designed to illustrate the similarity and difference between the bacterial communities in the three samples. The operational taxonomic units (OTUs) were clustered by ≥97% similarity of the high-quality sequences using QIIME (Quantitative Insights Into Microbial Ecology) (Version 1.8.0) software [42]. The singleton OTU were removed using usearch [43] after OTU clustering, and then the chimera sequences were detected and removed using the UCHIME de novo algorithm [44]. For each representative sequence, the Silva database was used based on the RDP (Ribosomal Database Project) classifier algorithm and the assign_taxonomy.py script [42] in Qiime to annotate taxonomic information.

2.5. Meteorological Data

The meteorological parameters including temperature, relative humidity, and wind speed were obtained from a meteorology website [45]. The mean values of the meteorological parameters above for each sample are also shown in Table S1.
The HYSPLIT (HYbrid Single-Particle Lagrangian Integrated Trajectory) model was used for simulating air mass backward trajectories [46]. It was run online at the NOAA ARL READY (NOAA Air Resources Laboratory Ready) Website using the meteorological data archives of Air Resource Laboratory (ARL). The meteorological input data used in the model were obtained from NCEP’s (National Centers for Environmental Prediction) global data assimilation system (GDAS) with a horizontal resolution of 0.5° × 0.5°. Figure 2 shows the 24-h back trajectories starting at 500 m AGL (above ground level) during all sampling days at the three sites. Back trajectories in Shanghai showed mixed air masses from inland and offshore areas. Back trajectories in Xiamen and Zhangzhou indicated dominant air masses within Fujian Province. Generally, the meteorology analysis showed relatively limited areas of the traveling air masses, suggesting the collected samples should be representative of the regional characteristics.

3. Results

3.1. Sample Sequencing Data

The Shannon–Wiener curve analysis (Figure 3) showed that when the number of random sequencing strips was close to 5000, the curves of each sample tended to be flat. The Shannon index no longer increased with the increase of sequencing quantity, which indicated that the sequencing data was large enough to reflect the vast majority of species information of the samples.

3.2. Microbial Biodiversity and Community Structures

As shown in Figure 4, there were 2013, 2366, and 2162 OTUs in samples of Shanghai, Xiamen, and Zhangzhou, respectively. The number of OTUs shared among the three cities was 1651. Shanghai shared 136 and 134 additional OTUs with Xiamen and Zhangzhou, respectively, while Xiamen and Zhangzhou shared 316 additional OTUs. There were 92, 61, and 263 unique OTUs from the samples of Shanghai, Zhangzhou, and Xiamen, respectively. Xiamen and Zhangzhou shared the highest proportion of OTUs in the total detected OTUs, suggesting that Xiamen and Zhangzhou had similar bacterial community composition. This was consistent with hierarchical cluster analysis results (Figure S1).
The alpha diversity of bacterial communities in the three cities was analyzed based on the OTU level, and the mean values of Ace, Chao, Coverage, Shannon, and Simpson indexes were calculated. The sequencing Coverage index of all aerosol samples was as high as 98% and reached saturation, indicating most of the bacterial communities in the aerosol samples were covered (Figure 5a). The Ace index of the aerosol microbial community in Xiamen was higher than Zhangzhou and Shanghai, indicating the species (OTU) richness was relatively higher in Xiamen (Figure 5b). Correspondingly, the Simpson index of the aerosol microbial community in Xiamen was the lowest, indicating its diversity of bacterial community was higher than those of Shanghai and Zhangzhou (Figure 5c). We compared our results to another study on the diversity of the bacterial community in Xiamen using the T-RFLP method [32]. The Shannon index of Xiamen in that study was 2.520–3.330, much lower than this study (7.190, Figure 5d), while the Simpson index was 0.881–0.953, two orders of magnitude higher than this study (0.003, Figure 5c). This comparison indicated that the high-throughput sequencing method can better reflect the diversity of the bacteria in the atmospheric aerosol.

3.3. Variation of Bacterial Taxa based on the Phylum and Genus Levels

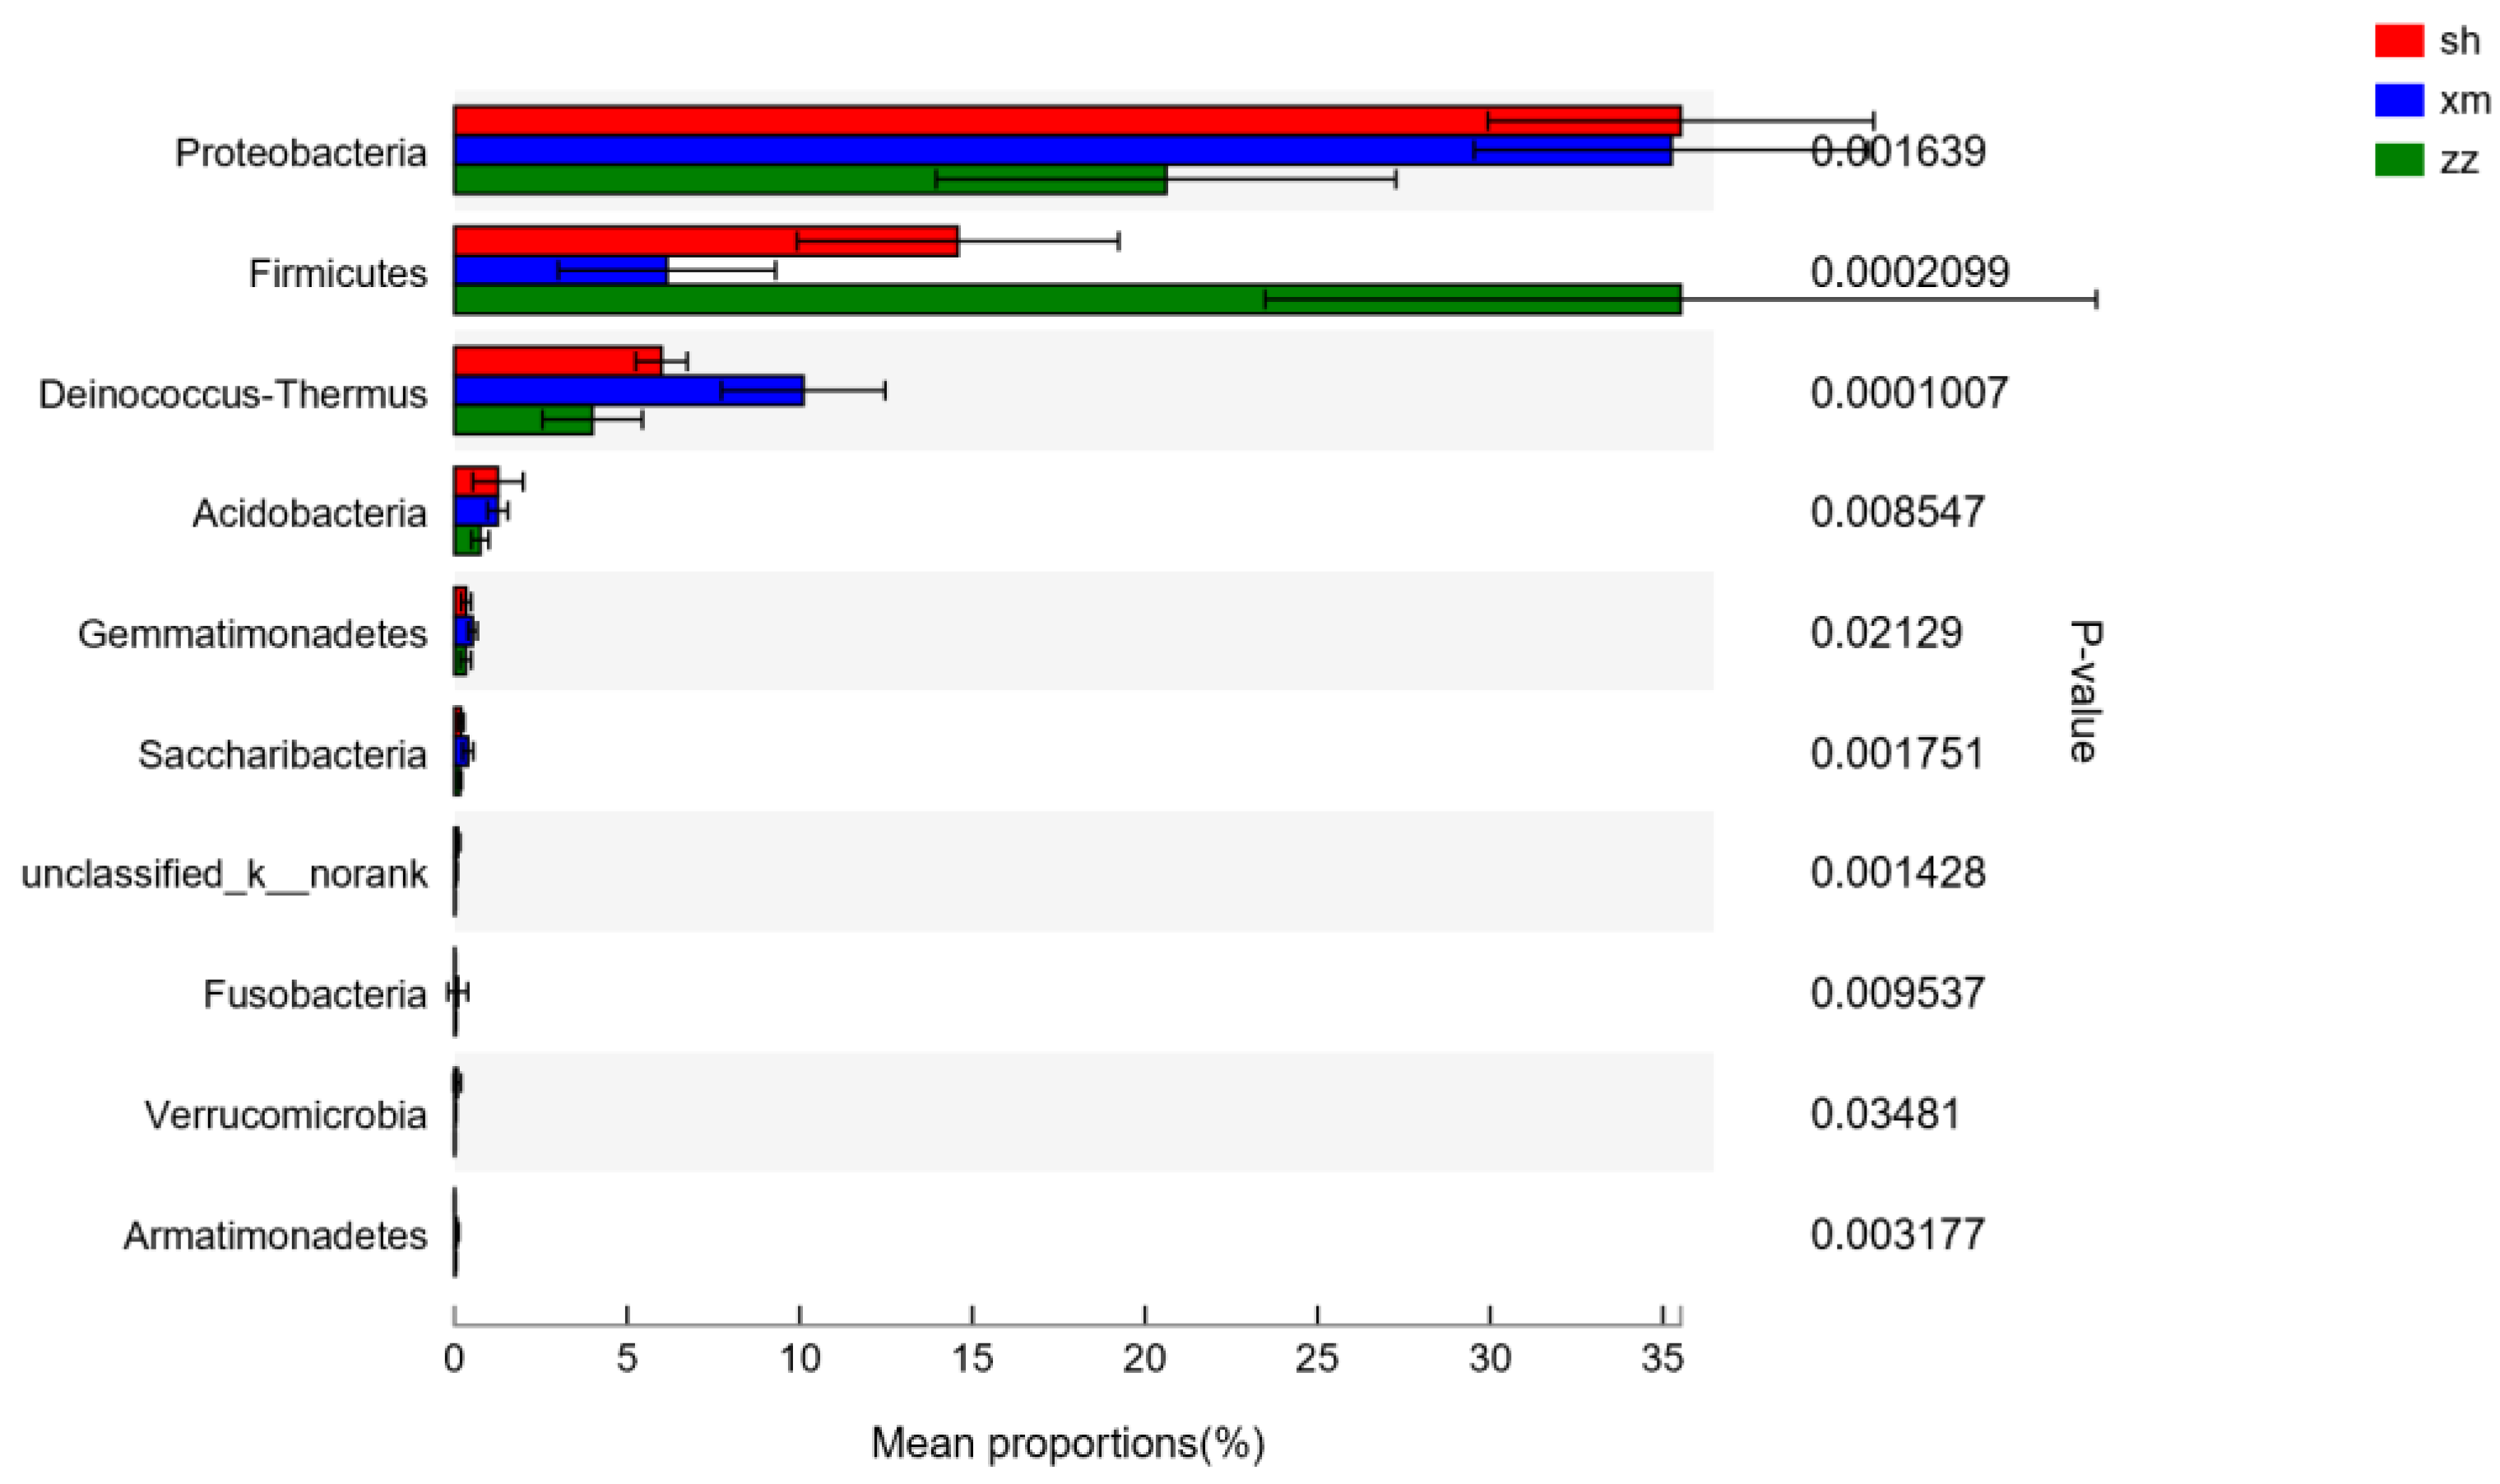
3.3.1. Characteristics of the Bacterial Community Structure at the Phylum Level

At the phylum level, the diversity of the samples from the three cities was analyzed. The major bacterial groups were summarized for each sample in Figure 6. In the eight samples collected from Shanghai, there were 21 bacterial groups, including Proteobacteria, Actinobacteria, Firmicutes, Bacteroidetes, Cyanobacteria, Deinococcus-Thermus, Acidobacteria, Chloroflexi, Chlamydiae, Gemmatimonadetes, Saccharibacteria, Verrucomicrobia, Planctomycetes, Nitrospirae, Armatimonadetes, Bacteria_unclassified, Chlorobi, Latescibactera, Fusobacteria, SHA-109, and Spirochaetes. Among these groups, Proteobacteria, Actinobacteria, and Firmicutes were the dominant bacterial groups and were detected in each sample with their relative abundances of 36%, 26%, and 14%, respectively. These dominant phyla above accounted for about 75% of the total phylum. As for the sample-to-sample difference, sh1, sh4, and sh6 showed relative higher abundances of Cyanobacteria, corresponding to the sampling days of backward trajectories from the offshore areas (Figure 2). Phytoplanktons in the ocean may account for part of Cyanobacteria [26].
In the 12 samples collected from Xiamen, there were 24 bacterial groups, including Proteobacteria, Actinobacteria, Firmicutes, Bacteroidetes, Cyanobacteria, Deinococcus-Thermus, Acidobacteria, Chloroflexi, Chlamydiae, Gemmatimonadetes, Saccharibacteria, Verrucomicrobia, Planctomycetes, Nitrospirae, Armatimonadetes, Chlorobi, Bacteria_unclassified, Latescibactera, Fusobacteria, TM6, SHA-109, Parcubacteria, Fibrobacteres, and Spirochaetes. Among them, Proteobacteria, Actinobacteria, and Cyanobacteria were the dominant bacterial groups and their relative abundances were 35%, 28%, and 12%, respectively, accounting for about 75% of the total. At the three sites in Xi’an, the relative abundance of Proteobacteria in PM2.5 was also found the highest [47]. In a study of an urban Mediterranean area in Greece [48], Proteobacteria accounted for 47% of the total number of OTUs, followed by Firmicutes (18%), Actinobacteria (17%), and Bacteroidetes (10%). Back trajectories during the sampling days in Xiamen dominantly traveled over a restricted area (Figure 2), probably explaining the relatively small difference of bacterial community structure among the collected samples.
As for the six samples collected from Zhangzhou, there were 22 bacterial groups, including Proteobacteria, Actinobacteria, Firmicutes, Bacteroidetes, Cyanobacteria, Deinococcus-Thermus, Acidobacteria, Chloroflexi, Chlamydiae, Gemmatimonadetes, Saccharibacteria, Verrucomicrobia, SHA-109, Deferribacteres, Planctomycetes, Nitrospirae, Armatimonadetes, Chlorobi, Bacteria_unclassified, Acidobacteria, Spirochaetes, and Tenericute. Among them, Firmicutes, Actinobacteria, and Proteobacteria were the dominant bacterial groups and their relative abundances were 35%, 24%, and 21%, respectively, accounting for about 80% of the total. Firmicutes in the z1, z2, and z4 samples showed much lower relative abundance than the other samples. As discussed later, Firmicutes may be related to local agriculture activities. The lower Firmicutes observed in the samples above should be ascribed to the mixed air masses via long-range transport (Figure 2).
The relative abundances of the bacterial groups in the three cities are shown in Table 1. There were 19 bacterial groups shared among the three cities, i.e., Proteobacteria, Actinobacteria, Firmicutes, Bacteroides, Cyanobacteria, Deinococcus-Thermus, Acidobacteria, Chloroflexi, Gemmatimonadetes, Saccharibacteria, Verrucomicrobia, Planctomycetes, Armatimonadetes, Nitrospirae, Chlamydiae, SHA-109, Bacteria_unclassified, Spirochaetes, and Fusobacteria. In addition, some unique categories of bacteria in each city were found. The unique categories in Shanghai were Latescibacteria. In Xiamen, the unique categories were Fibrobacteres and TM6. While in Zhangzhou, the unique categories were Tenericutes. The categories shared by Zhangzhou and Xiamen but not in Shanghai were Deferribacteres and Parcubacteria.
The seven common bacterial groups in the three cities, i.e., Proteobacteria, Actinobacteria, Firmicutes, Bacteroides, Cyanobacteria, Deinococcus-Thermus, and Acidobacteria, accounted for more than 90% of the relative abundances of the total bacteria. Among them, three phyla (Proteobacteria, Actinobacteria, and Firmicutes) were the most dominant, accounting for more than 75% of the relative abundances of the total bacterial groups. It can be seen that although the three cities located in different regions of China, the types of aerosol bacteria did not differ significantly between cities. It can also be seen that the three phyla, Proteobacteria, Actinobacteria, and Firmicutes, distributed most widely among aerosol bacteria and had strong adaptability to the atmospheric environment. Among them, Proteobacteria belongs to Gram-negative bacteria, which are widely distributed and have a strong resistance to low temperature and radiation [49,50]. Actinobacteria belongs to Gram-positive bacteria, which exist widely in soil, indicating that soil was an important source of airborne bacterial community. Firmicutes are a large group of Gram-positive bacteria, which originally included all Gram-positive bacteria. At present, however, it only included Gram-positive bacteria with low G-C content, while those with high G-C base-paires content are classified into Actinobacteria. Many Firmicutes are able to produce spores, which could resist dehydration and extreme environments.
The results of the difference analysis among the samples of the three cities are shown in Figure 7. The main different groups at the phylum level were Proteobacteria (P < 0.01), Firmicutes (P < 0.01), Deinococcus-Thermus (P < 0.001), Acidobacteria (P < 0.001), Gemmatimonadetes (P < 0.05), Saccharibacteria (P < 0.01), Bacteria_unclassified (P < 0.01), Fusobacteria (P < 0.01), Verrucomicrobia (P < 0.05), and Armatimonadetes (P < 0.01). As for the other bacterial groups, no significant differences were found among the three cities, e.g., Actinobacteria, Bacteroidetes, and Cyanobacteria.
The relative abundances of the dominant phylum in Zhangzhou were quite different from those in Shanghai and Xiamen (Table 1). The relative abundance of Firmicutes (35%), which is a large group of mostly Gram-positive bacteria, in Zhangzhou was much higher than that in Shanghai (13%) and Xiamen (6%). The relative abundance of Actinomycetes (24%) in Zhangzhou was slightly lower than that in Shanghai (26%) and Xiamen (28%). Furthermore, the relative abundance of Proteobacteria (21%) in Zhangzhou was much lower than that in Shanghai (36%) and Xiamen (35%). The results above should be related to the characteristics of environmental conditions in different cities. Shanghai has a dense population with a complicated urban environment. In addition, the temperature was relatively low at the time of sampling, thus facilitating the survival of Proteobacteria. The sampling site in Xiamen was more or less influenced by the construction works at the Xiamen University Visitor Center and excavation of the underground garage, hence the surface area was exposed to a larger bare soil. This may explain that the relative abundance of Actinomycetes in Xiamen was relatively higher than the other two cities as soil is the main source of Actinomycetes. In Zhangzhou, the relative abundance of Actinomycetes was lower than that in both Shanghai and Xiamen. As Zhangzhou is an agricultural developed city, large amounts of chemical fertilizers were applied in agricultural production for a long time, resulting in a poor soil environment for the survival of Actinomycetes, ultimately affecting the structure of airborne bacterial community. Hou [51] confirmed that the increased amount of urea would kill more Actinomycetes in soil and affect the number of Actinomycetes.
The results above showed that although there were differences in the structural characteristics of bacterial communities in three geographic regions, the bacterial community structure and the dominant groups showed similarity to a certain extent. For example, the relative abundances of Actinobacteria, Proteobacteria, and Firmicutes in the samples of the three cities were relatively high, which was consistent with the studies by using molecular biology methods [49,52,53,54,55] Bowers [56] also found relatively high proportions of Proteobacteria, Firmicutes, and Actinobacteria in the bacteria aerosols collected in Colorado and their abundances were not related to weather conditions. This should be related to the strong adaptability of Proteobacteria to the environment and their resistance to low temperature and radiation [49,50]. The abundances of Actinomycetes were high in all three cities and Actinomycetes were mainly from soil, suggesting that soil was an important common source of aerosol bacterial communities in the three cities. One of the dominant species in both Shanghai and Xiamen was Deinococcus, which may be related to the effects of human activities and the influence of the mixing of dust with local pollution aerosols in Shanghai and Xiamen.

3.3.2. Characteristic of the Bacterial Community Structure at the Genus Level

At the genus level, a total of 687 bacterial groups were detected in Shanghai (Figure 8). The dominant genera and their relative abundances were Deinococcus (5%), Rubellimicrobium (5%), Sphingomonas (4%), Paracoccus (4%), and Chroococcidiopsis (4%). A total of 769 bacterial groups were detected in Xiamen. The dominant genera and their relative abundances were Deinococcus (9%), Rubellimicrobium (4%), Chroococcidiopsis (4%), Cyanobacteria (Unclassified) (4%), and Paracoccus (4%). A total of 726 bacterial groups were detected in Zhangzhou. The dominant genera and the relative abundances were Clostridium (8%), Cyanobacteria (Unclassified) (4%), Lactobacillus (4%), Terrisporobacter (4%), and Deinococcus (3%). Clostridium is anaerobic and its relative abundance in Zhangzhou was much higher than Xiamen (0.3%) and Shanghai (3%). There were 617 bacterial groups common in the three cities, 642 common in Shanghai and Xiamen, 645 common in Shanghai and Zhangzhou, and 684 common in Zhangzhou and Xiamen. There were 17, 60, and 14 unique bacterial groups in Shanghai, Xiamen, and Zhangzhou, respectively. At the genus level, the bacterial composition in the three cities was significantly different, especially between Zhangzhou and the other two cities. In Zhangzhou, Clostridium, Terrisporobacter, Deinococcus, Lactobacillus, and Cyanobacteria (Unclassified) were the dominant genera. Of which, Clostridium was anaerobic and probably originated from the water body and sediment of Jiulong River nearby the sampling site, which was closely related to the agriculture activities as mentioned in the above section and will be discussed in the next section in details. The dominant genera in Shanghai were Deinococcus, Sphingomonas, Paracoccus, Rubellimicrobium, and Chroococcidiopsis, which were also present in Xiamen samples. These results were quite different from some other studies. Fang [57] analyzed the structure of the airborne bacterial community in Beijing and found that the dominant genera were Micrococcus, Staphylococcus, Bacillus, and Corynebacterium. In the urban areas of Xi’an, Staphylococcus and Micrococcus accounted for 50.0% and 16.7% of the total airborne bacteria on haze days, and 60.9% and 34.8% on non-haze days, respectively [34]. In an indoor environment, staphylococcus was also found dominant and occupied 49.0% to 61.3% of indoor air with S. aureus detected in all samples [58]. Zhao [59] reported that the dominant genera were Lactococcus, Kocuria, and Leuconostoc in the aerosol samples collected in autumn in urban streets of Qingdao. This may be due to the fact that the dominant bacterial groups were strongly affected by the meteorological conditions in the specific regions and the contribution from the external environment [60].
It must be noted that the dominant genus common in the three cities, i.e., abnormal Deinococcus, widely distributed in most aerosol samples. Abnormal Deinococcus is spherical with a diameter of 0.5–3 μm, pairwise or quadruple, which is larger than other cocci and Gram-positive bacteria. The composition of the cell wall is more complex and has several layers of structure. These characteristics make it not only have a strong resistance to the radiation which causes the lethal effect of cells, but also endure the adverse factors such as drying, high temperature, low temperature, oxidants, and so on. Due to its special resistance to harsh environments, it has been found in many long-range transported aerosol samples and may become dominant species [61].
At the genus level, 308 bacterial groups were significantly different in the three cities (P < 0.05). The significantly different bacterial groups accounted for 45%, 40%, and 42% of the bacterial communities in Shanghai, Xiamen, and Zhangzhou, respectively. Among them, the bacterial groups with significant differences and with higher relative abundances in Shanghai were Deinococcus (5%, P < 0.001), Rubellimicrobium (5%, P < 0.01), Sphingomonas (4%, P < 0.05), and Paracoccus (4%, P < 0.01). In Xiamen, they were Deinococcus (8%, P < 0.001), Rubellimicrobium (4%, P < 0.01), Paracoccus (4%, P < 0.01), Sphingomonas (4%, P < 0.05), and Geodermatophilus (3%, P < 0.001). While in Zhangzhou, they were Clostridium (9%, P < 0.001), Lactobacillus (4%, P < 0.05), Terrisporobacter (4%, P < 0.001), Deinococcus (3%, P < 0.001), and Streptococcus (3%, P < 0.01).
There were 18 genera of pathogenic bacteria (Flavobacterium, Bacteroides, Streptococcus, Bacillus, Micrococcus, Mycobacterium, Pseudomonas, Acinetobacter, Enterococcus, Staphylococcus, Escherichia-Shigella, Actinomyces, Serratia, Nocardia, Vibrio, Peptococcus, Legionella, Moraxella) detected in 26 samples from all the three cities, although their relative abundances were relatively low. Of which, Pseudomonas acted as a common nucleus of ice crystals in the formation of snow and rain universally [62].

4. Discussions

Based on the analysis above, it is clear that some differences between the dominant phyla and genera in airborne bacteria existed in the three cities. There were various influencing factors accounting for this, such as geographical locations, meteorological conditions, urban population as well as other natural, economic, and social environmental characteristics [63].
Shanghai is a world-class city with a high population and complex urban environment. Shanghai is also among the four haze regions of China. The air quality in Shanghai has been affected by vehicle exhausts, coal-burning emissions, biomass burning, and seldom long-range transported dust from northern and northwestern China. Due to that suspended fine particles have a strong ability to adsorb bacteria and water in the atmosphere, bacteria are parasitic on those suspended fine particles as carriers. In addition, the exhausts and the burning of straws could provide abundant nutrients (carbon, ammonium, nitrate, sulfate, as well as iron, zinc, manganese, etc.) for the bacteria. For example, Deinococcus-Thermus bacteria are kinds of coccus which can resist harsh environment. Deinococcus has more than 40 species classified in three genera, and have radiation tolerance to ultraviolet and gamma rays. Thermus bacteria include several heat-resistant genera, which are found as the dominant genera in Shanghai. It is obvious that there are many pathogenic bacteria and conditional pathogens in the polluted atmosphere. When people live in this mixed polluted aerosol environment for a long time, suspended fine particles can carry bacteria (such as Pneumococci) into the human respiratory system and then to the depths of the lungs and even into the blood. This would cause blood poisoning and lead to respiratory and cardiovascular diseases. Zhang [64] reported that the relative abundance of Proteobacteria in Shanghai could reach 86.8% when the air quality changed from good to mild pollution. This study also showed that the proportion of Actinomycetes in aerosol bacteria increased in polluted days.
Xiamen is a typical coastal tourism city. The sampling site was located in the concentrated area of Xiamen’s tourist attractions, which was affected by the marine environment, tourist aggregation, and the construction of the Xiamen University tourist center nearby. The dominant genus of Xiamen was Geodermatophilus, which belongs to Actinobacteria and widely distributed in the natural soil and water environment. The relative abundance of Actinomycetes in Xiamen was the highest among the three cities and should be related to the exposure of soil during the construction periods in Xiamen. This was consistent with the study of a long-range transport dust event in Japan that Bacillus and Actinobacterium species dominated the bacterial community at 3000 m [65]. Actinobacteria can cause tuberculosis and leprosy [48]. Geodermatophilus was not the dominant genus in the dust samples originating from North Africa, Syria, and Saudi Arabia [66]. However, under a different dust transport pathway from North-African and South-European soils in December, the relative abundance of Geodermatophilaceae reached over 15% [67].
Zhangzhou displayed different dominant genera from the other two cities. This might be related to the geographical environment of Zhangzhou which is adjacent to the Jiulong River estuary and has extensive uses of chemical fertilizers and other agricultural activities. Zhangzhou is a big agricultural city with a large number of farmlands, sewage, and animal feces as well as ponds and big and small rivers. According to the statistical data of the Fujian Agricultural Department and Zhangzhou Agricultural Bureau [68], the average fertilizer application rate per mu (=0.0667 hectares) in Fujian Province was among the highest in the whole country, about 150 kg per mu. In comparison, the application rate of chemical fertilizer per mu in Zhangzhou was even higher than the mean value in Fujian Province, reaching 188 kg per mu (nitrogen fertilizer accounted for about 1/3). However, the utilization efficiency of the fertilizer was only about 30% and nitrogen fertilizer was unstable and easy to decompose. The temperature in Zhangzhou is high, and most of the unused nitrogen fertilizers (mainly urea and ammonium salt) would be hydrolyzed in the soil. It is easy to decompose and produce a large amount of ammonia, carbon dioxide, and nitrogen oxides and form an anoxic environment by bacterial action. This environment is beneficial for the growth of anaerobes such as Clostridium in the soil but not for the growth of aerobic bacteria. When the temperature is even higher (above 30 °C), these gases evaporate and carry the anaerobes in the soil, such as Clostridium tetanus, Clostridium capsula, and Clostridium botulinum, into the atmosphere. That is to say, a large number of gases produced by nitrogen fertilizer decomposition in the soil can act as carriers to transport Clostridium perfringens. In addition, a large number of nitrogen fertilizers is transported to the Jiulong River through surface runoff, and enter the sediment deposited in the estuary by means of attachment and adsorption. Nitrogen fertilizer consumes oxygen in the decomposition process in soil and sediment, and it will form an anaerobic environment, so it is suitable for the survival of anaerobes. In those aerosol samples collected from Zhangzhou, a large number of anaerobic bacteria or concurrent anaerobic bacteria, such as Clostridium, Lactobacia, Streptococci, etc., have been found. This may be due to the fact that the sampling site was located near the Jiulong River, where is prone to produce and release the anaerobes into the air. Hou [69] analyzed the important pathogenic bacteria in the Jiulong River water based on the 16S rRNA gene-454 pyrophosphate sequencing technique. It was found that there were a large number of pathogenic bacteria in Jiulong River water, among which Clostridium, Mycobacterium, and Spannularia were detected in all samples. Those bacteria were also found in the aerosol bacterial community in Zhangzhou. This has been related to the pathogen pollution caused by the increase of nutrients in water bodies due to by agricultural production activities [70]. In addition, there were a large number of pathogenic bacteria such as Vibrio sps. in the sediments of the Jiulong River, which may be caused by the growth and reproduction of pathogenic bacteria promoted by a high concentration of nutrients. Previous studies showed that Acinetobacter was abundant in water [71], however, Acinetobacter was minor in this study. E. coli and P. aeruginosa were found from Tijuana River and a wastewater treatment site in Mexico [72]. Therefore, we speculate that excessive use of chemical fertilizers, especially nitrogen fertilizer, might be an important source for the high relative abundance of Clostridium in atmospheric aerosol bacteria in Zhangzhou.

5. Conclusions

1. In this study, it was demonstrated that the 16S rRNA gene high-throughput sequencing can efficiently extract substantial microbial species in the airborne aerosols. The diversity and composition of bacteria community had been well characterized, thus providing a comprehensive and systematic analysis for the study of the bacterial community in the atmosphere.
2. The relative abundances of the atmospheric bacteria group in three Chinese cities (i.e., Shanghai, Xiamen, and Zhangzhou) were significantly different, while the bacterial community structure characteristics were similar. At the phylum level, Shanghai and Xiamen showed a similar relative abundance of Proteobacteria and Actinobacteria, higher than those observed in Zhangzhou. The relative abundance of Firmicutes in Zhangzhou (35%) was much higher than that in Shanghai (13%) and Xiamen (6%). At the genus level, the most dominant genus in Shanghai and Xiamen was Deinococcus and their relative abundances were 5% and 9%, respectively. The most dominant genus in Zhangzhou was Clostridium, and its relative abundance was 9%, higher than that in Shanghai (3%) and Xiamen (0.3%).
3. Harmful microorganisms (such as Deinococcus and Paracoccus) were outstanding in aerosols over the mega-city Shanghai, implying strong influences from the human activities. As a comparison, the dense tourist population and frequent construction works had an important impact on the bacterial community structure in Xiamen as seen from the fact that Geodermatophilus was the dominant genus. The relative abundance of the genus Clostridium in Zhangzhou was the highest among the three cities, which was attributed to the overuse of chemical fertilizer in agricultural production.
4. Eighteen genera of pathogenic bacteria in the microbial aerosols over the three cities were detected. The overactivity of human beings could produce many types of pathogenic bacteria and conditional pathogenic bacteria in the atmosphere and it could have a potential threat to human health.

Supplementary Materials

The following are available online at https://www.mdpi.com/2073-4433/11/4/317/s1, Table S1: Sampling information of all the samples, Figure S1: Tree diagram of similarity of 26 samples from three cities (sh: Shanghai; xm: Xiamen; zz: Zhangzhou).

Author Contributions

All authors have read and agree to the published version of the manuscript. Data curation, Y.R. and H.L.; formal analysis, Y.R., J.C., and J.X.; methodology, Y.R. and H.L.; resources, H.L.; supervision, H.L., K.H., and G.Z.; writing—original draft, Y.R.; writing—review and editing, H.L., K.H., M.C., and G.Z. All authors have read and agreed to the published version of the manuscript.

Funding

This research was funded by the National Key R&D Program of China (2018YFC0213105), the National Natural Science Foundation of China (91644105), National Programme on Global Change and Air-Sea Interaction (GASI-03-01-03-01), the National Natural Science Foundation of China (41506179), the Natural Science Foundation of Shanghai (18230722600, 19ZR1421100), the Scientific Research Foundation of Third Institute of Oceanography, SOA (2014003), and the Natural Science Foundation of Fujian Province (2015J01613).

Acknowledgments

The authors acknowledge support of the National Key R&D Program of China (2018YFC0213105), the National Natural Science Foundation of China (91644105), National Programme on Global Change and Air-Sea Interaction (GASI-03-01-03-01), the National Natural Science Foundation of China (41506179), the Natural Science Foundation of Shanghai (18230722600, 19ZR1421100), the Scientific Research Foundation of Third Institute of Oceanography, SOA (2014003), and the Natural Science Foundation of Fujian Province (2015J01613). Data Availability: All sequences have been deposited in the National Center for Biotechnology Information (NCBI) GenBank under SRA accession number of SRP219061.

Conflicts of Interest

The authors declare no conflict of interest.

References

  1. Delort, A.; Vaïtilingom, M.; Amato, P.; Sancelme, M.; Parazols, M.; Mailhot, G.; Laj, P.; Deguillaume, L. A short overview of the microbial population in clouds: Potential roles in atmospheric chemistry and nucleation processes. Atmos. Res. 2010, 98, 249–260. [Google Scholar] [CrossRef]
  2. Fröhlich-Nowoisky, J.; Kampf, C.J.; Weber, B.; Huffman, J.A.; Pöhlker, C.; Andreae, M.O.; Lang-Yona, N.; Burrows, S.M.; Gunthe, S.S.; Elbert, W.; et al. Bioaerosols in the Earth system: Climate, health, and ecosystem interactions. Atmos. Res. 1997, 15, 346–376. [Google Scholar] [CrossRef] [Green Version]
  3. Peccia, J.; Hospodsky, D.; Bibby, K. New Directions: A revolution in DNA sequencing now allows for the meaningful integration of biology with aerosol science. Atmos. Environ. 2010, 45, 1896–1897. [Google Scholar] [CrossRef]
  4. Den Boer, J.W.; Yzerman, E.P.F.; Schellekens, J.; Lettinga, K.D.; Boshuizen, H.C.; Van Steenbergen, J.E.; Bosman, A.; Van den Hof, S.; Van Vliet, H.A.; Peeters, M.F.; et al. A large outbreak of Legionnaires’ disease at a flower show, the Netherlands, 1999. Emerg. Infect. Dis. 2001, 8, 37–43. [Google Scholar] [CrossRef] [Green Version]
  5. Douwes, J.; Wouters, I.; Dubbeld, H.; van Zwieten, L.; Steerenberg, P.; Doekes, G.; Heederik, D. Upper airway inflammation assessed by nasal lavage in compost workers: A relation with bio-aerosol exposure. Am. J. Ind. Med. 2000, 37, 459–468. [Google Scholar] [CrossRef]
  6. Brągoszewska, E. Exposure to Bacterial and Fungal Aerosols: Microorganism Indices in A Waste-Sorting Plant in Poland. Int. J. Environ. Res. Public Health 2019, 16, 3308. [Google Scholar] [CrossRef] [Green Version]
  7. Wright, T.J.; Greene, V.W.; Paulus, H.J. Viable microorganisms in an urban atmosphere. J. Air Pollut. Control Assoc. 1969, 19, 337–341. [Google Scholar] [CrossRef]
  8. Thorne, P.S.; Kulhánková, K.; Yin, M.; Cohn, R.; Arbse, S.J.; Zeldin, D.C. Endotoxin exposure is a risk factor for asthma: The national survey of endotoxin in United States housing. Am. J. Respir Crit. Care Med. 2005, 172, 1371–1377. [Google Scholar] [CrossRef]
  9. Wan, G.H.; Chung, F.F.; Tang, C.S. Long-term surveillance of air quality in medical center operating rooms. Am. J. Infect. Control. 2010, 39, 302–308. [Google Scholar] [CrossRef]
  10. Urbano, R.; Palenik, B.; Gaston, C.J.; Prather, K.A. Detection and phylogenetic analysis of coastal bioaerosols using culture dependent and independent techniques. Biogeosci. Discuss. 2010, 7, 301–309. [Google Scholar] [CrossRef]
  11. Després, V.R.; Huffman, J.A.; Burrows, S.M.; Hoose, C.; Safatov, A.S.; Buryak, G.; Fröhlich Nowoisky, J.; Elbert, W.; Andreae, M.O.; Pöschl, U.; et al. Primary biological aerosol particles in the atmosphere: A review. Tellus B Chem. Phys. Meteorol. 2011, 64, 145–153. [Google Scholar] [CrossRef] [Green Version]
  12. Zhai, J.H.; Zhai, H. Analysis and identification of airborne fungi in Beijing and Nanjing. China Public Health 2000, 16, 1026. [Google Scholar]
  13. Yamaguchi, N.; Park, J.; Kodama, M.; Ichijo, T.; Baba, T.; Nasu, M. Changes in the airborne bacterial community in outdoor environments following Asian dust events. Microbes Environ. 2014, 29, 82–88. [Google Scholar] [CrossRef] [Green Version]
  14. Mayol, E.; Arrieta, J.M.; Jiménez, M.A.; Martínez-Asensio, A.; Garcias-Bonet, N.; Dachs, J.; González-Gaya, B.; Royer, S.-J.; Benítez-Barrios, V.M.; Fraile-Nuez, E.; et al. Long-range transport of airborne microbes over the global tropical and subtropical ocean. Nat. Commun. 2017, 8, 1–9. [Google Scholar] [CrossRef]
  15. Jones, S.E.; Newton, R.J.; McMahon, K.D. Potential for atmospheric deposition of bacteria to influence bacterioplankton communities. FEMS Microbiol. Ecol. 2008, 64, 388–394. [Google Scholar] [CrossRef]
  16. Monteil, C.L.; Bardin, M.; Morris, C.E. Features of air masses associated with the deposition of Pseudomonas syringae and Botrytis cinerea by rain and snowfall. ISME J. 2014, 8, 2290–2304. [Google Scholar] [CrossRef] [Green Version]
  17. Peter, H.; Hortnagl, P.; Reche, I.; Sommaruga, R. Bacterial diversity and composition during rain events with and without Saharan dust influence reaching a high mountain lake in the Alps. Environ. Microbiol. Rep. 2014, 6, 618–624. [Google Scholar] [CrossRef] [Green Version]
  18. Reche, I.; D’Orta, G.; Mladenov, N.; Winget, D.M.; Suttle, C.A. Deposition rates of viruses and bacteria above the atmospheric boundary layer. ISME J. 2018, 12, 1154–1162. [Google Scholar] [CrossRef] [Green Version]
  19. Jones, A.M.; Harrison, R.M. The effects of meteorological factors on atmospheric bioaerosol concentrations—A review. Sci. Total Environ. 2004, 326, 151–180. [Google Scholar] [CrossRef]
  20. Yahya, R.Z.; Arrieta, J.M.; Cusack, M.; Duarte, C.M. Airborne Prokaryote and Virus Abundance Over the Red Sea. Front. Microbiol. 2019, 10. [Google Scholar] [CrossRef]
  21. Rahav, E.; Ovadia, G.; Paytan, A.; Herut, B. Contribution of airborne microbes to bacterial production and N2 fixation in seawater upon aerosol deposition. Geophys. Res. Lett. 2016, 43, 719–727. [Google Scholar] [CrossRef] [Green Version]
  22. Marín-Beltrán, I.; Logue, J.B.; Andersson, A.F.; Peters, F. Atmospheric deposition impact on bacterial community composition in the NW Mediterranean. Front. Microbiol. 2019, 10. [Google Scholar] [CrossRef]
  23. Brągoszewska, E.; Pastuszka, J.S. Influence of meteorological factors on the level and characteristics of culturable bacteria in the air in Gliwice, Upper Silesia (Poland). Aerobiologia 2018, 34, 241–255. [Google Scholar] [CrossRef] [Green Version]
  24. Brown, G.D.; Denning, D.W.; Gow, N.A.R.; Levitz, S.M.; Netea, M.G.; White, T.C. Hidden killers: Human fungal infections. Sci. Transl. Med. 2012, 4, 165rv13. [Google Scholar] [CrossRef] [Green Version]
  25. García Blázquez, G.; Göker, M.; Voglmayr, H.; Martín, M.P.; Tellería, M.T.; Oberwinkler, F. Phylogeny of Peronospora, parasitic on Fabaceae, based on ITS sequences. Mycol. Res. 2008, 112, 502–512. [Google Scholar] [CrossRef]
  26. Lang-Yona, N.; Lehahn, Y.; Herut, B.; Burshtein, N.; Rudich, Y. Marine aerosol as a possible source for endotoxins in coastal areas. Sci. Total Environ. 2014, 499, 311–318. [Google Scholar] [CrossRef]
  27. Robertson, C.E.; Baumgartner, L.K.; Harris, J.K.; Peterson, K.L.; Stevens, M.J.; Frank, D.N.; Pace, N.R. Culture-independent analysis of aerosol microbiology in a metropolitan subway system. Appl. Environ. Microbiol. 2013, 79, 3485–3493. [Google Scholar] [CrossRef] [Green Version]
  28. Bertolini, V.; Gandolfi, I.; Ambrosini, R.; Bestetti, G.; Innocente, E.; Rampazzo, G.; Franzetti, A. Temporal variability and effect of environmental variables on airborne bacterial communities in an urban area of Northern Italy. Appl. Microbiol. Biotechnol. 2013, 97, 6561–6570. [Google Scholar] [CrossRef] [Green Version]
  29. Gao, M.; Qiu, T.; Jia, R.; Han, M.; Song, Y.; Wang, X. Concentration and size distribution of viable bioaerosols during non-haze and haze days in Beijing. Environ. Sci. Pollut. Res. 2015, 22, 4359–4368. [Google Scholar] [CrossRef]
  30. Shao, C.C.; Zhen, Y.; Mi, T.Z.; Ma, M.M.; Feng, W.R. Characterization of Airborne Bacterial Communities in Qingdao during Haze and Non-haze Episodes in Winter. Urban Environ. Urban Ecol. 2016, 29, 7–13. [Google Scholar]
  31. Zhong, X.; Qi, J.H.; Li, H.T.; Dong, L.J.; Gao, D.M. Seasonal distribution of microbial activity in bioaerosols in the outdoor environment of the Qingdao coastal region. Atmos. Environ. 2016, 140, 506–513. [Google Scholar] [CrossRef]
  32. Liao, X.; Hu, A.Y.; Yang, X.Y.; Chen, J.S.; Yu, C.P.; Lin, J.Q. Community Composition and environmental sources of bacterial and eukaryotic microbiomes in fine air particles(PM2.5) of xiamen in winter. Ecol. Environ. Sci. 2013, 22, 1395–1400. [Google Scholar]
  33. Liao, X. Study on the Community Composition and Distribution Characteristics of Microorganisms in the Air of Xiamen; Jimei University: Xiamen, China, 2010. [Google Scholar]
  34. Li, Y.P.; Fu, H.L.; Wang, W.; Liu, J.; Meng, Q.L.; Wang, W.K. Characteristics of bacterial and fungal aerosols during the autumn haze days in Xi’an, China. Atmos. Environ. 2015, 122, 439–447. [Google Scholar] [CrossRef]
  35. Gou, H.G.; Lu, J.J.; Li, S.M.; Tong, Y.B.; Xie, C.B.; Zheng, X.W. Assessment of microbial communities in PM1 and PM10 of Urumqi during winter. Environ. Pollut. 2016, 214, 202–210. [Google Scholar] [CrossRef]
  36. Xu, C.; Wei, M.; Chen, J.; Wang, X.; Zhu, C.; Li, J.; Zheng, L.; Sui, G.; Li, W.; Wang, W.; et al. Bacterial characterization in ambient submicron particles during severe haze episodes at Ji’nan, China. Sci. Total Environ. 2016, 580, 188–196. [Google Scholar] [CrossRef] [Green Version]
  37. Rinke, C.; Schwientek, P.; Sczyrba, A.; Ivanova, N.N.; Anderson, I.J.; Cheng, J.F. Insights into the phylogeny and coding potential of microbial dark matter. Nature 2013, 499, 431–437. [Google Scholar] [CrossRef] [Green Version]
  38. Friedrich, V.W.; Göbel Ulf, B.; Erko, S. Determination of microbial diversity in environmental samples: Pitfalls of pcr-based rrna analysis. FEMS Microbiol. Rev. 1997, 21, 213–229. [Google Scholar] [CrossRef] [Green Version]
  39. Trimmomatic: A Flexible Read Trimming Tool for Illumina NGS Data. Available online: http://www.usadellab.org/cms/?page=trimmomatic (accessed on 2 February 2020).
  40. FLASh: Fast Length Adjustment of Short Reads. Available online: https://ccb.jhu.edu/software/FLASH/ (accessed on 2 February 2020).
  41. Schloss, P.D.; Gevers, D.; Westcott, S.L. Reducing the effects of PCR amplification and sequencing artifacts on 16S rRNA-based studies. PLoS ONE 2011, 6, e27310. [Google Scholar] [CrossRef] [Green Version]
  42. QIIME: Quantitative Insights into Microbial Ecology. Available online: http://qiime.org/scripts/assign_taxonomy.html (accessed on 2 February 2020).
  43. USEARCH v11. Available online: http://www.drive5.com/usearch/manual/chimera_formation.html (accessed on 2 February 2020).
  44. UCHIME Algorithm. Available online: http://www.drive5.com/usearch/manual/uchime_algo.html (accessed on 2 February 2020).
  45. WU: Weather Underground. Available online: https://www.wunderground.com (accessed on 2 February 2020).
  46. Draxler, R.; Rolph, G. HYSPLIT-Hybrid Single Particle Lagrangian Integrated Trajectory Model. 2012. Available online: https://ready.arl.noaa.gov/HYSPLIT.php (accessed on 2 February 2020).
  47. Mu, F.; Li, Y.; Lu, R.; Qi, Y.; Xie, W.; Bai, W. Source identification of airborne bacteria in the mountainous area and the urban areas. Atmos. Res. 2020, 231, 104676. [Google Scholar] [CrossRef]
  48. Genitsaris, S.; Stefanidou, N.; Katsiapi, M.; Kormas, K.; Sommer, U.; Moustaka-Gouni, M. Variability of airborne bacteria in an urban Mediterranean area (Thessaloniki, Greece). Atmos. Environ. 2017, 157, 101–110. [Google Scholar] [CrossRef]
  49. Amato, P.; Parazols, M.; Sancelme, M.; Laj, P.; Mailhot, G.; Delort, A.M. Microorganisms isolated from the water phase of tropospheric clouds at the Puy de Dôme: Major groups and growth abilities at low temperatures. FEMS Microbiol. Ecol. 2007, 59, 242–254. [Google Scholar] [CrossRef] [PubMed] [Green Version]
  50. Christner, B.C.; Mosley-Thompson, E.; Thompson, L.G.; Reeve, J.N. Bacterial recovery from ancient glacial ice. Environ. Microbiol. 2003, 5, 433–436. [Google Scholar] [CrossRef] [PubMed]
  51. Hou, Y.L.; Wang, S.G.; Guo, W. Effect of urea application amount on microbes and enzymes in soil. Chin. J. Soil Sci. 2004, 35, 303–306. [Google Scholar] [CrossRef]
  52. Amatoab, P.; Parazolsbc, M.; Sancelmea, M.; Mailhotc, G.; Lajb, P.; Delort, A.M. An important oceanic source of micro-organisms for cloud water at the Puy de Dôme (France). Atmos. Environ. 2007, 41, 8253–8263. [Google Scholar] [CrossRef]
  53. Côté, V.; Kos, G.; Mortazavi, R.; Ariya, P.A. Microbial and “de novo” transformation of dicarboxylic acids by three airborne fungi. Sci. Total Environ. 2007, 390, 530–537. [Google Scholar] [CrossRef]
  54. Perfumo, A.; Marchant, R. Global transport of thermophilic bacteria in atmospheric dust. Environ. Microbiol. Rep. 2010, 2, 333–339. [Google Scholar] [CrossRef]
  55. Christner, B.C.; Mosley-Thompson, E.; Thompson, L.G.; Zagorodnov, V.; Reeve, J.N. Recovery and Identification of Viable Bacteria Immured in Glacial Ice. Iearus 2000, 144, 479–485. [Google Scholar] [CrossRef]
  56. Bowers, R.M.; Lauber, C.L.; Wiedinmyer, C.; Hamady, M.; Hallar, A.G.; Fall, R.; Knight, R.; Fierer, N. Characterization of airborne microbial communities at a high-elevation site and their potential to act as atmospheric ice nuclei. Appl. Environ. Microbiol. 2009, 75, 5121–5130. [Google Scholar] [CrossRef] [Green Version]
  57. Fang, Z.G.; Ouyang, Z.Y.; Zhao, J.Z.; Wang, X.K.; Zheng, H. Community composition and dynamics of airborne bacteria in Beijing. Acta Microbiol. Sin. 2006, 46, 618–623. [Google Scholar] [CrossRef]
  58. Moon, K.W.; Huh, E.H.; Jeong, H.C. Seasonal evaluation of bioaerosols from indoor air of residential apartments within the metropolitan area in South Korea. Environ. Monit. Assess. 2014, 186, 2111–2120. [Google Scholar] [CrossRef]
  59. Zhao, Y.B. Studies on Air Bacterial Community Structure at Urban Streets and Wetland in Qingdao; Qingdao University of Technology: Shaidong, China, 2015. [Google Scholar]
  60. Bowers, R.M.; Sullivan, A.P.; Costello, E.K.; Collett, J.L.; Knight, R.; Fierer, N. Sources of bacteria in outdoor air across cities in the midwestern United States. Appl. Environ. Microbiol. 2011, 77, 6350–6356. [Google Scholar] [CrossRef] [Green Version]
  61. Goudarzi, G.; Shirmardi, M.; Khodarahmi, F.; Hashemi-Shahraki, A.; Alavi, N.; Ankali, K.A.; Babaei, A.A.; Soleimani, Z.; Marzouni, M.B. Particulate matter and bacteria characteristics of the Middle East Dust (MED) storms over Ahvaz, Iran. Aerobiologia 2014, 30, 345–356. [Google Scholar] [CrossRef]
  62. Attard, E.; Yang, H.; Delort, A.-M.; Amato, P.; Poschl, U.; Glaux, C.; Koop, T.; Morris, C.E. Effects of atmospheric conditions on ice nucleation activity of Pseudomonas. Atmos. Chem. Phys. 2012, 12, 10667–10677. [Google Scholar] [CrossRef] [Green Version]
  63. Mouli, P.C.; Mohan, S.V.; Reddy, S.J. Assessment of microbial (bacteria) concentrations of ambient air at semi-arid urban region: Influence of meteorological factors. Appl. Ecol. Environ. Res. 2005, 3, 139–149. [Google Scholar] [CrossRef]
  64. Zhang, X. Structure of Airborne Microbial Community and Influencing Factors; Zhejiang University: Zhejiang, China, 2016. [Google Scholar]
  65. Maki, T.; Hara, K.; Kobayashi, F.; Kurosaki, Y.; Kakikawa, M.; Matsuki, A.; Chen, B.; Shi, G.; Hasegawa, H.; Iwasaka, Y. Vertical distribution of airborne bacterial communities in an Asiandust downwind area, Noto Peninsula. Atmos. Environ. 2015, 119, 282–293. [Google Scholar] [CrossRef] [Green Version]
  66. Gat, D.; Mazar, Y.; Cytryn, E.; Rudich, Y. Origin-Dependent Variations in the Atmospheric Microbiome Community in Eastern Mediterranean Dust Storms. Environ. Sci. Technol. 2017, 51, 6709–6718. [Google Scholar] [CrossRef]
  67. Katra, I.; Arotsker, L.; Krasnov, H.; Zaritsky, A.; Kushmaro, A.; Ben-Dov, E. Richness and Diversity in Dust Stormborne Biomes at the Southeast Mediterranean. Sci. Rep. 2014, 4, 5265. [Google Scholar] [CrossRef]
  68. Zhangzhou People’s Government. Available online: www.zhangzhou.gov.cn/cms/html/zzsrmzf/2017 (accessed on 2 February 2020).
  69. Hou, L.Y.; Hu, A.Y.; Ma, Y.; Yu, C.P. Distribution of potential pathogenic bacteria in the Jiulong River Watershed. Environ. Sci. 2014, 35, 1742–1749. [Google Scholar] [CrossRef]
  70. Peeler, K.A.; Opsahl, S.P.; Chanton, J.P. Tracking anthropogenic inputs using caffeine, indicator bacteria, and nutrients in rural freshwater and urban marine systems. Environ. Sci. Technol. 2006, 40, 7616–7622. [Google Scholar] [CrossRef]
  71. Iguchi, A.; Nagaya, Y.; Pradel, E.; Ooka, T.; Ogura, Y.; Katsura, K.; Kurokawa, K.; Oshima, K.; Hattori, M.; Parkhill, J.; et al. Genome evolution and plasticity of Serratia marcescens, an important multidrug-resistant nosocomial pathogen. Genome Biol. Evol. 2014, 6, 2096–2110. [Google Scholar] [CrossRef] [Green Version]
  72. Hurtado, L.; Rodríguez, G.; Lopez, J.; Castillo, J.; Molina, L.; Zavala, M.; Quintana, P. Characterization of atmospheric bioaerosols at 9 sites in Tijuana, Mexico. Atmos. Environ. 2014, 96, 430–436. [Google Scholar] [CrossRef]
Figure 1. The locations of the three sampling sites in Shanghai, Xiamen, and Zhangzhou (denoted by the red squares).
Atmosphere 11 00317 g001
Figure 2. Twenty-four-hour air mass backward trajectories at the three sampling sites in Shanghai, Xiamen, and Zhangzhou during their respective sampling days.
Atmosphere 11 00317 g002
Figure 3. Shannon–Wiener curve of the component species in 26 samples. (sh: Shanghai; xm: Xiamen; zz: Zhangzhou).
Atmosphere 11 00317 g003
Figure 4. Venn diagram showing the similarity of 16S sequences between Shanghai (sh), Xiamen (xm), and Zhangzhou (zz).
Atmosphere 11 00317 g004
Figure 5. Average of Coverage (a), Ace (b), Simpson index (c), and Shannon index (d) of the aerosols in the three cities (sh: Shanghai; xm: Xiamen; zz: Zhangzhou).
Atmosphere 11 00317 g005
Figure 6. Composition of bacterial community structure in 26 samples at the phylum level. (sh: Shanghai; xm: Xiamen; zz: Zhangzhou).
Atmosphere 11 00317 g006
Figure 7. Bacteria flora difference check column at the phylum level. (sh: Shanghai; xm: Xiamen; zz: Zhangzhou).
Atmosphere 11 00317 g007
Figure 8. Composition diagram of the bacterial community of 26 samples at genus level. (sh: Shanghai; xm: Xiamen; zz: Zhangzhou; the abundance of a group less than 0.01% was merged into other groups).
Atmosphere 11 00317 g008
Table 1. Relative abundances (average with one standard deviation) of phylum in three cities.
PhylumShXmZz
Proteobacteria35.61 ± 5.5935.16 ± 5.7220.92 ± 6.66
Actinobacteria25.69 ± 3.6928.09 ± 6.4423.87 ± 3.14
Firmicutes13.82 ± 4.666.12 ± 3.1534.82 ± 12.04
Bacteroidetes5.10 ± 0.644.71 ± 2.554.04 ± 1.40
Cyanobacteria9.96 ± 4.3811.59 ± 5.369.55 ± 2.69
Deinococcus-Thermus5.95 ± 0.7510.18 ± 2.374.09 ± 1.45
Acidobacteria1.29 ± 0.731.25 ± 0.290.75 ± 0.25
Chloroflexi1.53 ± 0.941.53 ± 0.381.21 ± 0.34
Gemmatimonadetes0.35 ± 0.150.52 ± 0.130.33 ± 0.16
Saccharibacteria0.17 ± 0.080.39 ± 0.160.16 ± 0.05
Planctomycetes0.26 ± 0.290.08 ± 0.040.09 ± 0.04
Bacteria-unclassified0.10 ± 0.060.05 ± 0.030.01 ± 0.01
Nitrospirae0.03 ± 0.020.05 ± 0.030.03 ± 0.02
Fusobacteria0.01 ± 0.010.10 ± 0.290.03 ± 0.01
Latescibacteria0.01 ± 0.03n.an.a
Chlorobi0.02 *0.02 ± 0.06n.a
Armatimonadetes0.06 ± 0.050.03 ± 0.02
Spirochaetes0.02 ± 0.040.04 ± 0.04
SHA-1090.02 ± 0.030.01 *
Verrucomicrobia0.08 ± 0.100.03 ± 0.02
Deferribacteresn.a0.02 ± 0.04
Parcubacterian.a0.01 *
Chlamydiae0.02 ± 0.020.01 ± 0.02
TM6n.an.a
Fibrobacteresn.an.a
Tenericutesn.an.a0.01 ± 0.02
* The abundance of the combination of several groups with lower content; n.a: not available, stands for none; sh: Shanghai; xm: Xiamen; zz: Zhangzhou.

