Article

Functional Factors of Biomass Burning Contribution to Spring Aerosol Composition in a Megacity: Combined FTIR-PCA Analyses

1
Scobeltsyn Institute of Nuclear Physics, Lomonosov Moscow State University, 119991 Moscow, Russia
2
Center for Sustainable Mobility, Czech Technical University in Prague, 160 00 Prague, Czech Republic
*
Author to whom correspondence should be addressed.
Atmosphere 2020, 11(4), 319; https://doi.org/10.3390/atmos11040319
Submission received: 2 March 2020 / Revised: 20 March 2020 / Accepted: 23 March 2020 / Published: 25 March 2020
(This article belongs to the Special Issue Sources and Composition of Ambient Particulate Matter)

Abstract

:
Whether the spring season brings additional pollution to the urban environment remains questionable for a megacity. Aerosol sampling and characterization was performed in the urban background of the Moscow megacity in spring 2017, in a period of a significant impact of mass advection from surrounding fire regions. Parametrization of Angstrom absorption exponent (AAE) on low and high values provides periods dominated by fossil fuel (FF) combustion and affected by biomass burning (BB), respectively. The period identification is supported by air mass transportation from the south of Russia through the regions where a number of fires were observed. Functionalities in entire aerosol composition, assigned to classes of organic, ionic compounds, and dust, are inferred by diffusion refection infrared Fourier transmission (FTIR) spectroscopy. Functional markers of urban transport emissions relate to modern engine technology and driving cycles. Regional BB functionalities indicate the fire impacts to the spring aerosol composition. The development of the advanced source apportionment for a megacity is performed by means of combined ambient FTIR data and statistical PCA analysis. PCA of FTIR spectral data differentiate daily aerosol chemistry by low and high AAE values, related to FF- and BB-affected spectral features. PC loadings of 58%, 21%, and 11% of variability reveal the functional factors of transport, biomass burning, biogenic, dust, and secondary aerosol spring source impacts.

Graphical Abstract

1. Introduction

Air pollution due to particulate matter (PM) is one of the most important emerging environmental problems. Atmospheric processes and numerous aerosol emissions determine PM chemical properties impacting air quality [1] and human health [2]. The analysis of aerosol chemical composition provides insight into source contributions and strengthens links between particle constituents, health, and environmental impacts. However, the diversity of molecular constituents in the PM organic fraction poses challenges for characterization; detailed chemical analysis is far from being achieved at a molecular level [3].
Fourier transform infrared (FTIR) spectroscopy is a powerful tool for characterizing the aerosol properties, behavior, and origins of the complex organic fraction [4]. It is an analytical technique that captures the signature of a multitude of aerosol constituents and give rise to feature-rich spectral patterns over the mid-IR wavelengths [5]. Aerosol functionalization is highly source-dependent; it varies considerably between urban and rural regions and populated and remote areas, attributing to various classes of oxygen, hydrogen, and nitrogen-containing compounds [6,7].
Particulate emissions from fossil fuel (FF) combustion (motor vehicles, heating plants, energy production) is dominated in urban environment. Health-related properties of aerosols assigned to the biological accessibility and inflammatory potential indicates the importance of the functionalized structure of transport engine-produced particles [8]. For apportionment organic functional groups to sources, recurring FTIR spectral features were associated with available emission tracers [4]. The FF combustion factor had found as a mixture of alkane, hydroxyl, and carboxylic acid groups, with small contributions of amine and carbonyl groups. FF factors have characteristic peak locations common with fuel standards: gasoline, diesel, and oil [9]. Diesel emission analyses based on an evaluation of the relationship between engine, fuel, operating condition, and particle composition highlight the functional markers of the organic structure [10,11].
The main part of the diesel transport is heavy-duty vehicles (e.g., trucks, buses, tractors, etc.), which produce more black carbon than vehicles that run on gasoline [12]. However, the examination of carbonaceous PM emissions and secondary organic aerosol (SOA) formation from modern diesel particle filter (DPF) and catalyst-equipped diesel cars showed that they are markedly lower than from gasoline vehicles [13]. This emphasizes a need for additional quantification of functional markers of gasoline emissions as well.
Biomass burning (BB) affects the composition of particles by a large amount of incompletely oxidized products related to a significant proportion of basic sugars, fatty acids, and aldehydes [14]. Wood combustion releases oxygenated polyromantic hydrocarbons (PAH) and acids with increased temperatures, whereas wood combustion releases oxygenated phenolic compounds and sugars derivatives at lower temperatures [15,16]. Alkane, carboxylic acid, amine, and alcohol functional groups are mainly associated with FF-related sources, while non-acid carbonyl groups are likely from BB events [6].
Multivariate calibration methods were developed to quantify the ambient aerosol organic functional groups and inorganic compounds [17,18]. They are associated to sources of emissions with the highest consistent contributions [4]. Apportionment of organic functional groups has identified FTIR spectral features of emission factors of the respective sources such as FF combustion, biogenic, BB, and ocean sources. Compositional analysis, functional group correlations, and back trajectories were used to identify three types of periods with source signatures: primary biogenic-influenced, urban-influenced, and regional background [7].
However, a complete set of internal standards for calibration of organic components in the atmosphere is not available, in part because the ambient particle composition is not fully known. Quantitative source apportionment developed for FTIR data can be applied only on a given instrument where the calibration was done. This leaves a need for further developing the chemometric techniques to apply to spectroscopy data analyses. In addition, the complexity of ambient mixtures of organic compounds in the atmosphere results in mixtures that cannot be fully resolved by FTIR spectroscopy [3], which requires the application of complementary aerosol characterization. From the other side, optical aerosol characteristics such as spectral absorption can act as complementary for identifying the source impact on the aerosol composition [19,20,21,22].
A promising approach for analyzing the FTIR spectral data is a chemometric tool such as principal component analysis (PCA). It had been used for determination of the physico-chemical properties of multi-component mixtures and discrimination between different chemical compositions [14,23,24]. The advantage of combined FTIR-PCA is that it can investigate chemical variations between well-defined species that can provide a clear parametrization for the analyses of spectral differences and identification of characteristic chemical components [25]. In urban areas, the apportionment of multifunctional aerosol compounds remains largely uncertain because of the plurality of emission sources. In the Mexico City Metropolitan Area (the second largest megacity in the world), FTIR-based studies found motor vehicle emission, oil burning, BB, and crustal components to be the main sources [6].
Moscow is the largest city in Europe. Moscow often faces serious traffic congestion problems because of the increased vehicle numbers; the total count of vehicles was registered as much as 4.6 million by the end of 2017 [26]. The uniform interdepartmental information and statistical system (www.fedstat.ru) reported around 4,640,000 vehicles, including 90.4% and 8.5% of light- and heavy-duty cars and trucks, respectively, as well as 1.1% of buses. According to the Department of the Federal State Statistics Service, in the Moscow megacity, transport gaseous emissions compose up to 93% of the gross pollution from mobile sources [26].
Despite Moscow facing air quality problems [27], a lack of aerosol chemical characterization is significant. The pollution data presented for Moscow between global megacities are available only for particulate mass of size less than 10 µm (PM10) and 2.5 µm (PM2.5) masses [28]. The impact of BB is assumed negligible because the central heating system is operated. However, during an extreme smoke event in the Moscow megacity, a waste range of hydroxyl, aliphatic, aromatic, acid and non-acid carbonyl, and nitro compounds had indicated the intensive wildfires around a city as a major source of pollution [29]. The first steps to source the apportionment on the bases of organic and inorganic composition characterization was made in
This paper is devoted to aerosol characterization of the Moscow megacity urban background in spring season, when the megacity is most affected by a plurality of emission sources. FTIR spectroscopy complemented by the functional groups represent the classes of compounds in the entire aerosol composition. Analyzed spectral absorption provides the parametrization of Angstrom Absorption Exponent for identification of the periods dominated by FF and affected by agriculture and residential BB. Functional markers for diesel emissions related to modern engine technology and driving cycles as well as regional BB indicate to which extent the FF and BB emission sources impact the aerosol composition in urban environment. Because the identification of functional markers for gasoline car emissions had not been done before, we have conducted the sampling campaign and characterize the functional structure of gasoline particulate emission, based on European standard protocols. Comparison of the day-to-day functional group composition shows the changes over the range of major functional factors influenced the aerosol composition. We attempted to interpret each PC loading in terms of chemical composition, relating them to functional factors.

2. Experiments

2.1. Ambient Sampling Campaign

The intensive campaign was performed in the southwest of the Moscow city from 17 April to 25 May 2017. Aerosol sampling was conducted at the rooftop of two–story building of the Meteorological Observatory of Moscow State University (MO MSU) (55.07′ N, 37.52′ E) (Figure 1). MO MSU is located at the territory of the MSU campus, in an area of Vorob’evy Gory hills, which is well-ventilated. There are no industrial plants or commercial areas nearby. At about 800 m to the north and north-west from the MO MSU, there are the residential area and the Lomonosovsky prospect highway, respectively. The closed industrial enterprises are central heating stations at a distance of 3 km from the MSU. Therefore, the MO MSU is considered an urban background station. The recent aerosol and its radiative effects observed at MO MSU during the AEROCITY 2018 experiment was presented in [30].
Sampling of particles with dimeter less than 10 µm (PM10) was performed on 47 mm quartz fiber filters (preheated at 600 °C in advance) at 24 h intervals from 8 p.m., totaling 38 samples. Measurements of meteorological parameters (temperature, precipitation) was performed each 3 h by the MO MSU meteorological service. PM10 mass concentrations were collected by the Mosecomonitoring Agency using the tampered element oscillating microbalance TEOM 1400a (Thermo Environmental Instruments Inc. Franklin, MA, USA).
To evaluate the air mass transportation impact, the backward trajectories (BWT) were generated using the HYbrid Single-Particle Lagrangian Integrated Trajectory (HYSPLIT) model of the Air Resources Laboratory (ARL) [31] with a coordinate resolution equal to 1° × 1° of latitude and longitude. The potential origin areas were investigated using two-day back trajectories for air masses arriving each 12 h to the MO MSU at 500 m heights above sea level (A.S.L.). Fire information was obtained from Resource Management System (FIRMS), operated by the Earth Science Data Information System (ESDIS). Daily maps were related to the computed trajectories, providing a clear picture of the geographical location of fires, with a resolution of several kilometers. The number of fires that could affect air masses transported to the MO MSU was calculated as the sum of fires that occurred at a distance of 0.5° on both latitude and longitude from the BWT.

2.2. Near-Gasoline Source Sampling Campaign

A Ford Focus car with a downsized three-cylinder 1.0-L turbocharged gasoline direct injection (DISI) EcoBoost engine (12-valve, 999 cm3 displacement, Euro 6) and a Škoda Fabia car with a naturally aspirated multi-point injection (MPI) engine (1394 cm3 displacement, Euro 5) were used for emission sampling. Ordinary gasoline without oxygenated compounds with a nominal research octane number of 95, meeting CSN EN228 specifications, was obtained from a local gas station (EurOil). The Ford Focus car was tested on a chassis dynamometer using the full length of the Common Artemis Driving Cycles (CADC), including urban, rural, and motorway (130 km/h maximum speed) parts. The exhaust was routed into a full-flow dilution tunnel, from which samples were taken on quartz fiber and Teflon membrane filters during three runs of the CADC. The results of vehicle emissions tests have been described previously elsewhere [32].

2.3. Methods and Techniques

FTIR spectra of filter samples were acquired using an IRPrestige-21 spectrometer (Shimadzu, Kyoto, Japan) in a diffuse reflection mode, described in details elsewhere [10,11]. Spectra were recorded in the 450 to 4000 cm−1 range with 4 cm-1 resolution and 100 accumulated scans. IR Solution software was applied to subtract the spectrum of blank substrates as well as to perform the Kubelka-Munk (K-M) conversion into a quasi-quantitative spectrum correlating with the sample concentration. Basis line correction was done by a subtraction of basis line function spectra.
To address the possible inhomogeneity of the sample loading, spectra were collected from three–five different spots on each sample. One spectrum was taken as representative of the entire sample, because it shared the biggest number of common absorption bands with others. Spectra in the range 3600–4500 and 1790–2500 cm−1 were not considered because dominant absorption of water vapors and CO2, respectively. Because blank quartz filters exhibit strong absorption bands in the 770–860 and 972–1530 cm−1 spectral ranges, causing the majority of uncertainty, their examination was excluded from the following analyses.
The FTIR spectrum was divided into the vibration band regions, which are unique for each chemical compound [33]. Extensive knowledge is required for the identification of the functional groups. The common approach used in FTIR studies for the interpretation of the IR absorbance peaks is based on the referencing to spectroscopic guides and bands observed in previously published data [34,35]. Because of the possible overlapping of vibration bands and in order to avoid the discrepancy obtained in measurements performed by various spectral modes and apparatus, the interpretation of the IR spectra in this work was based on the database purposely built using the measurements performed on the same FTIR setup. We based our methods on the approach for identification of functional groups represented by wavenumbers of the absorption bands typical for ambient aerosols, according to previous comprehensive field observations and calibrations [5,18,34]. Additionally, the analyses of IR spectral features of near-source emissions performed in previous studies on the same apparatus [10,36] were summarized.
The database was completed through the use of a set of authentic chemical standards. Supplementary Materials Table S1 lists classes and compounds included into the database. We address 16 classes of organic compounds (alkanes, alkenes, polyaromatics, carboxylic acids, carbohydrates, amino acids, amines, aldehydes, ketones, esters, lactones, quinones, nitrocompounds, formats, alcohols, humic-like substances (HULIS), and sugars) and inorganic compounds (sulfates, nitrates, carbonates, and sulfuric acid). Absorbance peaks related to organic (hydroxyl O-H, carbonyl C=O, aliphatic C-C-H and C=C-H, polyaromatic C=C and C=C-H, C-O, N-H, C-N, -NO2, C-O-C) as well as ionic (NO3, CO32−, NH4+, SO42−) functional groups are assigned in Table S2.
Off-line examination of light attenuation of particles deposited on quartz filter samples was performed using the multiple wavelength light transmission instrument (transmissometer) based on the methodology of [19]. The intensity of light attenuation through quartz filters was measured at seven wavelengths from the near-ultraviolet to near-infrared spectral region. Five different areas of the sample filter were analyzed in order to assess the possible heterogeneity of the sample. Then, the averaged attenuation (ATN) was used for the parametrization of the dependence of the attenuation (ATN) on the wavelength λ using a power law relationship:
ATN = kλ−AAE
where the Absorption Angstrom Exponent (AAE) is a measure of a strength of the spectral variation of aerosol light absorption. It was shown that light attenuation is primarily due to particle light absorption [37]. In the optical transmission method employed here, the aerosol particles were collected using reflective quartz fiber filters, which brings uncertainty because light scattering by the filter fibers provides the embedded particles multiple opportunities to absorb light. Black carbon (BC) produced by high-temperature combustion sources fit within the Rayleigh scattering regime for near-visible wavelengths with a theoretical λ−1 relationship [38]. Weak spectral dependence of ATN with AAE around 1 was found for diesel soot and urban aerosols produced by fossil fuels combustion [19], and as much as 4.1 for peat burning [39]. Spectral absorption of BB shows the combined impact of both BC absorbing from 670 nm down to 500 nm and brown carbon (BrC), which increases the absorption below 500 nm.

2.4. Functional Markers

Fuel combustion processes yield the basis particulate functionalized structure determined by a high and low combustion temperature [4,16,40]. Characterization of near-source emissions was conducted in order to emphasize the specific atmospheric pollutant functional patterns from the major local sources and then to compare them with those identified in the urban environment [22,29]. Observations of dominant alkane functionalities of particles emitted by an Opel Astra diesel engine [41] and BMW and John Deere engines operating at the stationary and transient conditions [42] are in a good agreement with the quantification of total aliphatic compounds in diesel emission constituting 68% carbon by weight [43]. Aromatic C=C functionalities accompanies aliphatic C-C-H, with less prominent carbonyl C=O and nitro-ONO2 functionalities, in the particulate emission of the most widely used Iveco Tector heavy-duty diesel engine operated in a World Harmonized Transient Cycle (WHTC) using conventional EN 590 diesel fuel [11]. A similar functional pattern was observed in emissions of off-road diesel engines [10] operated in standard Non-Road Steady State cycle, which is identical to the ISO-8178 non-road engine emission certification procedure.
Therefore, we assumed that diesel transport emissions significantly impact the aerosol composition in Moscow environment. Then, we suggested that the diesel emission functionalized structures of the common transport system operated at the most widely distributed fuels and driving cycles described above as functional markers for transport impact onto Moscow aerosol composition. Since real-world engine operating conditions are best represented by a transient cycle (where both engine speed and fuel consumption vary) [44], we took into account the functional patters of particulates emitted during transient diesel engine operation cycles as markers for the following source apportionment.
In order to address the gasoline transport emission, the functionalized patterns of particulate matter emitted from the DISI engine, using gasoline fuel with an octane number of 95 of CSN EN228 specifications, were analyzed. For this study, spectra obtained at an urban ARTEMIS driving cycle commonly applied in a city were used as a functional marker for diesel transport emission.
Since BB occurs in various phases and for different biomasses, we identified the functional pattern that can represent the regional BB features impacted the aerosol composition in a city. With a purpose to quantify the functional markers for Moscow regional wildfire and residential emission, the small-scale experimental open fires were conducted in the Moscow region at the location where intensive forest fires were observed [29]. Both combustion phases (low-temperature smoldering and open flame (flaming)) represent the BB process [45]. Therefore, for the purpose of this study, we used both spectral data for smoldering and flaming of regional BB as functional markers. To address agriculture fires relating to grass combustion, the inside and above grass burning spectra data were additionally considered, which were collected from the measurement campaign conducted during the peat burning event near Moscow [39].
Carbonates (CO32−) were identified in the range 880–860 cm−1; their presence in the PM size fraction was confirmed by thermo-optical measurements of carbonates in form of carbonate carbon [46]. Relative concentrations of carbonates increased from low to high amounts of smoke, thus showing the impact of re-suspended soil particles during intensive agricultural fires on the composition of coarse ambient aerosols. We should also note the prominent similarity of the position of the 880 cm−1 vibration band of carbonates in ambient aerosols, similar to spectra of flaming emission. This indicates the wide distribution of dust in the urban atmosphere as well as dust of soil evolved by air convection during fires impacted the city atmosphere [22].
The soil-related particles are due to transportation, construction, agriculture, and wind erosion. Dust functionalities are specific features of coarse particles related to soil; Blanco and McIntyre (1972) reported quartz, silicates, and kaolinite to be the main constituents of coarse PM. We refer to the published data for the bands of dust-related functionalities in silicates, quartz, and kaolinite [47]. The band that appeared at 914 and 950 cm-1 is attributed to Al-OH vibrations in the octahedral sheet structure of kaolinite [48] and Si-OH stretching [49], respectively.

2.5. Principal Component Analyses

PCA is a well-known chemometric procedure that allows the rotating the space spanned by the original variables to a new space, spanned by the Principal Components (PCs), in which most of the information contained in the original data is reported in the first (generally two or three) PCs [50]. The PCs are obtained using both the covariance data matrices (scaling by mean-centered data). Visualizing the two-dimensional (2D) plot of PC1 vs. PC2 (and/or PC3) allows studying the behavior of samples (in the scores plot) and variables (in the loadings plot).
For the preparation of the data matrix for PCA analyses, after conversion to K-M mode, the smoothing of the FTIR spectra was performed by a method of smoothing spline, using the minimizing of the mischief function and penalties for irregularities. Then, spectra were subjected to secondary derivatization by an approach described elsewhere [25]; the second derivative is beneficial in highlighting the difference between spectrum and minimization of the noise. A matrix for 25 daily FTIR spectral intensities and variables of 797 wavenumbers was built. Principal component analysis (PCA) decomposes the data matrix and concentrates the source of the variability into the first few PCs.

3. Results and Discussions

3.1. FF and BB—Affected Periods

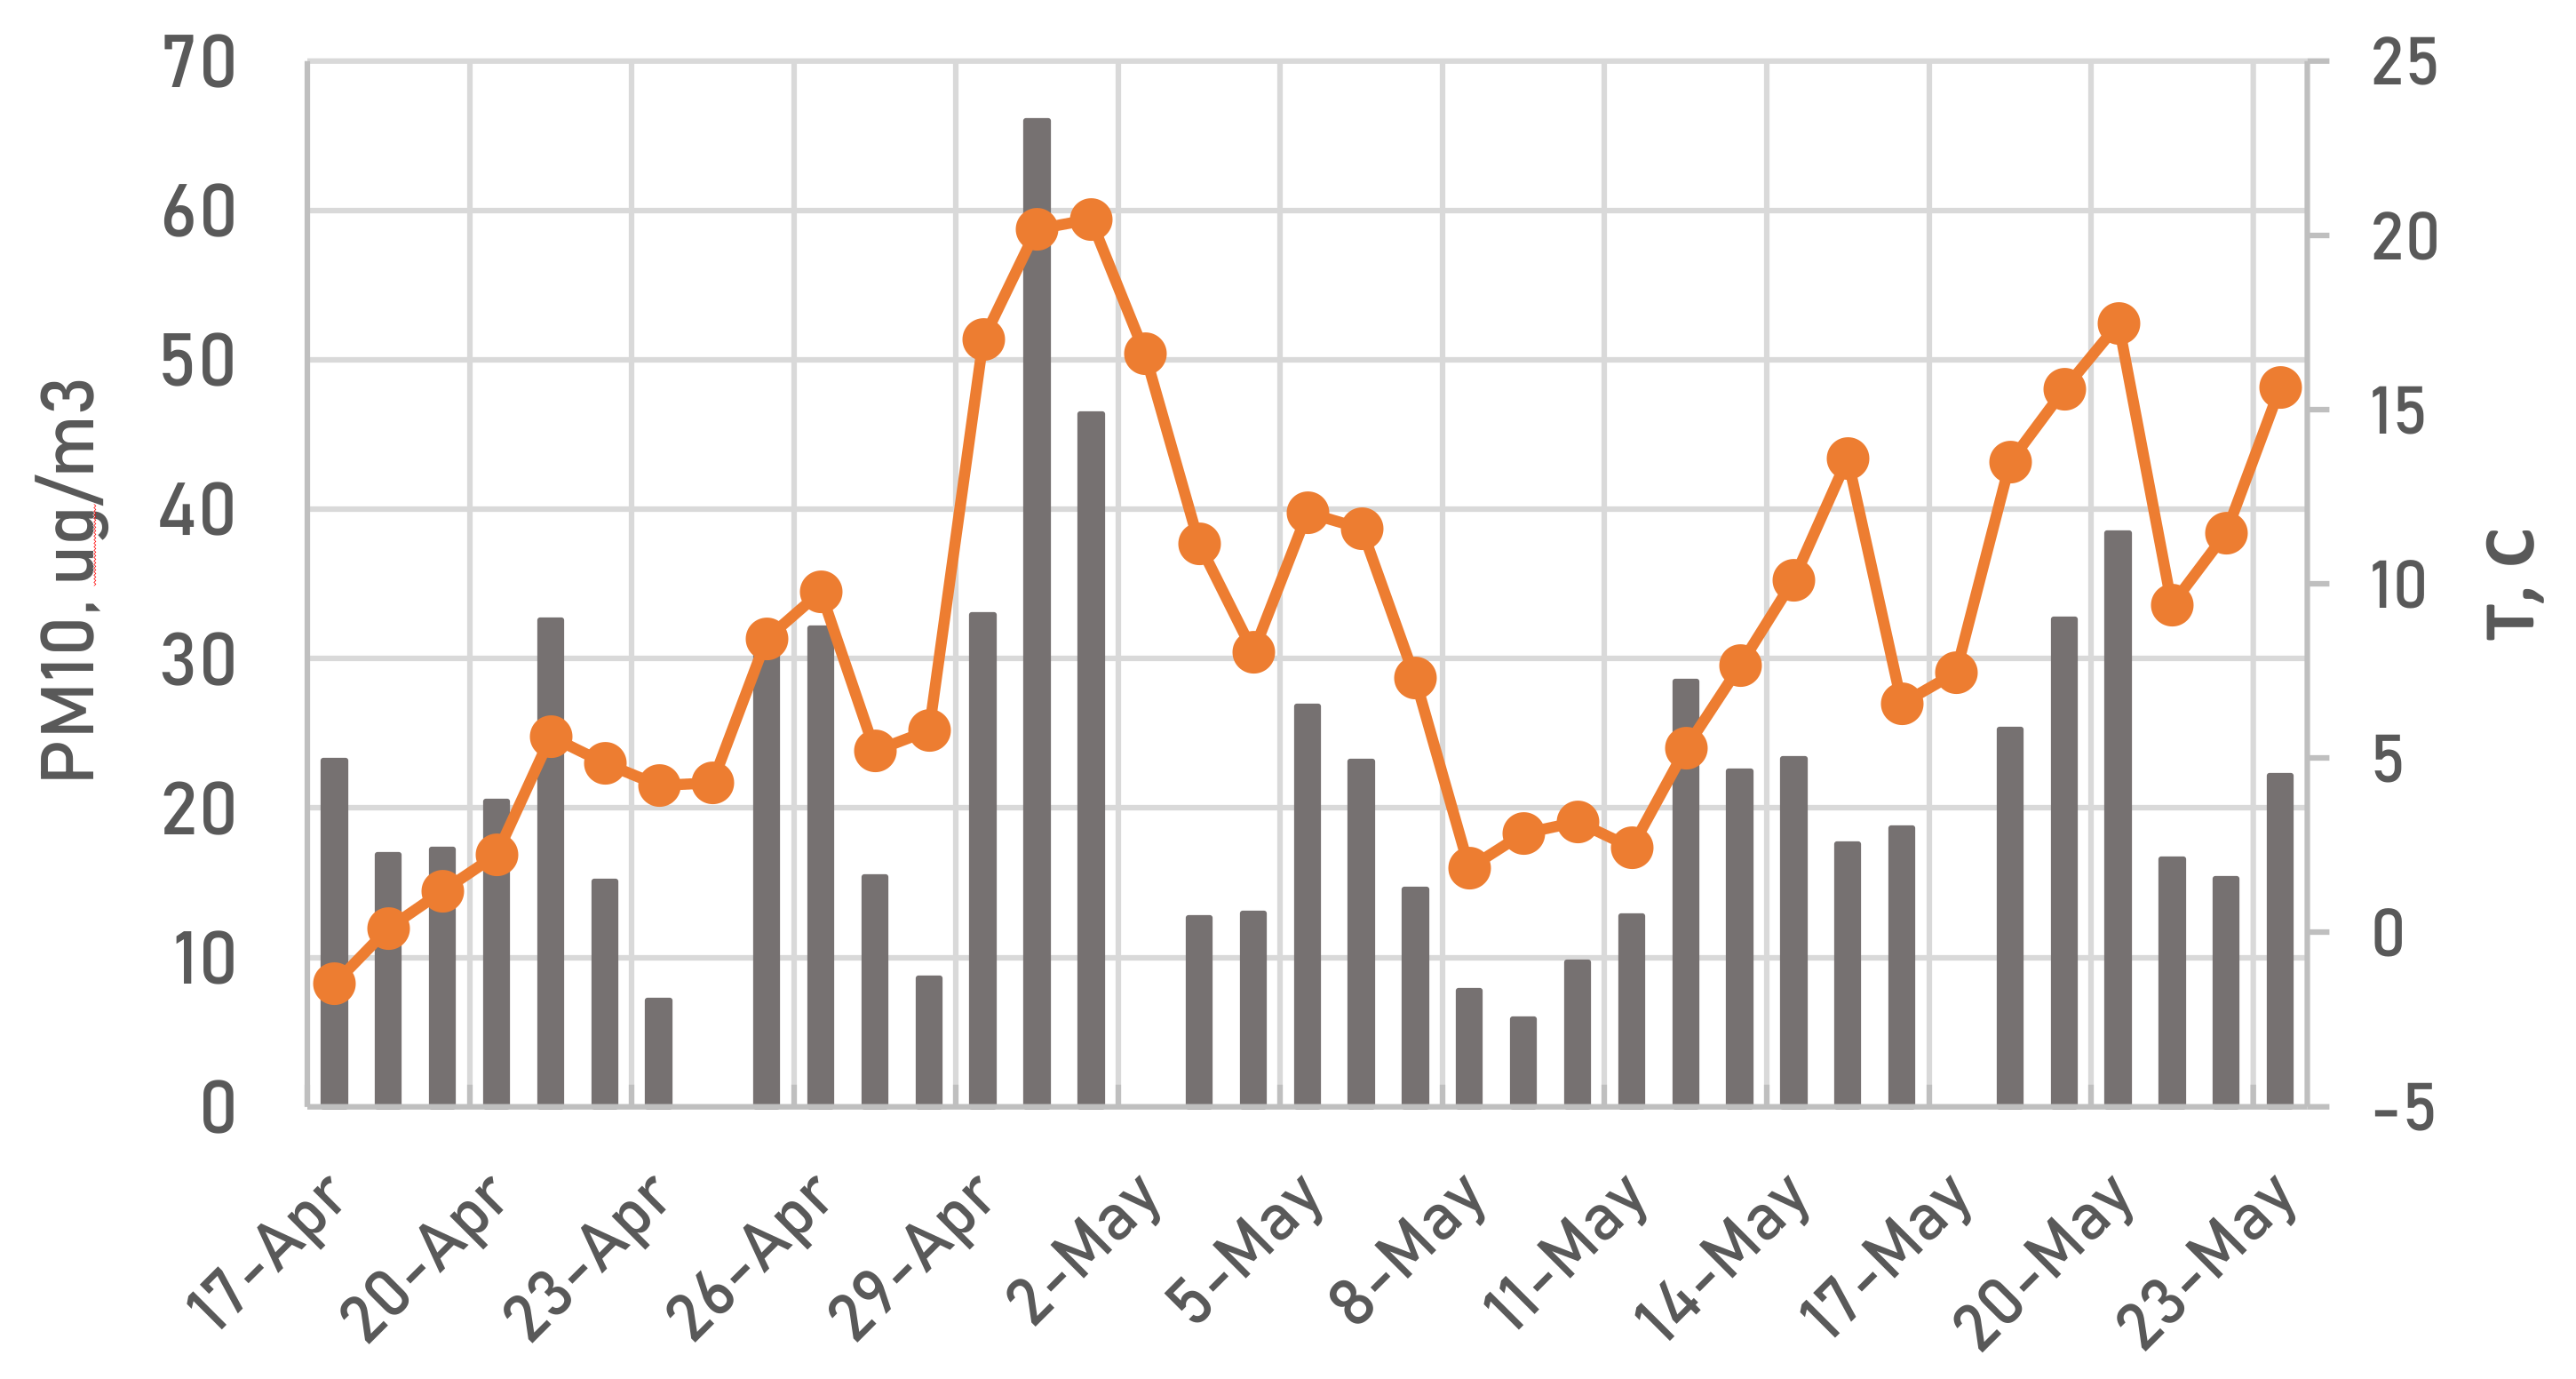
PM10 mass concentrations over the sampling period show a strong variation from the lowest of 8 µg/m3 to the highest value of 64 µg/m3, on average 22 ± 16 µg/m3 (Figure 2). The longest episode of the highest PM10 was observed at MO MSU on 29 and 30 April, on average 55 ± 19 µg/m3. On nearly the same days, from 29 April until 2 May, the ambient temperature approached an abnormally high level for this season: +21 °C. We observed relatively good correlation between high PM10 and the local temperature maximums (Figure 2), with correlation coefficient R2 equal 0.68.
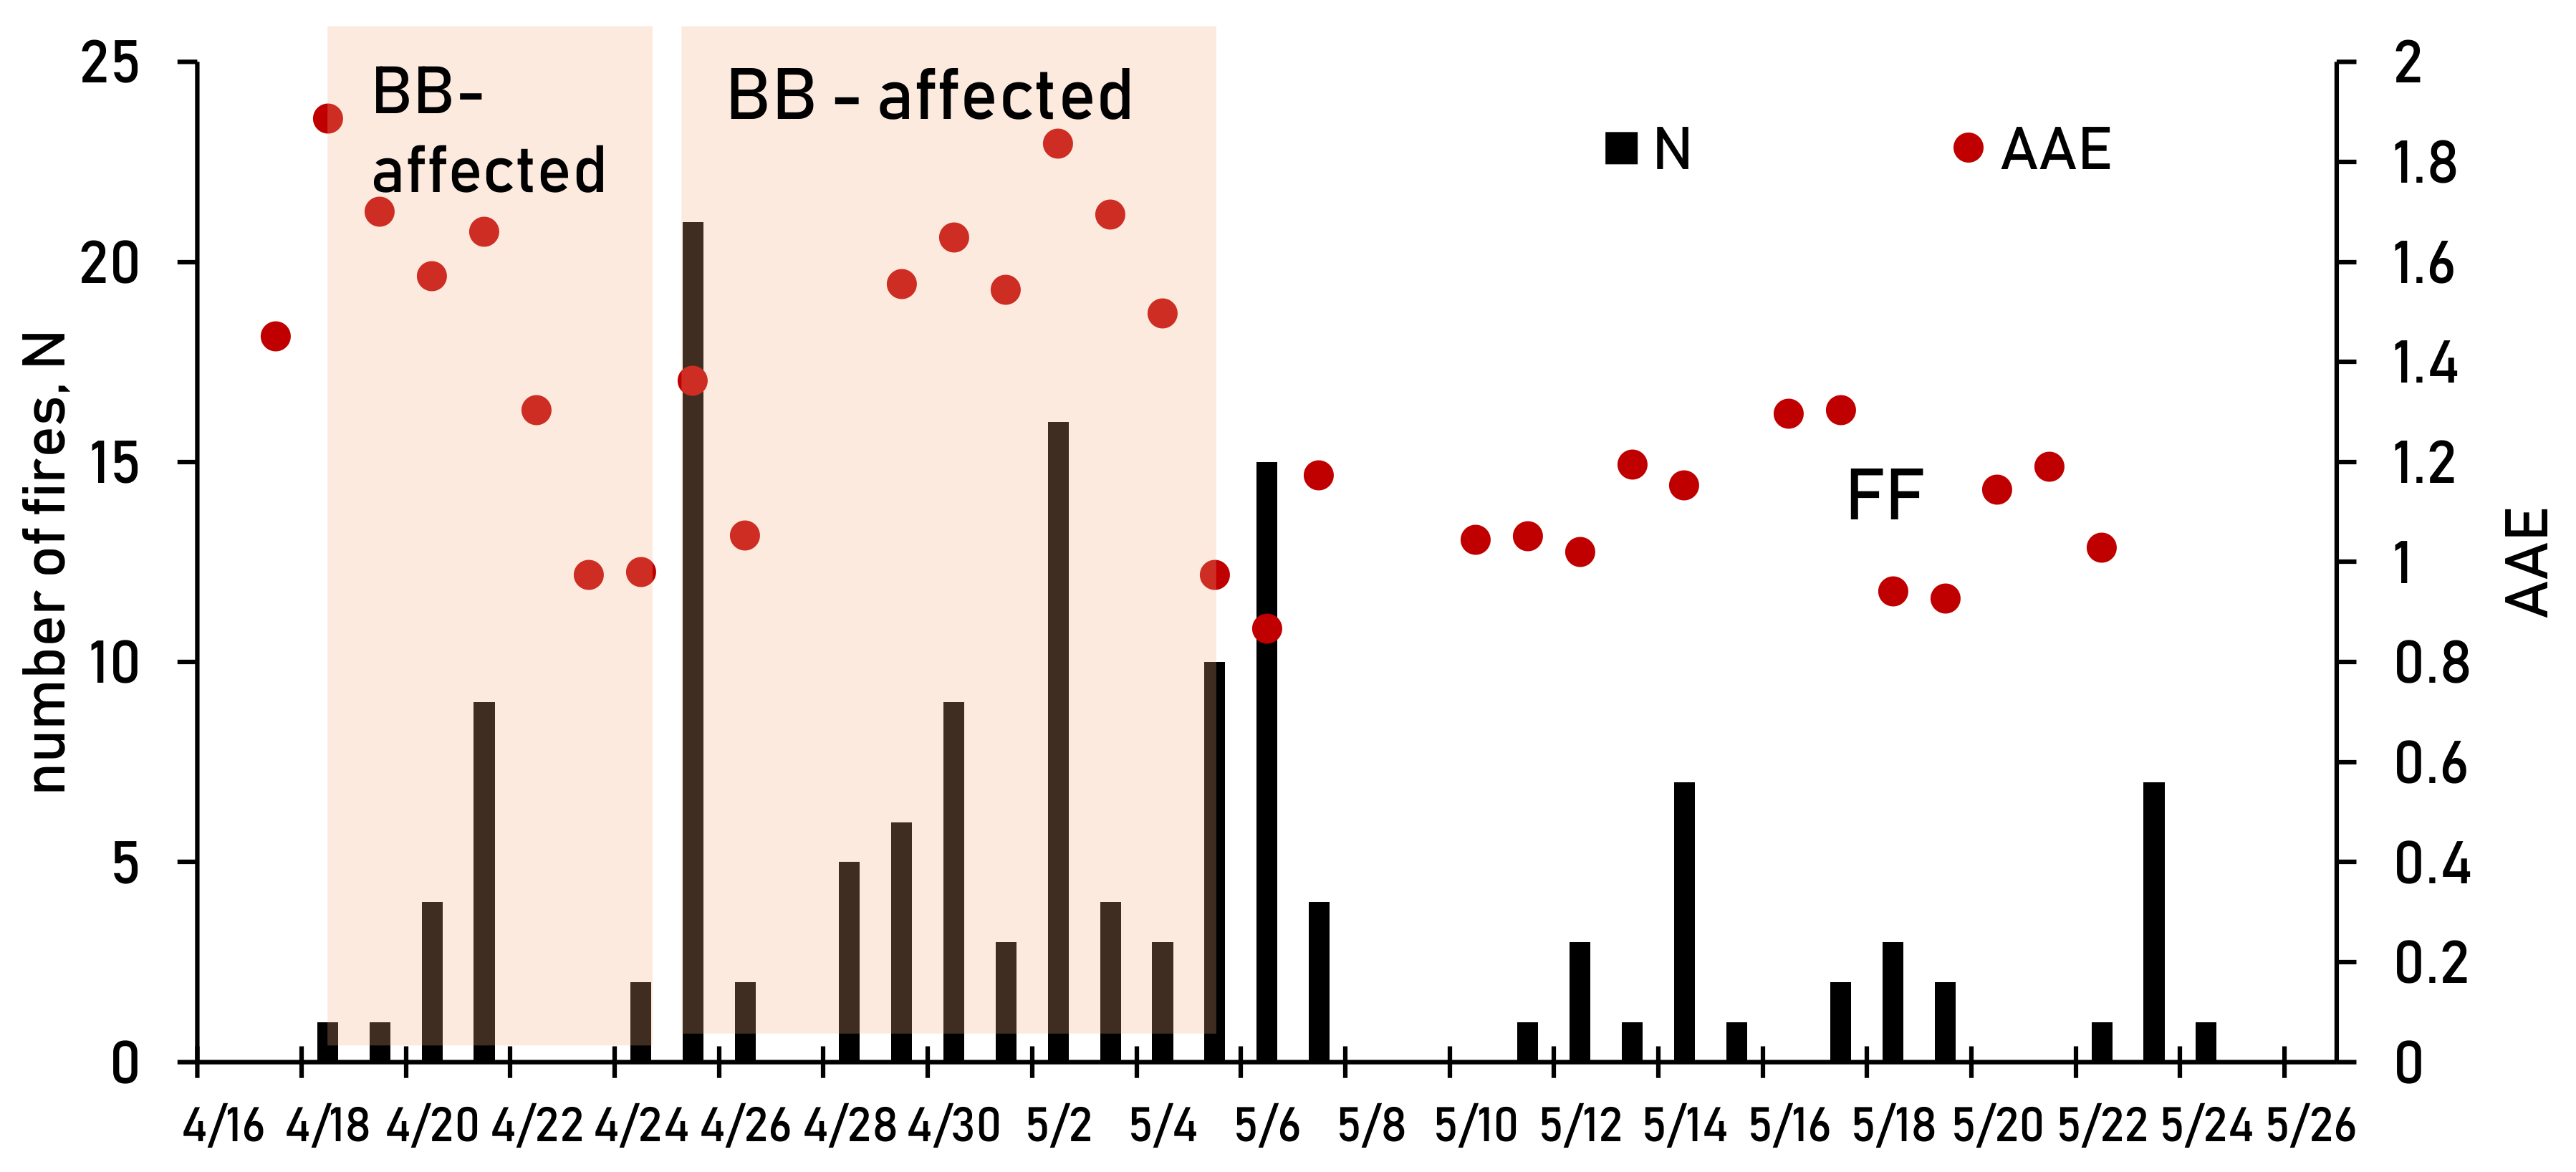
The spectral dependence of the light attenuation (ATN) for daily samples was found to be well approximated by a power law equation (1). The Absorption Angstrom Exponent (AAE) was obtained as the slope of the linear regression with R2 around 0.9. Variation of the ATN spectral dependence during the whole sampling period exhibits the range of AAE from 1.03 to 1.95 (Figure 3). The values above 1.0 may indicate that brown carbon (BrC) associated with organic carbon in addition to BC contributes significantly to the measured light absorption of biomass smoke aerosols in ultraviolet and visible spectral regions [51].The authors in [19] obtained a high value of 2.5 for smoke of savanna fires, while peat bog burning near Moscow region was characterized by AAE around 4.2 [39].
In spring time, fires are usually observed south of Moscow, an agriculture practice with the purpose to remove last year’s grass on the fields that is widespread in this season. BB in residential areas around the city can also be pronounced, especially during the May holidays from 1 to 6 May, because of the high temperatures during that time. Therefore, we could assume that the analyses of the aerosol spectral dependence of light absorption during the studied time can indicate the impact of fire-affected air mass on the aerosol chemistry in Moscow.
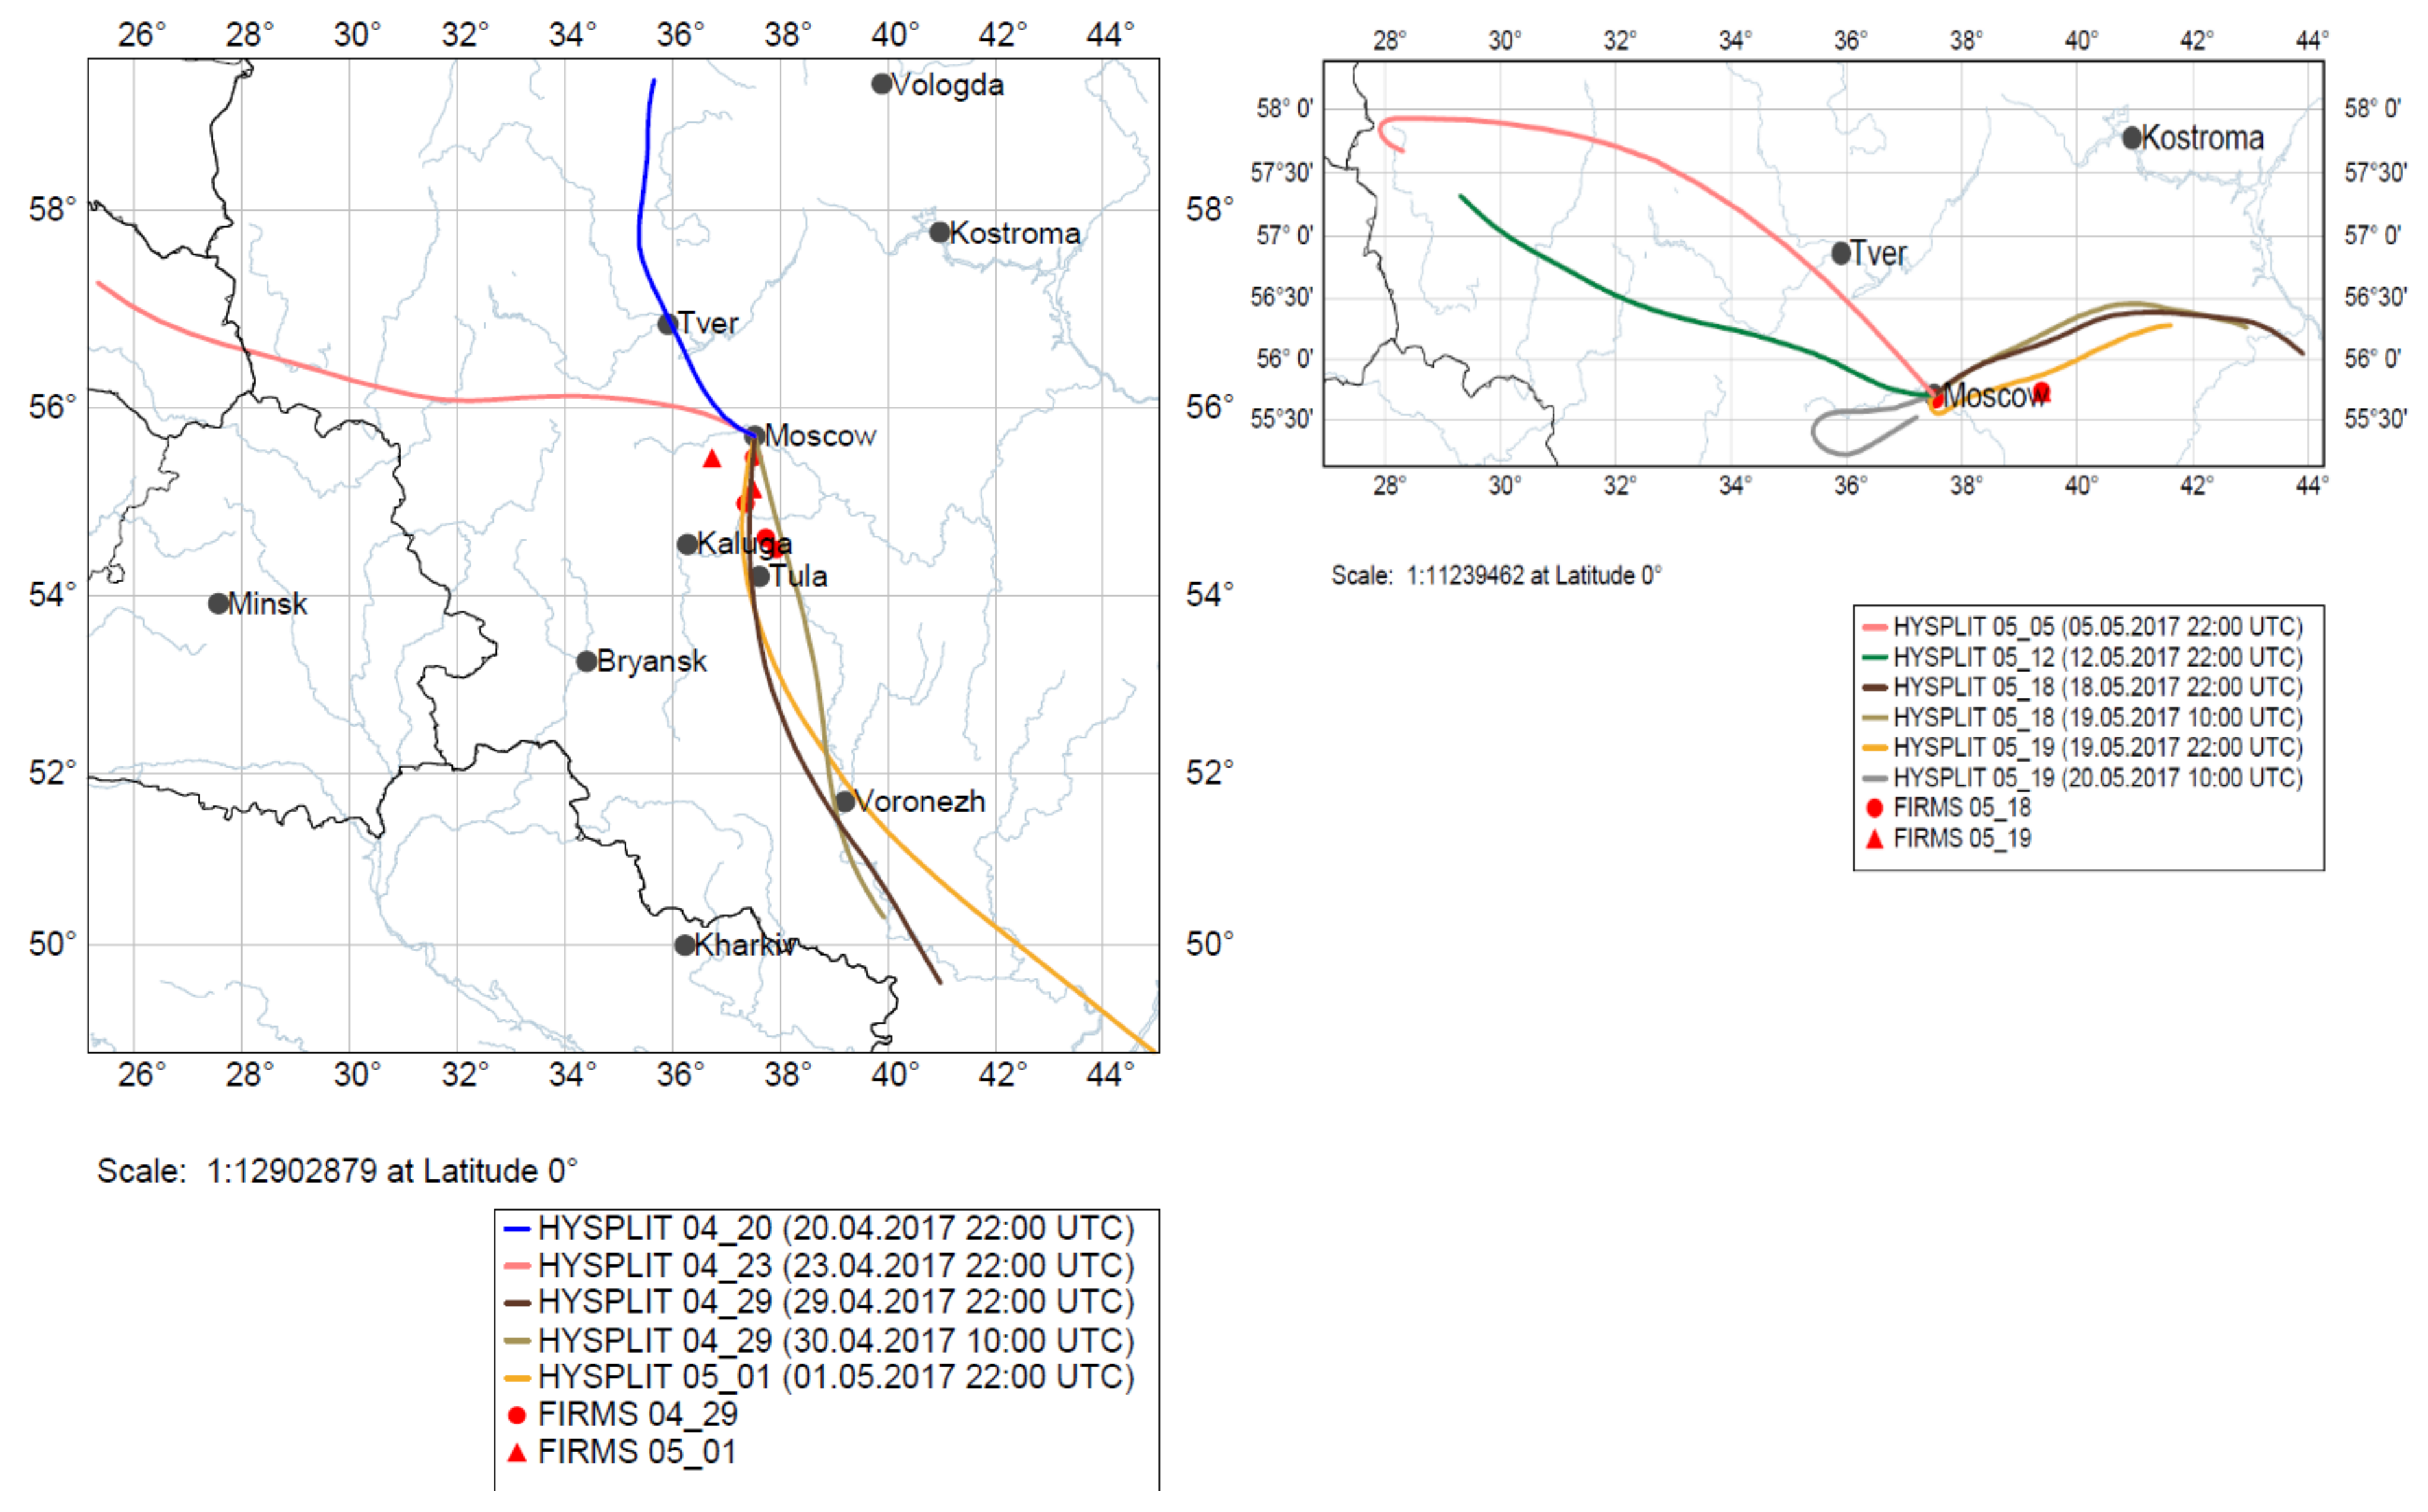
From 17 to 22 April, AAE values higher than 1.4 were observed (Figure 3). During this period, the air masses were transported from the north and passed the agriculture fires close to Moscow (Figure 4). On 23 April, the direction of air mass transportation changed to the west, while from 25 April to 2 May the direction was consistently from the south. On 23 and 24 April, the AAE dropped to 1.0. Since 25 April, the AAE became higher again, in correlation with a large number of fires observed in the south of Moscow (Figure 4). Moreover, the period from 30 April–5 May coincided with a vacation period in Russia when the warm temperatures (Figure 2) stimulated intensive residential activity around Moscow city, such as garden cleaning, grass burning, and barbecues. After 4 May, the direction of air mass transportation changed to the arctic region (Figure 4), leading to a drop of temperatures of a few degrees. On 11–13 May and 17–20 May, the air mass changed its direction from the west and east, respectively (Figure 4). On 5 May, the AAE dropped to 0.97 and no longer exceeded 1.3, even though the trajectories passed the regions of fires. This can be explained by small amounts of fires and frequent precipitation in this period.
The light spectral absorption can be applied as a source-specific optical marker for impact of BB on urban aerosols. The sampling period of our study can be divided into periods of low and high AAE. The formal criteria for parametrization were chosen to be based on the observations performed in an urban environment, where the separation between BB-affected and FF periods was proposed at an AAE level of around 1.3 [21]. Thus, we addressed the days of the weak spectral dependence with AAE = 1.08 ± 0.02 to the dominant impact of fossil fuel combustion emissions with less impact of biomass burning during the “FF” period (Figure 3). Days of the dominant impact of biomass burning emissions during “BB-affected” period show a high spectral dependence with an averaged value AAE = 1.61 ± 0.02. Similar results for traffic emissions were obtained in the Hanoi megacity with an AAE equal to 1.3 (Popovicheva et al., 2017b), indicating that traffic produces significantly less BrC and more BC than biomass burning. The number of fires passed by air masses relates to BB-influenced days (Figure 3).

3.2. FF-Related FTIR Spectral Features

In the Moscow megacity, anthropogenic PM emissions occurred due to traffic, industry, heating, waste recycling, and construction. Biomass was not used as a fuel for domestic burning because of the central heating system, which is different from many European cities. Various absorption bands relating to different classes of organic and ionic compounds were observed in FTIR spectra of spring aerosols; the most frequently indicated wavenumbers are shown in Figures S1 and S2. Saturated C-C-H, unsaturated C=C-H, and aromatic C=C and C=C-H vibrations suggest the presence of alkanes, alkens, and polyaromatic hydrocarbons (PAH), respectively. Carboxyl C=O groups represent functionalities in carboxylic acids, ketones, esters, anhydrides, and quinones. Hydroxyl -OH groups are associated with alcohols, while aromatic -NO2 and -NH groups indicate the presence of nitrogen-oxy compounds and amines, respectively. Attributes of salts are SO42− and CO32− bands in sulfates and carbonates, respectively.
FTIR spectra of days assigned to the FF period are shown in Figure S1. The most frequent feature of all spectra are the aliphatic С-С-Н symmetric/asymmetric stretches (2926–2855 cm−1) of methylene > CH2 groups in alkanes. At higher wavenumbers, at around 3223 and 3405 cm−1, the vibrations of ammonium NH4+ and N-H amine groups, respectively, were prominent. In the same range, the O-H groups in alcohols and sugars can be identified. The most frequently observed bands in the range of 1738–1715 cm−1 and 1587 cm−1 are carbonyl C=O and C=C, respectively. C=C stretching is attributed to either aromatic compounds or microcrystalline structure of soot particles due to its polyaromatic character [52,53]. In both cases, the IR-inactive C=C mode is augmented by either sufficient asymmetry of the carbon material polyaromatic structure (e.g., by defects) or related to carbonyl groups conjugated with aromatic segments [54]. At 880 cm−1 carbonate CO32− groups dominate.
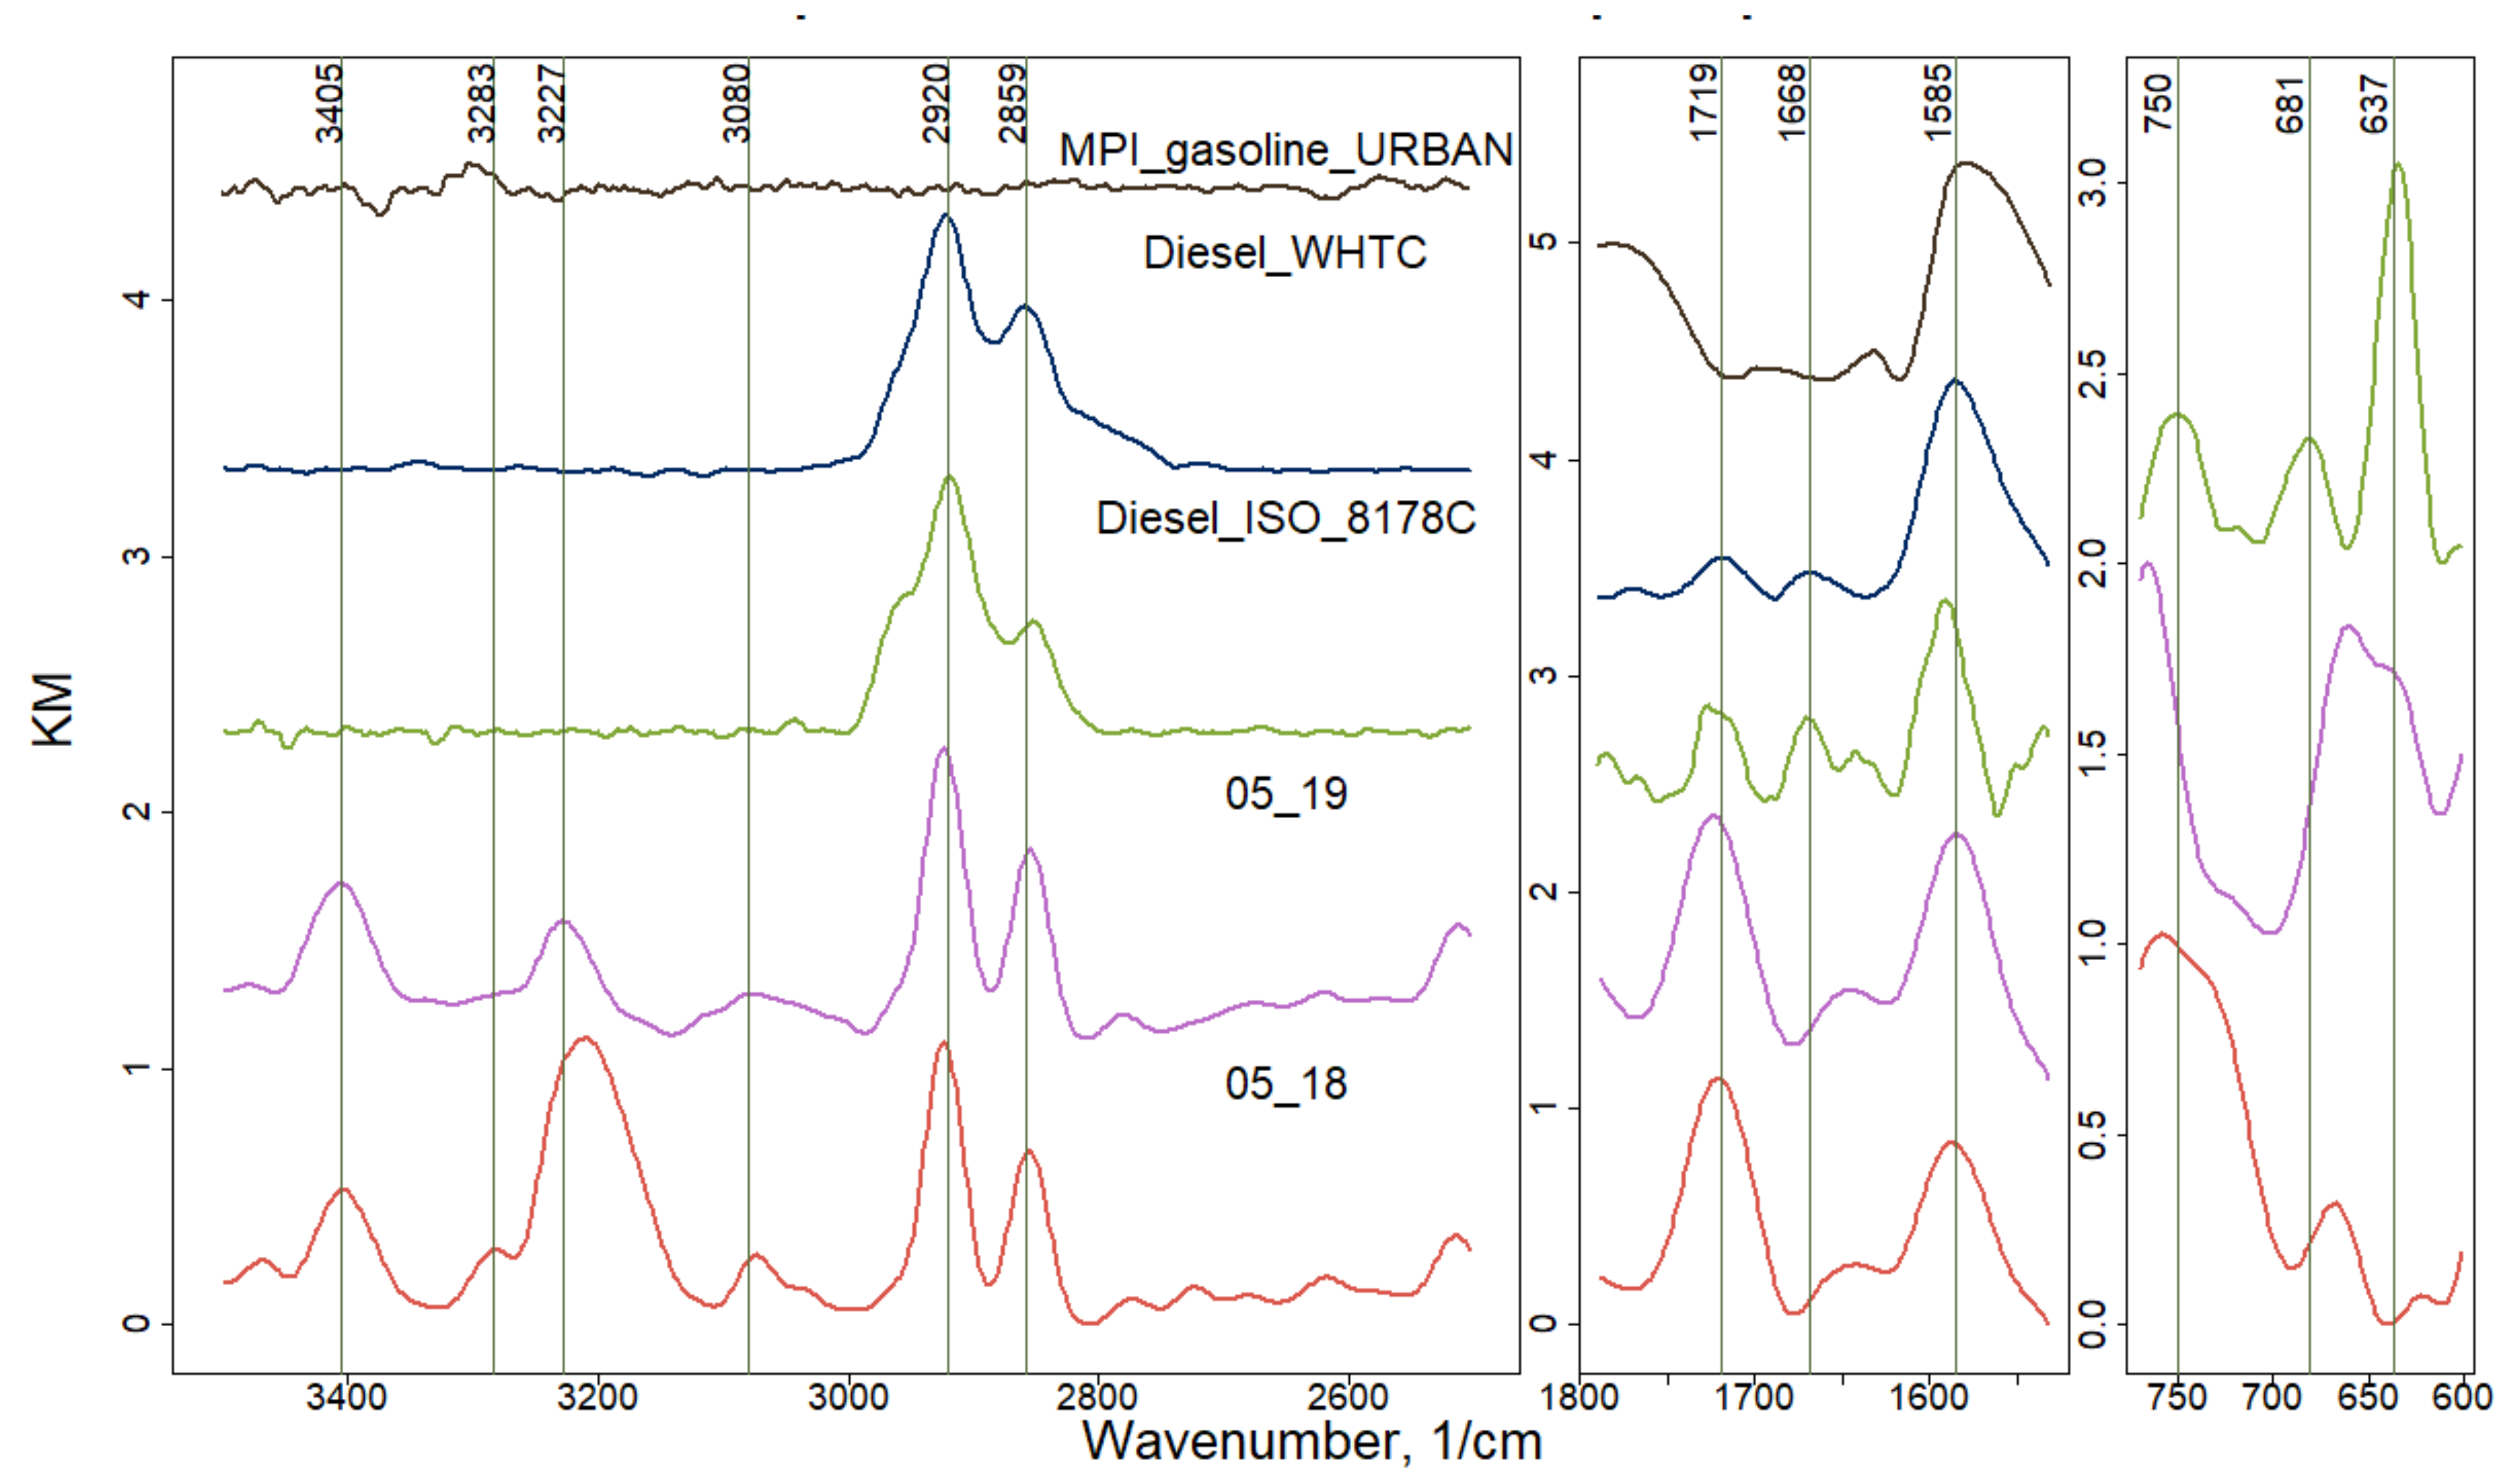
The representative spectra for two days of the FF period (05.18 and 05.19) are shown in Figure 5, together with representative spectra of transport source emissions. In order to assign the absorption bands of ambient aerosols to the transport impact, the correlation with a pattern of a functional marker for diesel and gasoline particulate emissions was analyzed. Spectra of particulate emissions from heavy-duty diesel, off-road diesel, and gasoline direct injection engine operated in World Harmonized Transient cycle (Diesel_WHTC), Non-Road Steady State cycle ISO-8178 (Diesel_ ISO-8178), and Urban portion of the Artemis cycle (term as MPI gasoline URBAN), respectively, are shown in Figure 5. Both diesel engine emissions demonstrate the high similarity for bands at 1585, 1668, 1719, and 2920–2859 cm−1 of aromatic C=C, aldehydes, acids/ketones C=O, and alkane C-C-H functional groups, respectively. Gasoline engine emission coincides by a wide band of C=C group. It is worth to note that a prominent band at 1589 cm−1 associated with carbonyls was persistently observed in high-temperature combustion emissions, which was also found in gas flaring particulates [40]. Such findings prove that soot produced at high-temperature combustion can be identified by the similar chemical structure related to the aromatic ring stretching mode enhanced in intensity by O-containing functional groups.
There is a band in the representative spectra for two days of the FF period which always coincides for all spectra in Figure 5, it is one peaked at 1589 cm−1 and other at 1719 cm−1 for C=C and C=O, respectively. Bands of alkanes peaked at 2926–2855 cm−1; moreover, alkenes observed at 1645 cm−1 are identical between spectra of the FF period and diesel emissions functional markers, but different from the gasoline ones. Polyaromatic C=C=H at 750 cm−1 are similar for spectra of the FF period and Diesel_ ISO-8178. Thus, we considered that C-C-H, C=C, and C=O groups in alkane, aromatic, and oxidized compounds act as a functional marker of transport vehicle emissions in the Moscow environment (Table 1).
Additionally, to organic functionalities, in the FF period sulfates, SO42− in various salts and sulfuric acids are well observed in the wide range of 661 to 617 cm−1. Sulfates were consistently observed in transport vehicle emissions [10,41,42] due to fuel and lubrication oil contaminations. They show the prominent absorption band on the spectra of off-road diesel engine operated in Non-Road Steady State cycle ISO-8178 (Figure 5).
Secondary particles that are mainly ammonium sulfate and nitrate formed in the air from regional or local gaseous emissions of sulfur dioxide and oxides of nitrogen reacting with ammonia [55]. SO42− is well correlated with the NH4+ absorption band at 3227 and 638 cm−1, due to the formation of internally mixed particles during long-term transport from urban sources [7] and BB season [46].
The bands observed in the FF period at 3405 cm−1 can be associated to N-H in amines and amino acids, and to O-H in alcohols. Functionalities of amino acids are found to be well correlated with hydroxyls and carbohydrates; they are classified as biogenic functional groups because they originate from biogenic sources [7]. Additionally, the band at 3474 cm−1, assigned to O-H in sugars, alcohols, and carbohydrates, may prove the biogenic impact to aerosol composition. Such compounds are not emitted by diesel/gasoline transport; together with sulfates and ammonium, they demonstrate the mixing of secondary and biogenic aerosols in ambient urban environment. Related to sugars, alcohols, and carbohydrates, the band at 3474 cm−1 is also prominent during the FF period, indicated by the biogenic emission already observed during spring time in other studies [56].

3.3. BB-Related FTIR Spectral Features

FTIR spectra of days assigned to the BB-affected period are shown in Figure S2. The most frequent feature of all spectra are the aliphatic С-С-Н symmetric/asymmetric stretches (2926–2851 cm−1) of methylene >CH2 groups in alkanes. Besides this group, other functionalities are much more variable and difficult to be described for comparison only by observation.
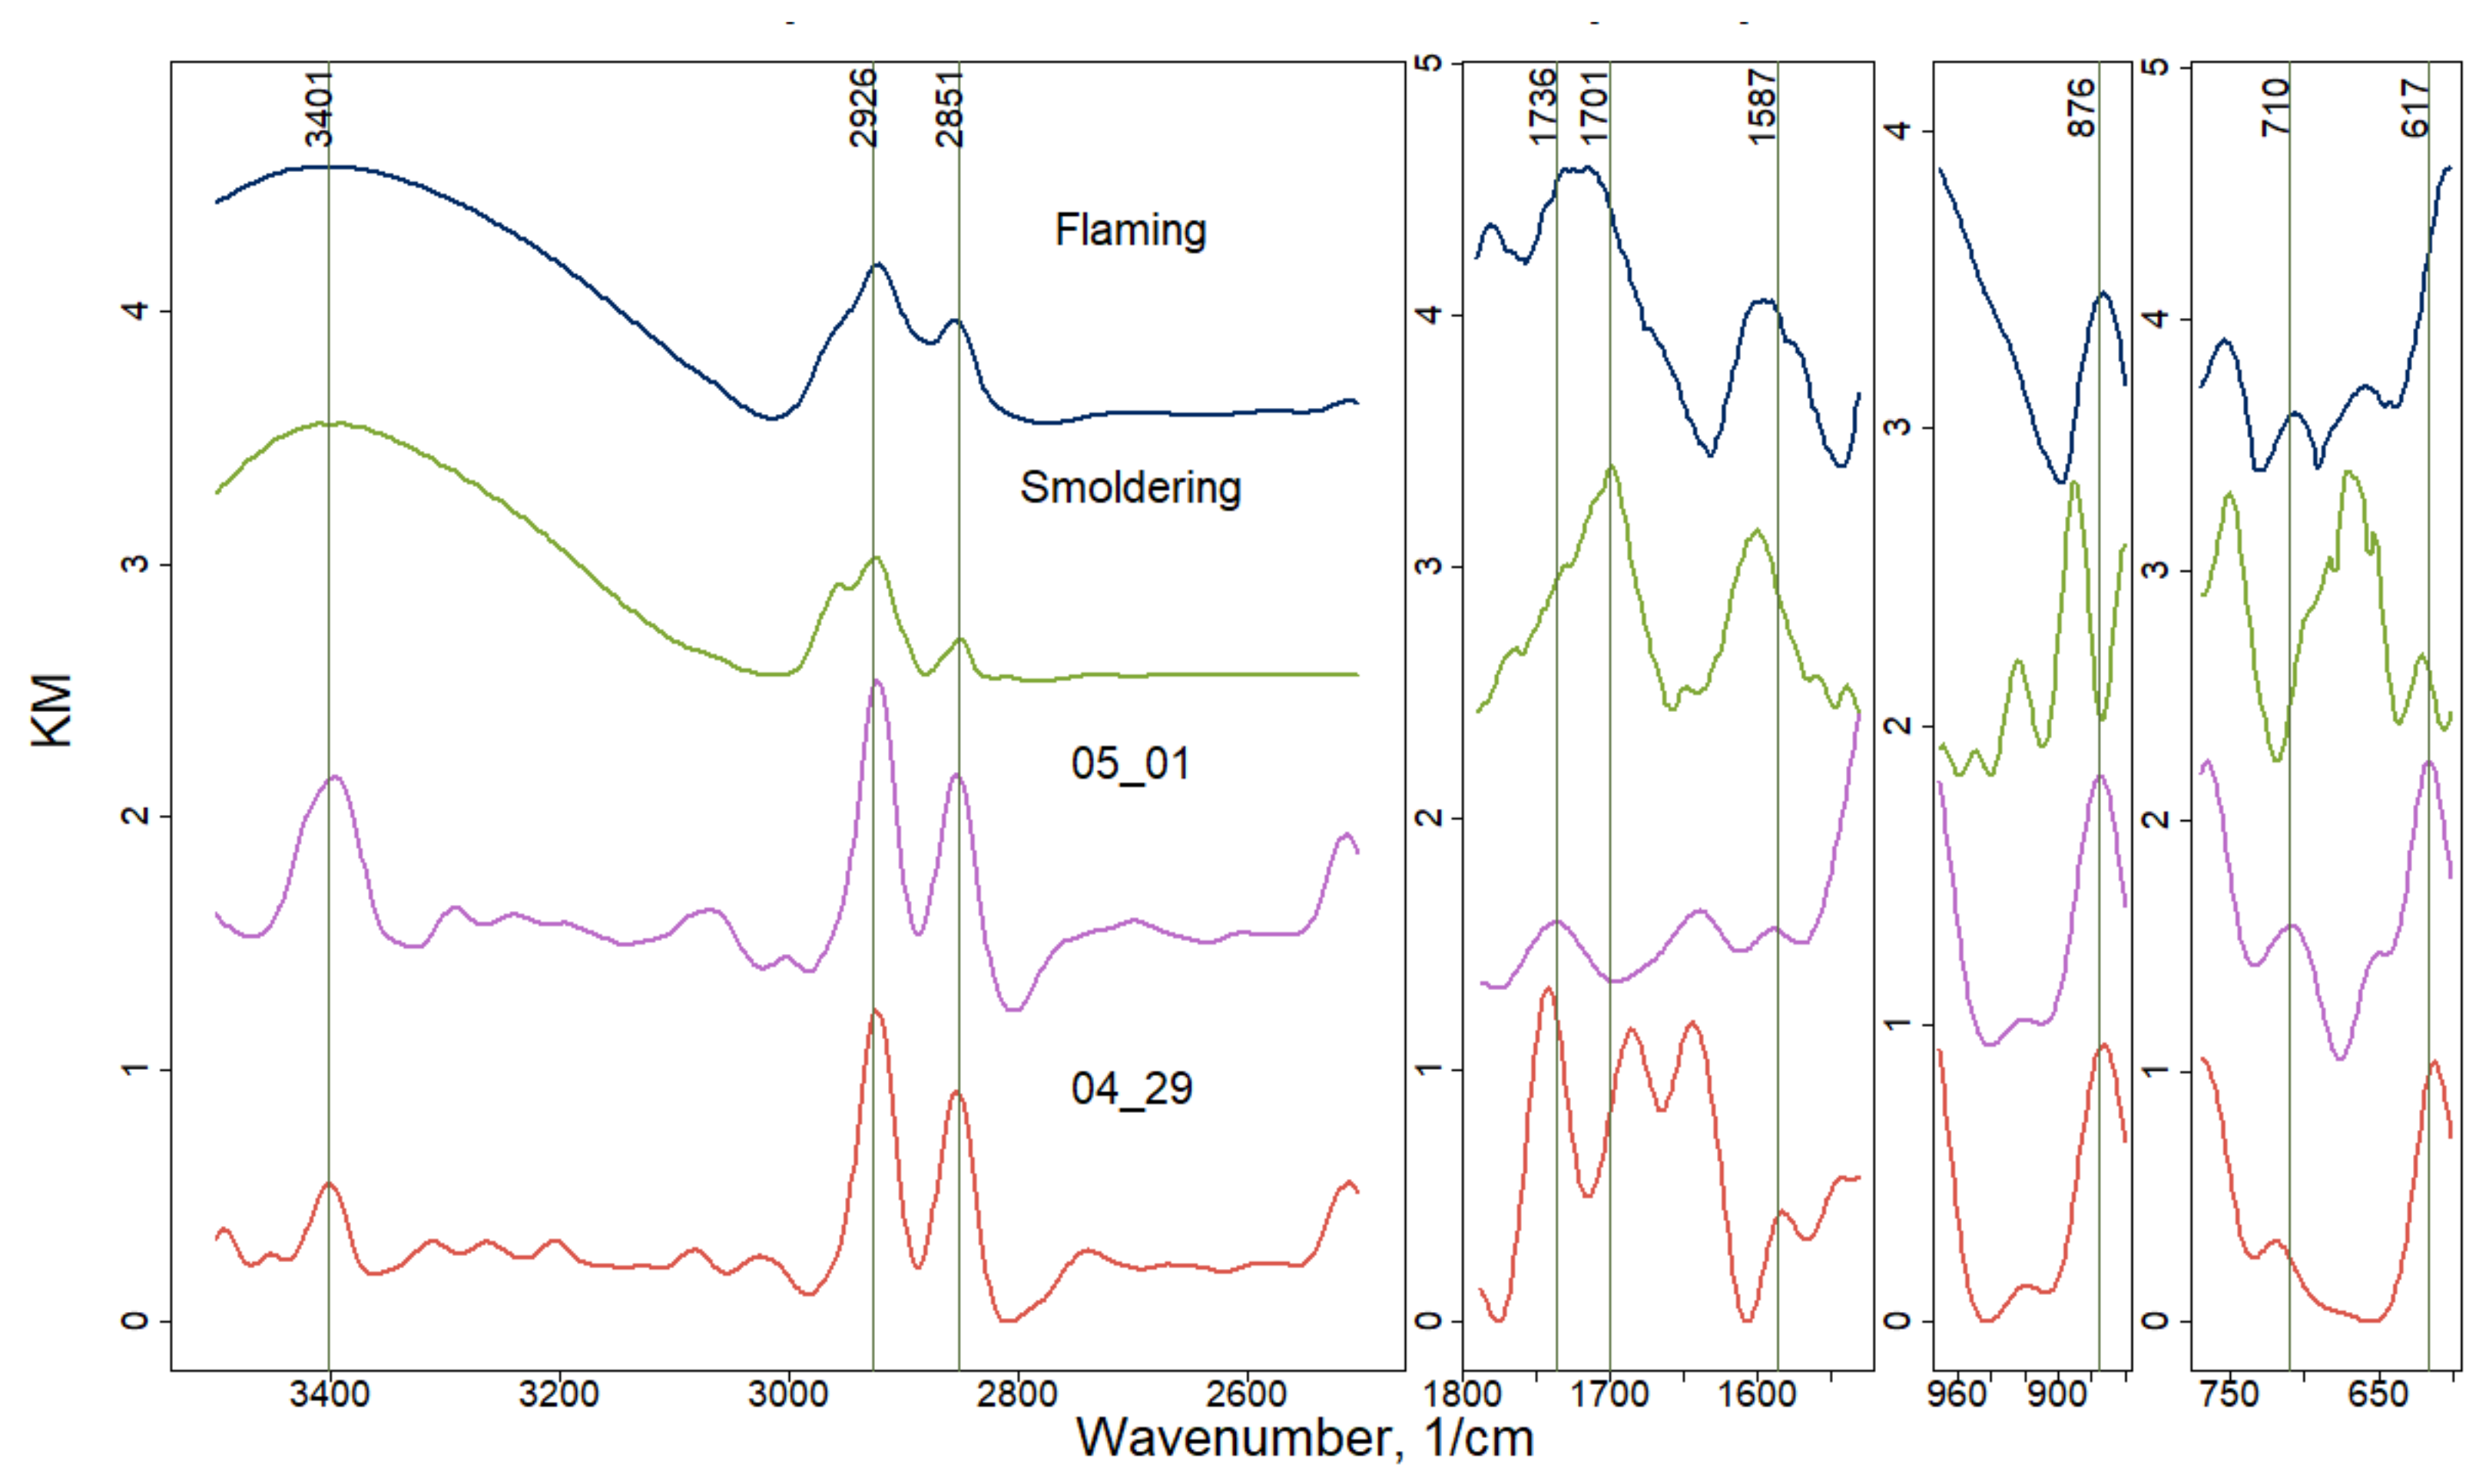
In Figure 6, the representative spectra for two days of the BB-affected period (05.01 and 04.29) are shown, together with spectra for smoldering and flaming of Moscow regional biomass. BB spectra of both biomasses exhibit a very wide unresolved band near 3401 cm−1 from various O-H and N-H in carbohydrates (including levoglucosan), alcohols, and amines. Aliphatic C-C-H and C=C stretching of aromatic rings are observed at 2926–2851 and 1614 cm−1, respectively. A wide band of oxidized functionalities in the range from 1730 to 1700 cm−1 relates to carbonyl C=O groups. Polyaromatic C=C=H at 754 and 710 cm−1, as well as features of sulfates at 617 cm−1, are prominent for flaming, while strong absorption was observed at 667 cm−1 due to sulfate emissions in K2SO4, MgSO4, and Na2SO4 in the smoldering phase. The presence of SO42− absorption bands at 617 сm−1 and their slightly prominent feature in smoldering smoke indicate the formation of secondary sulfates in the Moscow environment, a phenomenon usually relating to the aging of biomass burning aerosols [57].
It should be noted that during an extreme smoke event, observed in the Moscow megacity in August 2010, smoldering and flaming of regional wildfires near a city were a source for very intensive persistent carbonyls found near 1736 cm−1 [29]. The photochemical aging of BB smoke could result in the formation of secondary organic aerosols (SOA), which are represented through high dicarboxylic acid concentrations [58]. Additionally, in flaming spectra, a band of organic −NO2 groups are located at 1530 cm−1, similar to the very prominent vibrations there were observed in the peat bog smoke inside and above the grass during long-lasting peat burning near the Moscow region [39].
Analyses of the correlation between absorption bands of aerosols during the days of the BB-affected period and regional BB spectra indicate many similarities. In the range of the highest wavenumbers, ambient aerosols have a prominent peak at the same wavenumber of 3401 cm−1, defining the similar absorption compounds with regional BB; however, it is much narrower and likely dominated by N-H amines. A wide band of oxidized functionalities is localized near 1736 cm−1, while -NO2 is always prominent at 1530 cm−1. Polyaromatic C=C=H at 765 and 710 cm−1 are similar to the regional BB spectra; sulfates always dominate at 617 cm−1, which are related to the vibrations in Ca2SO4. The representative spectra in Figure 6 show the days of the highest fire impact when BWT indicates the areas of fires (Figure 3). Therefore, we justify that a BB functional marker pattern of OH, N-H, C-C-H, C=O, C=C, C=C-H, -NO2, and SO42− groups in carbohydrates, alcohols, amines, alkanes, oxidized compounds, aromatic, nitrocompounds, and sulfates can act as a functional marker of regional BB emissions in the Moscow environment (Table 1). The presence of small absorption at 3474 cm−1 reflects the co-existence of BB and bioaerosols, which was already observed during spring time [56].
Dust functionalities related to soil appeared at 923 cm−1, attributed to Al-(OH) vibrations in kaolinite, and related to Si-OH stretching around 950 cm−1. Carbonates (CO32−) were identified in the range 880–860 cm−1; their presence in the PM size fraction was confirmed by thermo-optical measurements of carbonates in the form of carbonate carbon [46]. Relative concentrations of carbonates are increasing from low to high smoke, thus showing the impact of re-suspended soil particles during intensive agricultural fires on the composition of coarse ambient aerosols. The IR spectra of the coarse samples exhibited a peak around 870 cm−1, which was due to asymmetric vibrations of calcium carbonate (CaCO3) [59]. During the BB-affected period, we should note the prominent similarity of the position of 880 cm−1 vibration band of carbonates CO32− in ambient aerosols, similar to spectra of flaming emission. This indicates the wide distribution of dust in the urban atmosphere as well as that evolved by air convection during biomass burning, which impacted the city atmosphere [22].

3.4. Combined FTIR-PCA Analyses

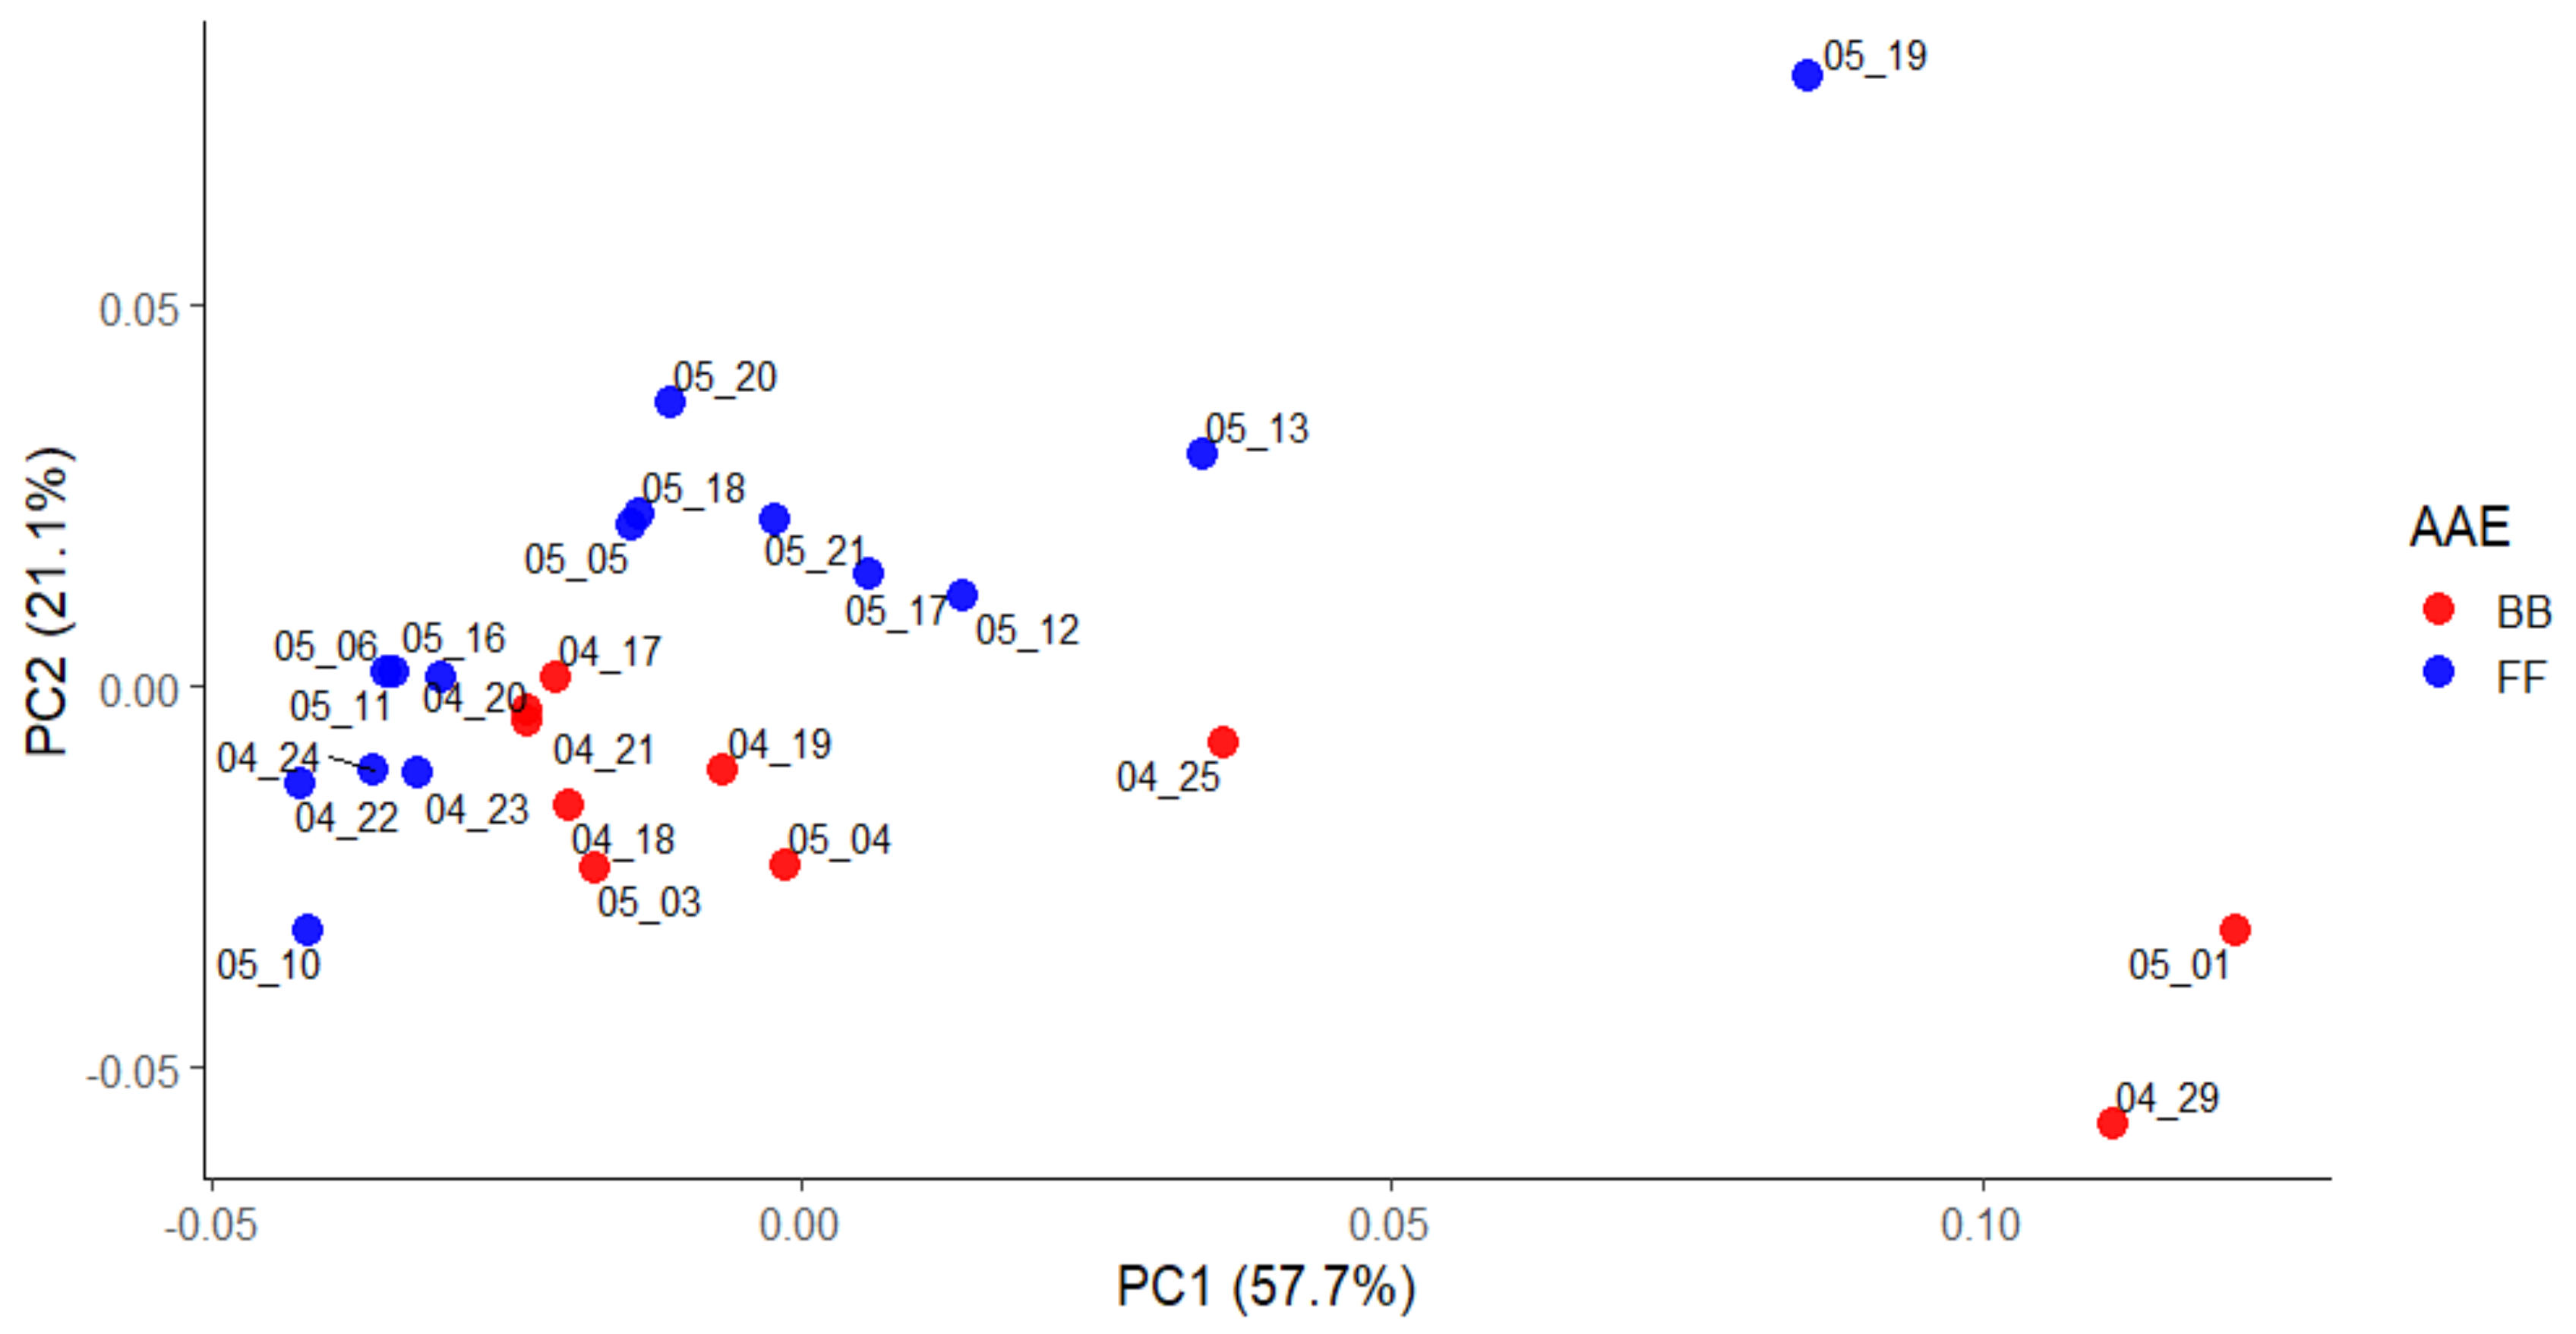
In order to investigate the variations in functionalized structures and detect similarities between daily aerosol chemistry, a combined FTIR spectroscopy and PCA were used. The score PC1 × PC2 plots calculated using the FTIR spectra data matrix for the whole sampling period is shown in Figure 7. The highest principal component (PC) axes 1, 2, and 3 account for 57.7, 21.1, and 11.1% of the total variance in the data set, respectively. There are three days, namely 04.29, 05.01, and 05.19, for which FTIR spectra show very high PC1 variability with respect to the other ones, described by the highest PC1 values. Additionally, these days were when the highest temperature and PM10 mass concentrations were observed (Figure 2).
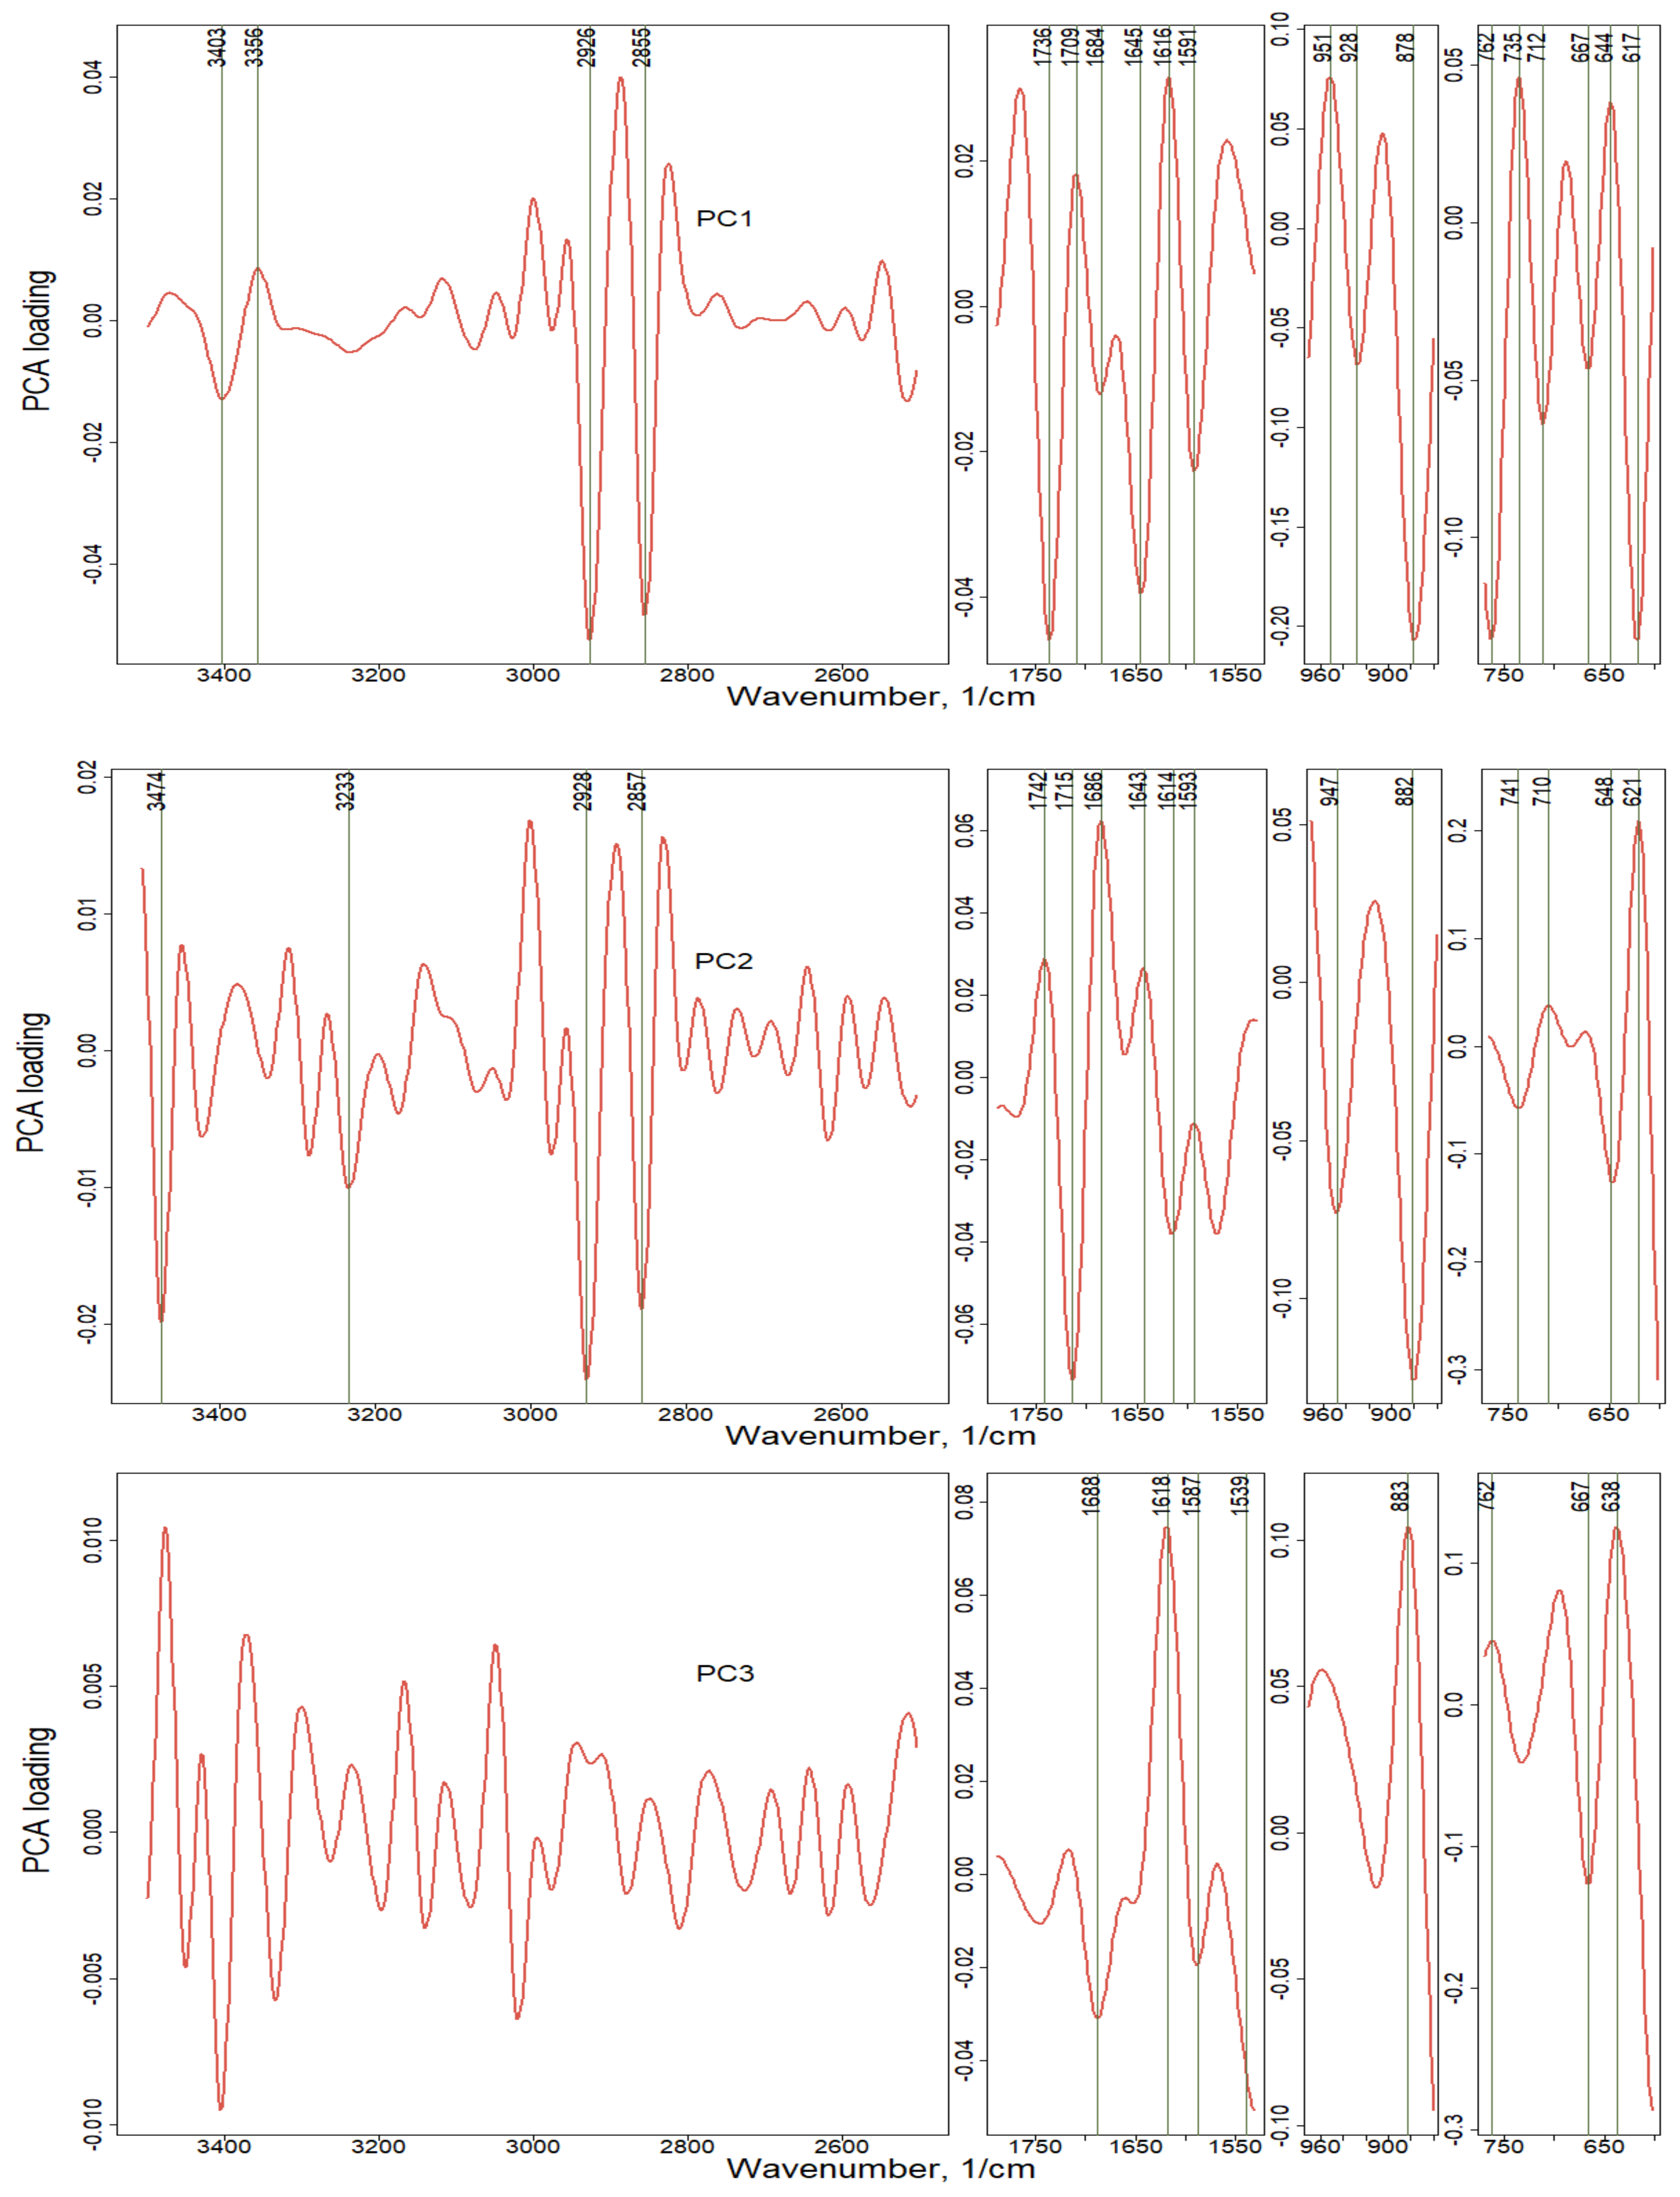
The scatter plot of PC1 against PC2 shows the similarities as well as the differentiation between aerosol composition of days separated on two episodes according to the AAE parametrization. A big group of days assigned to the high AAE is clustered at negative PC2, their chemical composition is characterized by a similar pattern of the functional groups. It indicates that there is a BB-related factor that strongly influences aerosol chemistry, separating those days into the negative direction of PC2. On the other hand, the PC2 × PC3 plot does not demonstrate such separation well. The loadings plot in Figure 8 show the spectral variability explained by the first PCs. Marked extremums are the absorption bands identified on FTIR spectra of daily samples.
Table 2 summarizes the results of PCA analysis providing the most important variables as functional factors. It shows the principal components explaining PC1 (Factor 1, 58%), PC2 (Factor 2, 21%), and PC3 (Factor 3, 11%), totaling 89.9% of the data set variance. Factor 1 had the highest absolute value 0.21 for dust carbonates CO32− (878 cm−1), showing the impact of re-suspended soil particles, dust generated by the wind erosion, and transportation during spring season. Polyaromatics (762 cm−1) from combustion emissions and sulfates (617 cm−1) of BB features were also described by a high PC1, equal to 0.133. On the other hand, alkanes (2926–2855 сm−1), alkenes (1645 cm−1), C=C (1591 cm−1) related to diesel/gasoline transport, and esters/carboxylic acids (1736 cm−1) showed a PC1 value in the range of 0.046–0.023. In Factor 2, sulfates (621 cm−1) from secondary aerosols demonstrated a high variability, with a PC2 value of 0.21. Furthermore, dust-related features (947 and 882 cm−1) with carboxylic acids/ketones (1715 cm−1) from transport and aldehydes (1686 cm−1) in BB emissions were best explained by PC2 in the high absolute value range of 0.13–0.06. Strong features of sugars/alcohols/carbohydrates (3474 cm−1) were observed in biogenic aerosols, characterized by an absolute value of PC2 equal to 0.02. Factor 3 reveals the biggest impact of various sulfates (667, 638cm−1) of long transportation, as well of dust carbonates (883 cm−1) at the highest PC3 near 0.13, supported by C=C (1618 cm−1) agriculture/residential fires with a PC3 of 0.075.

4. Conclusions

Spring aerosols in the Moscow urban background were analyzed for particle-associated organics, ions, and dust functionalities. Classes of organic/inorganic compounds in the aerosol composition were inferred from analyses of FTIR spectral absorbance. Sixteen organic compound classes and two ionic inorganic and dust-related species were identified in spring aerosols. The composition of daily ambient aerosols demonstrated aliphatic, aromatic, carbonyl, and sulfate compound absorbance as features of traffic emissions. The functionalities of diesel/gasoline emission were found in ambient aerosols by their functional markers, showing the dominant impact of transport emissions from the diesel/gasoline vehicles operated in the Moscow megacity at the most common engine cycle conditions. Specific bands of amines, sugars, alcohols, and carbohydrates indicated the biogenic activity, while prominent ammonium and sulfates absorbance was assigned to secondary inorganic formation typical for urban environment. Because the sampling site at the Meteorological Observatory took place in a residential area, far from highways and industrial and agricultural activities, the main source of ammonium sulfates in PM were likely from secondary aerosols. Dust-related functionalities were proved by carbonates and kaolinites.
Complex chemistry and devised organic composition requires a source-specific optical marker for the assessment of a potential impact of biomass burning on urban aerosols. Parametrization of the sampling duration on FF and BB-affected periods by low (below 1.3) and high (above 1.3) AAE supports the relative contribution of agriculture fires/residential BB to urban Moscow aerosol composition, which is dominated by FF combustion. The BB functional marker reveals the pattern of carbohydrates, alcohols, amines, alkanes, oxidized compounds, aromatic, nitrocompounds, and sulfates observed in regional BB emissions. Air mass arriving in the Moscow area due to long-term transportation from the south of Russia impacts the air quality of the city, especially when the direction of transportation correlates well with fire-affected regions.
For the first time for the Moscow megacity environment, a factorial analysis such as principal component analysis (PCA) was used complementary to FTIR. FTIR-PCA allowed the distinguishing between daily aerosol composition according to high AAE, which identified BB spectral features during BB-affected periods. Chemometric techniques discriminated day-to-day changes in a range of major factors influenced by the aerosol composition. PCA analysis for FTIR data provided the most significant variables in main PC loadings showing the functional factors of transport, biomass burning, biogenic, dust, and secondary aerosol spring source impacts. Factor 1, explaining 57.7% of the variability, demonstrated the highest impact of carbonates, polyaromatics from combustion emissions, and BB-related sulfates following by alkanes, alkenes, esters/carboxylic acids, and C=C functional marker related to diesel/gasoline transport. Factor 2 explained 21.1% of the variability; sulfates from secondary aerosols dominated, while dust, carboxylic acids/ketones from transport, aldehydes in BB emission, and sugars/alcohols/carbohydrates of biogenic sources explained the aerosol composition to a large extend. Factor 3 explained 11.1% of the variability, revealing the biggest impact of sulfates and dust carbonates, supported by the C=C marker of agriculture/residential fires. Based on the combined FTIR-PCA analyses, it was suggested that traffic and biogenic emissions affected by biomass burning were the dominating sources of particle-bound organic compounds in spring aerosols in the urban background of the megacity environment.

Supplementary Materials

The following are available online at https://www.mdpi.com/2073-4433/11/4/319/s1, text, title, Table S1: Classes and standards of organic and inorganic compounds used for the identification of functional groups in ambient aerosols, Table S2: Stretch and bend vibrations of the functional groups, assigned to classes of organic and inorganic compounds, Figure S1: FTIR spectra of the FF period, Figure S2: FTIR spectra of the BB-affected period.

Author Contributions

Conceptualization and paper writing: O.P.; field and simulation work: A.I.; methodology and sampling of vehicle emissions: M.V. All authors have read and agreed to the published version of the manuscript.

Funding

Observation data analyses concerning FF impact in the Moscow environment was supported by the Russian Science Foundation (RSF), project N19-773004 titled “Integrated technology for environment assessment of Moscow megacity based on chemical analysis of microparticle composition in the “atmosphere - snow - road dust - soil - surface water” system (Megacity)”. Vehicle tests were supported by the Czech Science Foundation project 18-04719S. Financial support was obtained from the Russian Fond for basic Research (RFBR) project N 20-55 12001 for FTIR- PCA studies of biomass burning impact.

Conflicts of Interest

The authors declare no conflict of interest.

References

  1. Fuzzi, S.; Baltensperger, U.; Carslaw, K.; Decesari, S.; Denier Van Der Gon, H.; Facchini, M.; Fowler, D.; Koren, I.; Langford, B.; Lohmann, U. Part. matter, air quality and climate: Lessons learned and fure needs. Atmos. Chem. Phys. 2015, 15, 8217–8299. [Google Scholar] [CrossRef] [Green Version]
  2. Pope III, C.A.; Dockery, D.W. Health effects of fine particulate air pollution: Lines that connect. J. Air Waste Manag. Assoc. 2006, 56, 709–742. [Google Scholar] [CrossRef] [PubMed]
  3. Russell, L.M.; Bahadur, R.; Hawkins, L.N.; Allan, J.; Baumgardner, D.; Quinn, P.K.; Bates, T.S. Organic aerosol characterization by complementary measurements of chemical bonds and molecular fragments. Atmos. Environ. 2009, 43, 6100–6105. [Google Scholar] [CrossRef]
  4. Russell, L.M.; Bahadur, R.; Ziemann, P.J. Identifying organic aerosol sources by comparing functional group composition in chamber and atmospheric particles. Proc. Natl. Acad. Sci. USA 2011, 108, 3516–3521. [Google Scholar] [CrossRef] [PubMed] [Green Version]
  5. Ruggeri, G.; Takahama, S. Development of chemoinformatic tools to enumerate functional groups in molecules for organic aerosol characterization. Atmos. Chem. Phys. 2016, 16, 4401–4422. [Google Scholar] [CrossRef] [Green Version]
  6. Liu, S.; Takahama, S.; Russell, L.; Gilardoni, S.; Baumgardner, D. Oxygenated organic functional groups and their sources in single and submicron organic particles in MILAGRO 2006 campaign. Atmos. Chem. Phys. Discuss. 2009, 9, 4567–4607. [Google Scholar] [CrossRef]
  7. Coury, C.; Dillner, A.M. ATR-FTIR characterization of organic functional groups and inorganic ions in ambient aerosols at a rural site. Atmos. Environ. 2009, 43, 940–948. [Google Scholar] [CrossRef]
  8. Steiner, S.; Czerwinski, J.; Comte, P.; Popovicheva, O.; Kireeva, E.; Müller, L.; Heeb, N.; Mayer, A.; Fink, A.; Rothen-Rutishauser, B. Comparison of the toxicity of diesel exhaust produced by bio-and fossil diesel combustion in human lung cells in vitro. Atmos. Environ. 2013, 81, 380–388. [Google Scholar] [CrossRef] [Green Version]
  9. Guzman-Morales, J.; Frossard, A.; Corrigan, A.; Russell, L.; Liu, S.; Takahama, S.; Taylor, J.; Allan, J.; Coe, H.; Zhao, Y. Estimated contributions of primary and secondary organic aerosol from fossil fuel combustion during the CalNex and Cal-Mex campaigns. Atmos. Environ. 2014, 88, 330–340. [Google Scholar] [CrossRef]
  10. Popovicheva, O.B.; Kireeva, E.D.; Shonija, N.K.; Vojtisek-Lom, M.; Schwarz, J. FTIR analysis of surface functionalities on particulate matter produced by off-road diesel engines operating on diesel and biofuel. Environ. Sci. Pollut. Res. 2015, 22, 4534–4544. [Google Scholar] [CrossRef]
  11. Popovicheva, O.B.; Irimiea, C.; Carpentier, Y.; Ortega, I.K.; Kireeva, E.D.; Shonija, N.K.; Schwarz, J.; Vojtíšek-Lom, M.; Focsa, C. Chemical composition of diesel/biodiesel particulate exhaust by ftir spectroscopy and mass spectrometry: Impact of fuel and driving cycle. Aerosol Air Qual. Res. 2017, 17, 1717–1734. [Google Scholar] [CrossRef] [Green Version]
  12. Weingartner, E.; Keller, C.; Stahel, W.; Burtscher, H.; Baltensperger, U. Aerosol emission in a road tunnel. Atmos. Environ. 1997, 31, 451–462. [Google Scholar] [CrossRef]
  13. Platt, S.M.; El Haddad, I.; Pieber, S.; Zardini, A.; Suarez-Bertoa, R.; Clairotte, M.; Daellenbach, K.; Huang, R.-J.; Slowik, J.; Hellebust, S. Gasoline cars produce more carbonaceous particulate matter than modern filter-equipped diesel cars. Sci. Rep. 2017, 7, 4926. [Google Scholar] [CrossRef] [PubMed]
  14. Lammers, K.; Arbuckle-Keil, G.; Dighton, J. FT-IR study of the changes in carbohydrate chemistry of three New Jersey pine barrens leaf litters during simulated control burning. Soil Biol. Biochem. 2009, 41, 340–347. [Google Scholar] [CrossRef]
  15. Fitzpatrick, E.; Ross, A.; Bates, J.; Andrews, G.; Jones, J.; Phylaktou, H.; Pourkashanian, M.; Williams, A. Emission of oxygenated species from the combustion of pine wood and its relation to soot formation. Process Saf. Environ. Prot. 2007, 85, 430–440. [Google Scholar] [CrossRef]
  16. Popovicheva, O.B.; Kozlov, V.S.; Rakhimov, R.F.; Shmargunov, V.P.; Kireeva, E.D.; Persiantseva, N.M.; Timofeev, M.A.; Engling, G.; Elephteriadis, K.; Diapouli, L.; et al. Optical-microphysical and physical-chemical characteristics of Siberian biomass burning: Small-scale fires in an aerosol chamber. Atmos. Ocean. Opt. 2016, 29, 492–500. [Google Scholar] [CrossRef]
  17. Maria, S.F.; Russell, L.M.; Turpin, B.J.; Porcja, R.J. FTIR measurements of functional groups and organic mass in aerosol samples over the Caribbean. Atmos. Environ. 2002, 36, 5185–5196. [Google Scholar] [CrossRef] [Green Version]
  18. Coury, C.; Dillner, A.M. A method to quantify organic functional groups and inorganic compounds in ambient aerosols using attenuated total reflectance FTIR spectroscopy and multivariate chemometric techniques. Atmos. Environ. 2008, 42, 5923–5932. [Google Scholar] [CrossRef]
  19. Kirchstetter, T.W.; Novakov, T.; Hobbs, P.V. Evidence that the spectral dependence of light absorption by aerosols is affected by organic carbon. J. Geophys. Res. Atmos. 2004, 109. [Google Scholar] [CrossRef] [Green Version]
  20. Healy, R.; Sofowote, U.; Su, Y.; Debosz, J.; Noble, M.; Jeong, C.-H.; Wang, J.; Hilker, N.; Evans, G.; Doerksen, G. Ambient measurements and source apportionment of fossil fuel and biomass burning black carbon in Ontario. Atmos. Environ. 2017, 161, 34–47. [Google Scholar] [CrossRef]
  21. Diapouli, E.; Kalogridis, A.-C.; Markantonaki, C.; Vratolis, S.; Fetfatzis, P.; Colombi, C.; Eleftheriadis, K. Annual variability of black carbon concentrations originating from biomass and fossil fuel combustion for the suburban aerosol in Athens, Greece. Atmosphere 2017, 8, 234. [Google Scholar] [CrossRef] [Green Version]
  22. Popovicheva, O.B.; Shonija, N.K.; Persiantseva, N.; Timofeev, M.; Diapouli, E.; Eleftheriadis, K.; Borgese, L.; Nguyen, X.A. Aerosol Pollutants during Agricultural Biomass Burning: A Case Study in Ba Vi Region in Hanoi, Vietnam. Aerosol Air Qual. Res. 2017, 17, 2762–2779. [Google Scholar] [CrossRef]
  23. Elliott, G.N.; Worgan, H.; Broadhurst, D.; Draper, J.; Scullion, J. Soil differentiation using fingerprint Fourier transform infrared spectroscopy, chemometrics and genetic algorithm-based feature selection. Soil Biol. Biochem. 2007, 39, 2888–2896. [Google Scholar] [CrossRef]
  24. Cadet, F.; Robert, C.; Offmann, B. Simultaneous determination of sugars by multivariate analysis applied to mid-infrared spectra of biological samples. Appl. Spectrosc. 1997, 51, 369–375. [Google Scholar] [CrossRef]
  25. Hori, R.; Sugiyama, J. A combined FT-IR microscopy and principal component analysis on softwood cell walls. Carbohydr. Polym. 2003, 52, 449–453. [Google Scholar] [CrossRef]
  26. Kulbachevsky, A.O. About environment state. In Moscow City in 2017; Department of Environmental Management and Protection: Moscow, Russia, 2018; 358 pages. [Google Scholar]
  27. Elansky, N.F.; Ponomarev, N.A.; Verevkin, Y.M. Air quality and pollutant emissions in the Moscow megacity in 2005–2014. Atmos. Environ. 2018, 175, 54–64. [Google Scholar] [CrossRef]
  28. Cheng, Z.; Luo, L.; Wang, S.; Wang, Y.; Sharma, S.; Shimadera, H.; Wang, X.; Bressi, M.; de Miranda, R.M.; Jiang, J.; et al. Status and characteristics of ambient PM2.5 pollution in global megacities. Environ. Int. 2016, 89–90, 212–221. [Google Scholar] [CrossRef]
  29. Popovicheva, O.B.; Kistler, M.; Kireeva, E.; Persiantseva, N.; Timofeev, M.; Kopeikin, V.; Kasper-Giebl, A. Physicochemical characterization of smoke aerosol during large-scale wildfires: Extreme event of August 2010 in Moscow. Atmos. Environ. 2014, 96, 405–414. [Google Scholar] [CrossRef]
  30. Chubarova, N.E.; Androsova, E.E.; Kirsanov, A.A.; Vogel, B.; Vogel, H.; Popovicheva, O.B.; Rivin, G.S. Aerosol and its radiative effects during the aeroradcity 2018 moscow experiment. Geogr. Environ. Sustain. 2019, 12, 114–131. [Google Scholar] [CrossRef] [Green Version]
  31. Stein, A.; Draxler, R.; Rolph, G.; Stunder, B.; Cohen, M.; Ngan, F. NOAA’s HYSPLIT atmospheric transport and dispersion modeling system. Bull. Am. Meteorol. Soc. 2015, 96, 2059–2077. [Google Scholar] [CrossRef]
  32. Vojtisek-Lom, M.; Pechout, M.; Dittrich, L.; Beránek, V.; Kotek, M.; Schwarz, J.; Vodička, P.; Milcová, A.; Rossnerová, A.; Ambrož, A. Polycyclic aromatic hydrocarbons (PAH) and their genotoxicity in exhaust emissions from a diesel engine during extended low-load operation on diesel and biodiesel fuels. Atmos. Environ. 2015, 109, 9–18. [Google Scholar] [CrossRef]
  33. Coates, J. Interpretation of infrared spectra, a practical approach. Encycl. Anal. Chem. Appl. Theory Instrum. 2006. [Google Scholar] [CrossRef]
  34. Maria, S.; Russell, L.; Turpin, B.; Porcja, R.; Campos, T.; Weber, R.; Huebert, B. Source signatures of carbon monoxide and organic functional groups in Asian Pacific Regional Aerosol Characterization Experiment (ACE-Asia) submicron aerosol types. J. Geophys. Res. Atmos. 2003, 108. [Google Scholar] [CrossRef] [Green Version]
  35. Cain, J.P.; Gassman, P.L.; Wang, H.; Laskin, A. Micro-FTIR study of soot chemical composition—Evidence of aliphatic hydrocarbons on nascent soot surfaces. Phys. Chem. Chem. Phys. 2010, 12, 5206–5218. [Google Scholar] [CrossRef]
  36. Bladt, H.; Schmid, J.; Kireeva, E.D.; Popovicheva, O.B.; Perseantseva, N.M.; Timofeev, M.A.; Heister, K.; Uihlein, J.; Ivleva, N.P.; Niessner, R. Impact of Fe content in laboratory-produced soot aerosol on its composition, structure, and thermo-chemical properties. Aerosol Sci. Technol. 2012, 46, 1337–1348. [Google Scholar] [CrossRef] [Green Version]
  37. Rosen, H.; Novakov, T. Optical transmission through aerosol deposits on diffusely reflective filters: A method for measuring the absorbing component of aerosol particles. Appl. Opt. 1983, 22, 1265–1267. [Google Scholar] [CrossRef]
  38. Bond, T.C.; Bergstrom, R.W. Light absorption by carbonaceous particles: An investigative review. Aerosol Sci. Technol. 2006, 40, 27–67. [Google Scholar] [CrossRef]
  39. Popovicheva, O.B.; Engling, G.; Ku, I.-T.; Timofeev, M.A.; Shonija, N.K. Aerosol emissions from long-lasting smoldering of boreal peatlands: Chemical composition, markers, and microstructure. Aerosol Air Qual. Res. 2019, 19, 484–503. [Google Scholar] [CrossRef] [Green Version]
  40. Popovicheva, O.; Timofeev, M.; Persiantseva, N.; Jefferson, M.A.; Johnson, M.; Rogak, S.N.; Baldelli, A. Microstructure and chemical composition of particles from small-scale gas flaring. Aerosol Air Qual. Res. 2019, 19, 2205–2221. [Google Scholar] [CrossRef] [Green Version]
  41. Popovicheva, O.B.; Kireeva, E.D.; Steiner, S.; Rothen-Rutishauser, B.; Persiantseva, N.M.; Timofeev, M.A.; Shonija, N.K.; Comte, P.; Czerwinski, J. Microstructure and chemical composition of diesel and biodiesel particle exhaust. Aerosol Air Qual. Res. 2014, 14, 1392–1401. [Google Scholar] [CrossRef]
  42. Popovicheva, O.B.; Engling, G.; Lin, K.-T.; Persiantseva, N.; Timofeev, M.; Kireeva, E.; Voelk, P.; Hubert, A.; Wachtmeister, G. Diesel/biofuel exhaust particles from modern internal combustion engines: Microstructure, composition, and hygroscopicity. Fuel 2015, 157, 232–239. [Google Scholar] [CrossRef]
  43. Gentner, D.R.; Isaacman, G.; Worton, D.R.; Chan, A.W.; Dallmann, T.R.; Davis, L.; Liu, S.; Day, D.A.; Russell, L.M.; Wilson, K.R. Elucidating secondary organic aerosol from diesel and gasoline vehicles through detailed characterization of organic carbon emissions. Proc. Natl. Acad. Sci. USA 2012, 109, 18318–18323. [Google Scholar] [CrossRef] [PubMed] [Green Version]
  44. Giakoumis, E.G.; Rakopoulos, C.D.; Dimaratos, A.M.; Rakopoulos, D.C. Exhaust emissions of diesel engines operating under transient conditions with biodiesel fuel blends. Prog. Energy Combust. Sci. 2012, 38, 691–715. [Google Scholar] [CrossRef]
  45. Kalogridis, A.C.; Popovicheva, O.B.; Engling, G.; Diapouli, E.; Kawamura, K.; Tachibana, E.; Ono, K.; Kozlov, V.S.; Eleftheriadis, K. Smoke aerosol chemistry and aging of Siberian biomass burning emissions in a large aerosol chamber. Atmos. Environ. 2018, 185, 15–28. [Google Scholar] [CrossRef]
  46. Popovicheva, O.B.; Engling, G.; Diapouli, E.; Saraga, D.; Persiantseva, N.M.; Timofeev, M.A.; Kireeva, E.D.; Shonija, N.K.; Chen, S.-H.; Nguyen, D.-L.; et al. Impact of smoke intensity on size-resolved aerosol composition and microstructure during the biomass burning season in northwest Vietnam. Aerosol Air Qual. Res. 2016, 16, 2635–3654. [Google Scholar] [CrossRef]
  47. Anıl, I.; Golcuk, K.; Karaca, F. ATR-FTIR spectroscopic study of functional groups in aerosols: The contribution of a Saharan dust transport to urban atmosphere in Istanbul, Turkey. Water Air Soil Pollut. 2014, 225, 1898. [Google Scholar] [CrossRef]
  48. Ravisankar, R.; Kiruba, S.; Eswaran, P.; Senthilkumar, G.; Chandrasekaran, A. Mineralogical characterization studies of ancient potteries of Tamilnadu, India by FT-IR spectroscopic technique. J. Chem. 2010, 7, S185–S190. [Google Scholar] [CrossRef]
  49. Martınez, J.; Ruiz, F.; Vorobiev, Y.V.; Pérez-Robles, F.; González-Hernández, J. Infrared spectroscopy analysis of the local atomic structure in silica prepared by sol-gel. J. Chem. Phys. 1998, 109, 7511–7514. [Google Scholar] [CrossRef]
  50. Wold, S.; Esbensen, K.; Geladi, P. Principal component analysis. Chemom. Intell. Lab. Syst. 1987, 2, 37–52. [Google Scholar] [CrossRef]
  51. Olson, M.R.; Victoria Garcia, M.; Robinson, M.A.; Van Rooy, P.; Dietenberger, M.A.; Bergin, M.; Schauer, J.J. Investigation of black and brown carbon multiple-wavelength-dependent light absorption from biomass and fossil fuel combustion source emissions. J. Geophys. Res. Atmos. 2015, 120, 6682–6697. [Google Scholar] [CrossRef]
  52. Fanning, P.E.; Vannice, M.A. A DRIFTS study of the formation of surface groups on carbon by oxidation. Carbon 1993, 31, 721–730. [Google Scholar] [CrossRef]
  53. Akhter, M.; Chughtai, A.; Smith, D. The structure of hexane soot I: Spectroscopic studies. Appl. Spectrosc. 1985, 39, 143–153. [Google Scholar] [CrossRef]
  54. Sauvain, J.-J.; Rossi, M.J. Quantitative aspects of the interfacial catalytic oxidation of dithiothreitol by dissolved oxygen in the presence of carbon nanoparticles. Environ. Sci. Technol. 2016, 50, 996–1004. [Google Scholar] [CrossRef] [PubMed] [Green Version]
  55. Kouyoumdjian, H.; Saliba, N. Ion concentrations of PM10 and PM2.5 aerosols over the eastern Mediterranean region: Seasonal variation and source identification. Atmos. Chem. Phys. Discuss. Eur. Geosci. Union 2005, 5, 13053–13073. [Google Scholar] [CrossRef] [Green Version]
  56. Bauer, H.; Claeys, M.; Vermeylen, R.; Schueller, E.; Weinke, G.; Berger, A.; Puxbaum, H. Arabitol and mannitol as tracers for the quantification of airborne fungal spores. Atmos. Environ. 2008, 42, 588–593. [Google Scholar] [CrossRef]
  57. Pey, J.; Querol, X.; De la Rosa, J.; González-Castanedo, Y.; Alastuey, A.; Gangoiti, G.; de la Campa, A.S.; Alados-Arboledas, L.; Sorribas, M.; Pio, C. Characterization of a long range transport pollution episode affecting PM in SW Spain. J. Environ. Monit. 2008, 10, 1158–1171. [Google Scholar] [CrossRef]
  58. Agarwal, S.; Aggarwal, S.G.; Okuzawa, K.; Kawamura, K. Size distributions of dicarboxylic acids, ketoacids, α-dicarbonyls, sugars, WSOC, OC, EC and inorganic ions in atmospheric particles over Northern Japan: Implication for long-range transport of Siberian biomass burning and East Asian polluted aerosols. Atmos. Chem. Phys. 2010, 10, 5839–5858. [Google Scholar] [CrossRef] [Green Version]
  59. Cuccia, E.; Piazzalunga, A.; Bernardoni, V.; Brambilla, L.; Fermo, P.; Massabò, D.; Molteni, U.; Prati, P.; Valli, G.; Vecchi, R. Carbonate measurements in PM10 near the marble quarries of Carrara (Italy) by infrared spectroscopy (FT-IR) and source apportionment by positive matrix factorization (PMF). Atmos. Environ. 2011, 45, 6481–6487. [Google Scholar] [CrossRef]
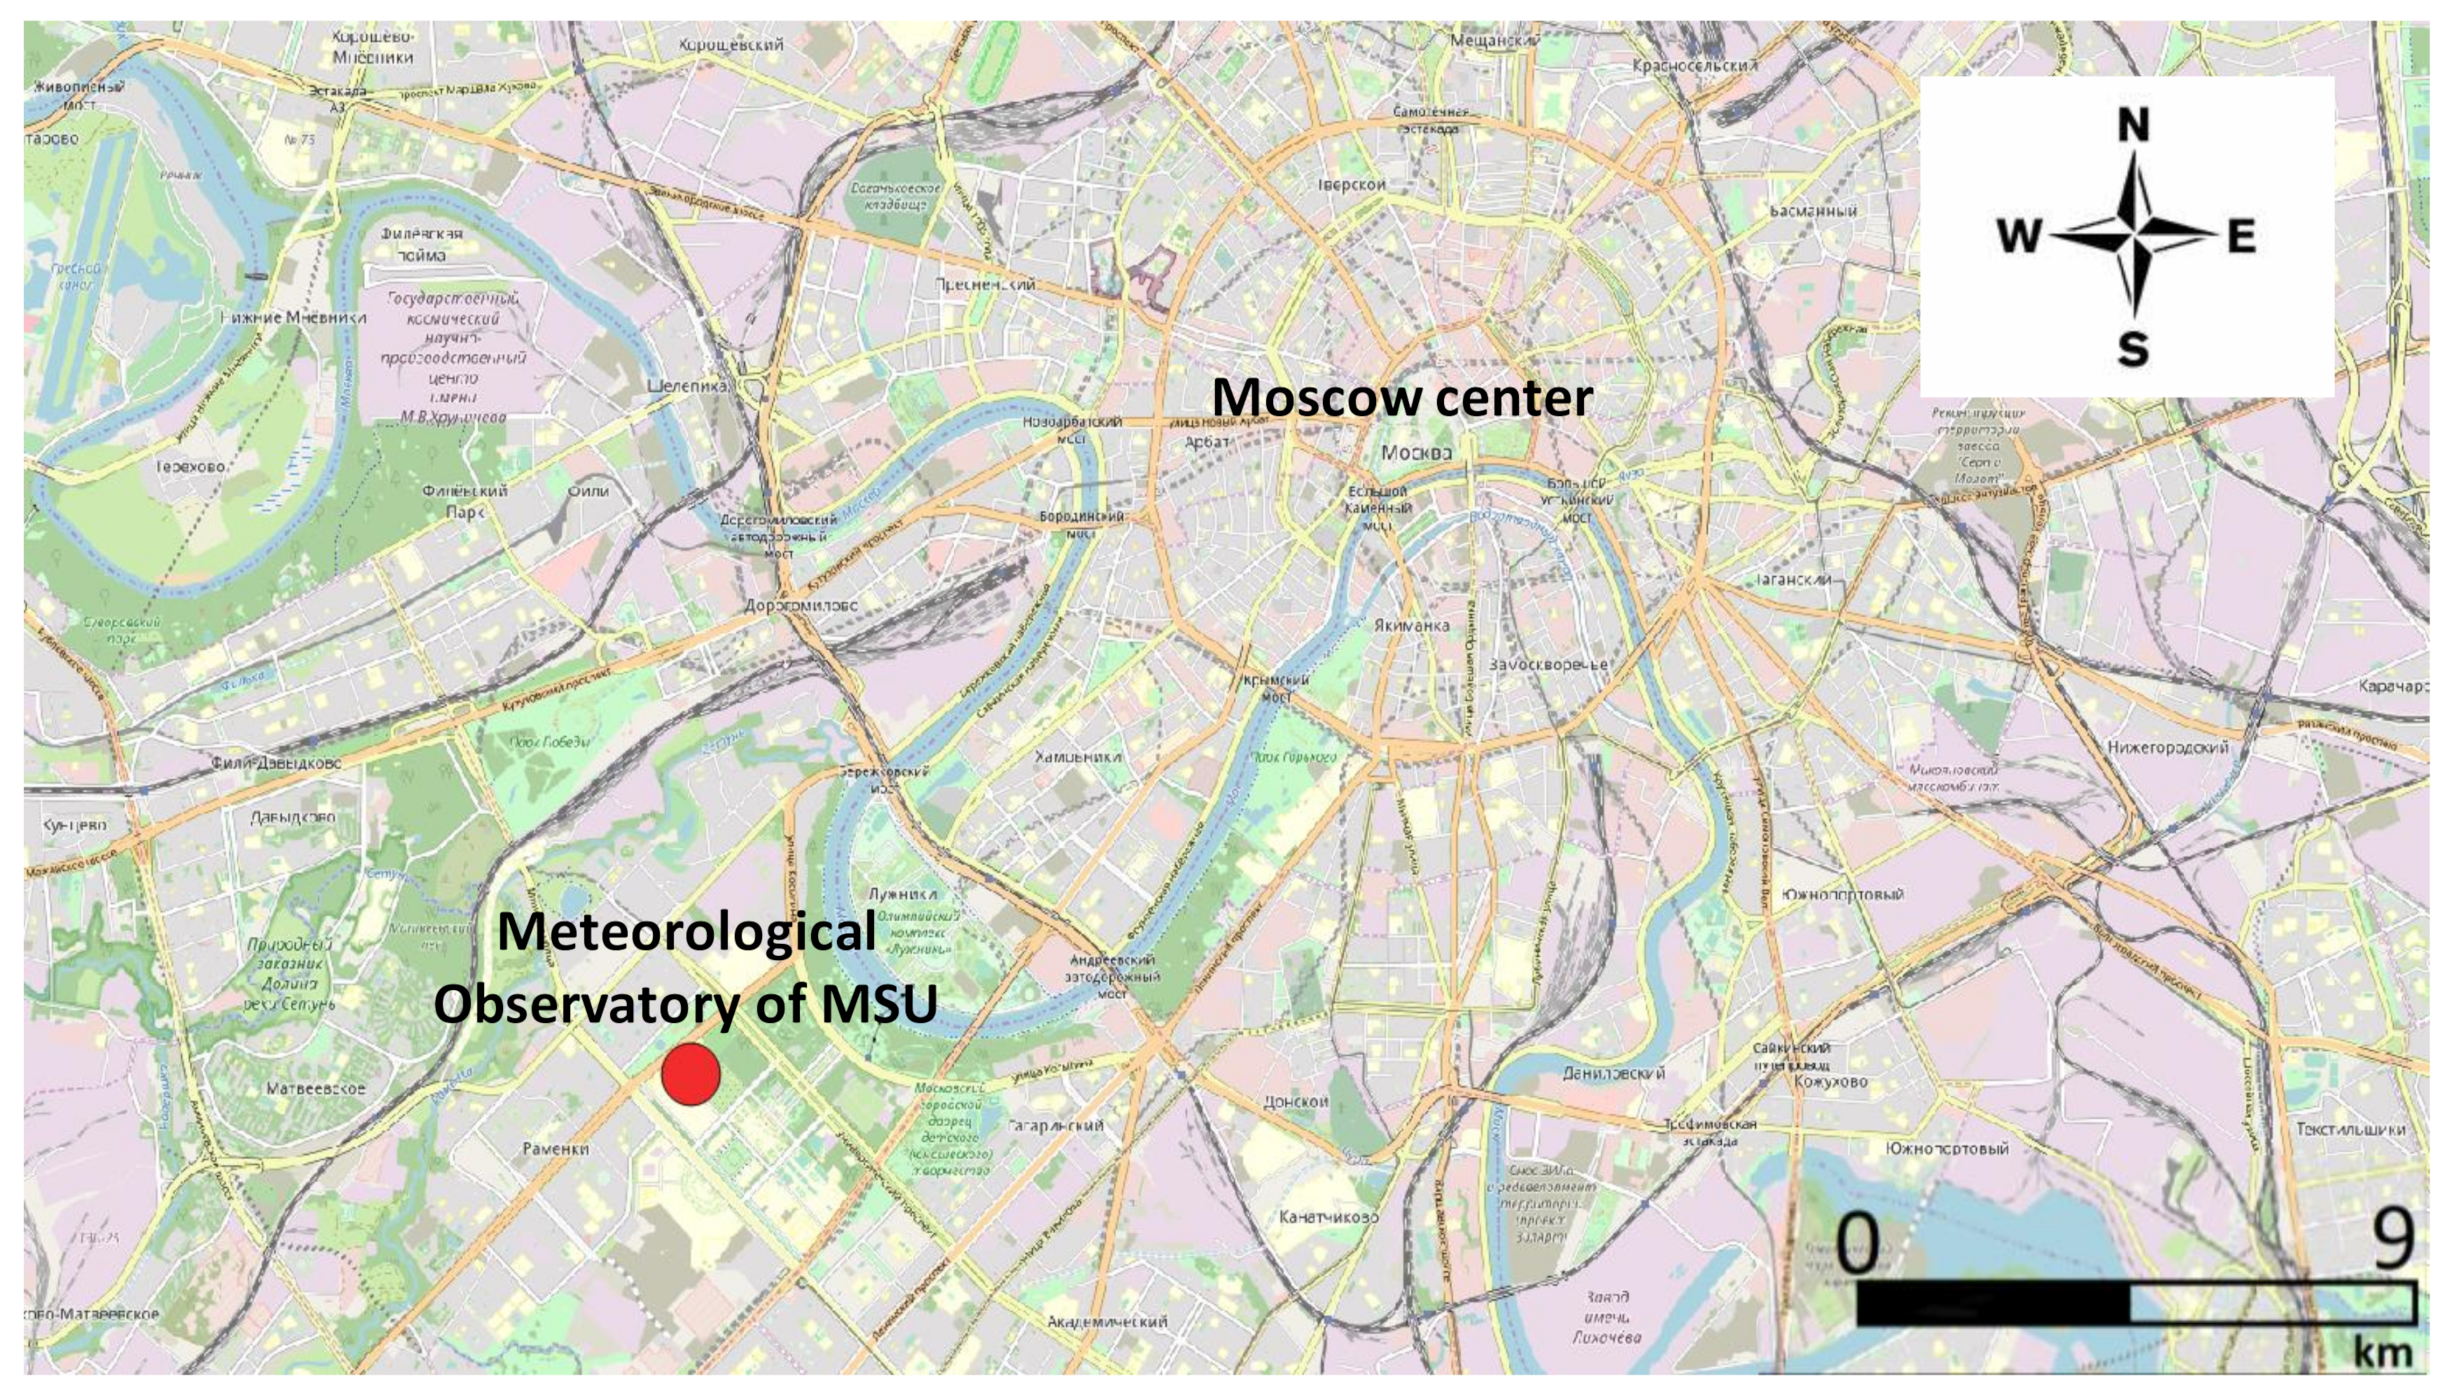
Figure 1. Map of Moscow city. Meteorological station of Moscow State University is indicated.
Atmosphere 11 00319 g001
Figure 2. PM10 mass concentrations and temperature over the sampling period at MO MSU.
Atmosphere 11 00319 g002
Figure 3. Absorption Angstrom Exponent (AAE) obtained from spectral dependence of aerosol light attenuation and number of fires (N) passed by air masses.
Atmosphere 11 00319 g003
Figure 4. Two-day back air mass transportation from the HYSPLIT model in the days of the BB-affected period (left) and FF period (right), 500 m A.S.L. Fires observed by FIRMS in indicated days are marked by circles and triangles.
Atmosphere 11 00319 g004
Figure 5. FTIR spectra for 05.18 and 05.19 from the FF period. Spectra of a heavy-duty diesel engine operated in the World Harmonized Transient Cycle and with conventional EN 590 diesel fuel engine (Diesel_WHTC), an off-road diesel engine operated in a Non-Road Steady State cycle ISO-8178 (Diesel_ ISO_8178), and an multi-point injection (MPI) gasoline engine operated in an Urban cycle (MPI_gasoline_URBAN) represent road and off-road diesel and gasoline emissions, respectively.
Atmosphere 11 00319 g005
Figure 6. FTIR spectra for 05.01 and 04.29 from the BB-affected period. Spectra of the Moscow regional biomass represented by spruce flaming and mixture smoldering fires.
Atmosphere 11 00319 g006
Figure 7. PCA score plots (PC1 × PC2) for FTIR spectra of sampling days marked by red and blue for AAE in the range of 1.61 ± 0.02 and 1.08 ± 0.02, relating to the BB-affected and FF periods, respectively.
Atmosphere 11 00319 g007
Figure 8. PC1, PC2, and PC3 loadings. Marked extremums are the absorption bands identified on FTIR spectra of daily samples.
Atmosphere 11 00319 g008
Table 1. Patterns of functional groups acting as functional markers of transport vehicle and regional BB smoldering and flaming emissions in Moscow megacity.
Wavenumbers, cm−1Diesel/Gasoline Transport Wavenumbers, cm−1Smoldering/Flaming
637SO42−617-621SO42−
750 C=C-H762C=C-H
1585C=C1530-NO2
1668C=O1618C=C
1719C=O1730–1680C=O
2920–2859C-C-H2926–2851C-C-H
~3401O-H,N-H
Table 2. Functional factors presented by principal components of PCA analysis of FTIR data.
Wavenumber, 1/cmPC1 Loading (58%)PC2 Loading (21%)PC3 Loading (11%)Functional Groups
617−0.133 SO42− sulphates
621 0.21 SO42− sulphates
638 0.126SO42− sulfuric acid, sulphates
6440.038 SO42− sulfuric acid
648 −0.125 SO42− sulfuric acid, sulphates
667−0.046 −0.126SO42− sulphates, sulfuric acid
710 0.038 CO32− carbonates; SO42− sulphates; C=C-H polyaromatics
712−0.064 CO32− carbonates; C=C-H polyaromatics
7350.046 C=C-H polyaromatics
741 −0.058 C=C-H polyaromatics
762−0.132 0.046C=C-H polyaromatics
878−0.207 CO32− carbonates; C=C-H polyaromatics
882 −0.126 CO32− carbonates; C=C-H polyaromatics
883 0.105CO32− carbonates; C=C-H polyaromatics
928−0.068 O-H organic acids
947 −0.073 O-H organic acids
9510.076 O-H organic acids
1539 −0.043-NO2 nitrocompounds
1587 −0.019N-H amino acid; -NO2 nitrocompounds
1591−0.023 N-H amino acid; C=C polyaromatics
1593 −0.011 N-H amino acid; C=C polyaromatics
1614 −0.038 C=C polyaromatics; N-H amino acid
16160.032 C=C polyaromatics; N-H amino acid
1618 0.075C=C polyaromatics; N-H amino acid
1643 0.027 C=C alkenes
1645−0.04 C=C alkenes
1684−0.012 C=O aldehydes
1686 0.063 C=O aldehydes
1688 −0.031C=O aldehydes, carboxylic acid
17090.018 C=O carboxylic acid, ketones, aldehydes
1715 −0.074 C=O carboxylic acid, ketones, aldehydes
1736−0.046 C=O esters, carboxylic acid
1742 0.029 C=O esters, carboxylic acid
2855−0.049 C-C-H aliphatic hydrocarbons; O-H organic acids
2857 −0.019 C-C-H aliphatic hydrocarbons; O-H organic acids
2926−0.053 C-C-H aliphatic hydrocarbons; C=C alkenes
2928 −0.024 C=C alkenes
3233 −0.01 NH4+ ammonium
33560.009 N-H amino acid; O-H carbohydrates and alcohols
3403−0.013 N-H amines and amino acid; O-H alcohols
3474 −0.02 O-H sugar, alcohols and carbohydrates