Article

Projection of Future Summer Precipitation over the Yellow River Basin: A Moisture Budget Perspective

1
State Key Laboratory of Severe Weather, Chinese Academy of Meteorological Sciences, Beijing 100081, China
2
Henan Key Laboratory of Agrometeorological Support and Applied Technique, China Meteorological Administration, Zhengzhou 450003, China
3
School of Earth and Environmental Sciences, Seoul National University, Seoul 08826, Korea
4
Fujian Key Laboratory of Severe Weather, Fujian Province Meteorology Bureau, Fuzhou 350001, China
*
Authors to whom correspondence should be addressed.
Atmosphere 2020, 11(12), 1307; https://doi.org/10.3390/atmos11121307
Submission received: 30 October 2020 / Revised: 26 November 2020 / Accepted: 30 November 2020 / Published: 2 December 2020
(This article belongs to the Section Meteorology)

Abstract

:
The projection of future precipitation over the Yellow River Basin (YRB) is of great importance to regional climate change adaptation and mitigation. Using the historical simulations and projections under the four combined scenarios of the shared socioeconomic pathways and the forcing levels of the Representative Concentration Pathways (SSP1-2.6, SSP2-4.5, SSP3-7.0 and SSP5-8.5) provided by the multimodel ensemble mean of 10 models in phase six of the Coupled Model Intercomparison Project (CMIP6), the projected spatial and temporal changes of future summer precipitation over the YRB and the possible physical mechanisms underlying future summer precipitation changes are investigated. Large discrepancies in precipitation exist among the four scenarios during the latter half period of the 21st century, with precipitation under SSP5-8.5 being the largest. Nevertheless, the precipitation under each of the four scenarios shows a similar spatial pattern over the YRB, with an east–west-oriented gradient. A comparison of projected moisture transport into the YRB among the four scenarios reveals two channels (westerlies and monsoon flow) under SSP5-8.5, whereas the monsoon flow from adjacent oceans is important under the other three scenarios. Further analysis of the unique features of the projected moisture flux and substantial increase in summer precipitation under SSP5-8.5 indicates that the future summer precipitation trend over the YRB can be mainly attributed to an increase in evaporation and moisture advection.

1. Introduction

The Yellow River Basin (YRB) is located in the northern part of China, occupying the region between 33.5° N and 41.5° N and between 96° E and 119° E. This area not only feeds around 107 million people but also accounts for 13% of the total cultivated land in China [1,2]. The YRB is located in a semi-arid–semi-humid region and is strongly influenced by the distinct stepwise northward movement of the East Asian summer monsoon (EASM) [3,4]. Under the modulation of a monsoon shift, around 70% of the annual precipitation over the YRB occurs in summer (June–July–August) [5]. Anomalous summer precipitation over the YRB causes frequent droughts and floods, leading to the displacement of millions of residents, grain yield reduction, economic loss, and soil erosion. Therefore, gaining further insight into the summer precipitation over the YRB is imperative for better human wellbeing and regional socioeconomic development related to water resource management, agriculture, and ecosystem services.
Many studies have been devoted to the issue of the warming climate over the YRB [6,7]. It has been found that the YRB experienced a warming trend at a rate of 0.19 °C per decade over the past 50 years [8]. Moreover, the YRB is anticipated to continue to warm during the period 2021–2050, with an average annual increase of 0.039–0.056 °C [9]. As a significant atmospheric response to warming, precipitation changes over the YRB have been extensively discussed [10,11]. Yang et al. [12] demonstrated that precipitation over the YRB during the past 50 years generally experienced a non-significant decreasing trend (−45.3 mm per 50 y), with a dry–wet–dry–wet–dry cycle from the 1950s to the 1990s, and the main reason for the drying up of the YRB was the increased use of water for irrigation. During the past four decades, annual precipitation over the upper YRB has exhibited a slight decreasing trend. In response to climate change, runoff and suspended sediment loads have exhibited remarkable declines over the upper YRB [13]. Zhang et al. [14] attributed the decrease in precipitation over the northern YRB after the 1990s to the reduced Arctic ice.
Recently, more attention has been paid to the projection of precipitation over the YRB under a warming background [15]. Both the magnitude and the interannual variability of precipitation over the source region of the YRB are expected to increase under future scenarios [16]. Based on the ensemble experiment with the climate models in phase 5 of the Coupled Model Intercomparison Project (CMIP5), annual precipitation over the source region of the YRB is also projected to increase, by 5.0–10.0% in the near term and 10.0–20.0% in the long term, relative to the historical period of 1971–2000 [17]. Yang et al. [18] found that summer precipitation over the YRB is expected to increase at an average rate of 2.27 mm per decade under Representative Concentration Pathway 8.5 (RCP8.5), but decrease at a rate of 2.99 mm per decade for RCP4.5 during the future period of 2021–2050, as revealed by CMIP5.
An essential factor for precipitation is an abundant moisture supply [19]. Situated at the northern limit of the EASM zone, precipitation anomalies over the YRB are directly influenced by anomalies of wave activities related to the westerlies, as well as by the southerly warm and moist monsoon flows [14]. Moisture transport from the western Pacific, the South China Sea (SCS), and the westerlies plays a vital role in precipitation over the YRB, and moisture transport from the Bay of Bengal strengthens precipitation over the YRB to some extent [20]. Zhao et al. [21] identified two moisture transport channels for summer precipitation over the middle and lower reaches of the YRB under the effect of the Tibetan Plateau (TP): the westerlies, and the southerly monsoon flow with moisture from the Bay of Bengal, the SCS, and the western Pacific. It is obvious that moisture transport is a non-negligible factor in precipitation changes over the YRB [22,23]. Based on a moisture budget method, the underlying physical mechanisms of future precipitation changes in other regions have been discussed [24,25]. However, in the face of anticipated climate warming, the possible causes of future precipitation changes over the YRB remain unclear. As precipitation over the YRB mainly occurs in summer, more detailed information on the spatiotemporal evolution of future summer precipitation over the YRB would be invaluable.
In contrast to previous studies that have researched the flood and drought conditions over the YRB from the viewpoint of terrestrial water cycle processes including streamflow, runoff, and soil erosion, this study mainly emphasizes the hydrological changes over the YRB from the atmospheric perspective, particularly, using a moisture budget method, to address the physical mechanisms of future summer precipitation changes. This study is expected to provide meaningful information for the development of climate change policies, as well as regional climate change adaptation and mitigation.
The objectives of this study are: (1) to characterize the spatial and temporal changes of projected summer precipitation over the YRB during the 21st century in the CMIP6 archive under diverse scenarios; and (2) to employ a moisture budget method to investigate the physical mechanisms underlying the projected summer precipitation changes over the YRB under the warming climate. The remainder of this paper is organized as follows: Section 2 describes the models, data, and methods. Section 3.1 presents the features of observed and simulated summer precipitation in the CMIP6 archive. The projected temporal and spatial changes of future summer precipitation over the YRB under different scenarios during the 21st century are reported in Section 3.2. In Section 3.3, a moisture budget method is employed to clarify the physical process of future summer precipitation changes over the YRB. Finally, some discussions and conclusions are provided in Section 4 and Section 5.

2. Models, Data and Methods

2.1. Reanalysis Data

The observed monthly precipitation data used in this study are from the Climate Prediction Center Merged Analysis of Precipitation (CMAP) monthly global mean gridded precipitation dataset from 1979 to the present day, with a spatial resolution of 2.5° × 2.5° [26]. Other observed monthly variables, including specific humidity, surface air pressure, and zonal and meridional winds, are derived from the National Centers for Environment Prediction US Department of Energy Intercomparison Project II reanalysis (NCEP-2) from 1979 to the present day, with a 2.5° × 2.5° horizontal resolution [27]. The above reanalysis datasets cover a historical period of 1981–2014.

2.2. CMIP6 Models

The 10 climate models in the CMIP6 archive (https://esgf-node.llnl.gov/search/cmip6) were selected in this research [28]. Table 1 gives a detailed description of these models, including the model number, model acronym, affiliated institution, and horizontal resolution. Based on monthly variables including precipitation, evaporation, near-surface air temperature, specific humidity, horizontal wind and surface air pressure, the historical simulations and future projections under diverse scenarios from the 10 climate models are analyzed. The historical simulations are driven by external factors covering greenhouse gases, aerosols, ozone, solar activity, volcanoes, and land use. The historical simulations for the period 1981–2014 were selected in this study. The future scenarios are a combination of the shared socioeconomic pathways (SSPs) and the forcing levels of the RCPs. Specifically, this study uses the SSP1-2.6, SSP2-4.5, SSP3-7.0 and SSP5-8.5 scenarios, in which the target radiative forcing is up to about 2.6, 4.5, 7.0 and 8.5 W m−2, respectively, by 2100 [29]. The future period refers to 2021–2099, which is further divided into the former half period (2021–2060) and the latter half period (2061–2099). Projected future changes are obtained according to the difference between the future and historical periods. The first member is chosen (r1i1p1f1), although all models provide certain ensemble members. As the multi-model mean (MMM) can reduce the error of a single model [30], the MMM method is employed in the current analysis. Note that the NESM3 model has not participated the SSP3-7.0 experiment in the Scenario Model Intercomparison Project of CMIP6, and thus the MMM of the other nine CMIP6 models is calculated under the SSP3-7.0 scenario. To acquire the MMM, the reanalysis datasets and the outputs of the CMIP6 models are interpolated to a uniform grid (1.5° × 1.5°) using the bilinear interpolation. Owing to the serious bias over the TP simulated by climate models [31], the current analysis does not consider the TP region. Summertime refers to June, July and August.

2.3. Methods

2.3.1. Moisture Flux

The vertically integrated moisture flux is calculated as follows [32]:
q V = { 1 g p t p s ( q u ) d p } x + { 1 g p t p s ( q v ) d p } y ,
where q is the specific humidity; g is the gravitational acceleration; { } means the vertical integration from the surface pressure to the atmospheric top; ps is the surface pressure; pt is the top atmospheric pressure; V is the horizontal wind field, including the zonal wind (u) and meridional wind (v); and qu (qv) is the zonal (meridional) component of the vertically integrated moisture flux. The vertically integrated moisture flux is calculated individually for each model and then the vertically integrated moisture fluxes for all the selected models are simple averaged into the vertically integrated moisture flux of the MMM.

2.3.2. Moisture Budget

To investigate the possible physical process behind future summer precipitation changes over the YRB, the moisture budget analysis method is calculated as follows [33,34]:
Δ P = Δ { p t p s ( V · q ) d p } Δ { p t p s ( q · V ) d p } + Δ { p t p s Ed p } + Δ { p t p s Re s d p } ,
where Δ denotes the difference between the future and historical simulations; P is precipitation; is the horizontal gradient operator; V is the horizontal wind field; ps is the surface pressure, and pt is the top atmospheric pressure; { } means the vertical integration from the surface pressure to atmospheric top. On the right-hand side of Equation (2), the first term denotes changes in moisture advection, the second term indicates changes in moisture convergence associated with vertical motion, the third term represents changes in evaporation, and the last term denotes the residual, which is usually small, including the moisture tendency, computational errors, and biases in climate models. From the moisture budget perspective, precipitation changes are primarily attributed to changes in horizontal moisture advection, moisture convergence, and evaporation.

3. Results

3.1. Climatological Summer Precipitation over the YRB

The Yellow River, which is 5464 km long and has a basin area of 752,443 km2, is the sixth longest river in the world and the second longest in China [35]. It ranges from the TP, wanders through the semi-arid Loess Plateau, passes through the semi-humid North China Plain, and finally discharges into the Bohai Gulf (Figure 1a). Figure 1c shows the climatological distribution of the observed summer precipitation over the YRB during the historical period 1981–2014. A southeast–northwest precipitation gradient can be observed over the YRB, with a precipitation maximum (approximately above 5.5 mm d−1) in the southeast and a minimum (nearly below 0.2 mm d−1) in the northwest, which may be caused by the northward propagation of the EASM [36]. Moisture transport is essential for precipitation, and intimately resembles the large-scale circulation [37]. Two main branches of moisture transport to the YRB are evident: one is the mid-latitude westerlies, and the other is the southerly monsoon flow from tropical oceans, including the Bay of Bengal and the SCS (vectors in Figure 1b). The climatological summer precipitation pattern over the YRB simulated by the MMM of the 10 selected CMIP6 models is presented in Figure 1d. Obviously, there is a good agreement between the MMM and the observations in reproducing a reasonable southeast–northwest precipitation gradient pattern, with the relative great precipitation in the east. In addition, due to the simulation uncertainty over vast topographies in climate models [38,39,40], another precipitation-maximum region can be seen over the southwest YRB (near the eastern periphery of the TP). Overall, the MMM of the 10 selected CMIP6 models can reliably capture the main characteristics of the observed summer precipitation over the YRB.

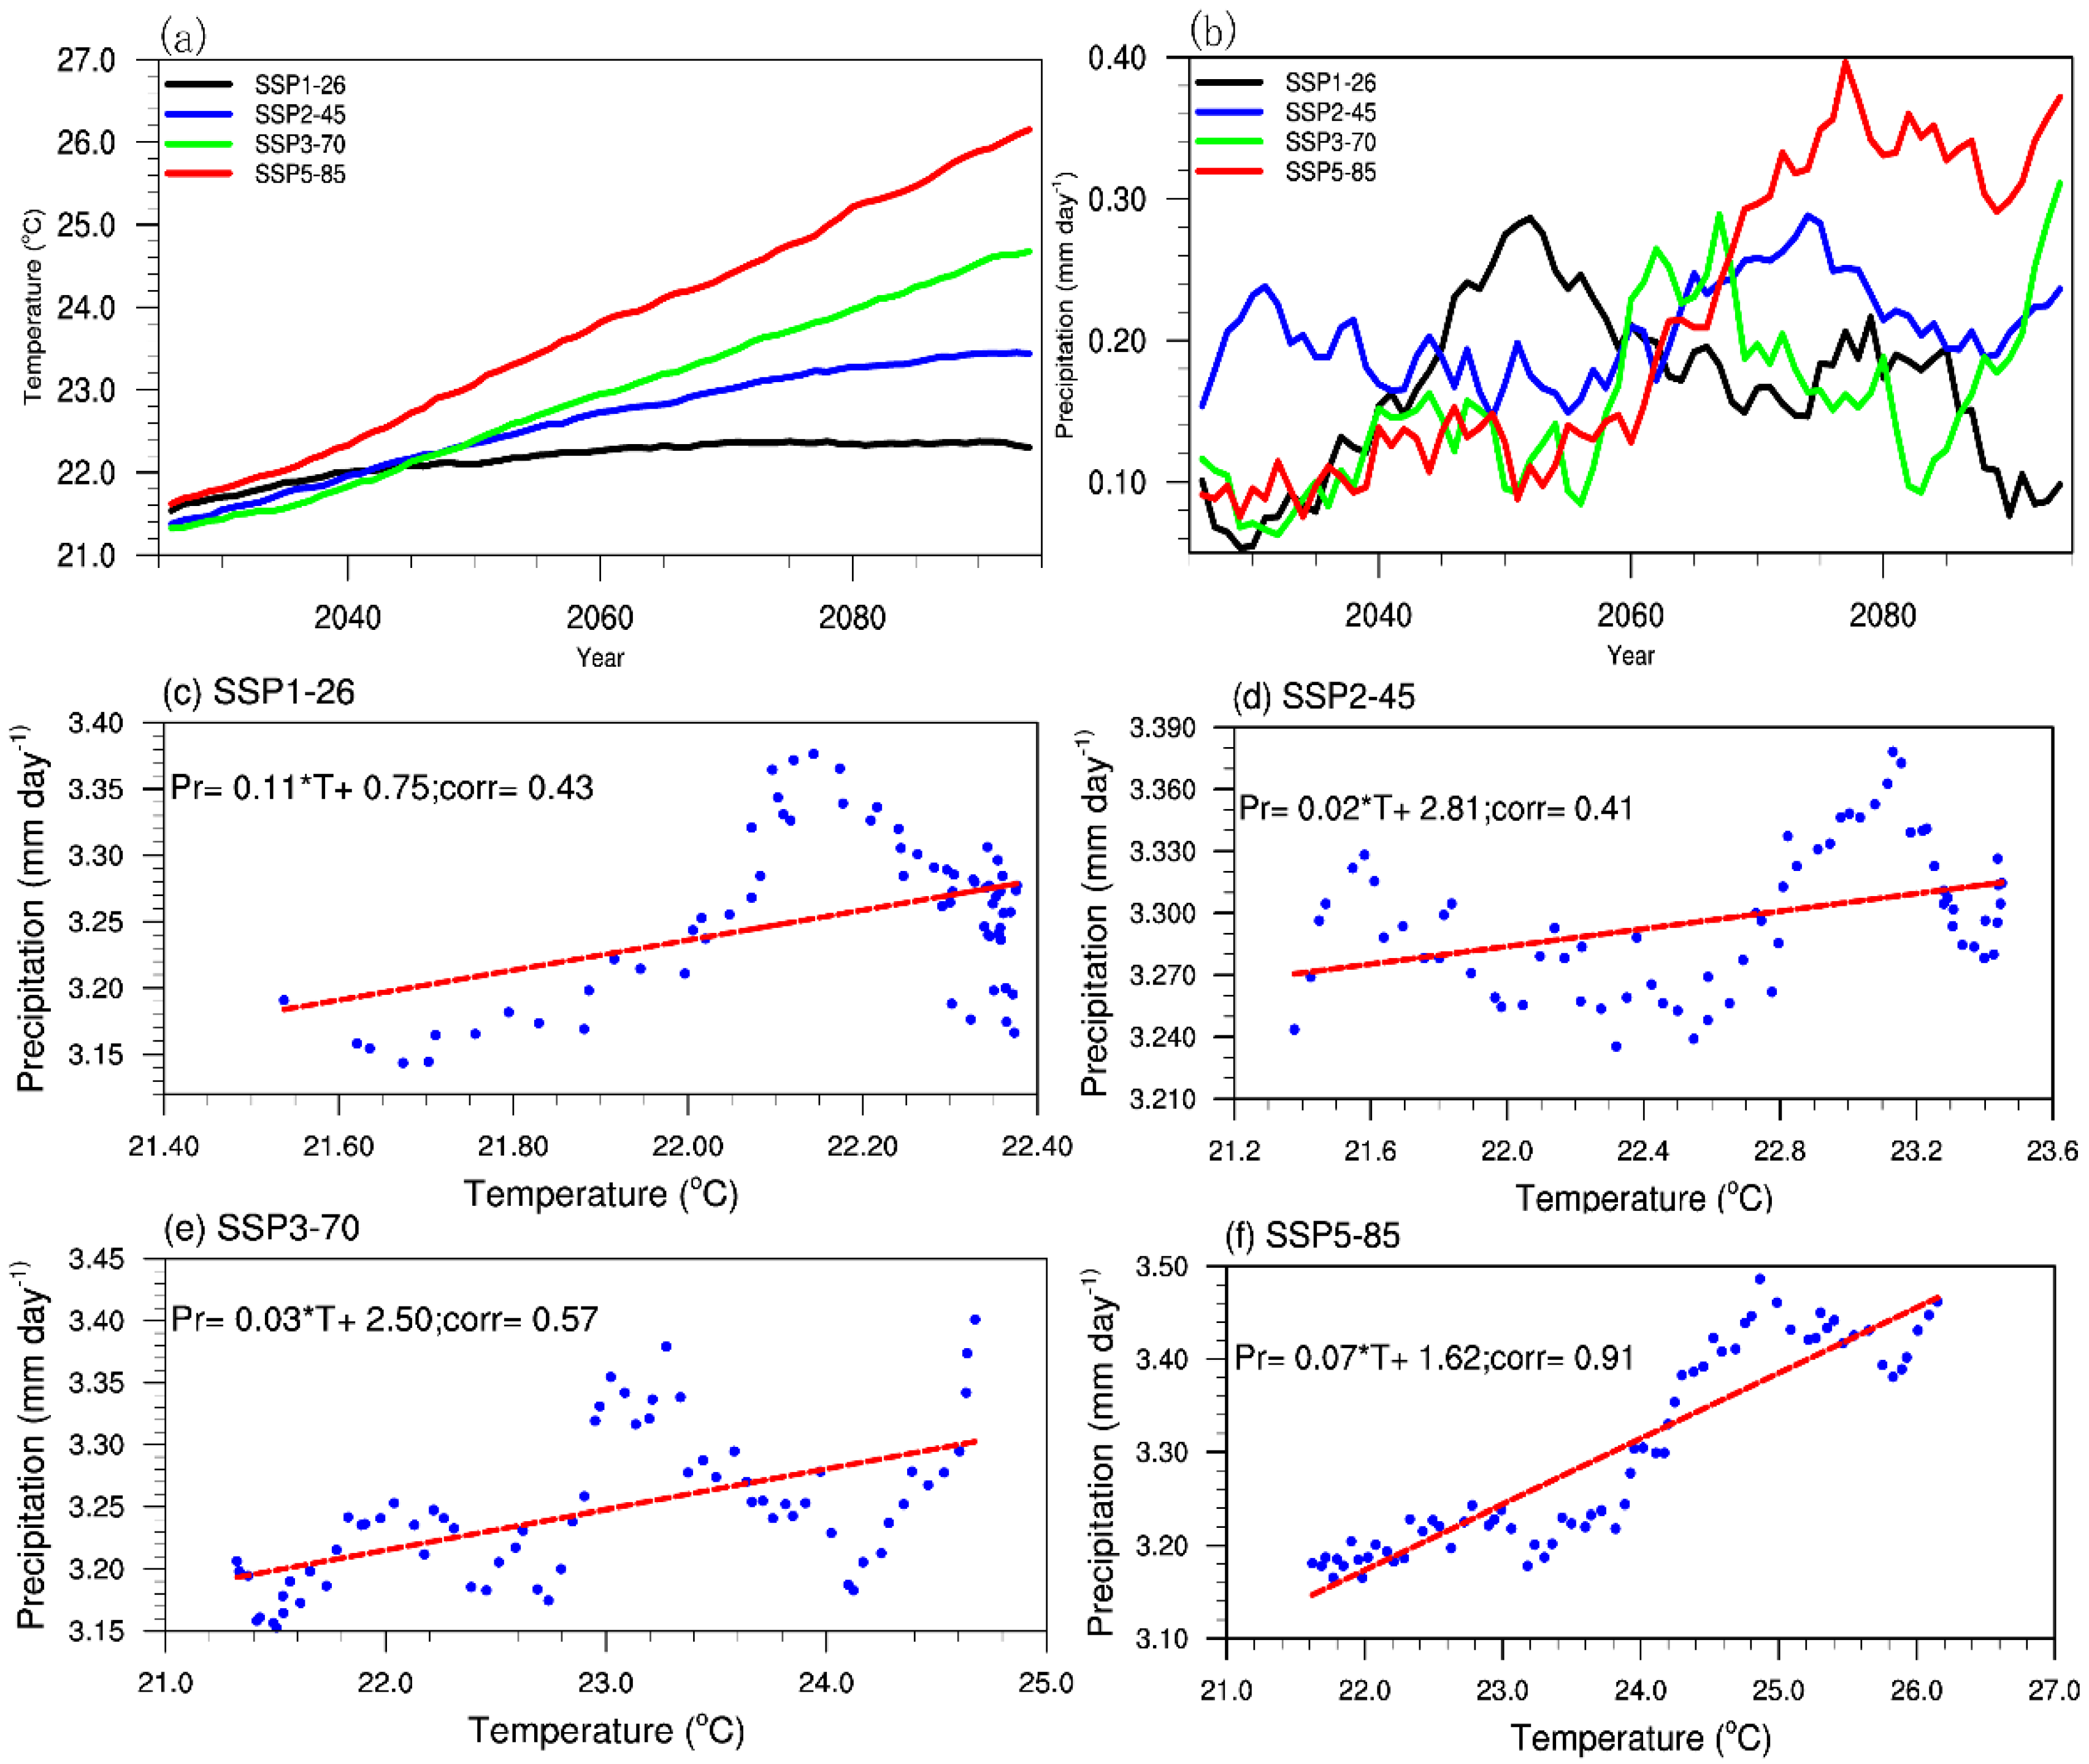
3.2. Projection of Future Summer Precipitation over the YRB

In a context of acknowledged global warming [41,42], the future changes of near-surface air temperature over the YRB during the 21st century remain to be investigated. Figure 2a shows the trend of summer mean near-surface air temperature over the YRB projected by the MMM of the selected models under the SSP1-2.6, SSP2-4.5, SSP3-7.0 and SSP5-8.5 scenarios. A distinct feature is that around after the 2050s, the near-surface air temperature and its growth rate are projected to be greater under higher scenarios. Precipitation changes are the significant atmospheric response to the warming climate; therefore, the trend of projected summer precipitation over the YRB under the four scenarios is given in Figure 2b. In the former half period of the 21st century, there are only slight discrepancies in summer precipitation among the four scenarios. However, in the latter half period, precipitation under the SSP5-8.5 scenario shows a large discrepancy with the other three scenarios. As can be seen, summer precipitation under SSP5-8.5 is generally expected to undergo a continuous increase by the end of the 21st century, whereas summer precipitation experiences a decline to some extent during the latter half period under the other three scenarios. A comparison of projected summer precipitation trends over the YRB under the four scenarios reveals that summer precipitation changes show substantial differences between the high and low scenarios during the latter half period of the 21st century.
Additionally, the scatterplot with future near-surface air temperature, and projected summer precipitation over the YRB during the 21st century under the four scenarios is shown in Figure 2c–f. The corresponding linear regression equation for each scenario is also shown accordingly. The correlation coefficient between the two terms is 0.43 for SSP1-2.6, 0.41 for SSP2-4.5, 0.57 for SSP3-7.0, 0.91 for SSP5-8.5, respectively. It is evident that there is an increasing trend of projected summer precipitation over the YRB to warming under all the four scenarios. Especially, the upward trend of projected summer precipitation over the YRB is the most significant under the SSP5-8.5 scenario (Figure 2f).
To further explore the difference in summer precipitation changes under the four scenarios during the latter half period, Figure 3 shows the geographical pattern of future summer precipitation changes over the YRB during the former and latter half periods under the four scenarios, relative to the historical simulation. Although the four scenarios during both the former half (Figure 3a–d) and latter half (Figure 3e–h) periods witness a consistent east–west-oriented positive precipitation anomaly gradient over the YRB, the latter half period is expected to have a more strengthened precipitation increase, implying a larger response of precipitation to warming during the latter half period than in the former half period. During the latter half period, the YRB is projected to experience significant positive precipitation changes to the east but only slight positive precipitation anomalies to the west, which is similar to the observed summer precipitation pattern. Among the four scenarios, summer precipitation under the SSP5-8.5 scenario is anticipated to show the most prominent positive anomalies in the eastern part of the YRB (Figure 3h), followed by relatively significant positive anomalies under SSP2-4.5 (Figure 3f), whereas the positive precipitation changes are much weaker under SSP1-2.6 and SSP3-7.0 (Figure 3e,g).

3.3. Mechanism of Projected Summer Precipitation: From a Moisture Budget Perspective

The above results show that different scenarios are associated with different hydrological changes over the YRB during the latter half period, with precipitation being the greatest under the SSP5-8.5 scenario. However, a common feature among the four scenarios is that the eastern part of the YRB witnesses a consistent summer precipitation increase. This phenomenon indicates that the precipitation-maximum region during the historical period will become much wetter during the latter half period, suggesting a crucial role of moisture in future summer precipitation changes over the YRB. The future changes in total-column specific humidity and moisture flux during the latter half period relative to the historical mean are shown in Figure 4. Under the SSP1-2.6 scenario, a prominent increase in moisture content can be found over the northwestern Pacific region, especially near the Korean Peninsula, providing favorable conditions for the build-up of moisture over the YRB. There are two main channels for moisture transport into the YRB: one is from the northwestern Pacific, and the other is the southerly monsoon flow coming from the SCS and the Bay of Bengal (Figure 4a). For the SSP2-4.5 and SSP3-7.0 scenarios, the intensified moist southwesterly flows from the SCS and Bay of Bengal are transported into the YRB, corresponding to the enhanced moisture content and precipitation in situ (Figure 4b,c). In contrast to the above three scenarios, the moisture transport via westerlies is strengthened enormously under the SSP5-8.5 scenario (Figure 4d). In other words, both the westerlies and the moist monsoon flows make great contributions to future summer precipitation changes over the YRB under the SSP5-8.5 scenario, whereas the moist monsoon flows play an important role in future summer precipitation changes over the YRB under the other three scenarios.
To further quantify the physical mechanisms underpinning the unique features of the projected moisture flux and substantial increase in summer precipitation over the YRB under SSP5-8.5, Figure 5a shows the future changes of vertically integrated moisture flux convergence over the YRB under SSP5-8.5 during the latter half period relative to the historical mean. The projected moisture flux convergence varies from significant positive anomalies over the east YRB to negative anomalies over the west YRB (Figure 5a), generally consistent with the projected summer precipitation changes over the YRB in Figure 3h. As a crucial term in the moisture budget, the changes in moisture flux convergence can be divided into two contributions: moisture convergence as a result of changes in circulation, and moisture advection due to changes in humidity gradients [43]. Then, the moisture budget method is performed in the subsequent analysis. The future summer precipitation over the YRB features an increasing trend during the latter half period under SSP5-8.5, which is mainly dominated by an increase in evaporation and moisture advection. The former results from the increased moisture content due to enhanced evaporation caused by the increased surface temperature, and the latter comes from the uneven distribution of the horizontal moisture content. However, the moisture convergence term offsets this wetting trend (Figure 5b).

4. Discussion

From the moisture budget perspective, the increasing summer precipitation trend over the YRB during the latter half period is mainly attributed to the increase in evaporation and moisture advection. The latter term indicates the horizontal moisture transport via westerlies, as well as the horizontal moist monsoon flows from oceans are favorable for projected precipitation increase over the YRB under the SSP5-8.5 scenario. Based on historical observed and reanalysis datasets, the cyclonic circulation over Mongolia is found to strengthen the westerlies, which facilitates the moisture transport to enhance summer precipitation over the YRB. Meanwhile, influenced by the westward extension of the western North Pacific Subtropical High, the southerly monsoon flows transport abundant moisture from the tropical oceans into the YRB [21,32]. The large-scale circulations conducive to the moisture transport of observed summer precipitation over the YRB have been clear. Our next work will target the future global circulation changes related to projected summer precipitation over the YRB, such as identifying the different moisture sources and quantifying their corresponding contributions to projected summer precipitation changes over the YRB.
The YRB is typified by three distinct topographies: the TP, with elevation from 2000 to 5000 m; the Loess Plateau, with elevation from 500 to 2000 m; and the eastern plain [44,45]. Correspondingly, the climate conditions vary sharply. Hence, the whole basin can be characterized into different regions in terms of topography and climate [12]. The western part of the YRB is mainly influenced by mid-latitude westerlies, whereas the eastern region is dominated by the monsoon flow [46]. In this study, Figure 1c,d show a large precipitation gradient at around 110°E over the YRB, and Figure 5a shows the opposite sign in projected moisture flux convergence anomalies between the western and eastern parts of the YRB. These results indicate that the characteristics and related physical mechanisms of future summer precipitation changes over the western and eastern parts of the YRB may show differences, which remain to be addressed in future work.
In addition, some studies have shown that there are still uncertainties in climate models, such as the large uncertainty in the relative importance of moisture advection and convergence terms, and the large intermodel spreads [34,47,48]. At present, climate models are evolving towards greater comprehensiveness, including finer resolution and more complex physical processes, and will be capable of better simulating the observed climate. With a deeper understanding of the climate system, more credible results will emerge in the near future.

5. Conclusions

Using the newly released 10 climate models in the CMIP6 archive, this study reveals the future changes of summer precipitation over the YRB and its related physical mechanisms in the 21st century using a moisture budget method. The conclusions can be summarized as follows.
The MMM of the 10 selected CMIP6 models can well capture the distinct east–west-oriented gradient feature of the observed summer precipitation over the YRB, with the relatively greater precipitation in the east.
Compared with the former half period of the 21st century, future summer precipitation changes show substantial discrepancies among the four scenarios during the latter half period, with precipitation being the largest under the SSP5-8.5 scenario. Moreover, the moisture transport via both the westerlies and the moist monsoon flows make considerable contributions to future summer precipitation over the YRB under the SSP5-8.5 scenario, whereas the moist monsoon flows constitute the important moisture transport channel of future summer precipitation over the YRB under the other three scenarios.
Further quantitative analysis using the moisture budget method suggests that the increasing precipitation over the YRB under the SSP5-8.5 scenario during the latter half period of the 21st century is primarily caused by the increase in evaporation and moisture advection. The former results from the increased moisture content due to the enhanced evaporation caused by increased surface temperature, and the latter comes from the uneven distribution of the horizontal moisture content. However, the moisture convergence term offsets the future increasing precipitation trend over the YRB.
As a drought-prone region, the future hydrological changes over the YRB have been previously investigated [49,50]. Yang et al. [18] found that summer precipitation over the YRB under the RCP8.5 scenario is projected to increase during the period 2021–2050. Wang et al. [9] implied that future increased water shortages during dry seasons and more flooding during wet seasons is a likely trend over the YRB. This study gives a comprehensive illustration of the continuous upward trend of projected summer precipitation over the YRB during the 21st century under the SSP5-8.5 scenario, which corresponds to the aforementioned studies. However, these aforementioned studies fail to provide an explanation for the changes in future summer precipitation. Our work highlights the key mechanisms underpinning the future changes in summer precipitation over the YRB from a moisture budget perspective, which advances our understanding of the likely changes to the hydrological cycle over this semi-arid to arid region under the warming climate.

Author Contributions

Conceptualization, data curation, and supervision, Y.Z.; writing—original draft preparation, formal analysis, and visualization, J.L.; funding acquisition, Z.T. All authors have read and agreed to the published version of the manuscript.

Funding

This research was jointly funded by the National Key Research and Development Program of China (grant 2018YFC1505805), National Research Foundation of Korea (NRF) grant funded by the Korean government (MEST) (grant 2019R1A6A1A10073437), and National Key Research and Development Program of China under Grant (No. 2018YFC0406602).

Acknowledgments

The authors acknowledge the National Oceanic and Atmospheric Administration (NOAA) for providing the NCEP-2 data (https://psl.noaa.gov/data/gridded/data.ncep.reanalysis2.html) and the CMAP data (https://rda.ucar.edu/datasets/ds728.1). The authors also acknowledge the Earth System Grid Federation (ESGF) for acquiring the CMIP6 outputs and providing access (https://esgf-node.llnl.gov/search/cmip6).

Conflicts of Interest

The authors declare no conflict of interest.

References

  1. Cai, X.; Rosegrant, M.W. Optional water development strategies for the Yellow River Basin: Balancing agricultural and ecological water demands. Water Resour. Res. 2004, 40, W08S04. [Google Scholar] [CrossRef] [Green Version]
  2. McVicar, T.R.; Van Niel, T.G.; Li, L.; Hutchinson, M.F.; Mu, X.; Liu, Z. Spatially distributing monthly reference evapotranspiration and pan evaporation considering topographic influences. J. Hydrol. 2007, 338, 196–220. [Google Scholar] [CrossRef]
  3. Yuan, F.; Berndtsson, R.; Uvo, C.B.; Zhang, L.; Jiang, P. Summer precipitation prediction in the source region of the Yellow River using climate indices. Hydrol. Res. 2016, 47, 847–856. [Google Scholar] [CrossRef] [Green Version]
  4. Li, J.; Ding, R.; Wu, Z.; Zhong, Q.; Li, B.; Li, J. Inter-decadal change in potential predictability of the East Asian summer monsoon. Theor. Appl. Clim. 2019, 136, 403–415. [Google Scholar] [CrossRef]
  5. Zhao, Y.; Wang, M.; Li, J.; Yang, X.; Zhang, N.; Chen, H. Diurnal Variations in Summer Precipitation over the Yellow River Basin. Adv. Meteorol. 2019, 2019, 1–10. [Google Scholar] [CrossRef]
  6. Liang, K.; Bai, P.; Li, J.; Liu, C. Variability of temperature extremes in the Yellow River basin during 1961–2011. Quat. Int. 2014, 336, 52–64. [Google Scholar] [CrossRef]
  7. Ma, L.; Xia, H.; Sun, J.; Wang, H.; Feng, G.; Qin, F. Spatial–Temporal Variability of Hydrothermal Climate Conditions in the Yellow River Basin from 1957 to 2015. Atmosphere 2018, 9, 433. [Google Scholar] [CrossRef] [Green Version]
  8. Lu, S.; Jing, W.; Zhao, J.; Liu, X.; Huang, Z. Characteristics of the Temporal Variation in Temperature and Precipitation in China’s Lower Yellow River Region. Adv. Meteorol. 2014, 2014, 1–15. [Google Scholar] [CrossRef]
  9. Wang, G.; Zhang, J.; Jin, J.; Weinberg, J.; Bao, Z.; Liu, C.; Liu, Y.; Yan, X.; Song, X.; Zhai, R. Impacts of climate change on water resources in the Yellow River basin and identification of global adaptation strategies. Mitig. Adapt. Strat. Glob. Chang. 2017, 22, 67–83. [Google Scholar] [CrossRef]
  10. Wang, S.; Zhang, Z. Effects of climate change on water resources in China. Clim. Res. 2011, 47, 77–82. [Google Scholar] [CrossRef]
  11. He, Y.; Mu, X.; Gao, P.; Zhao, G.; Wang, F.; Sun, W.; Zhang, Y. Spatial Variability and Periodicity of Precipitation in the Middle Reaches of the Yellow River, China. Adv. Meteorol. 2016, 2016, 1–9. [Google Scholar] [CrossRef] [Green Version]
  12. Yang, D.; Li, C.; Hu, H.; Lei, Z.; Yang, S.; Kusuda, T.; Koike, T.; Musiake, K. Analysis of water resources variability in the Yellow River of China during the last half century using historical data. Water Resour. Res. 2004, 40, W065021–W0650212. [Google Scholar] [CrossRef]
  13. Yu, X.; Xie, X.; Meng, S. Modeling the Responses of Water and Sediment Discharge to Climate Change in the Upper Yellow River Basin, China. J. Hydrol. Eng. 2017, 22, 5017026. [Google Scholar] [CrossRef]
  14. Zhang, J.; Li, L.; Li, D.; Deng, W. Summer droughts in the northern Yellow River basin in association with recent Arctic ice loss. Int. J. Clim. 2015, 35, 2849–2859. [Google Scholar] [CrossRef]
  15. Yuan, F.; Ma, M.; Ren, L.; Shen, H.; Li, Y.; Jiang, S.; Yang, X.; Zhao, C.; Kong, H. Possible Future Climate Change Impacts on the Hydrological Drought Events in the Weihe River Basin, China. Adv. Meteorol. 2016, 2016, 1–14. [Google Scholar] [CrossRef] [Green Version]
  16. Hu, Y.; Maskey, S.; Uhlenbrook, S. Downscaling daily precipitation over the Yellow River source region in China: A comparison of three statistical downscaling methods. Theor. Appl. Clim. 2013, 112, 447–460. [Google Scholar] [CrossRef]
  17. Su, F.; Zhang, L.; Ou, T.; Chen, D.; Yao, T.; Tong, K.; Qi, Y. Hydrological response to future climate changes for the major upstream river basins in the Tibetan Plateau. Glob. Planet. Chang. 2016, 136, 82–95. [Google Scholar] [CrossRef]
  18. Yang, X.; Zheng, W.; Ren, L.; Zhang, M.R.; Jiang, S.H. Potential impact of climate change to the future streamflow of Yellow River Basin based on CMIP5 data. Proc. IAHS 2018, 376, 97–104. [Google Scholar] [CrossRef]
  19. Zhao, Y.; Xu, X.; Liu, L.; Zhang, R.; Xu, H.; Wang, Y.; Li, J. Effects of convection over the Tibetan Plateau on rainstorms downstream of the Yangtze River Basin. Atmos. Res. 2019, 219, 24–35. [Google Scholar] [CrossRef]
  20. Liang, P.; He, J.H.; Chen, L.X.; Li, W. Anomalous moisture sources for the severe precipitation over North China during summer. Plateau Meteor. 2007, 26, 460–465. (In Chinese) [Google Scholar]
  21. Zhao, Y.; Xu, X.D.; Zhao, T.L.; Yang, X.J. Effects of the Tibetan Plateau and its second staircase terrain on rainstorms over North China: From the perspective of water vapor transport. Int. J. Climatol. 2019, 39, 3121–3133. [Google Scholar] [CrossRef] [Green Version]
  22. Wang, C.; Gao, S.; Liang, L.; Deng, D.-F.; Gong, H. Multi-scale characteristics of moisture transport during a rainstorm process in North China. Atmos. Res. 2014, 145–146, 189–204. [Google Scholar] [CrossRef]
  23. Zhao, Y.; Chen, D.; Li, J.; Chen, D.; Chang, Y.; Li, J.; Qin, R. Enhancement of the summer extreme precipitation over North China by interactions between moisture convergence and topographic settings. Clim. Dyn. 2020, 54, 2713–2730. [Google Scholar] [CrossRef] [Green Version]
  24. Seager, R.; Naik, N.; Vecchi, G.A. Thermodynamic and Dynamic Mechanisms for Large-Scale Changes in the Hydrological Cycle in Response to Global Warming. J. Clim. 2010, 23, 4651–4668. [Google Scholar] [CrossRef] [Green Version]
  25. Chou, C.; Neelin, J.D. Mechanisms of Global Warming Impacts on Regional Tropical Precipitation. J. Clim. 2004, 17, 2688–2701. [Google Scholar] [CrossRef] [Green Version]
  26. Xie, P.; Arkin, P.A. Global precipitation: A 17-year monthly analysis based on gauge observations, satellite estimates, and numerical model outputs. Bull. Am. Meteorol. Soc. 1997, 78, 2539–2558. [Google Scholar] [CrossRef]
  27. Kanamitsu, M.; Ebisuzaki, W.; Woollen, J.; Yang, S.K.; Hnilo, J.J.; Fiorino, M.; Potter, G.L. NCEP-DOE AMIP-II Reanalysis (R-2). Bull. Am. Meteorol. Soc. 2002, 83, 1631–1643. [Google Scholar] [CrossRef]
  28. Eyring, V.; Bony, S.; Meehl, G.A.; Senior, C.A.; Stevens, B.; Stouffer, R.J.; Taylor, K.E. Overview of the Coupled Model Intercomparison Project Phase 6 (CMIP6) experimental design and organization. Geosci. Model Dev. 2016, 9, 1937–1958. [Google Scholar] [CrossRef] [Green Version]
  29. Jiang, J.; Zhou, T.; Chen, X.; Zhang, L. Future changes in precipitation over Central Asia based on CMIP6 projections. Environ. Res. Lett. 2020, 15, 54009. [Google Scholar] [CrossRef]
  30. Min, S.-K.; Park, E.-H.; Kwon, W.-T. Future Projections of East Asian Climate Change from Multi-AOGCM Ensembles of IPCC SRES Scenario Simulations. J. Meteorol. Soc. Jpn. 2004, 82, 1187–1211. [Google Scholar] [CrossRef] [Green Version]
  31. Chen, L.; Frauenfeld, O.W. A comprehensive evaluation of precipitation simulations over China based on CMIP5 multimodel ensemble projections. J. Geophys. Res. Atmos. 2014, 119, 5767–5786. [Google Scholar] [CrossRef]
  32. Zhao, Y.; Xu, X.; Li, J.; Zhang, R.; Kang, Y.; Huang, W.; Xia, Y.; Liu, D.; Sun, X. The Large-Scale Circulation Patterns Responsible for Extreme Precipitation Over the North China Plain in Midsummer. J. Geophys. Res. Atmos. 2019, 124, 12794–12809. [Google Scholar] [CrossRef] [Green Version]
  33. Hsu, P.C.; Li, T.; Luo, J.J.; Murakami, H.; Zhao, M. Increase of global monsoon area and precipitation under global warming: A robust signal? Geophys. Res. Lett. 2012, 39, 6701. [Google Scholar] [CrossRef] [Green Version]
  34. Seo, K.; Ok, J.; Son, J.-H.; Cha, D.-H. Assessing Future Changes in the East Asian Summer Monsoon Using CMIP5 Coupled Models. J. Clim. 2013, 26, 7662–7675. [Google Scholar] [CrossRef]
  35. Fu, G.; Chen, S.; Liu, C.; Shepard, D. Hydro-Climatic Trends of the Yellow River Basin for the Last 50 Years. Clim. Chang. 2004, 65, 149–178. [Google Scholar] [CrossRef] [Green Version]
  36. Ding, Y. The Variability of the Asian Summer Monsoon. J. Meteorol. Soc. Jpn. 2007, 85, 21–54. [Google Scholar] [CrossRef] [Green Version]
  37. Zhou, T.-J. Atmospheric water vapor transport associated with typical anomalous summer rainfall patterns in China. J. Geophys. Res. Space Phys. 2005, 110, D08104. [Google Scholar] [CrossRef] [Green Version]
  38. Chen, H.; Zhou, T.; Neale, R.B.; Wu, X.; Zhang, G.J. Performance of the New NCAR CAM3.5 in East Asian Summer Monsoon Simulations: Sensitivity to Modifications of the Convection Scheme. J. Clim. 2010, 23, 3657–3675. [Google Scholar] [CrossRef]
  39. Xin, X.-G.; Wu, T.; Zhang, J.; Yao, J.; Fang, Y. Comparison of CMIP6 and CMIP5 simulations of precipitation in China and the East Asian summer monsoon. Int. J. Clim. 2020, 1–18. [Google Scholar] [CrossRef] [Green Version]
  40. Lee, J.Y.; Wang, B. Future change of global monsoon in the CMIP5. Clim. Dyn. 2014, 42, 101–119. [Google Scholar] [CrossRef] [Green Version]
  41. Tokarska, K.B.; Stolpe, M.B.; Sippel, S.; Fischer, E.M.; Smith, C.J.; Lehner, F.; Knutti, R. Past warming trend constrains future warming in CMIP6 models. Sci. Adv. 2020, 6, eaaz9549. [Google Scholar] [CrossRef] [Green Version]
  42. Zhan, W.; He, X.; Sheffield, J.; Wood, E.F. Projected Seasonal Changes in Large-Scale Global Precipitation and Temperature Extremes Based on the CMIP5 Ensemble. J. Clim. 2020, 33, 5651–5671. [Google Scholar] [CrossRef] [Green Version]
  43. Hsu, P.C.; Li, T.; Murakami, H.; Kitoh, A. Future change of the global monsoon revealed from 19 CMIP5 models. J. Geophys. Res. Atmos. 2013, 118, 1247–1260. [Google Scholar] [CrossRef]
  44. Zhao, F.F.; Xu, Z.X.; Huang, J.X. Long-term trend and abrupt change for major climate variables in the upper Yellow River Basin. J. Meteorol. Res. 2007, 21, 204–214. [Google Scholar]
  45. Zhang, G.-H.; Fu, S.-H.; Fang, W.-H.; Imura, H.; Zhang, X.-C. Potential Effects of Climate Change on Runoff in the Yellow River Basin of China. Trans. ASABE 2007, 50, 911–918. [Google Scholar] [CrossRef]
  46. Wei, W.; Zhang, R.; Wen, M.; Kim, B.-J.; Nam, J.-C. Interannual Variation of the South Asian High and Its Relation with Indian and East Asian Summer Monsoon Rainfall. J. Clim. 2015, 28, 2623–2634. [Google Scholar] [CrossRef]
  47. Kusunoki, S.; Arakawa, O. Change in the precipitation intensity of the East Asian summer monsoon projected by CMIP3 models. Clim. Dyn. 2011, 38, 2055–2072. [Google Scholar] [CrossRef] [Green Version]
  48. Kim, Y.-H.; Min, S.-K.; Zhang, X.; Sillmann, J.; Sandstad, M. Evaluation of the CMIP6 multi-model ensemble for climate extreme indices. Weather. Clim. Extremes 2020, 29, 100269. [Google Scholar] [CrossRef]
  49. Zhu, Y.; Lin, Z.; Wang, J.; Zhao, Y.; He, F. Impacts of Climate Changes on Water Resources in Yellow River Basin, China. Procedia Eng. 2016, 154, 687–695. [Google Scholar] [CrossRef] [Green Version]
  50. Fu, G.; Charles, S.P.; Yu, J.; Liu, C. Decadal Climatic Variability, Trends, and Future Scenarios for the North China Plain. J. Clim. 2009, 22, 2111–2123. [Google Scholar] [CrossRef]
Figure 1. (a) Map showing the locations of the Yellow River and Yangtze River (purple lines). The grey shading indicates the elevation of the land and the blue shading denotes the ocean. (b) The climatological vertically integrated specific humidity (shaded; units: kg kg−1) and moisture flux (vectors; units: kg m−1 s−1) in summer during the historical period (1981–2014) based on National Centers for Environment Prediction US Department of Energy Intercomparison Project II reanalysis (NCEP-2) data. The black box denotes the Yellow River Basin (YRB). (c,d) The geographical distribution of climatological summer precipitation (shaded; units: mm d−1) over the YRB during the historical period (1981–2014) based on (c) Center Merged Analysis of Precipitation (CMAP) data and (d) the multi-model mean (MMM) of the 10 selected climate models in the CMIP6 archive. The grey line indicates the Yellow River. White shading denotes the Tibetan Plateau (TP).
Atmosphere 11 01307 g001
Figure 2. (a) Trend of the summer mean near-surface air temperature (unit: °C; 11 year running mean) over the YRB projected by the MMM of the selected CMIP6 models. (b) Future changes of summer precipitation (units: mm d−1; 11 year running mean) over the YRB projected by the MMM of the selected CMIP6 models relative to the historical mean. SSP1-2.6 (black), SSP2-4.5 (blue), SSP3-7.0 (green), and SSP5-8.5 (red). (cf) The scatterplot with future near-surface air temperature (°C; 11-year running mean) on x, and future summer precipitation over the YRB (mm d−1; 11 year running mean) on y projected by the MMM of the selected CMIP6 models during the 21st century under (c) SSP1-2.6; (d) SSP2-4.5; (e) SSP3-7.0; and (f) SSP5-8.5.
Atmosphere 11 01307 g002
Figure 3. Future changes of summer precipitation (shaded; units: mm d−1) projected by the MMM of the selected CMIP6 models under (a) SSP1-2.6; (b) SSP2-4.5; (c) SSP3-7.0; and (d) SSP5-8.5 during the former half period of the 21st century, and under (e) SSP1-2.6; (f) SSP2-4.5; (g) SSP3-7.0; and (h) SSP5-8.5 during the latter half period of the 21st century, relative to the historical mean. The blue line indicates the Yellow River. Grey shading denotes the TP.
Atmosphere 11 01307 g003
Figure 4. Future changes in the total-column specific humidity (shaded; units: kg kg−1) and moisture flux (vectors; units: kg m−1 s−1) in summer projected by the selected CMIP6 models under (a) SSP1-2.6; (b) SSP2-4.5; (c) SSP3-7.0; and (d) SSP5-8.5 during the latter half period of the 21st century, relative to the historical mean. The blue line indicates the Yellow River. The black box denotes the YRB. Grey shading denotes the TP.
Atmosphere 11 01307 g004
Figure 5. (a) Future changes in the total-column moisture flux convergence (shaded; units: 10−5 kg m−2 s−1) in summer projected by the selected CMIP6 models under SSP5-8.5 during the latter half period of the 21st century relative to the historical mean. The blue line indicates the Yellow River. Grey shading denotes the TP. (b) Future changes of summer precipitation over the YRB projected by the selected CMIP6 models under SSP5-8.5 during the latter half period of the 21st century relative to the historical mean, and the relative contributions of moisture advection, moisture convergence, surface evaporation, and residual term to projected summer precipitation changes over the YRB. Units: mm d−1.
Atmosphere 11 01307 g005
Table 1. Model acronyms, institutions, and horizontal resolutions of the Coupled Model Intercomparison Project (CMIP6) models used in this study.
No.Model
Acronym
Institute/CountryHorizon Resolution
(lon × lat)
1AWI-CM-1-1-MRAlfred Wegener Institute (AWI)/Germany0.9375° × ~0.9272°
2CAMS-CSM1-0Chinese Academy of Meteorological Sciences (CAMS)/China1.125° × ~1.112°
3CanESM5Canadian Centre for Climate Modelling and Analysis (CCCma)/Canada2.8125° × ~2.7673°
4CMCC-CM2-SR5Fondazione Centro Euro-Mediterraneo sui Cambiamenti Climatici
(CMCC)/Italy
1.25° × ~0.9°
5FGOALS-g3Chinese Academy of Sciences (CAS)/China2° × ~5.18°
6MPI-ESM1-2-LRMax Planck Institute for Meteorology
(MPI-M)/Germany
1.875° × 1.85°
7MPI-ESM1-2-HRMPI-M/Germany0.9375° × ~0.9272°
8MRI-ESM2-0Meteorological Research Institute of Japan Meteorological Agency (MRI)/Japan1.125° × ~1.11°
9MIROC6Center for Climate System Research (CCSR), National Institute for Environmental Studies (NIES), Frontier Research Center for Global Change (FRCGC)/Japan1.40625° × ~1.39°
10NESM3Nanjing University of Information Science and Technology (NUIST)/China1.875° × ~1.7°
Publisher’s Note: MDPI stays neutral with regard to jurisdictional claims in published maps and institutional affiliations.

