Abstract
For the investigation of geographical, monthly, seasonal, and annual distributions of aridity and its annual trend in the region of the Central and Southern Pannonian Basin (CSPB), which includes the territories of Hungary and Vojvodina (Northern Serbia), the De Martonne Aridity Index (DMAI) was used. The DMAI was originally calculated from a total of 78 meteorological stations with the maximum available time series of climatological data in three cases: 1931–2017 for Hungary; 1949–2017 for Vojvodina; and 1949–2017 for Hungary and Vojvodina jointly. The Palmer Drought Severity Index (PDSI) was used to control the DMAI results. Temperature and precipitation trends were also investigated to understand their effects on the aridity trend. Three aridity types are distinguished on the annual level, five on the seasonal level, and four on the monthly level. The annual aridity had no trends in all three periods. It seems that aridity can be considered a more stable climate indicator of climate change than the temperature, at least in the CSPB.
1. Introduction
In recent decades, the issues of climate variability and/or climate change have been at the centre of many scientific studies. Global climate change, caused by natural processes as well as anthropogenic factors, is a critical environmental issue that may affect the world during the 21st century [1,2,3,4]. Governments, the scientific community, as well as the media, and the public all over the world, have been paying increasing attention to the recent trends of global climate change [5]. Temperature [6] and precipitation change [7] and the rate of these changes are the most important determinants of the possible effects of climate change. For this reason, it is often more useful to analyze temperature and precipitation together. Parameters in which there is a mathematical quotient/ratio between precipitation or some values of air humidity and temperature are known as aridity indices and are used as a measure of aridity. According to the American Meteorological Society [8], aridity is the degree to which a climate lacks effective, life-promoting moisture, the opposite of humidity, in the climate sense of the term. An overview of the characteristics and classification of aridity indices are presented in the studies of Gavrilov et al. [9,10].
Two types of indices will be used in this study: the De Martonne Aridity Index (DMAI) [11] and the Palmer Drought Severity Index (PDSI) [12]. The first of these includes both temperature and precipitation and it can be calculated for different time scales, while the latter, as an already calculated index, will be used to control the calculated results. The DMAI has a formula for annual, seasonal and monthly values. There are no restrictions on the number of years necessary for the calculation. The DMAI is used worldwide in order to identify dry/humid climate conditions of the different regions [13,14,15,16,17,18,19]. This index showed particularly good results for the climate regions and climatic changes in the peripheral area of the Pannonian (Carpathian) Basin (PB): in the east in Romania [20] and in the south in Serbia [10,21,22] (Figure 1). It seems that the simplicity of the definition of the DMAI is well suited to describe the climate in the plain landscape of the PB and its associated mostly steppe and agricultural vegetation. It appears that previous applications of the recent DMAI have led to the application of this index for aridity research even during the Last Glacial Maximum [23] in the PB. Such circumstances indicated the need to apply the recent DMAI to as large an area of the PB as possible, in order to gain a more complete picture of the climate of this region. Therefore, this study can be considered as an appendix that should improve the knowledge of the climate in the PB by applying the DMAI.
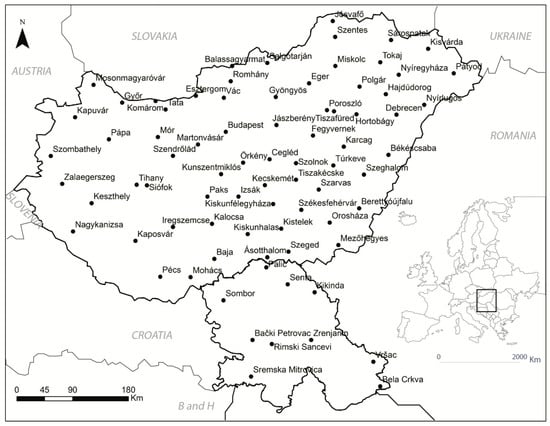
Figure 1.
Territories of Hungary and Vojvodina in the Central and Southern Pannonian Basin (CSPB), their locations in Europe, and meteorological stations used in this study.
The focus will be on investigating the DMAI in the area of the Central and Southern Pannonian (Carpathian) Basin (CSPB) in three territories (Figure 1): (1) Hungary (HUN), (2) Vojvodina (VOJ) (Northern Serbia), and (3) Hungary and Vojvodina together (HUN&VOJ) in three periods 1931–2017, 1949–2017, and 1949–2017, respectively. The PDSI was also utilized in this study on the territory of HUN&VOJ for the period 1920–2014. This index has been widely used to evaluate the hydro-climatic status of many areas [24], including the southeastern part of the PB [10]. For the CSPB, spatial and temporal distributions of the DMAI and the PDSI, and their trends will be analyzed.
The previous methodological considerations will be also carried out with temperatures and precipitation in the context of exploring the relationship of aridity, as a complex climatic parameter, which combines temperatures and precipitation as elementary climatic parameters. Thus, the obtained results can be considered representative as they will be a very good indicator of recent climate changes for a relatively uniform geomorphological area in the center of Europe, such as the CSPB investigated here. The analyzed period from 1931 to 2017, contains nearly three 30-year climatic cycles.
2. Study Areaand Data
2.1. Study Area
The study area is the CSPB that covers the territories of Hungary and Vojvodina with an area of (93.030 km2 + 21.506 km2) = 114.536 km2 (Figure 1). Since the complete study area in the recent period is not geophysically depicted as a whole, we will present basic geophysical characteristics for each of these territories.
2.1.1. Hungary
Hungary is a country in Central Eastern Europe, situated between 45°45′ N and 48°35′ N, approximately halfway between the equator and the North Pole. The country is located in the Carpathian Basin and more than half of its territory is represented by plains with altitudes below 200 m Above Mean Sea Level (AMSL) (Figure 1). Less than 2% of the area lies above 400 m AMSL. Hungary is situated in between four climatic zones, the oceanic climate to the west, polar to the north, the continental climate to the east, and the Mediterranean in the south. Hungary has a continental climate, with hot summers with low overall humidity levels but frequent rain showers and cold snowy winters [25]. The average annual temperature is 9.7 °C. The highest summer temperature (41.9 °C) was measured on 20 July 2007 at Kiskunhalas, while the lowest air temperature (−35.0 °C) was measured in Miskolc-Görömbölytapolca on 16 February 1940.
In the analyzed period, the average summer temperature in Hungary (calculated as the average temperature of June, July and August) is 20.5 °C while the average winter temperature (calculated as the average of December of the previous year, and January and February of the following year) is −0.1 °C. The average amount of precipitation reaches approximately 600 mm per year [26].
2.1.2. Vojvodina
Vojvodina is a lowland region where more than 60% of the area is covered by loess and loess-like sediments [27]. The loess-palaeosol sequences, situated in the Vojvodina region, represent the most detailed archive of climatic and environmental fluctuations during the Middle and Late Pleistocene on the European continent [28,29,30]. The most distinctive landforms of the Vojvodina region are two mountains: Fruška Gora Mountain (539 m AMSL), which is situated between the Danube and Sava rivers, and the Vršac Mountains (641 m AMSL), which are located in the south-eastern part of the region. Sandy and lower areas and alluvial plains are also present in some parts of the Vojvodina region [31].
The climate of Vojvodina is moderate continental, with cold winters, and hot, humid summers, with a wide range of extreme temperatures and a very irregular distribution of precipitation per month, which led to different values of calculated aridity types [21]. Surface winds blow from two prevailing opposite directions. The NW wind is cold and humid, and the SE wind is warm and dry. This contributes to the climate diversity of Vojvodina [31,32]. The mean annual surface air temperature is ~11 °C [5,33] and the annual amount of precipitation is approximately 606 mm [34].
2.2. Data
The aridity was calculated from 1931 to 2017 for 78 meteorological stations situated in the territories of Hungary and Vojvodina (Figure 1). These stations and data bases are operated by the Hungarian Meteorological Service [26] and the Republic Hydrometeorological Service of Serbia [35]. Data sets from each station were processed and analyzed in order to obtain the mean monthly values of surface air temperatures (Tm) and the monthly amount of precipitation (Pm). Correspondingly, the time series of Tm and Pm were used to calculate new time series for the DMAI, and to analyze the trends in all time series. Prior to this analysis, the data homogeneity on meteorological stations was investigated, according to the Alexandersson test [36]. This test is based on the assumption that the difference/ratio between temperature/precipitation amounts at the station being tested and the reference series is fairly constant in time. The correlation coefficients between the candidate stations and the reference stations were above 0.7, because of the relatively low and uniform flat terrain of the study area. The homogeneity analysis showed that the time series of the data for all stations are homogeneous.
The PDSI network is based on meteorological records of global land areas on 2.5° × 2.5° grid points available at the National Center for Atmospheric Research [37]. The gridded PDSI values were extracted for the period 1920–2014 from nine nearby grid points. As not all of these nine points are located on the territory of Hungary and Vojvodina, the interpolation of their values was used to create three new points on the required territory. In this manner two points were created in the central part of Hungary, and one in southern Vojvodina. Finally, as the entire area was well covered with points, the annual, seasonal, and monthly PDSI values were interpolated and presented.
3. Methods
3.1. The De Martonne Aridity Index
The annual (IaDM), seasonal (IsDM), and monthly (ImDM) values of the DMAI can be presented with the following generalized equation,
where, G, Pp, Tp is a triplet of parameters which take three sets of values: (i) 1, Pa, Ta; (ii) 4, Ps, Ts, and (iii) 12, Pm, Tm for the annual, seasonal, and monthly precipitation amounts (Pa, Ps, Pm) in mm and mean surface air temperatures (Ta, Ts, Tm) in °C for the same periods, respectively; C = 10 °C is the value of De Martonne’s constant. As can be seen from Equation (1), the DMAI has dimensions mm/°C, however in this study, the numerical value of the DMAI will be presented in the usual manner without mentioning of dimension. Humidity grows with the increase in values of IaDM, IsDM, and ImDM and vice versa. Finally, using Equation (1), the database is supplemented with time series of IaDM, IsDM, and ImDM for each meteorological station. The classification of the De Martonne aridity climate is given in Table 1 with a total of 7 types of aridity climate. As can be seen from Table 1, humidity increases with the increase of the DMAI values and vice versa.

Table 1.
The De Martonne Aridity Index (DMAI) classification.
From Equation (1), we can observe that the values from Table 1 are obtained only if the temperatures are greater than −10 °C. For temperatures that are exactly equal to −10 °C, infinite (singular point) DMAI values appear, and for temperatures lower than −10 °C, negative values of DMAI are obtained, which in both cases do not exist in Table 1. In order to avoid this obvious inconvenience, it will be considered that all DMAI values when Tm was equal to or lower than −10 °C belong to extremely humid (Table 1) climate. As the temperature decreases with unchanged precipitation, the DMAI value gets higher, which is interpreted as increased humidity. This is consistent with the notion of relative humidity, which increases with decreasing temperature with an unchanged amount of water vapor in the air. This discussion was required because cases with Tm values less than or equal to −10 °C occurred in this study.
3.2. The Palmer Drought Severity Index
The PDSI is a drought index based on a soil water balance equation [38], which measures the balance between moisture demand (evapotranspiration being driven by temperature) and moisture supply (precipitation). Monthly precipitation, potential and actual evapotranspiration, infiltration of water into a given soil zone, and runoff are parameters for the PDSI calculation. The related equation is as follows:
where Xt and Xt−1 are PDSI values for the actual and previous month, respectively. The terms p (0.897) and q (1/3) are coefficients or duration factors, demonstrating how sensitive the PDSI is to the monthly moisture anomaly Zt and the PDSI’s amount of autocorrelation. The classification of the Palmer drought climate is given in Table 2 with a total of 11 types of drought climate. Similar to the DMAI, humidity increases with the increase of the PDSI values and vice versa.

Table 2.
The Palmer Drought Severity Index (PDSI) climate classification.
3.3. Trend
Two statistical approaches were used to analyze the aridity, temperature, and precipitation trends. First, the tendency (trend) equation was calculated for each time series using linear interpolation [39]. This approach presents a very simple method for the interpretation of results. When the coefficient direction of the trend equation is greater than zero, less than or equal to zero, the sign of the trend is positive (increase), trend is negative (decrease) or there is no trend (no change), respectively.
In the second statistical approach, the Mann-Kendall (MK) test is used [40,41,42,43] for estimating all trends. According to the MK test, two hypotheses were tested: the null hypothesis, H0, that there is no trend in time series; and the alternative hypothesis, Ha, that there is a significant trend in the series, for a given α significance level [44]. Probability, p, in percent was calculated [10,41] to determine the level of confidence in the hypothesis. If the computed value p is lower than the chosen significance level α (e.g., α = 5%), the H0 (there is no trend) should be rejected, and the Ha (there is a significant trend) should be accepted. In case p is greater than the significance level α, the H0 (there is no trend) cannot be rejected.
The MK test is widely used in environmental sciences, for example to measure: temperature, precipitation, sunshine hours, cloud cover, relative humidity, and wind speed [45]; temperature and precipitation [10,41]; precipitation [46]; extreme temperatures [31,33,47,48]; hail [49,50,51]; aridity [9,10,21,22,52]; evapotranspiration [53,54]; and atmospheric deposition [55]. The MK test has widespread use because it is simple to apply, robust, and it can cope with missing values.
3.4. Software
The mean surface air temperatures, amount of precipitation, the DMAI, trend equations, and linear trend lines were computed and plotted for each time series, using the program Microsoft Excel (v. 2010, Seattle, WA, USA). Results were interpolated and mapped via the Kriging method, using ArcMap. For calculating the probability, p, and hypothesis testing, XLSTAT’s statistical analysis software was used [56]. PDSI/NCAR data was read (extracted) using the Python software with a custom script written for conversion of data to CSV (comma separated values) format files [57].
As the study area is very spacious for a simple Pearson correlation, the territories of Hungary and Vojvodina were divided into six regions by the Create Thiessen Polygons tool in ARCMAP 10.1., where input points were six PDSI points. Meteorological stations were joined into these regions to the closest PDSI point. The values of DMAI were again calculated on a monthly, seasonal and annual level, but in this case for every region separately. The Pearson correlation was investigated between the PDSI and the DMAI on an annual, seasonal, and monthly level, after adjusting the time scales to equal periods.
4. Results
4.1. The Distribution of Aridity
4.1.1. The Annual DMAI
The spatial distribution of the annual DMAI, IaDM, for both territories HUN in the period 1931–2017 and HUN&VOJ in the period 1949–2017 is shown in Figure 2.
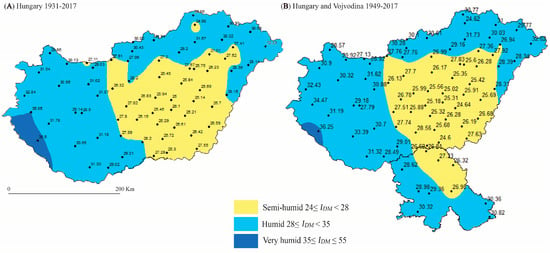
Figure 2.
The spatial distribution of the annual De Martonne Aridity Index for: (A) Hungary during the period 1931–2017 and (B) Hungary and Vojvodina jointly during the period 1949–2017.
During the longest period, the territory of Hungary is dominated by three types of aridity climate (Figure 2A). In the central part of the territory values of IaDM are low and there is the semi-humid type of aridity, while humid aridity is in the greater part of the rest of the territory, and very humid aridity only exists in a small area in the southwest. It seems that such spatial distribution aridity can be explained by the specific geophysical conditions that exist in Hungary. Hence, if the area is closer to the central part of CSPB the value of the aridity index is lower. Contrary to this, areas close to the mountain sources of moisture, for example at the southwest toward the Alps, at the east toward the Carpathian Mountains, and to the north towards the Tatra Mountains, the aridity index is higher. Two deviations that exist in the meteorological stations Komárom and Szendrólád, where there is a semi-humid type of aridity, require additional explanations that cannot be obtained from the analysis of existing data.
Figure 2B shows the aridity for territories of Hungary and Vojvodina together during the period from 1949 to 2017. As in the previous case, two types of aridity dominate in Hungary. The semi-humid type is present in the central part and in the surrounding of this central area; while very humid aridity is noted only at the station Nagykanizsa in the southwest. Here it appears that the distribution of semi-humid aridity in Hungary is homogeneous, and not fragmented as in the longer interval in Figure 2A. The configuration of aridity in Hungary is in some way naturally spread to Vojvodina. The semi-humid type from central Hungary continues south over the northeastern part of Vojvodina, while the humid type extends to the west and to the south of Vojvodina and it is close to the sources of mountain moisture from the Slavonian, Dinaric, and Rhodope mountains. There was a very similar annual distribution of aridity for Vojvodina during the period from 1949 to 2006 with only two types of aridity climate, the semi-humid and humid type, that data was also presented in the study of [21].
4.1.2. The Seasonal DMAI
The spatial distribution of the seasonal DMAI, IsDM, for HUN territory from 1931 to 2017 is shown in Figure 3. In this case, when analyzing only Hungary there is a greater variety of aridity types per season—a total of five, than there were per annual—a total of three. During the winter the whole territory is dominated by a very humid aridity climate type, with the exception of Paryod station, where the maximum aridity index value of 62.41 was calculated, which makes this station extremely humid during the winter. The spring becomes less wet when dominated by semi-humid climates on a larger part of the territory, and the perimeter of the territory towards mountainous sources of moisture reaches more humid types of climate. In the central part, there are two different aridity types in the surroundings of stations Mór and Szolnok, where even the Mediterranean type was registered. During the summer, the very dry Mediterranean climate of the Szolnok region spreads to the central part of Hungary, where it is dominant, while the rest of the territory has the same types of climate and in a similar arrangement as in the spring. Autumn becomes wetter, the Mediterranean climate disappears, and a very humid climate area appears to the southwest near the wet Alps.
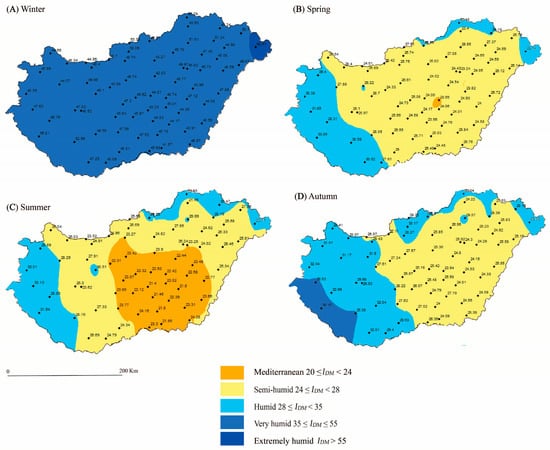
Figure 3.
The spatial distribution of the seasonal De Martonne Aridity Index for Hungary during the period 1931–2017; (A) winter, (B) spring (C) summer, and (D) autumn.
The mean seasonal distribution of the seasonal DMAI, IsDM, for both territories HUN&VOJ from 1949 to 2017 and HUN from 1931 to 2017 shows remarkable similarities. Only two types of climate can be found on a seasonal basis. Spring, summer, and autumn have a semi-humid climate, while winter is very humid. The average winter in Hungary from 1931 to 2017 has a larger value of humidity (47.5) then the average winter in both Hungary and Vojvodina from 1949 to 2017 (46.7). In the other three seasons the aridity varies from 25.7 in summer to 26.9 in autumn for Hungary. For the other case these values are 25.4 to 27.7, respectively.
The spatial distribution of the seasonal DMAI, IsDM, for the territory HUN&VOJ in the period 1949–2017 is shown in Figure 4. In this case, when analyzing aridity for territories of Hungary and Vojvodina together in the shorter period from 1949 to 2017, as in the previous case there are five types of aridity climate per season. Again as in the case of Hungary, during the winter the whole joint territory is dominated by a very humid aridity climate type, except in Paryod station. During the spring, it seems as the Mediterranean climate around station Szolnok spread to a larger part of central Hungary, while around this area a semi-humid type of climate is dominant, whereas in the border areas close to humid mountain regions a humid aridity climate type prevailed. During the summer, climatic conditions are very similar to spring, with the difference being that now the Mediterranean climate zone spreads through central Hungary and the northeastern part of Vojvodina, while the humid climate that extends to the northeastern part of Hungary and in Vojvodina occurs only on the southeast. Autumn becomes wetter, the area of the Mediterranean climate is decreasing and the humid climate is increasing in both regions, while in the southwestern part of Hungary the conditions are very humid.
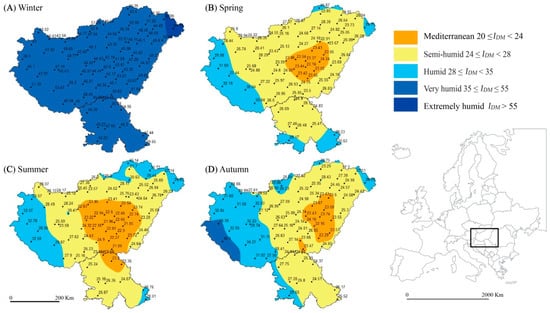
Figure 4.
The spatial distribution of the seasonal De Martonne Aridity Index for Hungary and Vojvodina jointly during the period 1949–2017; (A) winter, (B) spring (C) summer, and (D) autumn.
4.1.3. The Monthly DMAI
The monthly distribution of the mean monthly DMAI, ImDM, for both territories HUN and HUN&VOJ in periods 1931–2017 and 1949–2017 are shown in Figure 5. Our results show that Hungary and Vojvodina have similar values of monthly aridity when analyzed together (1949–2017), or separately (just Hungary, 1931–2017).
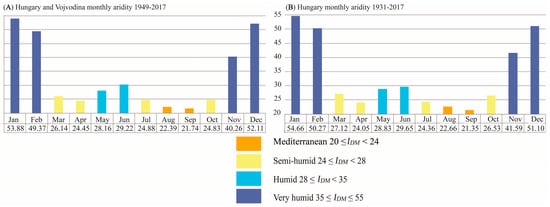
Figure 5.
The monthly distribution of the mean monthly De Martonne Aridity Index for: (A) Hungary and Vojvodina jointly duringthe period 1949–2017 and for(B) Hungary during the period 1931–2017.
In the first case (Figure 5A), November, December, January, and February have very humid aridity and ImDM of 40.26, 52.11, 53.88, and 49.37, respectively. The driest months are August and September when ImDM displays values of 22.39 and 21.74 respectively which indicates the Mediterranean type of climate. Semi-arid climate occurs in March, April, July, and October, when ImDM takes values of 26.14, 24.45, 24.88, and 24.83, respectively. During the remaining two months of May and June, a humid type of climate was determined with calculated ImDM values of 28.16 and 30.22, respectively.
Figure 5B shows mean monthly aridity only for Hungary in the period 1931–2017. It includes a longer period but a smaller area. However, all months fit into the same aridity categories as the ones shown in Figure 5A. The sole differences are the increased aridity values during November, January, February, March, May, August, and October, when the dissimilarity is the greatest. The period of World War II (according to the Hungarian database) shows extraordinary values. The Tm of January 1940 and 1942 at some stations were less or equal than −10°C, which, according to the discussion in Section 3.1, implies that this type of aridity can be considered as Extremely Humid (Table 1).
4.2. The Time-Spatial Distribution of PDSI
The spatial distribution of the annual and seasonal PDSI for the HUN&VOJ study area in the period 1920–2014 is shown in Figure 6 and Figure 7, respectively. It can be seen that both distributions are very similar and all PDSI values are negative. These values are somewhat lower (−0.57) in the central and southern parts of the study area (classified as Incipient Dry Spell (Table 2). However, towards the northeast, PDSI values are increasing (−0.13) and reach the Near Normal type of drought climate (Table 2). This suggests that the humidity increases from the south, where the plain dominates, towards the north, and especially towards the northeast, where the influence of the Carpathian Mountains is crucial for the increased humidity.
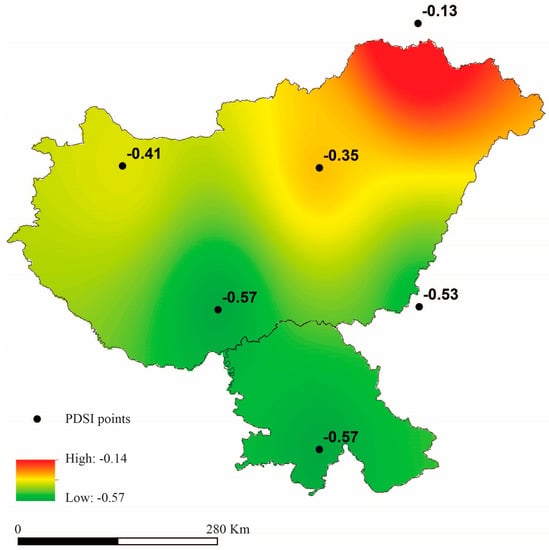
Figure 6.
The spatial distribution of the annual Palmer Drought Severity Index for Hungary and Vojvodina, presented jointly during the period 1920–2014.
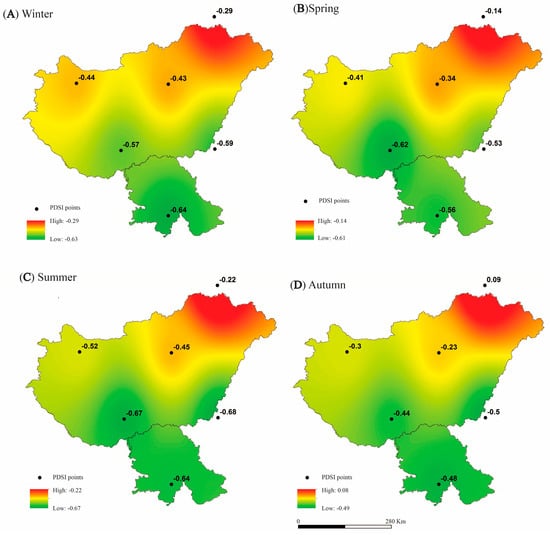
Figure 7.
The spatial distribution of the seasonal Palmer Drought Severity Index for Hungary and Vojvodina presented jointly during the period 1920–2014; (A) winter, (B) spring, (C) summer, and (D) autumn.
The monthly distribution of the mean monthly PDSI for Hungary and Vojvodina jointly in the period 1920–2014 is presented in Figure 8. It can be observed that, as in the spatial distribution, the PDSI values for all months range between two types of drought climate: Incipient Dry Spell and Near Normal. The lowest values are present in the winter and summer months. The minimum value is recorded in July, reaching –0.59. The month with the closest value to this is February (−0.55). The highest PDSI was in October (−0.25), followed by November (−0.26).
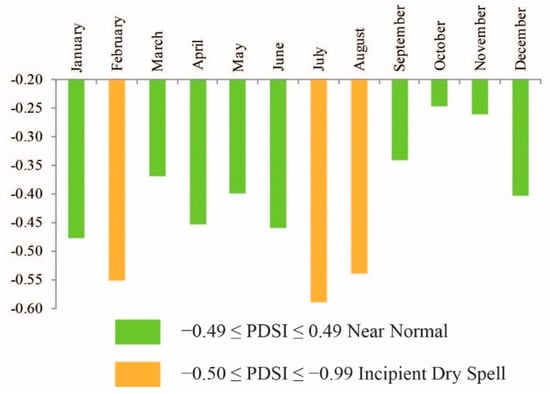
Figure 8.
The monthly distribution of the mean monthly Palmer Drought Severity Index for Hungary and Vojvodina presented jointly during the period 1920–2014.
4.3. Annual Distribution, Trends, and Correlations
4.3.1. The De Martonne Aridity Index
Figure 9 shows the distribution of the mean annual DMAI, IaDM, and its trend for the following territories: VOJ in the period 1949–2017, HUN&VOJ in the period 1949–2017, and HUN in the period 1931–2017. The results presented in Figure 10 show that the IaDM trend for VOJ is positive, and the IaDM trends for HUN&VOJ and HUN are negative. In all cases the calculated p values of the DMAI of 87.2%, 25.2%, and 24.4% are greater than α (5%), hence, according to the MK test, the null hypothesis, H0 (there is no trend), must be accepted (cannot be rejected). The risks of rejecting H0 while it is true are 87.2%, 25.2%, and 24.4%. The presented values, when referencing the mean annual DMAI, suggest that there are no changes in aridity for all three territories in the mentioned period.
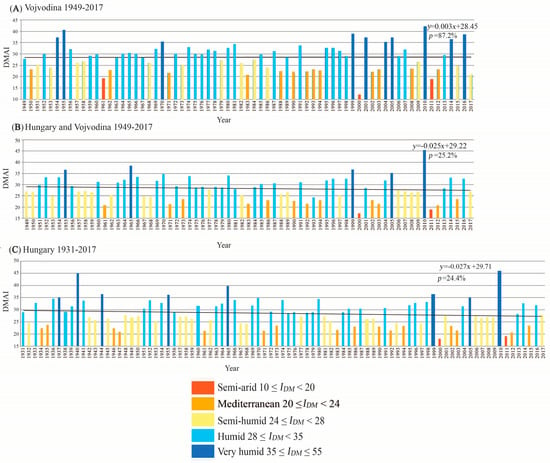
Figure 9.
The distribution of the mean annual De Martonne Aridity Index and its trend for: (A) Vojvodina during the period 1949–2017, (B) Hungary and Vojvodina presented jointly during the period 1949–2017, and (C) Hungary during the period 1931–2017. The aridity trend is presented with a solid, black line and trend equation, and p is the probability.
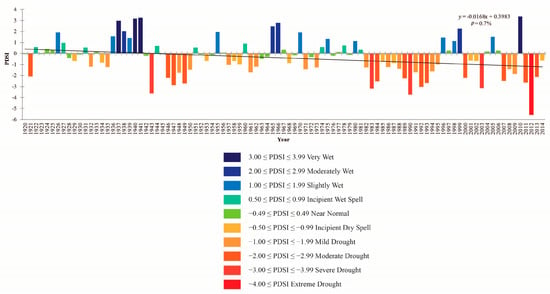
Figure 10.
The distribution and trend of the PDSI for Hungary and Vojvodina presented jointly during the period 1920–2014. The PDSI trend is presented with a solid, black line and trend equation, and p is the probability.
Based on the results presented in Figure 9A it can be concluded that in the 21st century there are great jumps in IaDM from semi-arid (12.1) and Mediterranean years to humid and even very humid years, which was not the case in the past. The year 2010 stands out for being the most humid (42.2) followed by 1955, 2016, and 2014, when Serbia experienced disastrous floods [58].
Figure 9B represents the same period but for both Vojvodina and Hungary included in the calculation. While some jumps from very humid years to semi-arid (for example 1999 to 2000, 2010 to 2011) can still be observed, it is noticeable that the values of IaDM are now considerably lower with (mean value 28.34). Some years with extreme precipitation in Vojvodina now belong to the humid category. The Pearson correlation shows the value of 0.85 between Figure 9A and Figure 9B. This implies that there are some minor differences in the aridity trend when Hungary is included.
4.3.2. Palmer Drought Severity Index
The distribution of the mean annual PDSI and its trend for the territory HUN&VOJ in the period 1920–2014 is presented in Figure 10; it shows that the PDSI trend is negative. The computed p value of PDSI is 0.7%, which is less than α (5%), the alternative hypothesis, Ha (there is a significant trend) must be accepted according to the MK test. The presented values, when referencing the mean annual PDSI, suggest that there is an increase in drought in the investigated 95-year period.
Even though from Figure 10 it appears that the PDSI varies around 0.0, the mean value for the whole period is actually negative (−0.4). The extreme positive values were present during World War II, reaching 3.2 in 1940 and 1941. Similar value occurred in 2010, when the maximum of 3.5 for the entire analyzed period was recorded. Longer period of negative values was present from the beginning of eighties to the middle of the nineties of the last century. The minimum value, which indicates extreme drought occurred in 2012, when the value was −5.5.
As the regions of the study area were created (see Section 3.4.) the Pearson correlation index was investigated between the DMAI and the PDSI. All the correlations were positive throughout the study area, on monthly, seasonal, and annual level. The highest annual correlation was 0.75 in the northern part of Hungary, while the correlations at the south were the smallest (0.62). The seasonal Pearson correlation in spring has the highest correlation, of 0.61 in the west. The summer has the highest correlation in all of the regions, reaching a value of 0.81 in the northeast region. The autumn correlation goes up to 0.54 in the northeast. The winter has the lowest correlation of all the seasons, with maximum and minimum values of 0.31 and 0.18, respectively. Monthly correlation between the DMAI and PDSI shows that June, July, and August have the highest values in all of the six investigated regions (above 0.50), while January and February have the lowest values (below 0.30).
4.3.3. Temperature and Precipitation
The distribution of the mean annual temperatures, Ta, and mean annual precipitation, Pa, and their trends for the following territories: VOJ in the period 1949–2017, HUN in the period 1931–2017, and HUN&VOJ in the period 1949–2017 are presented in Figure 11. MK test was performed, and the final MK results are summarized in Table 3. The presented results of the MK tests show that out of six tested cases, trends exist in only two cases, in the mean annual temperatures for the territories of VOJ and HUN&VOJ, while in the remaining four cases the trend does not exist. It is interesting to note that the trends do not exist for both temperature and precipitation for Hungary over a longer time period (1931–2017).
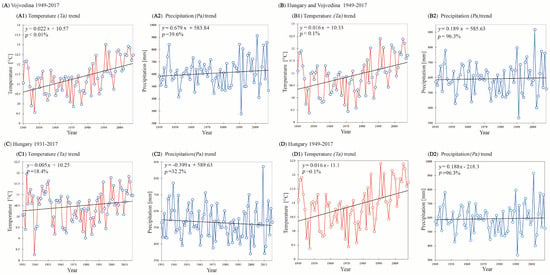
Figure 11.
The distributions and trends of the mean annual temperature, Ta, and the mean annual amount precipitation, Pa, for (A) Vojvodina during the period 1949–2017, (B) Hungary and Vojvodina jointly during the period 1949–2017, (C) Hungary during the period 1931–2017, and (D) Hungary during the period 1949–2017, respectively. Trends of the Ta and the Pa are presented with solid, black lines and trend equations, and p are probabilities.

Table 3.
Summary results of Mann-Kendall (MK) tests for temperature and precipitation trends for Vojvodina in the period 1949–2017, Hungary in the period 1931–2017; and Hungary and Vojvodina jointly in the period 1949–2017.
In Figure 11 it can be seen that the mean annual temperatures are 11.3 °C and 10.5 °C, with the extremes ranging from 9.6 °C (1953) to 13.0 °C (2000) and 8.3 °C (1940) to 11.9 °C (1934), for the territories VOJ and HUN, respectively. Interestingly, both extreme temperatures for Hungary were reached during the fourth decade of the 20th century. The difference in temperatures between Vojvodina and Hungary, as territories belonging to the same geomorphological area (CSPB), is mostly a consequence of the meridionality of these territories. Figure 11D is added to show whether the shorter period of analyzed years will result in a difference of temperature or precipitation for the territory of Hungary. It is important to note that in this case, the trend in temperature is present. The mean annual precipitation for both territories reaches approximately 600 mm, which is determined by the similar frequency and behavior of the Polar Front as the dominant atmospheric circulation for both territories.
5. Discussions
The basis of this study was aridity research for the territories of Hungary and Vojvodina, both of which belong to the region of the CSPB. This region is unique in that it is mostly flat, intersected by rivers, and surrounded by the most massive and highest mountains in Europe. As such, it represents a uniform geomorphological entity, where the state of aridity is perhaps its most important climatic characteristic. The greatest importance for this research was the ability to jointly process historical meteorological data for Hungary and Vojvodina from a total of 78 stations for the relatively long periods 1931–2017 and 1949–2017, respectively. The DMAI was used to study aridity mainly because it proved to be a very good parameter for its assessment in the CSPB region. The geographical distribution of aridity shows a clear regularity in behavior. The DMAI has the smallest values in the central parts of the CSPB, and it increases for both annual and seasonal values towards the periphery as the stations are closer to the surrounding high mountains. The DMAI is also lowest during the summer months and warmer seasons and increases toward the colder months and seasons. Trend analysis showed that the DMAI does not have a significant trend, which is why it can be considered that the mean annual aridity of the CSPB remained unchanged in both investigated periods of 87 years and 69 years, which has already been confirmed in the studies of Hrnjak et al. [10] and Gavrilov et al. [21], although for smaller areas of the CSPB.
The PDSI taken from the NCAR database was used to control DMIA results, which is why it can be considered as an independent parameter in relation to the DMIA. The PDSI could not provide a subtle depiction of drought as shown by the DMIA, as it was given only at six grid points. The geographical distribution of the PDSI almost coincides with the DMIA. In the center of the CSPB, the drought is greatest, and towards the periphery it decreases. However, the trends are not consistent. PDSI shows a declining trend for the CSPB in the period 1920–2014, which means that drought has increased. For comparison, in the study of [10] for the smaller investigated area of CSPB these two indices had the same trend sign. It seems that this difference is primarily a consequence of the difference in the length of the time series. For this purpose, both time series were shortened to the maximum length in the common/control period 1949–2014. The trend results are shown in Figure 12. As can be seen in both cases, no statistically significant trends exist in CSPB.
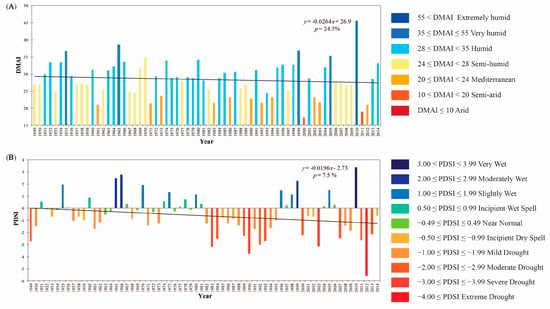
Figure 12.
The distribution of the mean annual (A) the DMAI and (B) the PDSI, and their trends forthe CSPB (Hungary and Vojvodina jointly) during the control period 1949–2014. Trends of the DMAI and the PDSI are presented with solid, black lines and trend equations, and p is probability.
Long series of temperatures and precipitation were used to construct and assess trends. For precipitation, it was concluded that there were no trends in both series of 87 years and 69 years, while the temperature did not have a trend for a longer series. This indicates that the increase in temperature in the recent period does not have to be recorded in every sub-period and in every geographical area.
6. Conclusions
This study shows how multiple factors can control the final results and conclusions about climate change in the Central and Southern Pannonian Basin. It is not sufficient to make statements on this topic by solely using one climatic parameter, such as temperature. The main intention of this paper was to investigate the aridity in Hungary and Vojvodina (north province of Serbia) on the basis of a very rich and dense network of observed meteorological data of long time series. The use of the DMAI, as an independent climatic factor very similar to aridity, was supposed to enable the control of aridity research, while the analysis of annual changes in temperature and precipitation over the same time period was intended to prove their compliance to aridity behavior.
From the tasks set in this way, two general conclusions can be made. Climate research using different methods, of the same or similar content, may not give the same exact results. For example, the DMAI and the PDSI gave similar geographical distributions of aridity and drought, but their annual trends were different; the DMAI had no trend, while the PDSI had a negative trend. It seems that it was a consequence of different lengths of the time series; the DMAI was 87 years long, and the PDSI series was seven years longer while in the control case where a series of the same lengths were used, the same trend sign was obtained for both indices. Perhaps this difference was influenced by a large difference in spatial data density, where the DMAI was derived from 78 grid data points (station) and the PDSI from only 6 grid data points. It should be noted that the results of climate research can be significantly influenced not only by climate data but also by the method of climate research.
In all three cases of the DMAI, there was no significant aridity trend, both for the longer time series of 87 years and for the shorter series of 69 years.While the temperature trend existed only for the shorter series, the precipitation trend did not exist throughout the entire study. It appears that the change in aridity trend cannot be the result of only a change in temperature trends. In other words, a change in temperature trends is not sufficient, to trigger a change in the aridity trend by itself. It appears that some critical values in the temperature trend and/or the precipitation trend exist, potentially leading to a change in the aridity trend, which has already been observed in the previous work of Gavrilov et al. [10].
Author Contributions
M.B.G., M.G.R., G.S., G.M. and S.B.M. conceived and designed the study; K.F., B.B. (Biljana Basarin), P.K., T.L. and B.B. (Balázs Benyhe) performed preprocessing of climatological data; M.G.R. and M.B.G. performed processing of climatological data; G.G., M.G.R. and M.B.G. performed accessing, preprocessing, and processing of NCAR data; M.G.R., M.B.G. and G.G. graphically presented the data; M.B.G., M.G.R., G.G., D.G., Y.S. and Z.M.P. analyzed the data; M.B.G., M.G.R., G.G., Z.M.P. and S.B.M. wrote the paper. All authors have read and agreed to the published version of the manuscript.
Funding
This research was supported by Project 114-451-2080/2017 of the Provincial Secretariat for Science and Technological Development, Vojvodina Province. Part of the research was supported by the HUSRB/1602/11/0057—WATER@RISK—Improvement of drought and excess water monitoring for supporting water management and mitigation of risks related to extreme weather conditions. Part of the research was supported by the Ministry of Education, Science and Technological Development of the Republic of Serbia (Grant No. 451-03-68/2020-14/200125) and H2020-WIDESPREAD-05-2020—Twinning: ExtremeClimTwin.
Conflicts of Interest
The authors declare no conflict of interest.
References
- Hulme, M.; Barrow, E.M.; Arnell, N.W.; Harrisson, P.A.; Johns, T.C.; Downing, T.E. Relative impacts of human-induced climate change and natural climate variability. Nature 1999, 397, 688–691. [Google Scholar] [CrossRef]
- Kenny, G.J.; Ye, W.; Flux, T.; Warrick, R.A. Climate variations and New Zealand agriculture: The CLIMPACTS system and issues of spatial and temporal scale. Environ. Int. 2001, 27, 189–194. [Google Scholar] [CrossRef]
- Baltas, E.; Mimikou, M. Climate change impacts on the water supply of Thessaloniki. Int. J. Water Resour. Dev. 2005, 21, 341–353. [Google Scholar] [CrossRef]
- Intergovernmental Panel on Climate Change (IPCC). Global Warming of 1.5 °C; World Meteorological Organization: Geneva, Switzerland, 2018. [Google Scholar]
- Gavrilov, M.B.; Marković, S.B.; Mladjan, D.; Zarić, M.; Pešić, A.; Janc, N.; Todorović, N. Global Warning—Between the Myth and Reality. In Proceedings of the International Scientific Conference “Archibald Reiss Days”, Zemun, Serbia, 10–11 March 2016; Kolarić, D., Ed.; Academy of Criminalistic And Police Studies: Belgrade, Serbia, 2016. [Google Scholar]
- Climatic Research Unit. Global Average Temperature Change 1856–2003. Available online: https://crudata.uea.ac.uk/cru/data/temperature/ (accessed on 20 March 2020).
- Diaz, H.F.; Bradley, R.; Eischeid, J.K. Precipitation fluctuation over global land areas since the late 1800s. J. Geophys. Res. 1989, 94, 1195–1210. [Google Scholar] [CrossRef]
- American Meteorological Society, Glossary of Meteorology. Available online: http://glossary.ametsoc.org/wiki/Aridity (accessed on 20 March 2020).
- Gavrilov, M.B.; Lukić, T.; Janc, N.; Basarin, B.; Marković, S.B. Forestry Aridity Index in Vojvodina, North Serbia. Open Geosci. 2019, 11, 367–377. [Google Scholar] [CrossRef]
- Gavrilov, M.B.; An, W.; Xu, C.; Radaković, M.G.; Hao, Q.; Yang, F.; Guo, Z.; Perić, Z.; Gavrilov, G.; Marković, S.B. Independent Aridity and Drought Pieces of Evidence Based on Meteorological Data and Tree Ring Data in Southeast Banat, Vojvodina, Serbia. Atmosphere 2019, 10, 586. [Google Scholar] [CrossRef]
- De Martonne, E. Traité de géographie physique, Vol. I: Notions generales, climat, hydrographie. Geogr. Rev. 1925, 15, 336–337. [Google Scholar] [CrossRef]
- Palmer, W.C. Meteorological Drought; Research Paper No 45; Office of Climatology, Weather Bureau: Washington, DC, USA, 1965; p. 58. [Google Scholar]
- Baltas, E. Spatial distribution of climatic indices in northern Greece. Meteorol. Appl. 2007, 14, 69–78. [Google Scholar] [CrossRef]
- Deniz, A.; Toros, H.; Incecik, S. Spatial variations of climate indices in Turkey. Int. J. Climatol. 2011, 3, 394–403. [Google Scholar] [CrossRef]
- Moral, F.J.; Paniagua, L.L.; Rebollo, F.J.; García-Martín, A. Spatial analysis of the annual and seasonal aridity trends in Extremadura, southwestern Spain. Theor. Appl. Climatol. 2017, 130, 917–932. [Google Scholar] [CrossRef]
- Nistor, M.M. Spatial distribution of climate indices in the Emilia-Romagna region. Meteorol. Appl. 2016, 23, 304–313. [Google Scholar] [CrossRef]
- Bačević, N.; Vukoičić, D.; Nikolić, M.; Janc, N.; Milentijević, N.; Gavrilov, M.B. Aridity in Kosovo and Metohija, Serbia. Carpathian J. Earth Environ. Sci. 2017, 12, 563–570. [Google Scholar]
- Gebremedhin, M.A.; Kahsay, G.H.; Fanta, H.G. Assessment of spatial distribution of aridity indices in Raya valley, northern Ethiopia. Appl. Water Sci. 2018, 8, 217–224. [Google Scholar] [CrossRef]
- Derdous, O.; Tachi, S.E.; Bouguerra, H. Spatial distribution and evaluation of aridity indices in Northern Algeria. Arid Land Res. Manag. 2020, 1–14. [Google Scholar] [CrossRef]
- Croitoru, A.E.; Piticar, A.; Imbroane, A.M.; Burada, D.C. Spatiotemporal distribution of aridity indices based on temperature and precipitation in the extra-Carpathian regions of Romania. Theor. Appl. Climatol. 2013, 112, 597–607. [Google Scholar] [CrossRef]
- Hrnjak, I.; Lukić, T.; Gavrilov, M.B.; Marković, S.B.; Unkašević, M.; Tošić, I. Aridity in Vojvodina, Serbia. Theor. Appl. Climatol. 2014, 115, 323–332. [Google Scholar] [CrossRef]
- Radaković, M.G.; Tošić, I.; Bačević, N.; Mladjan, D.; Gavrilov, M.B.; Marković, S.B. The analysis of aridity in Central Serbia from 1949 to 2015. Theor. Appl. Climatol. 2018, 133, 887–898. [Google Scholar] [CrossRef]
- Ludwig, P.; Gavrilov, M.B.; Radaković, M.G.; Marković, S.B. Malaco Temperature Reconstructions and Numerical Simulation of Environmental Conditions in the southeastern Carpathian Basin during the Last Glacial Maximum. J. Quat. Sci. 2020. submitted for publication. [Google Scholar]
- Alley, W. The Palmer Drought Severity Index: Limitations and Assumptions. J. Clim. Appl. Meteorol. 1984, 23, 1100–1109. [Google Scholar] [CrossRef]
- Szelepcsényi, Z.; Breuer, H.; Acs, F.; Kozma, I. Biofizikai klímaklasszifikációk. 2. rész: Magyarországialkalmazások [Biophysical Climate Classifications. Part 2: Applications for Hungary]. Légkör 2009, 54, 18–23. [Google Scholar]
- Hungarian Meteorological Service (HMS). HMS Database. 2017. Available online: http://www.met.hu/en/idojaras (accessed on 20 March 2020).
- Marković, S.B.; Bokhorst, M.; Vandenberghe, J.; Oches, E.A.; Zöller, L.; McCoy, W.D.; Gaudenyi, T.; Jovanović, M.; Hambach, U.; Machalett, B. Late Pleistocene loess-paleosol sequences in the Vojvodina region, North Serbia. J. Quat. Sci. 2008, 23, 73–84. [Google Scholar] [CrossRef]
- Marković, S.B.; Hambach, U.; Catto, N.; Jovanović, M.; Buggle, B.; Machalett, B.; Zöller, L.; Glaser, B.; Frechen, M. The middle and late Pleistocene loess-paleosol sequences at Batajanica, Vojvodina, Serbia. Quat. Int. 2009, 198, 255–266. [Google Scholar] [CrossRef]
- Marković, S.B.; Hambach, U.; Stevens, T.; Kukla, G.J.; Heller, F.; William, D.; McCoy, W.D.; Oches, E.A.; Buggle, B.; Zöller, L. The last million years recorded at the Stari Slankamen loess-palaeosol sequence: Revised chronostratigraphy and long-term environmental trends. Quat. Sci. Rev. 2011, 30, 1142–1154. [Google Scholar] [CrossRef]
- Marković, S.B.; Stevens, T.; Kukla, G.J.; Hambach, U.; Fitzsimmons, K.E.; Gibbard, P.; Buggle, B.; Zech, M.; Guo, Z.T.; Hao, Q.Z.; et al. The Danube loess stratigraphy—New steps towards the development of a pan-European loess stratigraphic model. Earth Sci. Rev. 2015, 148, 228–258. [Google Scholar] [CrossRef]
- Gavrilov, M.B.; Marković, S.B.; Schaetzl, R.J.; Tošić, I.A.; Zeeden, C.; Obreht, I.; Sipos, G.; Ruman, A.; Putniković, S.; Emunds, K.; et al. Prevailing surface winds in Northern Serbia in the recent and past time periods; modern- and past dust deposition. Aeolian Res. 2018, 31, 117–129. [Google Scholar] [CrossRef]
- Tošić, I.; Gavrilov, M.B.; Marković, S.B.; Ruman, A.; Putniković, S. Seasonal prevailing surface winds in Northern Serbia. Theor. Appl. Climatol. 2018, 131, 1273–1284. [Google Scholar] [CrossRef]
- Gavrilov, M.B.; Marković, S.B.; Korać, V.; Jarad, A. The analysis of temperature trends in Vojvodina (Serbia) from 1949 to 2006. Therm. Sci. 2015, 19, 339–350. [Google Scholar] [CrossRef]
- Tošić, I.; Hrnjak, I.; Gavrilov, M.B.; Unkašević, M.; Marković, S.B.; Lukić, T. Annual and seasonal variability of precipitation in Vojvodina, Serbia. Theor. Appl. Climatol. 2014, 117, 331–341. [Google Scholar] [CrossRef]
- Republic Hydrometeorological Service of Serbia (RHSS). RHSS Database. 2017. Available online: http://www.hidmet.gov.rs/ciril/meteorologija/klimatologija_godisnjaci.php (accessed on 20 March 2020).
- Alexandersson, H. A homogeneity test applied to precipitation data. J. Climatol. 1986, 6, 661–675. [Google Scholar] [CrossRef]
- National Center for Atmospheric Research (NCAR)—Climate Data Guide. Available online: http://www.cgd.ucar.edu/cas/catalog/climind/pdsi.html (accessed on 22 March 2020).
- Dai, A.; Trenberth, K.E.; Qian, T. A global dataset of Palmer Drought Severity Index for 1870–2002: Relationship with soil moisture and effects of surface warming. J. Hydrometeorol. 2004, 5, 1117–1130. [Google Scholar] [CrossRef]
- Draper, N.R.; Smith, H. Applied Regression Analysis; John Wiley and Sons: New York, NY, USA, 1966. [Google Scholar]
- Kendall, M.G. New Measure of Rank Correlation. Biometrika 1938, 30, 81–93. [Google Scholar] [CrossRef]
- Karmeshu, N. Trend Detection in Annual Temperature & precipitation Using the Mann Kendall Test—A Case Study to Assess Climate Change on Select States in the Northeastern United States. Master’s Thesis, University of Pennsylvania, Philadelphia, PA, USA, 2012. [Google Scholar]
- Mann, H.B. Non-parametric Tests Against Trend. Econometrica 1945, 13, 245–259. [Google Scholar] [CrossRef]
- Gilbert, R.O. Statistical Methods for Environmental Pollution Monitoring; Van Nostrand Reinhold Company Inc.: New York, NY, USA, 1987. [Google Scholar]
- Onoz, B.; Bayazit, M. The Power of Statistical Tests for Trend Detection. Turk. J. Eng. Environ. Sci. 2003, 27, 247–251. [Google Scholar]
- Marin, L.; Birsan, M.V.; Bojariu, R.; Dumitrescu, A.; Micu, D.M.; Manea, A. An Overview of annual climatic changes in Romania: Trends in air temperature, precipiutation, sunshine hours, cloud cover, relative humidity and wind speed duration the 1961–2013 period. Carpathian J. Earth Environ. Sci. 2014, 9, 253–258. [Google Scholar]
- Çiçek, İ.; Duman, N. Seasonal and annual precipitation trends in Turkey. Carpathian J. Earth Environ. Sci. 2015, 10, 77–84. [Google Scholar]
- Serra, C.; Burgueño, A.; Lana, X. Analysis of maximum and minimum daily temperatures recorded at Fabra Observatory (Barcelona, NE Spain) in the period 1917–1998. Int. J. Climatol. 2001, 21, 617–636. [Google Scholar] [CrossRef]
- Gavrilov, M.B.; Tošić, I.; Marković, S.B.; Unkašević, M.; Petrović, P. The analysis of annual and seasonal temperature trends using the Mann-Kendall test in Vojvodina, Serbia. Időjárás 2016, 120, 183–198. [Google Scholar]
- Gavrilov, M.B.; Lazić, L.; Pešić, A.; Milutinović, M.; Marković, D.; Stanković, A.; Gavrilov, M.M. Influence of Hail Suppression on the Hail Trend in Serbia. Phys. Geogr. 2010, 31, 441–454. [Google Scholar] [CrossRef]
- Gavrilov, M.B.; Lazić, L.; Milutinović, M.; Gavrilov, M.M. Influence of Hail Suppression on the Hail Trend in Vojvodina, Serbia. Geogr. Pannonica. 2011, 15, 36–41. [Google Scholar] [CrossRef]
- Gavrilov, M.B.; Marković, S.B.; Zorn, M.; Komac, B.; Lukić, T.; Milošević, M.; Janićević, S. Is hail suppression useful in Serbia?—General review and new results. Acta Geogr. Slov. 2013, 53, 165–179. [Google Scholar] [CrossRef]
- Ahmed, K.; Shahid, S.; Wang, X.-J.; Nawaz, N.; Khan, N. Spatiotemporal Changes in Aridity of Pakistan during 1901–2016. Hydrol. Earth Syst. Sci. 2019, 23, 3081–3096. [Google Scholar] [CrossRef]
- Tabari, H.; Marofi, S.; Aeini, A.; Talaee, P.H.; Mohammadi, K. Trend analysis of reference evapotranspirationin the western half of Iran. Agric. For. Meteorol. 2011, 151, 128–136. [Google Scholar] [CrossRef]
- Tabari, H.; Talaee, P.H.; Nadoushani, S.M.; Willems, P.; Marchetto, A. A survey of temperature and precipitation based aridity indices in Iran. Quat. Int. 2014, 345, 158–166. [Google Scholar] [CrossRef]
- Drapela, K.; Drapelova, I. Application of Mann-Kendall test and the Sen’s slope estimates for trend detection in deposition data from BílýKříž (Beskydy Mts., the Czech Republic) 1997–2010. Beskydy 2011, 4, 133–146. [Google Scholar]
- Statistical Software & Data Analysis Add-on for Excel | XLSTAT. Available online: https://www.xlstat.com/en/ (accessed on 17 March 2019).
- NetCDF4 Module Version 1.5.4. Available online: https://unidata.github.io/netcdf4-python/netCDF4/index.html (accessed on 14 February 2019).
- Gavrilov, M.B.; Marković, S.B.; Mladjan, D.; Subošić, D.; Zarić, M.; Pešić, A.; Janc, N.; Nikolić, M.; Valjarević, A.; Bačević, N. Extreme floods in Serbia occurring simultaneosly with the high water levels and heavy rains- Case Study. In Proceedings of the International Scientific Conference “Archibald Reiss Days”, Zemun, Serbia, 3–4 March 2015; Academy of Criminalistic And Police Studies in Belgrade: Beograd, Serbia, 2015; Volume 1, pp. 25–36. [Google Scholar]
Publisher’s Note: MDPI stays neutral with regard to jurisdictional claims in published maps and institutional affiliations. |
© 2020 by the authors. Licensee MDPI, Basel, Switzerland. This article is an open access article distributed under the terms and conditions of the Creative Commons Attribution (CC BY) license (http://creativecommons.org/licenses/by/4.0/).