Abstract
This study examines long-term spatial and temporal trends of drought characteristics based on the Standardized Precipitation Index at three different time scales (3, 6, and 12 months) over Zambia from 1981 to 2017. Drought characteristic conditions such as duration, severity, and intensity at monthly, seasonal, and annual levels were analyzed to investigate the drought patterns over Zambia. The results show a significant increase in drought events over the southwestern regions and a decrease over the northeastern regions. It is in this regard that two stations from different locations (southwest and northeast) were analyzed. The results show increasing trends of drought over Sesheke (southwest) and decreasing trends over Kasama (northeast). More drought impacts are felt over southern compared to northern areas, which poses a serious concern to both agriculture and hydrological industries over the drought-prone areas of Southern Zambia. However, the analysis further shows that droughts were more intense, persistent, and severe over the southwest, while moderate droughts were found in some few areas of Northeast Zambia. The Mann–Kendall test trend and slope indicated that both annual and seasonal drought have increased. However, drought increment at an annual level shows a low magnitude as compared to the seasonal level. This suggested the importance of evaluating drought at an interannual and seasonal time scale over Zambia. Specifically, the drought increased determinedly before 2010 and became erratic between 2010 and 2017 with considerable regional variation. Zambia experienced moderate to severe droughts during 1991–1992, 1994–1995, 2006–2005, and 2015–2016, which resulted in serious damages to the environment and society. According to the findings of this study, it is suggested that the implications of drought can be managed by creating strategies and adaptation measures.
1. Introduction
Drought remains one of the major complex natural phenomena affecting the environment and economy at global, regional, and local levels []. Within the agricultural sector, drought is possibly the most important climatic challenge and has major impacts on both urban and rural livelihoods []. In the midst of climate change [], by the end of the 21st century, [,] projected the global intensity and frequency of drought to increase with an intensification in radiative forcing. The changes will lead to the damaging impacts on natural ecosystems, causing shortages of basic needs such as food and water and a high rate of wildfires because of the increase in a heatwave []. Statistical relationships between climate change and drought occurrence have been recognized []. Increased evapotranspiration contributes to the warming of the climate, which may lead to more noticeable droughts []. Some studies have pointed out that below-normal precipitation is the main driver of drought [,] because of its dependence on climate-driven sectors such as rainfed agriculture and other services provided by ecosystems. Southern Africa is vulnerable to climate change-induced drought [].
Drought has an impact on many aspects of human activities, the environment, and the ecosystem, resulting in a loss of human lives and economic damage [,]. Zambia, as part of Southern Africa, has been experiencing the impacts of drought—for example, the recent low levels of water in Lake Kariba [] and Victoria Falls. Victoria Falls is the massive curtain of waters in Southern Africa that borders Zambia and Zimbabwe, and it is the biggest waterfall sequence often ranked as one of the seven wonders of the natural world; the falls are a prime tourist destination [], while Lake Kariba is the world largest man-made lake. Both Lake Kariba and Victoria Falls significantly contribute to the development of Zambia through hydro-electricity, agriculture, tourism, and fisheries activities []. The drying up has attracted regional and international attention and caused concern to policymakers []. Consistently over most of the years that Zambia has experienced drought, dangerously low water levels have been observed over Zambezi River, which flows into Victoria Falls and Lake Kariba, which consequently has affected socio-economic activities in both Zambia and Zimbabwe []. These drought events have been closely associated with El Niño Southern Oscillation (ENSO), which has a direct influence on rainfall patterns in most parts of the Southern Africa region with the negative phase being attributed to drought conditions and the positive phase being attributed to above normal rainfall amounts [,].
Teleconnection patterns associated with ENSO have been linked to the modulation of climate over Southern Africa, including Zambia. The impacts of drought in the region are strengthened during El Niño and climate change according to [] and the Oxfam report. The equatorial Eastern and Central Pacific’s large-scale warming is frequently associated with drought over much of Southern Africa [,,,]. It has been observed that the ENSO signal in Southern Africa rainfall is strongest when it is communicated through the Atlantic and Indian Oceans []. Therefore, in Zambia, these ENSO-rainfall associations indicate that below-average rainfall is experienced during warm ENSO (El Niño) events resulting in droughts, while above-average rainfall is experienced vice versa during cold ENSO (La Niña) events. However, this is not always the case []. The impacts of El Niño affect Zambia differently, in that the increase of dry spells and droughts frequency are more observed over Southern Zambia during the El Niño phase, reflecting the influence of its climate mode [,].
Researchers have focused on the dynamics of drought and vulnerability impacts in relation to establishing mitigation measures []. Despite the efforts made by the World Meteorological Organization (WMO) [], there is need for more understanding of drought duration, intensity, and severity of occurrence from one place to another because it has been a unique phenomenon as compared to other natural disasters []. For instance, drought varies from multiple dynamic dimensions, including severity and duration. This makes it difficult for scientists and policymakers to determine the exact timing of its start or the end of either meteorological, agricultural, or hydrological drought events []. In particular, Zambia is suffering the worst drought it has had for several decades; diminished and late rainfall combined with long-term increases in temperatures have jeopardized the food security and energy supplies to millions of people. However, understanding changes in precipitation can be the key value that can lead to understanding the drought impacts on the ecosystem of the region. Furthermore; changes in seasonal and annual rainfall are considered to be the critical indicators of drought. Therefore, detecting past trends of drought has become a core area of research in recent years. The accurate trend detection of drought can play a vital role in regional climate assessment and water resource management. Statistical techniques could be extended to analyze the trend of drought duration and severity. Until now, various statistical methods have been developed and employed for detection of drought trends, duration, and severity.
The WMO has recommended the use of drought indices for assessing and monitoring drought; among them is the Standardized Precipitation Evapotranspiration Index (SPEI), which is designed to account for both precipitation and Potential Evapotranspiration (PET) to determine drought. It is simply an extension of the widely used Standardized Precipitation Index (SPI), which can capture the impacts of temperature increase on water demand, unlike SPI. Based on the probability concept, SPI index has been widely accepted [,,,], and it is less complex to calculate. This index only considers precipitation for its computations. It is more comparable across regions with a different climate than the Palmer Drought Severity Index (PDSI); due to this reason, it can be used to assess impacts of drought worldwide [,,,,]. It characterizes drought and abnormal wetness at different time scales, which corresponds it with the availability of time of varying water resources that include soil moisture, snowpack, groundwater, river discharge, and reservoir storage.
Studies about drought have been done across the country; for example, a study by Kaluba [] analyzed spatial drought mapping in Zambia using regional frequency by applying the L-Moments method and concluded that Southern Zambia is more prone to drought events. Another study by Libanda [] on spatial patterns of drought using SPI at the annual level found similar results. However, the duration, magnitude, and intensity of drought, which includes the long-term variation of spatial and temporal drought patterns at the annual and seasonal level remain poorly explored. As a result, an adaptive drought strategy has been rarely implemented. Therefore, the government and the societies focus mainly on managing the drought crisis.
Precipitation anomalies are a natural recurring feature of the global climate affecting various components of the hydrological cycle to produce drought []. However, the attainment of successful drought monitoring is dependent on how drought is characterized and quantified in both spatial and temporal extents. In this study, the aim is to investigate the spatial–temporal distribution and patterns of drought duration, intensity, and severity focusing on long-term drought assessment over Zambia from the past 37 years (1981–2017) using SPI at the different time scales—namely 3, 6, and 12 months, considering the main core rain season December, January, and February (DJF) in Zambia. The findings will allow us to detect the prone areas with higher intensity, larger magnitude, and longer duration of droughts. This is helpful to assess intermediate agriculture droughts and long-term hydrological droughts affecting the water flow discharge and increasing risk in shortages of water across the country. These will contribute to the understanding of the drought’s behavior from meteorological, agricultural, and hydrological droughts. The knowledge will help most policymakers implement adaptions and mitigation measures.
The paper is organized as follows. Following the introduction, Section 2 provides information about the study area, data, and methodology, including the drought classification index. Section 3 presents the spatial, temporal and trend results of rainfall and drought both at seasonal and annual scale, followed by conclusions in Section 4.
2. Study Area, Data, and Methods
2.1. Study Area
Zambia is situated in Southern Africa and a landlocked country. It experiences a tropical climate type and consists mostly of the high plateau, with some hills and mountains, dissected by river valleys. The tropical climate is modified by elevation. In the Köppen climate classification [], much of the country is classified as tropical wet and dry or humid subtropical, with small stretches of semi-arid steppe climate in the southwest and along the Zambezi valley []. The country lies between longitudes 22° E and 34° E and latitudes 8° S and 18° S; Figure 1 shows the location of Zambia and the selected meteorological station under study.
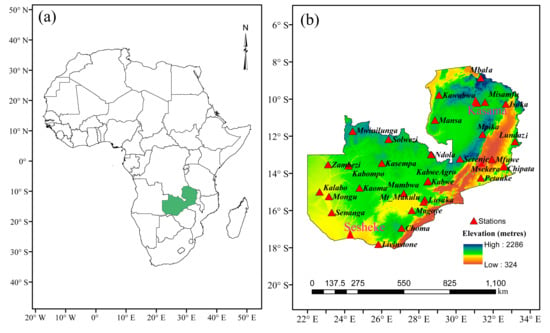
Figure 1.
Geographical location of the study area (a) and (b) the distribution of meteorological stations used in the present research.
The two main climate seasons consider that the rainy season corresponding to summer is between November and April, and the dry season (May/June to October/November) corresponds to winter. The dry season is divided into two parts. The cool and dry season months are May/June to August, and the hot, dry season months are September/October and November. The altitude gives the country’s pleasant subtropical weather rather than the tropical type of weather conditions during the cool season of May to August. The difference between dry and rainy seasons is marked, with no rain falling in June, July, and August. Much of the country’s cultural, economic, and social life is dominated by the amount of rain it brings and the onset and end of the rainy season. Failure of the rains results in hunger from time to time.
The average summer temperature is around 30 °C, and in the winter (colder season), it can get as low as 5 °C. The main rain-bearing systems are the intertropical convergence zone, which is the juncture of the northeast trade winds and the southeasterly monsoon as well as the subtropical high pressure in the Southern Indian Ocean [,]. Furthermore, Zambia also receives the northwest monsoon coupled with tropical Atlantic air through the Congo basin [,]. The Inter-Tropical Convergence Zone (ITCZ) is located in the north of Zambia during the dry season. In the second half of the year, the ITCZ moves southwards and northwards in the first half of the year. The highest rainfall is observed in the north, especially the northwest and the northeast; then, it tends to decrease toward the south; the driest areas are in the far southwest, the Luangwa River and middle Zambezi River valleys, which are considered semi-arid.
2.2. Data
To calculate the occurrence of drought, the study utilized observed monthly precipitation data from 32 selected meteorological and climatological stations sourced from the archives of the Zambia Meteorological Department. These 32 stations were picked depending on the availability of data at the time of the analysis. The monthly precipitation (mm) data for the last 37 years from 1981 to 2017 is considered as representing the climatological precipitation of each station. The monthly Sea Surface Temperature (SST) data anomalies from the El Niño 3.4 region were obtained from the climate prediction center of the Nation Oceanic and Atmospheric Administration (NOAA-NCEP 2016) and the National Climate and Data Centre of NOAA from (NOAA-NCDC 2016), respectively, and the period from 1981 to 2017 was used in this study.
2.3. Methodology
2.3.1. Spatial–Temporal Trend Analysis
To explore specific temporal and spatial rainfall and drought trends, monthly, seasonal, and annual data were investigated using both Mann–Kendall test and Sens slope analysis (time series).
2.3.2. Sens Slope
Non-parametric test methods of Sens slope are used to show the rate of change in the trends of time series [,]. This test gives a robust estimation of the trend, especially when other statistical approaches such as Kendall’s statistics test and regression cannot estimate the trends. This method has the ability of handling data with outliers which makes it more effective. It does not entail any normal distribution of residual nor is it affected by any extreme distributions. Generally, it has been employed in various studies to examine the linear tendencies of hydroclimatic variables across several domains [,]. The sens slope is given by Equations (1) and (2):
where and represent data values at the time j and k, respectively. However, considering the expression of in Equation (2) below
The median of these N values of is that it is a Sens estimator of the slope. If N is odd, the Sens estimator is computed by the top part of Equation (2), and if N is even, the Sens estimator is computed by the lower part of Equation (2). Finally, to test a two-sided test at a 100% (1−α) confidence interval and the true slope is obtained.
2.3.3. Mann–Kendall Test
A rank-based non-parametric Mann–Kendall test (MK) trend analysis [,,] is used to detect monotonic trends of seasonal, annual, and SPI indices. The Mann–Kendall test is recommended by the WMO and has been used widely, and it determines if a series of observations of a random variable is generally increasing or decreasing with time at different levels of significance. It does not need to follow a certain distribution or be disturbed by a few outliers []. In this study, it is used to assess the significance of the trends.
Mann–Kendall’s test can be performed by the time series value replaced by their relative ranks starting from 1 as the lowest rank and n as the highest rank. MK test statistics S is calculated as given by Equations (3) and (4) below.
where and are the annual values for the j-th and i-th terms, and n is the sample size. is calculated as;
In detecting the trend, a hypothesis is set as follows: the null hypothesis (H0) signified no trend in the data being tested. The alternative hypothesis (H1) indicated the presence of a trend, either increasing or decreasing monotonic trend. The variance of S is calculated using Equation (5);
The probability associated with S and the sample size n is calculated to assess the significance of the trend. The standard normal distribution (Z-statistic) depicts the significance of the trend where positive and negative signifies downwards or upward trends, respectively. At a given α level of significance for a two-tailed test, is accepted if , where is calculated from the standard normal distribution tables. In the present study, the significance of the trend was presented using the p-values calculated by evaluating the value of . Then, the probability associated with MK and sample size n was computed to quantify the significance of the trend statistically. Then, the normalized test statistic, Z, can be calculated using Equation (6);
The trend is considered decreasing if Z is negative and vice versa. All calculations were carried out using the Mann–Kendall statistical packages in R Studio software.
2.3.4. Standardized Precipitation Index (SPI)
The SPI was developed to define and characterize drought at different time scales using precipitation as input data []. Research has shown precipitation to be the subject to the law of gamma distribution []. To compute the SPI, long-term precipitation records are fed into the gamma probability density function, which transforms to a normal distribution. The SPI values give a transformation of probability which mainly varies from −2 to 2, although it is possible to get values of >2 or <−2. Calculating the SPI for a specific time at any place requires completed monthly data for the quantity of precipitation: at least a 30-annual sequence [,]. Indices computed for a short time scale (1, 3 and 6 months) explore a short-term seasonal approximation of precipitation, which affects agriculture conditions, whereas those for long-term scale (9, 12, and 24 months) are more indicative for hydrological conditions (water runoffs, groundwater levels).
In this study, SPI is used to assess drought occurrence on 3-month, 6-month, and 12-month time-scale intervals, which is associated with most rainy and cropping seasons in Zambia. Here, only precipitation data were used to compute SPI, and it should be noted that SPI does not consider the effect of temperature, which can result in unexpected drought conditions. The use of precipitation data alone is due to the lack of ground observed temperature data. SPI drought analysis is carried out for time series at 32 observation stations and spatially using a gridded reanalysis gamma distribution of SPI []. The classification of drought years in this study was performed following []. Many studies, e.g., [,], have used this method for drought characterization in different parts of the world.
Using a gamma distribution probability density function, SPI was computed as
where represents the gamma function; is the amount of precipitation in mm (x > 0); α is the shape parameter; and β is the scale parameter (β > 0).
To fit the rainfall data with gamma distribution requires estimating and β. Then, we use an approximation of them to estimate these parameters for maximum likelihood to obtain
where is the number of rainfall measurements, and is the mean of .
The gamma cumulative distribution functions (CDF) are given by integrating the probability density function (PDF) as represented in Equation (11):
Assuming that , this where the cumulative distribution becomes:
Rainfall data may contain zero measurements, and the gamma function is undefined for , while cumulative distribution can be expressed as
where is the probability of zero if m is the number of zero measurements in a rainfall time series. Thon and Almedeji [,] state that q can be estimated by m/n. Introducing the approximate conversion transforms the cumulative distribution H(x) into the random standard normal Z variable according to Abramowitz and stegun, and almedeje [,] as
A positive value of SPI represents the precipitation above average, and a negative SPI corresponds to below-average precipitation. According to [], a drought event is defined as a continuous period with negative SPI reaching a value of −1.0 or less until it becomes positive. Table 1 shows the classification of SPI as a drought indicator []. SPI for different periods will be plotted against time (in years) to visualize the time-series variation of monthly, seasonal, and annual rainfall mean.

Table 1.
Classification of drought on the Standardized Precipitation Index (SPI) scale.
2.3.5. Drought Characteristics
Drought has many characteristics that are defined by different drought conditions such as duration, intensity, and severity []. In this study, the probabilistic method of runs theory has been used to understand different drought characteristic []; a run is defined as a portion of time series in which all values are below or above the threshold level. We applied runs theory using an SPI time series to detect the drought duration, severity, and intensity in Zambia. Here, drought is identified when the SPI values drop below the threshold value (−1) []. The higher negative values below −1 mean more severe drought relative to long-term average conditions. The more negative SPI values, the more severe the drought and vice versa []. Negative SPI values also indicate a lack of rain relative to the atmospheric water demand. The determination for each drought event during the past 37 years over Zambia was made by drought properties, including duration, severity, and intensity.
Drought duration (D) is the length of time (i.e., the number of months) between the onset and termination of drought [,]. It is calculated by the sum of the durations for all drought events divided by the number of droughts events, as follows [] in Equation (16):
where D is the average of each duration (month), is the duration of the i-th drought event in an area, and is the total number of drought events in the area.
Severity (S) is the index value of the cumulative sum based on the duration extent, which specifies the collective deficit of a drought index below the selected threshold level. It is calculated by a simple arithmetic sum of the SPI deficit for each month under drought, as shown in Equation (17):
where S is the drought severity, D is the number of drought months, i is a start of the first month of the drought and continues until the end of drought duration, and is the SPI value in the time scale and year [,].
Intensity (I) is the average of the drought index for a certain drought event. Shorter duration events and higher severity will have large intensities [,,]. It is calculated by dividing drought severity by the duration of Equation (18).
where is the drought intensity, S is the drought severity, and D is the drought duration.
Lastly, the study employed the Inverse Distance Weighting (IDW) technique to interpolate stationed results into spatial maps; the computation was carried out using the Arc GIS version 10.3.1.
2.3.6. ENSO Influence on Drought
Correlation analysis reveals a simple relationship between pairs of variables. Pearson’s correlations between SPI and SSTs anomalies at the 95% confidence level are obtained; here, correlations are achieved with time series at a monthly scale to expose any possible seasonality in the relationships []. The impact of ENSO on drought presented by SPI in the study is investigated through the degree of association between the two variables at each of the respective time scale of 3 and 12 months.
3. Results and Discussion
In this section, the results obtained using the above-discussed methods are presented and discussed according to their respectively sub-sections.
3.1. Rainfall Characteristics
The spatial–temporal characteristics of rainfall over Zambia were analyzed using station datasets for the entire study duration.
3.1.1. Spatial Distribution of Monthly Rainfall
The spatial patterns presented in Figure 2 reveal a heterogeneity characteristic of rainfall with a high amount observed in north and central areas as compared to southern and western areas. In terms of monthly and locational variation, rainfall is observed to start from October in northern areas and ends in March in most parts of the study domain. However, in terms of cessation, it can be noticed that the northern areas have an accumulative rainfall of up to 90 mm during April, signifying that the northern areas experience relatively longer monthly rainfall duration as compared to most of the southern and central areas of the study domain. The lowest rainfall is recorded between May and September, which is also considered as the dry season with the driest month being July.
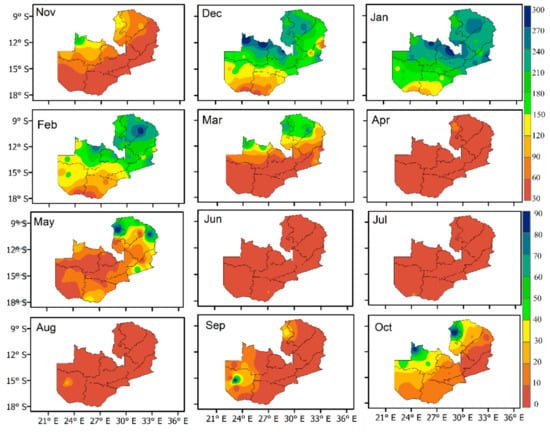
Figure 2.
Monthly mean rainfall patterns in mm over Zambia for the period 1981–2017: Nov to Apr (wet months) and May to Oct (dry months). Note that the scale for wet months is different from dry months.
3.1.2. Annual Rainfall Cycle and Interannual Rainfall Variability
The above findings are in total agreement with the general rainfall annual cycle over Zambia presented in Figure 3. The annual cycle depicted in Figure 3 was obtained by performing an arithmetic average of all the stations. The results depict a pattern with rainfall starting in October and ending in April, while the remaining period is generally dry. However, the core of the rain season from Figure 3 has been identified to occur during DJF with over 70% of cumulative rainfall received over these months. A similar observation was made by [,] after analyzing interannual variability in wet and dry spells characteristic over Zambia. It is worthy to note that the rainfall distribution over Zambia is highly influenced by the major rain belt, the ITCZ, which is the convergency zone of the northeast and southeast trade winds. The ITCZ begins to affect Zambia from the north and northwest between October and November causing the northern half of the country to experience an increase in rainfall while most parts of the southern half remain relatively dry. From December to February, the ITCZ moves southwards, bringing rain to the southern half of the country before retreating to give a second rainfall peak over the northern half in March or April []. Zambia experiences widespread rains during DJF as presented by the spatial pattern in Figure 2 and Figure 3.
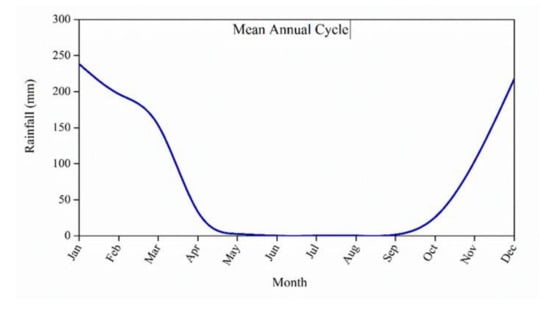
Figure 3.
The mean annual cycle of rainfall over Zambia (1981–2017).
The interannual rainfall variability of the mean DJF Analysis in Figure 4 captures the wet and dry events between 1981 and 2017. Here, DJF has been considered as the core rain season, as this period is critical for the cultivation of maize and also relates to the time of maximum rainfall. Studies by [] used the same condition to define the standard deviation of wet and dry years. The years with maximum values having at least standard deviations of +1.5—1989, 2007, 2010, 2011, and 2017—are considered to be wet years, and those of at least a standard deviation of −1.5 (1992, 1995 and 2005) are considered to be dry years. Some of the identified wet and dry years are similar to the findings of previous studies, e.g., [,,]. The most extreme pluvial years captured are 1989 and 2007 and the most extreme drought year was 1992, while the severe pluvial years were 2010, 2011, and 2017, while the severe drought years were 1995 and 2005. This matches with the previous findings of [] about the spatial and temporal patterns of drought over Zambia.
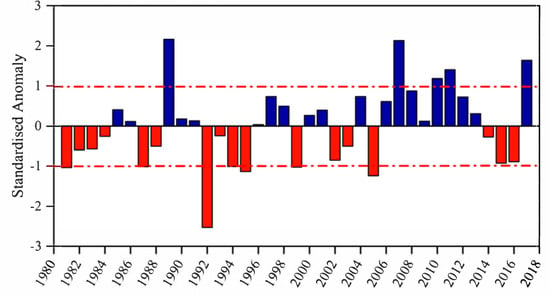
Figure 4.
Interannual variability of the mean December, January, and February (DJF) rainfall in mm over Zambia for the 1981–2017 period.
3.2. Spatial Patterns of Drought
3.2.1. Spatial Distribution of Drought Duration, Severity, and Intensity
Drought conditions such as severity duration and intensity are important properties of drought. Figure 5 shows the spatial distribution of mean drought events of severity, duration, and intensity at different SPI time scales over Zambia during 1981 to 2017. Here, drought events such as moderate, extreme, and severe were averaged at every SPI time scale (SPI-03, SPI-06, and SPI-12). Overall, the south and southwest of Zambia have been shown to experience longer drought duration, higher severity, and intensity compared to those of other areas. This poses a serious challenge on the agriculture and ecosystem of the society. Drought severity and intensity show their maximum extent of magnitude on a smaller time scale, while drought duration is persistently shorter.
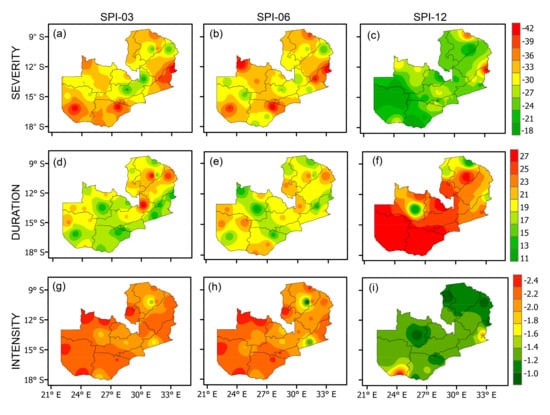
Figure 5.
Long-term spatial variations of drought severity (a–c), duration (d–f) and intensity (g–i) for SPI-03, SPI-06 and SPI-12, respectively over Zambia during 1981–2017.
Much of the northeast, including central areas, have shorter drought duration compared to the south and southwest parts. The drought duration pattern is observed to increase with SPI time scale, although the pattern observed is almost similar. Thereby, the drought duration identified based on SPI-12 persisted much longer than those for SPI-03 and SPI-06. According to [,], the drought duration over the larger time scale persists longer than that at the smaller time scale. The larger drought duration values indicate that short-term drought events exist with a longer length while smaller values indicated short drought events that are frequent but occur intermittently. Consequently, short-term drought may result in a serious impact on agriculture, and long-term drought may also cause or pose effects on the hydrological industry [,].
The further analysis of drought severity spatial distribution of SPI at different time scales show increased drought severities over the southwest, southeast, and a few areas over northern Zambia compared to the central parts of the study region, as portrayed in Figure 5 of the spatial variability of drought severity. It has been observed that the highest SPI severities are recorded at the SPI-03 time scale; this could be a result of accumulative rainfall deficits over longer periods (whole season). The SPI-06 and SPI-12 time scales recorded the lowest drought severities across the study domain.
SPI analysis of drought intensity spatial distribution at all time scales across Zambia shows high values, especially the western Zambia area on the 3 and 6-month time scales. The SPI progression pattern is similar to that of severity but has an opposite duration. The intensity at the larger time scale is captured to be shorter than that of the smaller time scale, unlike duration, and also the difference in time scale led to a significant difference in drought intensity. This is an indication that the spatial variation of drought intensity should be considered to correspond with the selected time scale at seasonal and interannual periods. Drought adaption and mitigation measures must be handled according to the results of the time scale involved, which can be higher at seasonal and interannual time scales. It can be seen from the results that most of the drought characteristics are more active over South and Western Zambia, which relates with Figure 2, where much of the southern area receives less rainfall compared to the northern parts of Zambia.
3.2.2. Spatial Distribution of Drought Trends
The spatial distribution of long-term variations of drought trend across Zambia is shown in Figure 6. From the results, it is indicated that the northeast parts of Zambia show decreasing SPI trends while the southwest parts show increasing SPI trends. The increasing SPI trends observed over the southwest at all time scales is a clear indication of increased drought events. Furthermore, trends of small change were found in some parts of Central and Northwest Zambia. Statistically, the trends at all time scales are showing that there is a significant change in the trends over the northeast and southwest at a 95% significant level.
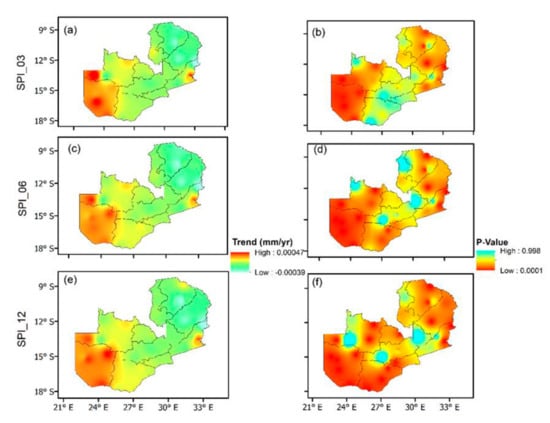
Figure 6.
Long-term spatial drought trend (a,c,e) and P-value (b,d,f) variations for SPI-03, SPI-06 and SPI-12, respectively over Zambia during 1981–2017.
The greater magnitude of drought over southwest, especially in some district such as Shesheke, is the reflection of its arid climatic system [], which can lead to persistent drought over dry areas. According to [], the southern parts are considered to be more prone to ENSO impacts on rainfall, and these are also located on the margins of drought corridor across Southern Africa. Therefore, drought events are more severe over southern than northern Zambia, which is similar to the observations documented by [] when analyzing the spatial mapping of drought in Zambia using regional frequency analysis.
3.3. Temporal Patterns of Droughts
Furthermore, the long-term time series for SPI at all time scales was extracted at distinctive stations in the regions of significant increase and decrease of SPI to have a clear understanding of the temporal variation of SPI at selected stations. These included Sesheke, which is located in the southwest, a region of increasing SPI, and Kasama situated in the northeast, which is the region of decreasing SPI. The evaluated results are presented in Figure 7 from 1981 to 2017. At all the time scales, the figure shows that the SPI trends for Sesheke have significantly increased at 95% confidence level with the observed slope values of 0.03417, 0.03148, and 0.043 for SPI-03, SPI-06, and SPI-12, respectively. On the other hand, Kasama in the northeast shows decreasing SPI trends, which is non-statistically significant with slope and the corresponding P-values presented in Figure 7 (b, d, and f). Interestingly, this conquers with the observations made in Figure 6 and Figure 5 that the southwestern parts have continued to experience the high occurrence of drought events in the last 3 decades and there is a high likelihood of drought to continue impacting the agriculture and hydro-economic development over these areas.
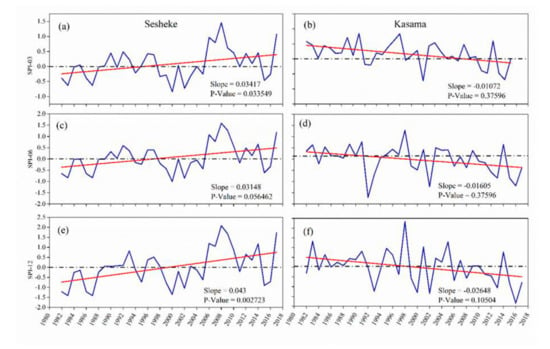
Figure 7.
Temporal variation of the standardized precipitation index (SPI) at different time scales (SPI-03, SPI-06, SPI-12) over Sesheke (a,c,e) and Kasama (b,d,f) during 1981–2017.
3.3.1. Long-Term Monthly Time Series Drought Variation
Long-term monthly SPI of temporal drought variation at different time scales is shown in Figure 8. The observed analysis indicated that drought increased through much of the SPI time series. A similar trend has been observed at all time scales, although the magnitude and extent increased with time scale. Severe events of drought occurred more during 1981 and 2000. It is evident that during the study period, drought has increasingly occurred with various magnitude: for example, 1991–1992 and 1994–1995 [,,,], which resulted in larger impacts on the environmental economy and society, especially in drought-prone areas such as Sesheke in the southwestern regions, thereby causing damage to agriculture and the hydro-environment system.
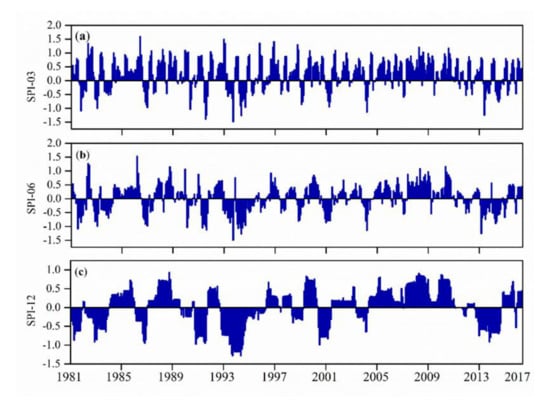
Figure 8.
Temporal variation of the monthly standardized precipitation index (SPI) over Zambia during 1981–2017 for SPI-03 (a), SPI-06 (b), and SPI-12 (c).
3.3.2. Annual and Seasonal Drought Trends
The long-term temporal variation of seasonal (a) and annual (b) trends for SPI-03 and SPI-12 for all the 32 stations was evaluated based on the MK test and Sens slope. The results are given in Figure 9 during the entire study period. A similar pattern has been depicted in the time series 9a and 9b where 2006 to 2012 shows consistency in wet years with 2010 as a wet year; this matches with the findings of [], who analyzed the diagnosis of DJF flood over Zambia. It is also shown that over the past 3 decades, drought has increased by 0.01167 and 0.01191 per year, as shown in Figure 9a,b, respectively. However, it is observed that the increased SPI time series in the region is not statistically significant at the 95% level, as shown by the corresponding P-values in Figure 9. Drought fluctuations are evident with different patterns and trends among different areas (Figure 6). Some depicted years that had experienced moderate to severe drought in Figure 9 are 1991–1992, 1994–1995, 2002–2003, and 2015–2016. Some of these years match with the results presented in Figure 4. However, significant droughts have occurred in different years—for instance, the 1991–1992 severe drought, which was induced by persistent shortages of rainfall during the rainy season, led to critical food shortages and an unstable economy []. The results for both seasonal and annual trends suggest that although drought has shown an overall increasing trend, especially in recent years, there are some fluctuations where some years experienced normal rainfall. These findings are likely due to conditions of the environment and climate changes; besides, the oceanic, seasonal, rainfall characteristics might have also contributed to the differences.
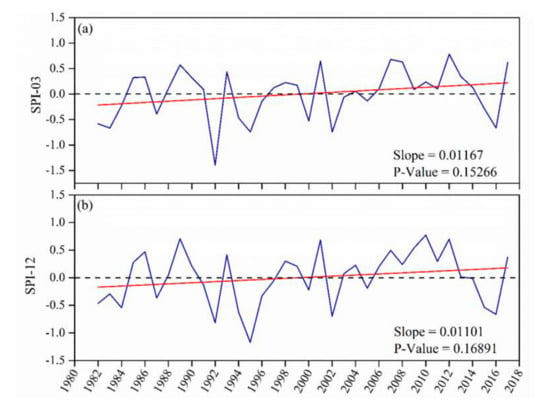
Figure 9.
Temporal variation of DJF season (a) and annual (b) standardized precipitation index (SPI-03 and SPI-12) over Zambia for the period 1981–2017.
3.4. The Relationship between ENSO and Drought
El Niño Southern Oscillation is closely related to the oceanic, atmospheric dynamics that influence the ocean currents and SSTs []. These phenomena consist of two components: La Niña and El Niño. The phase of cooler SSTs in the east of the equatorial Pacific is linked to La Niña, while El Niño is as a result of warm SSTs in the western equatorial Pacific progressing east. The main activity of La Niña (El Niño) occurs when the central equatorial Pacific is cool (warm), covering the region 3.4. Strong negative anomalies represent La Niña, whereas strong positive signifies El Niño []. These two natural phenomena highly influence Zambia’s rainfall pattern. Therefore, it is important to investigate the influence of ENSO (represented by SSTs anomalies) on the local climate.
Figure 10 shows that there exists a negative correlation between the Nino index and the SPI for both seasonal (a) and annual (b) trends with the corresponding correlation coefficients of −0.50681 and −0.39539 (SPI-03 and SPI-12). This indicates that more drought events occur in the years of the positive phase of SST (El Niño years) and less droughts occur during the La Niña phase. The results further illustrate that the warm SSTs corresponds with persistent negative SPI values and hence drought. From the time-series graph, the years that are attributed to drought have been identified and spotted at both SPI time scales such as 1991–1992, 1994–1995, 2002–2003, and 2015–2016, which is similar to the results presented in Figure 9. However, not all the drought episodes follow the El Niño years; some are due to other local climatic factors—for example, the year 1995.
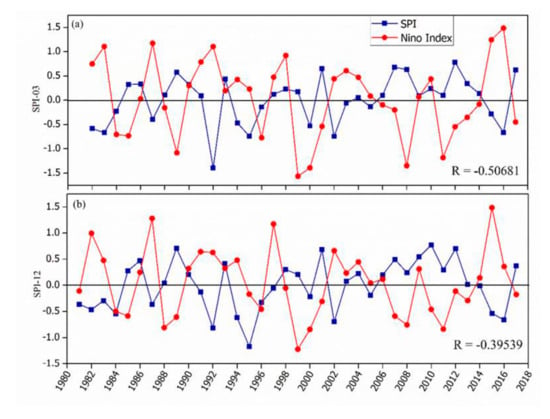
Figure 10.
Relationship between Sea Surface Temperature (SST) anomalies and SPI-03 for DJF Season (a) and SPI-12 for annual (b) over Zambia during 1981–2017.
The negative correlation between the Nino Index and SPI is also reflected at the station level, as shown in Figure 11, except for SPI-03 for Kasama, which has a positive coefficient. The negative correlation coefficient values were weak over Kasama (Northeast) as compared to Sesheke (southwest); this indicates that the southwestern drought is more strongly connected to ENSO than the northeastern parts of Zambia. The observed correlation coefficient values for both Kasama and Sesheke are captured in Figure 11 at different SPI time scales. This is in total agreement with the results documented in [].
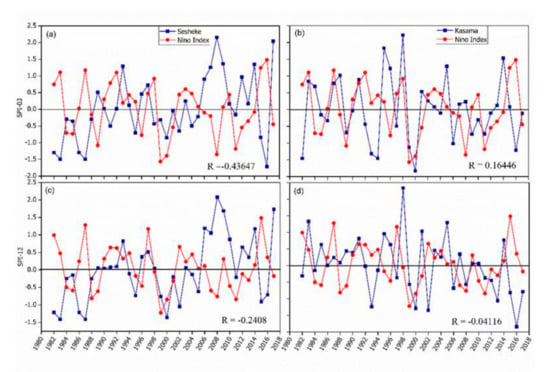
Figure 11.
The same as in Figure 10 but for Sesheke (a and c) and Kasama (b and d) stations.
4. Conclusions
In this study, the rainfall characteristics over Zambia were analyzed to define the wet season during 1981–2017. The analysis shows that the country experiences widespread rains during DJF as presented by the spatial pattern in Figure 2 and Figure 3 when the ITCZ moves southwards over Zambia. Considering DJF as the core rain season, the analysis of interannual rainfall variability in Figure 4 captured dry event years of 1992, 1995, and 2005 between the period of 1981 and 2017.
Analysis of drought characteristics revealed that indices on a 3-month time scale aggregate had low drought duration and severity but high intensity compared to those of 12 months. Generally, we found an increase in drought trend for the past 37 years with distinct spatial and temporal patterns. Drought tends to have significantly increased over the southwest and decreased over Northeast Zambia. This gives a serious concern to both agricultural and hydrological industries over the drought-prone areas of Southern Zambia. After analyzing two stations from different locations (south and north), it is evident that this study covered a large geographical extent with variable climatological regions, but the results could be different if a specific region is considered in Zambia.
The MK trend test and slope indicated that both annual and seasonal drought have increased, although drought increment at the annual level shows a low magnitude as compared to the seasonal level. This suggested the importance of assessing drought at an interannual and seasonal time scale over Zambia. Specifically, the drought increased determinedly before 2010 and became erratic between 2010 and 2017 with considerable regional variation. Zambia experienced moderate to severe droughts during 1991–1992, 1994–1995, 2006–2005, and 2015–2016, which resulted in serious damages to the environment and society. The SPI data from all time scale showed upwards trends, explaining that drought has increased in the last 3 decades. The findings of this study suggest that drought implications can be managed by creating strategies and adaptation measures.
Author Contributions
Conceptualization, B.M.; methodology, B.M.; software, B.M.; validation, B.M., M.O. and V.I.; formal analysis, B.M.; investigation, B.M. and M.O.; resources, B.M. and V.I.; data curation, B.M.; writing—original draft preparation, B.M.; writing—review and editing, B.M., V.I. and Y.J.; visualization, B.M.; supervision, Y.J.; funding acquisition, Y.J. All authors have read and agreed to the published version of the manuscript.
Funding
This research was jointly supported by National Natural Science Foundation of China (No. 41575111), and the Open Research Fund of Key Laboratory of Digital Earth Science, Institute of Remote Sensing and Digital Earth, CAS (2018LDE003).
Acknowledgments
The authors wish to experience since gratitude to Nanjing University of Information Science and Technology (NUIST), China for establishing a suitable environment for research. We also want to appreciate Zambia Meteorology Department (ZMD), for availing the data which was used in this analysis. We highly acknowledge the efforts made by the editor in contacting the anonymous reviewers and for their constructive comments and suggestions which improved the research work to the current state.
Conflicts of Interest
The authors wish to state that there is no conflict of interest.
References
- Parsons, D.J.; Rey, D.; Tanguy, M.; Holman, I.P. Regional variations in the link between drought indices and reported agricultural impacts of drought. Agric. Syst. 2019, 173, 119–129. [Google Scholar] [CrossRef]
- Buckland, R.; Eele, G.; Mugwara, R. Food aid and human security. In Humanitarian Crisis and Natural Disasters: A SADC Perspective; Stokker, O.S., Ed.; European Association of Development Research, Fank Cass Publishers: London, UK, 2000; pp. 181–195. [Google Scholar]
- IPCC. Changes in Climate Extremes and Their Impacts on the Natural Physical Environment. In Managing the Risks of Extreme Events and Disasters to Advance Climate Change Adaptation: Special Report of the Intergovernmental Panel on Climate Change; Field, C.B., Barros, V., Stocker, T.F., Qin, D., Dokken, D.J., Ebi, K.L., Mastrandrea, M.D., Mach, K.J., Plattner, G.-K., Allen, S.K., et al., Eds.; Cambridge University Press: Cambridge, UK, 2012. [Google Scholar]
- Taylor, K.E.; Stouffer, R.J.; Meehl, G.A. An overview of CMIP5 and the experiment design. Bull. Am. Meteorol. Soc. 2012, 93, 485–498. [Google Scholar]
- Zhao, T.; Dai, A. The Magnitude and Causes of Global Drought Changes in the Twenty-First Century under a Low–Moderate Emissions Scenario. J. Clim. 2015, 28, 4490–4512. [Google Scholar] [CrossRef]
- Dai, A. Drought under global warming: a review. Wiley Interdiscip. Rev. Clim. Chang. 2011, 2, 45–65. [Google Scholar] [CrossRef]
- Burke, E.J. Understanding the Sensitivity of Different Drought Metrics to the Drivers of Drought under Increased Atmospheric CO2. J. Hydrometeorol. 2011, 12, 1378–1394. [Google Scholar] [CrossRef]
- Scheff, J.; Frierson, D.M.W. Robust future precipitation declines in CMIP5 largely reflect the poleward expansion of model subtropical dry zones. Geophys. Res. Lett. 2012, 39. [Google Scholar] [CrossRef]
- Trenberth, K.E.; Fasullo, J.T. Global warming due to increasing absorbed solar radiation. Geophys. Res. Lett. 2009, 36. [Google Scholar] [CrossRef]
- Loomis, R.S. Feeding a World Population of More than Eight Billion People: A Challenge to Science. Crop. Sci. 1999, 39, 1250. [Google Scholar] [CrossRef]
- Al-Kaisi, M.M.; Elmore, R.W.; Guzman, J.G.; Hanna, H.M.; Hart, C.E.; Helmers, M.J.; Hodgson, E.W.; Lenssen, A.W.; Mallarino, A.P.; Robertson, A.E.; et al. Drought impact on crop production and the soil environment: 2012 experiences from Iowa. J. Soil Water Conserv. 2013, 68, 19A–24A. [Google Scholar] [CrossRef]
- Doughty, C.E.; Metcalfe, D.B.; Girardin, C.A.J.; Amézquita, F.F.; Cabrera, D.G.; Huasco, W.H.; Silva-Espejo, J.E.; Araujo-Murakami, A.; Da Costa, M.C.; Rocha, W.; et al. Drought impact on forest carbon dynamics and fluxes in Amazonia. Nat. Cell Biol. 2015, 519, 78–82. [Google Scholar] [CrossRef]
- Hill, M. World’s Biggest Dam Has ‘Extremely Dangerous’ Low Water Levels. 2017. Available online: https://www.bloomberg.com/news/articles/2016-01-08/world-s-biggest-dam-has-extremely-dangerous-low-water-levels (accessed on 10 September 2020).
- Muchuru, S.; Landman, W.; DeWitt, D.; Lötter, D. Seasonal rainfall predictability over the Lake Kariba catchment area. Water SA 2014, 40, 461. [Google Scholar] [CrossRef]
- Tsubo, M.; Walker, S. An assessment of productivity of maize grown under water harvesting system in a semi-arid region with special reference to ENSO. J. Arid Environ. 2007, 71, 299–311. [Google Scholar] [CrossRef]
- Rouault, M.; Richard, Y. Intensity and spatial extension of drought in South Africa at different time scales. Water SA 2004, 29, 489–500. [Google Scholar] [CrossRef]
- Winkler, K.; Gessner, U.; Hochschild, V. Identifying Droughts Affecting Agriculture in Africa Based on Remote Sensing Time Series between 2000–2016: Rainfall Anomalies and Vegetation Condition in the Context of ENSO. Remote Sens. 2017, 9, 831. [Google Scholar] [CrossRef]
- Richard, Y.; Fauchereau, N.; Poccard, I.; Rouault, M.; Trzaska, S. 20th century droughts in southern Africa: spatial and temporal variability, teleconnections with oceanic and atmospheric conditions. Int. J. Clim. 2001, 21, 873–885. [Google Scholar] [CrossRef]
- Reason, C.J.C.; Jagadheesha, D. A model investigation of recent ENSO impacts over southern Africa. Theor. Appl. Clim. 2005, 89, 181–205. [Google Scholar] [CrossRef]
- Findell, K.L.; Delworth, T.L. Impact of Common Sea Surface Temperature Anomalies on Global Drought and Pluvial Frequency. J. Clim. 2010, 23, 485–503. [Google Scholar] [CrossRef]
- Giannini, A.; Biasutti, M.; Held, I.M.; Sobel, A.H. A global perspective on African climate. Clim. Chang. 2008, 90, 359–383. [Google Scholar] [CrossRef]
- Nicholson, S.E. AN ANALYSIS OF THE ENSO SIGNAL IN THE TROPICAL ATLANTIC AND WESTERN INDIAN OCEANS. Int. J. Clim. 1997, 17, 345–375. [Google Scholar] [CrossRef]
- Behera, S.K.; Yamagat, H.W.A.T. Subtropical SST dipole events in the southern Indian Ocean. Geophys. Res. Lett. 2001, 28, 327–330. [Google Scholar] [CrossRef]
- Reason, C.J.C. Sensitivity of the southern African circulation to dipole sea-surface temperature patterns in the south Indian Ocean. Int. J. Clim. 2002, 22, 377–393. [Google Scholar] [CrossRef]
- Wilhite, D.A. Drought as a natural hazard: concepts and definitions. In Drought: A Global Assessment; Routledge: London, UK, 2000; pp. 3–18. [Google Scholar]
- Łabędzki, L. Estimation of local drought frequency in central Poland using the standardized precipitation index SPI. Irrig. Drain. 2007, 56, 67–77. [Google Scholar] [CrossRef]
- Mishra, A.K.; Singh, V.P. A review of drought concepts. J. Hydrol. 2010, 391, 202–216. [Google Scholar] [CrossRef]
- Manatsa, D.; Mukwada, G.; Siziba, E.; Chinyanganya, T. Analysis of multidimensional aspects of agricultural droughts in Zimbabwe using the Standardized Precipitation Index (SPI). Theor. Appl. Clim. 2010, 102, 287–305. [Google Scholar] [CrossRef]
- Almedeij, J. Drought Analysis for Kuwait Using Standardized Precipitation Index. Sci. World J. 2014, 2014, 451841. [Google Scholar] [CrossRef]
- Guttman, N.B. ACCEPTING THE STANDARDIZED PRECIPITATION INDEX: A CALCULATION ALGORITHM1. JAWRA J. Am. Water Resour. Assoc. 1999, 35, 311–322. [Google Scholar] [CrossRef]
- Du, J.; Fang, J.; Xu, W.; Shi, P. Analysis of dry/wet conditions using the standardized precipitation index and its potential usefulness for drought/flood monitoring in Hunan Province, China. Stoch. Environ. Res. Risk Assess. 2013, 27, 377–387. [Google Scholar] [CrossRef]
- Kaluba, P.; Verbist, K.M.J.; Cornelis, W.M.; Van Ranst, E. Spatial mapping of drought in Zambia using regional frequency analysis. Hydrol. Sci. J. 2017, 62, 1825–1839. [Google Scholar] [CrossRef]
- Libanda, B.; Zheng, M.; Ngonga, C. Spatial and temporal patterns of drought in Zambia. J. Arid. Land 2019, 11, 180–191. [Google Scholar] [CrossRef]
- Efstathiou, M.N.; Varotsos, C.A. Intrinsic properties of Sahel precipitation anomalies and rainfall. Theor. Appl. Clim. 2012, 109, 627–633. [Google Scholar] [CrossRef]
- Geiger, R. Klassifikation der Klimate nach W. Köppen. In Landolt-Börnstein—Zahlenwerte und Funktionen aus Physik, Chemie, Astronomie, Geophysik und Technik; alte Serie; Springer: Berlin, Germany, 1954; Volume 3, pp. 603–607. [Google Scholar]
- Hachigonta, S.; Reason, C. Interannual variability in dry and wet spell characteristics over Zambia. Clim. Res. 2006, 32, 49–62. [Google Scholar] [CrossRef]
- Brigadier, L.; Ogwang, B.A.; Victor, O.; Ngonga, C.; Nyasa, L. Diagnosis of the 2010 DJF flood over Zambia. Nat. Hazards 2015, 81, 189–201. [Google Scholar] [CrossRef]
- Mwafulirwa, N.D. Climate Variability and Predictability in Tropical Southern Africa with a Focus on Dry Spells over Malawi. Master’s Thesis, Faculty of Science, University of Zululand, Zululand, Sauth Africa, 1999. [Google Scholar]
- Brigadier, L.; Barbara, N.; Bathsheba, M. Rainfall Variability over Northern Zambia. J. Sci. Res. Rep. 2015, 6, 416–425. [Google Scholar] [CrossRef]
- Cook, C.; Reason, C.; Hewitson, B.C. Wet and dry spells within particularly wet and dry summers in the South African summer rainfall region. Clim. Res. 2004, 26, 17–31. [Google Scholar] [CrossRef]
- Sen, P.K. Estimates of the regression coefficient based on Kendall’s tau. J. Am. Stat. Assoc. 1968, 63, 1379–1389. [Google Scholar] [CrossRef]
- Theil, H. A rank-invariant method of linear and polynomial regression analysis, 3; confidence regions for the parameters of polynomial regression equations. Indag. Math. 1950, 1, 467–482. [Google Scholar]
- Mumo, L.; Yu, J.; Fang, K. Assessing Impacts of Seasonal Climate Variability on Maize Yield in Kenya. Int. J. Plant Prod. 2018, 12, 297–307. [Google Scholar] [CrossRef]
- Ongoma, V.; Chen, H. Temporal and spatial variability of temperature and precipitation over East Africa from 1951 to 2010. Theor. Appl. Clim. 2017, 129, 131–144. [Google Scholar] [CrossRef]
- Mann, H.B. Non-parametric tests against trend. Econometrica 1945, 13, 245–259. [Google Scholar] [CrossRef]
- Sneyers, R. On the Statistical Analysis of Series of Observations; World Meteorological Organization (WMO): Geneva, Switzerland, 1990. [Google Scholar]
- Kendall, M. Rank Correlation Methods, 5th ed.; Oxford University Press: London, UK, 1975; p. 272. [Google Scholar]
- Prabhakar, A.; Singh, K.; Lohani, A. Regional level long-term rainfall variability assessment using Mann-Kendall test over the Odisha state of India. J. Agrometeorol. 2018, 20, 164–165. [Google Scholar]
- McKee, T.B.; Doesken, N.J.; Kleist, J. The relationship of drought frequency and duration to time scales. In Proceedings of the 8th Conference on Applied Climatology, Anaheim, CA, USA, 17–22 January 1993. [Google Scholar]
- Hayes, M.J.; Svoboda, M.D.; Wilhite, D.A.; Vanyarkho, O.V. Monitoring the 1996 Drought Using the Standardized Precipitation Index. Bull. Am. Meteorol. Soc. 1999, 80, 429–438. [Google Scholar] [CrossRef]
- Seiler, R.A.; Hayes, M.; Bressan, L. Using the standardized precipitation index for flood risk monitoring. Int. J. Clim. 2002, 22, 1365–1376. [Google Scholar] [CrossRef]
- Dogan, S.; Berktay, A.; Singh, V.P. Comparison of multi-monthly rainfall-based drought severity indices, with application to semi-arid Konya closed basin, Turkey. J. Hydrol. 2012, 470, 255–268. [Google Scholar] [CrossRef]
- Salehnia, N.; Alizadeh, A.; Sanaeinejad, H.; Bannayan, M.; Zarrin, A.; Hoogenboom, G. Estimation of meteorological drought indices based on AgMERRA precipitation data and station-observed precipitation data. J. Arid. Land 2017, 9, 797–809. [Google Scholar] [CrossRef]
- Thom, H.C.S. A NOTE ON THE GAMMA DISTRIBUTION. Mon. Weather. Rev. 1958, 86, 117–122. [Google Scholar] [CrossRef]
- Abramowitz, M.; Stegun, I.A. Handbook of Mathematical Functions with Formulas, Graphs, and Mathematical Tables; US Government Printing Office: Washington, DC, USA, 1970; Volume 55. [Google Scholar]
- Zhang, Q.; Zhang, J. Drought hazard assessment in typical corn cultivated areas of China at present and potential climate change. Nat. Hazards 2016, 81, 1323–1331. [Google Scholar] [CrossRef]
- Yevjevich, V.M. An objective Approach to Definitions and Investigations of Continental Hydrologic Droughts; no. 23; Colorado State University: Fort Collins, CO, USA, 1967; p. 18. [Google Scholar]
- Schwalm, C.R.; Anderegg, W.R.L.; Michalak, A.M.; Fisher, J.B.; Biondi, F.; Koch, G.; Litvak, M.; Ogle, K.; Shaw, J.D.; Wolf, A.; et al. Global patterns of drought recovery. Nat. Cell Biol. 2017, 548, 202–205. [Google Scholar] [CrossRef]
- Spinoni, J.; Naumann, G.; Carrao, H.; Barbosa, P.; Vogt, J. World drought frequency, duration, and severity for 1951–2010. Int. J. Climatol. 2014, 34, 2792–2804. [Google Scholar] [CrossRef]
- Mao, Y.; Wu, Z.; He, H.; Lu, G.; Xu, H.; Lin, Q. Spatio-temporal analysis of drought in a typical plain region based on the soil moisture anomaly percentage index. Sci. Total. Environ. 2017, 576, 752–765. [Google Scholar] [CrossRef]
- Xu, L.; Chen, N.; Zhang, X. Global drought trends under 1.5 and 2 °C warming. Int. J. Clim. 2018, 39, 2375–2385. [Google Scholar] [CrossRef]
- Gidey, E.; Dikinya, O.; Sebego, R.; Segosebe, E.; Zenebe, A. Modeling the Spatio-Temporal Meteorological Drought Characteristics Using the Standardized Precipitation Index (SPI) in Raya and Its Environs, Northern Ethiopia. Earth Syst. Environ. 2018, 2, 281–292. [Google Scholar] [CrossRef]
- Shah, R.; Bharadiya, N.; Manekar, V. Drought Index Computation Using Standardized Precipitation Index (SPI) Method For Surat District, Gujarat. Aquat. Procedia 2015, 4, 1243–1249. [Google Scholar] [CrossRef]
- Byakatonda, J.; Parida, B.P.; Moalafhi, D.B.; Kenabatho, P.K.; Lesolle, D. Investigating relationship between drought severity in Botswana and ENSO. Nat. Hazards 2019, 100, 255–278. [Google Scholar] [CrossRef]
- Libanda, B.; Zheng, M.; Banda, N. Variability of extreme wet events over Malawi. Geogr. Pannonica 2017, 21, 212–223. [Google Scholar] [CrossRef]
- Lweendo, M.K.; Lu, B.; Wang, M.; Zhang, H.; Xu, W. Characterization of Droughts in Humid Subtropical Region, Upper Kafue River Basin (Southern Africa). Water 2017, 9, 242. [Google Scholar] [CrossRef]
- Mpelasoka, F.; Awange, J.L.; Zerihun, A. Influence of coupled ocean-atmosphere phenomena on the Greater Horn of Africa droughts and their implications. Sci. Total. Environ. 2018, 610, 691–702. [Google Scholar] [CrossRef]
- Haile, G.G.; Tang, Q.; Leng, G.; Jia, G.; Wang, J.; Cai, D.; Sun, S.; Baniya, B.; Zhang, Q. Long-term spatiotemporal variation of drought patterns over the Greater Horn of Africa. Sci. Total. Environ. 2020, 704, 135299. [Google Scholar] [CrossRef]
- Choi, Y.-W.; Ahn, J.-B.; Suh, M.-S.; Cha, D.; Lee, D.-K.; Hong, S.-Y.; Min, S.-K.; Park, S.-C.; Kang, H.-S. Future changes in drought characteristics over South Korea using multi regional climate models with the standardized precipitation index. Asia-Pac. J. Atmos. Sci. 2016, 52, 209–222. [Google Scholar] [CrossRef]
- Steinemann, A.; Iacobellis, S.F.; Cayan, D.R. Developing and Evaluating Drought Indicators for Decision-Making. J. Hydrometeorol. 2015, 16, 1793–1803. [Google Scholar] [CrossRef]
- Usman, M.; Reason, C. Dry spell frequencies and their variability over southern Africa. Clim. Res. 2004, 26, 199–211. [Google Scholar] [CrossRef]
- Tiffen, M.; Mulele, M.R. The Environmental Impact of the 1991-92 Drought on Zambia; IUCN: Gland, Switzerland; Lusaka, Zambia, 1994; p. 108. [Google Scholar]
- Rasmusson, E.M.; Wang, X.; Ropelewski, C.F. The biennial component of ENSO variability. J. Mar. Syst. 1990, 1, 71–96. [Google Scholar] [CrossRef]
Publisher’s Note: MDPI stays neutral with regard to jurisdictional claims in published maps and institutional affiliations. |
© 2020 by the authors. Licensee MDPI, Basel, Switzerland. This article is an open access article distributed under the terms and conditions of the Creative Commons Attribution (CC BY) license (http://creativecommons.org/licenses/by/4.0/).