Article

Functional Research on Three Presumed Asparagine Synthetase Family Members in Poplar

1
State Key Laboratory of Tree Genetics and Breeding (Northeast Forestry University), School of Forestry, Northeast Forestry University, Harbin 150040, China
2
School of Forestry, Northeast Forestry University, Harbin 150040, China
3
Guangxi Forestry Research Institute, Nanning 530000, China
4
College of Life Science, Northeast Forestry University, Harbin 150040, China
*
Authors to whom correspondence should be addressed.
These authors contributed equally to this work.
Genes 2019, 10(5), 326; https://doi.org/10.3390/genes10050326
Submission received: 11 March 2019 / Revised: 16 April 2019 / Accepted: 23 April 2019 / Published: 28 April 2019
(This article belongs to the Section Plant Genetics and Genomics)

Abstract

:
Asparagine synthetase (AS), a key enzyme in plant nitrogen metabolism, plays an important role in plant nitrogen assimilation and distribution. Asparagine (Asn), the product of asparagine synthetase, is one of the main compounds responsible for organic nitrogen transport and storage in plants. In this study, we performed complementation experiments using an Asn-deficient Escherichia coli strain to demonstrate that three putative asparagine synthetase family members in poplar (Populus simonii × P. nigra) function in Asn synthesis. Quantitative real-time PCR revealed that the three members had high expression levels in different tissues of poplar and were regulated by exogenous nitrogen. PnAS1 and PnAS2 were also affected by diurnal rhythm. Long-term dark treatment resulted in a significant increase in PnAS1 and PnAS3 expression levels. Under long-term light conditions, however, PnAS2 expression decreased significantly in the intermediate region of leaves. Exogenous application of ammonium nitrogen, glutamine, and a glutamine synthetase inhibitor revealed that PnAS3 was more sensitive to exogenous glutamine, while PnAS1 and PnAS2 were more susceptible to exogenous ammonium nitrogen. Our results suggest that the various members of the PnAS gene family have distinct roles in different tissues and are regulated in different ways.

1. Introduction

Asparagine synthetase (AS; EC 6.3.5.4) is a chiefly cytoplasmic enzyme that generates asparagine from aspartate. This enzyme uses glutamine or ammonium as substrates to transfer amide groups to aspartic acid to form asparagine [1]. Asparagine (Asn), an important nitrogen transport compound, plays a major role in nitrogen utilization in new plant tissues [2,3,4,5,6,7]. AS is thus a key enzyme in nitrogen assimilation in higher plants.
The amino acid sequence of asparagine synthetase contains two highly similar conserved domains: the glutamine-amide transfer domain and the C-terminal synthetase domain [8]. The glutamine aminotransferase domain binds to glutamine (Gln). This domain, which extends from the N-terminus to the fourth amino acid position, has the structural characteristics of Met-Cys-Gly-Ile [9,10,11]. The synthetase domain includes three conserved sites, Cys, His, and Asp, which are localized to the N-terminal of the polypeptide [9,12]. The domains participate in the transamination of Gln [12]. In addition, aspartic acid- and adenosine monophosphate (AMP)-binding sites are located at the C-terminal of the polypeptide sequence [13]. At present, the gene encoding AS has been cloned from various plant species. The polypeptide encoded by AS generally contains 579–591 amino acids with a molecular weight of approximately 65 kDa [14].
According to phylogenetic analysis, the AS gene family can be divided into two subfamilies: class I and class II. Class I AS genes are usually inhibited by light. In common bean (Phaseolus vulgaris) and sunflower (Helianthus annuus), for example, high light inhibits the expression of these genes [15,16], possibly as the result of interaction with the photosynthesis process. In contrast, the expression profiles of class-II AS genes are relatively complex, and many are unrelated to light regulation [17,18,19]. In other studies, AS gene expression has been found to increase upon application of exogenous carbon [20,21,22].
AS is an important component of the nitrogen assimilation pathway. In previous studies, the expression level of the gene encoding the enzyme has been found to be related to nitrogen form and content. For example, Arabidopsis thaliana AtAS2 is induced by NH4+, which increases its expression level [23]. As another example, Phaseolus vulgaris PvAS1 and PvAS2 [21] and soybean SAS1, SAS2, and SAS3 genes are induced by NO3 [3]. In poplar (Populus L.), the product of the AS enzyme, Asn, is a major nitrogen transport compound that plays a role in transporting nitrogen between sink and source tissues [24]. No reports have appeared on the composition of this gene family in poplar, however, and the pattern of differential expression and the mode of regulation of AS members in this plant species has not been studied.
Populus simonii × P. nigra, a hybrid poplar derived by crossing P. pseudo-simonii as the female parent with P. nigra as the male parent, is the main broad-leaved tree species in northeastern China and a model woody plant [25]. Nitrogen, a major element, must be absorbed from the external environment. In natural forest soils, nitrogen deficiency is often considered to be one of the main factors limiting tree growth [24]. Increasing the efficiency of nitrogen assimilation should thus significantly improve the material properties of poplar. To lay a theoretical foundation for research on poplar nitrogen assimilation and utilization, we identified members of the asparagine synthetase gene family and analyzed their spatial distribution in Populus simonii × P. nigra.

2. Materials and Methods

2.1. Plant Material, Growth Environment and Sampling Method

In this study, we used approximately 15-cm-high seedlings of a single clone of Populus simonii × P. nigra. The seedlings were cultured in vermiculite. The nutrient solution was modified MS mediumwith change the NH4NO3 to 1 mM, which was replaced every 2 days. The seedlings were maintained for 30 days in a light-culture incubator under the following conditions: light intensity of 300 μmol m−2 s−1, 16-h/8-h light/dark photoperiod, the light phrase is 8:00–24:00, temperature of 24 ± 2 °C, and an air humidity of 40 ± 2%. Roots, stems, and various leaf portions of the poplar seedlings were selected for sampling. To study the expression patterns of PnAS genes in different regions of poplar leaves, we separated the leaves into three groups: the apical bud region (L1), comprising 1st, 2nd, and 3rd apical leaves; the intermediate region (L2), corresponding to 4th, 5th, and 6th leaves; and the more basal region (L3), including 9th, 10th, 11th, and 12th leaves. Following collection samples at 15:00. In the continuous light/dark experiment, all seedlings experienced 48 h of light/darkness, and other conditions were the same as those described above, correspondingly, the control sample is a group of seedlings that normally undergo 16-h light/8-h dark photoperiod. Samples were first rinsed with deionized water and then dried with absorbent paper. The samples were immediately frozen in liquid nitrogen and placed in a −80 °C freezer.

2.2. Search and Analysis of Gene Families

The poplar asparagine synthetase amino acid sequence was downloaded from Phytozome 12.0 (https://phytozome.jgi.doe.gov/pz/portal.html). AS amino acid sequences of other species, including Arabidopsis thaliana, Escherichia coli, Helianthus annuus, Vitis vinifera, Populus trichocarpa, Astragalus sinicus, Vicia faba, Lotus japonicus, Glycine max, Phaseolus vulgaris, and Sorghum bicolor, were downloaded from NCBI. A phylogenetic tree of the aligned sequences was constructed by the neighbor-joining method in MEGA5 [26].

2.3. Escherichia coli Complementation Experiment

The Asn auxotroph ER#4813 strain (asnB32, λ-, relA1, spoT1, asnA31, thi1), provided by the E. coli Genetic Stock Center (New Haven, CT, USA), was used for complementation studies. The coding region of PnAS was cloned into a pET-14b expression vector at the XhoI–NotI double-digestion site. Primers are listed in Table 1. Colonies carrying pET14b, pET14b-PnAS1, pET14b-PnAS2, or pET14b-PnAS3 were cultured on solid agar M9 medium supplemented with a 1:100 dilution of 100 mg L−1 ampicillin and 0.1 mM IPTG. The optical density of the culture was measured at 600 nm after 3, 6, 9, 12, 24, 36, and 48 h of growth.

2.4. Nitrogen Treatment

Poplar seedlings cultured in vermiculite were supplied with nitrogen-free nutrient solution for 3 days and then subjected to one of the following treatments for 3 h, 12 h, or 72 h: 10 mM NH4NO3, 1 mM NH4NO3, 0.1 mM NH4NO3, 10 mM NH4Cl, 1 mM NH4Cl, 0.1 mM NH4Cl, 10 mM NaNO3, 1 mM NaNO3, or 0.1 mM NaNO3. Seedlings not supplied with nitrogen nutrient solution were treated as controls. To avoid the effects of diurnal rhythm, all samples were collected at the same time.

2.5. RNA Extraction and Quantitative Real-Time PCR Detection

Total RNA was extracted from approximately 100 mg of plant tissue using pBIOZOL Total RNA extraction reagent (BioFlux, Tokyo, Japan) according to the manufacturer’s instructions. Extracted RNA (1 µg) was treated with RNase-free DNase I and then used for single-strand cDNA synthesis with a reverse transcription kit (SYBR Premix Ex Taq; Takara). Real-time PCR was carried out according to a SYBR Green fluorescence-based procedure using UltraSYBR Mixture reagents (CWBIO, Beijing, China). The PCR cycling protocol consisted of an initial denaturation at 95 °C for 10 min, followed by 45 cycles of 95 °C for 15 s and 60 °C for 1 min. After the final cycle, a melting curve analysis was performed over a temperature range of 60–95 °C in increments of 1 °C to verify the reaction specificity. Using the actin gene [27] as a constitutive reference, relative expression was measured by the 2−ΔΔCt method [28]. The primers used in this study are given in Table 2.

2.6. Statistical Analysis

At the time of material extraction, three seedlings were mixed for treatment under the same treatment conditions, and three replicates, each composed of one group of mixed samples, were used for subsequent experiments. Values were calculated as means ± SD. Statistical analyses were performed using SPSS Statistics software (version 20). Data were compared by multivariate analysis followed by Duncan’s multiple range test, with a value of p ≤ 0.05 used as the criterion indicating significant differences between studied conditions.

3. Results

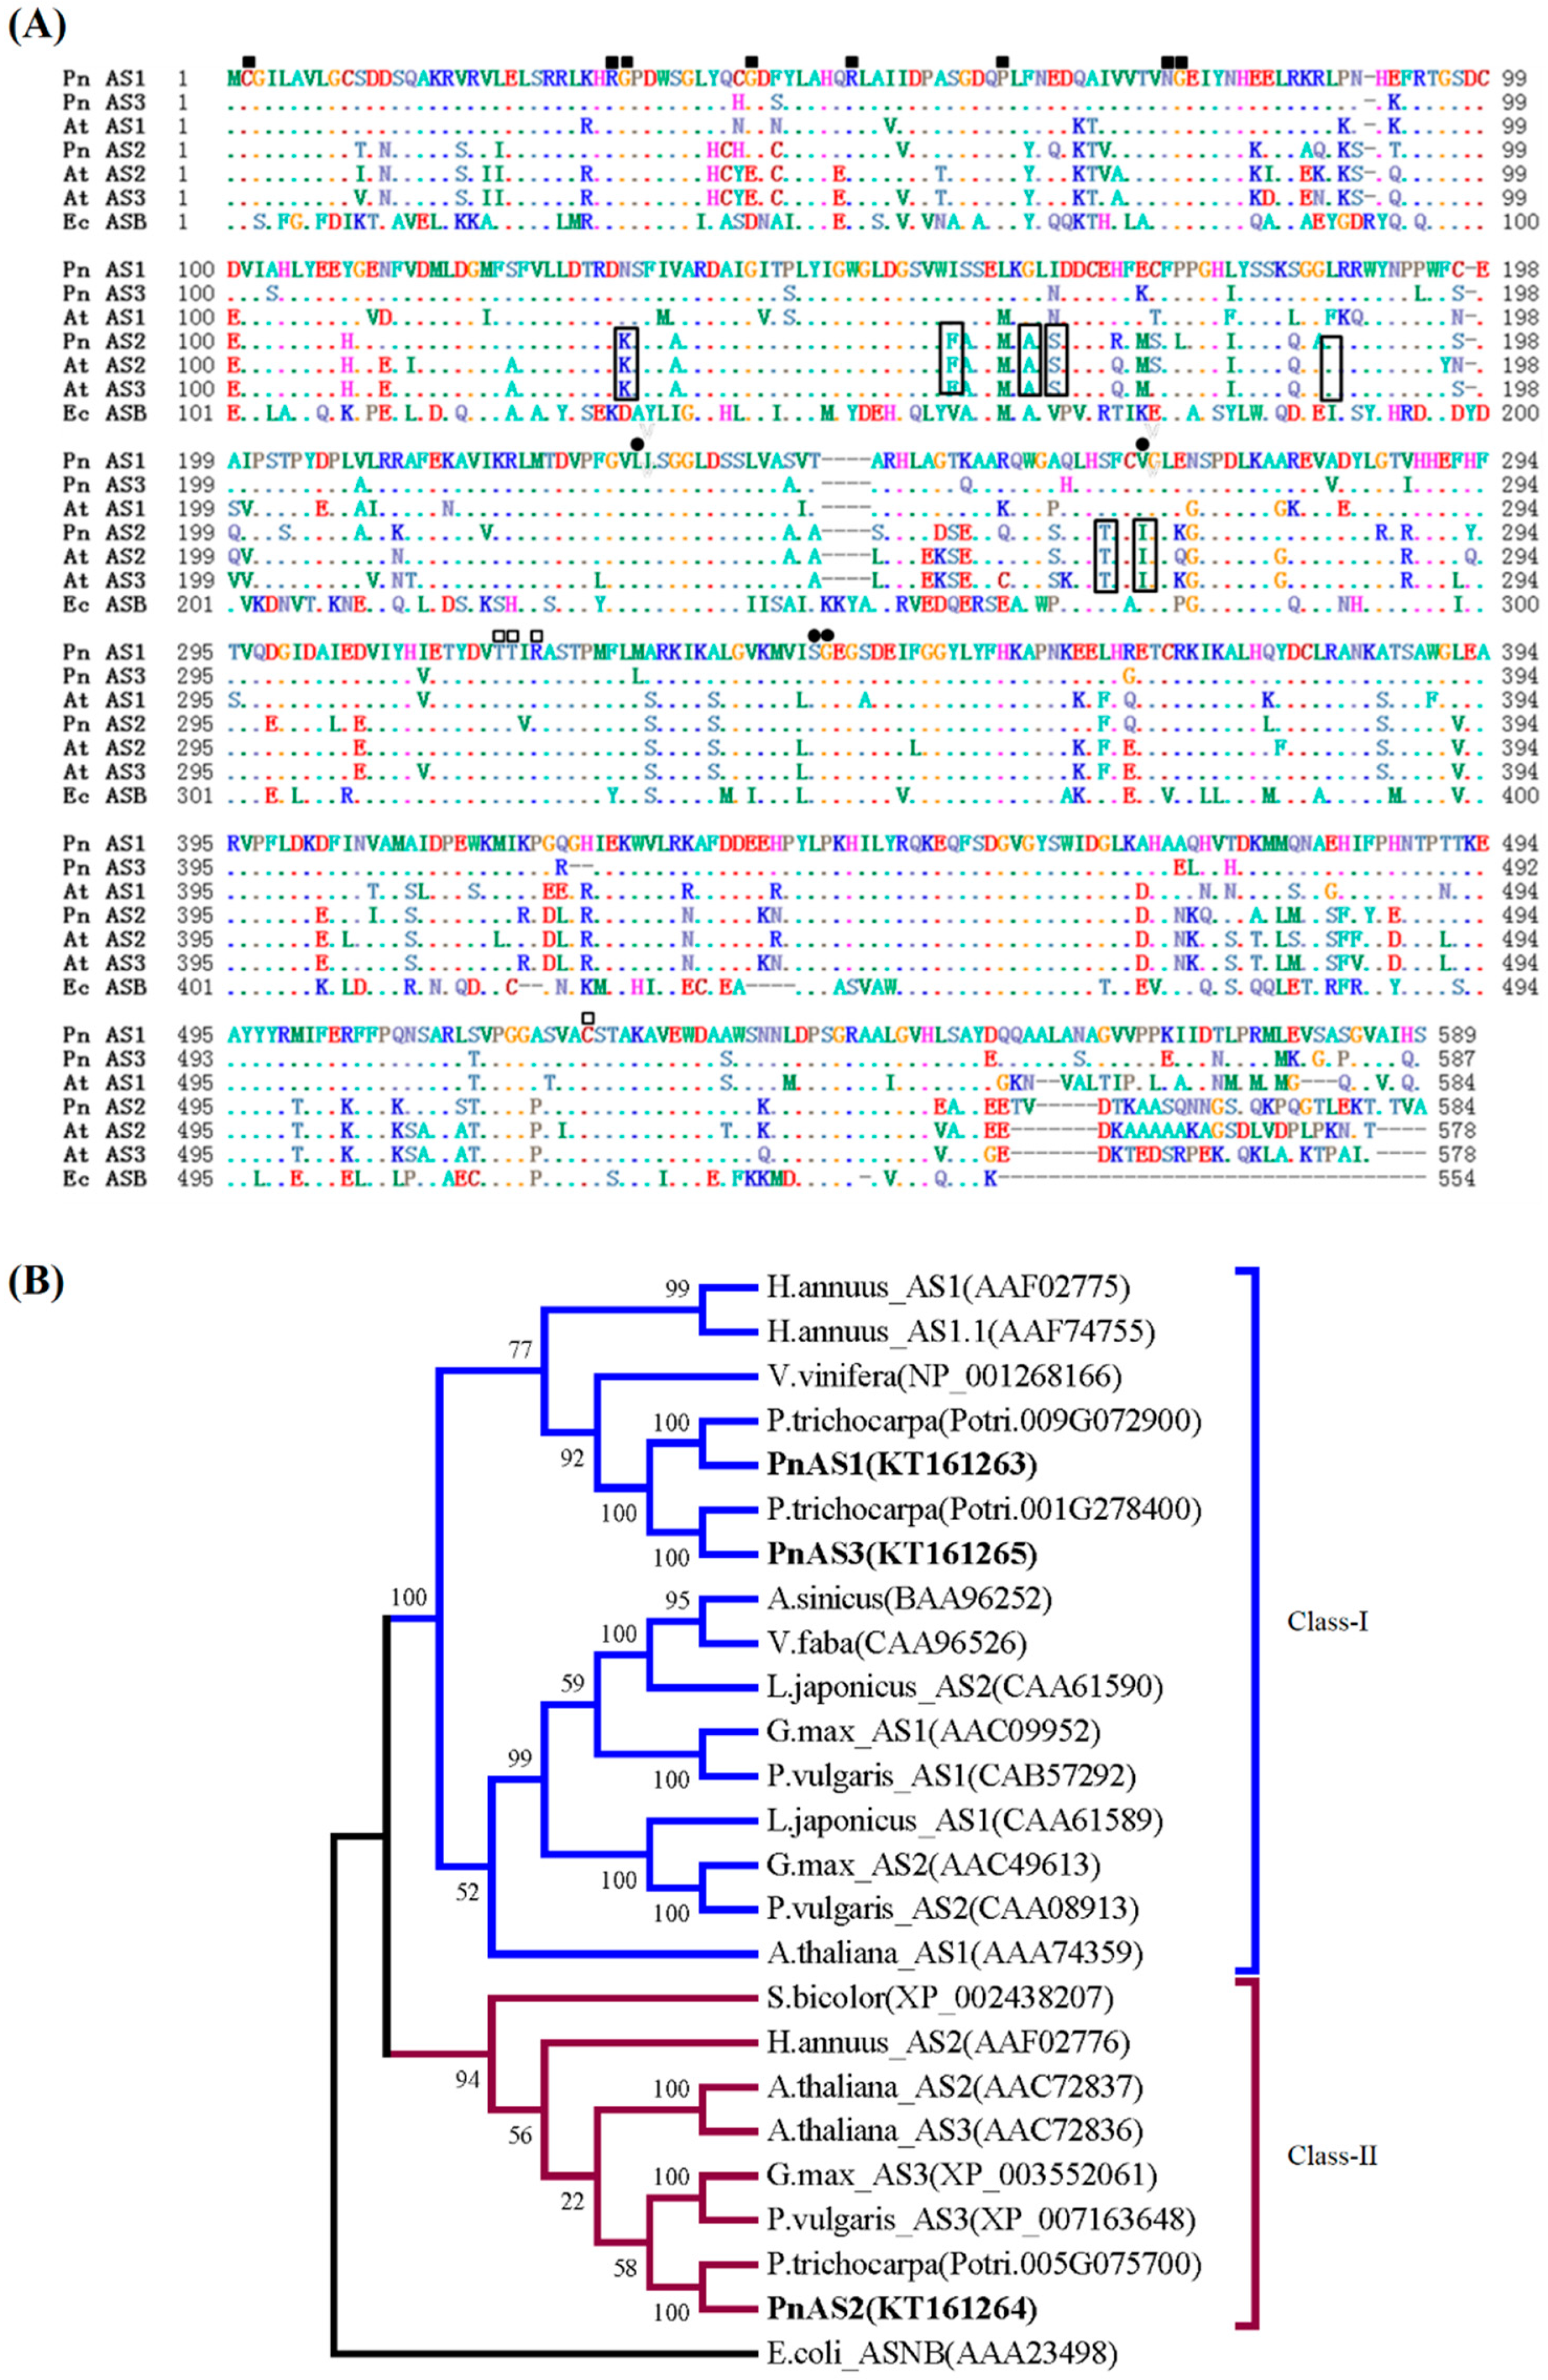
3.1. Sequence Analysis of Asparagine Synthetase Family Members in Populus simonii × P. nigra

By searching the poplar Phytozome database, we obtained three putative asparagine synthetase family members with gene IDs Potri.009G072900, Potri.005G075700, and Potri.001G278400, respectively. Primers were designed for the above three gene sequences, and three full-length coding sequences, designated as PnAS1, PnAS2, and PnAS3, were successfully obtained from the Populus simonii × P. nigra cDNA library (Table 3). Similarities between PnAS1–3 and the homologous Populus trichocarpa sequences were 99%, 99%, and 98%, respectively. Their putative ORF regions comprised 1770, 1755, and 1764 bp, and predicted protein molecular weights were 66, 65.6, and 65.8 KDa. PnAS1–3 proteins and nucleic acids shared 68–95% identity (Table 4).
As shown in Figure 1, the three PnAS genes had glutamine-binding domain (GAT) residues (Met-Cys-Gly-Ile), residues corresponding to the synthetase domain (Cys2, Asp34, and His104), and aspartate-binding sites (Thr315, Thr316, Arg318, and Cys520). Another residue binding to pyrophosphate (between Ser232 and Ser237) and residues necessary for binding to the AMP portion of ATP (Leu230, Ile266, Ser340, and Gly341) [13] were also found to be conserved in all PnAS proteins. According to the results of phylogenetic analysis, PnAS1 and PnAS3 belong to class I, and PnAS2 belongs to class II.

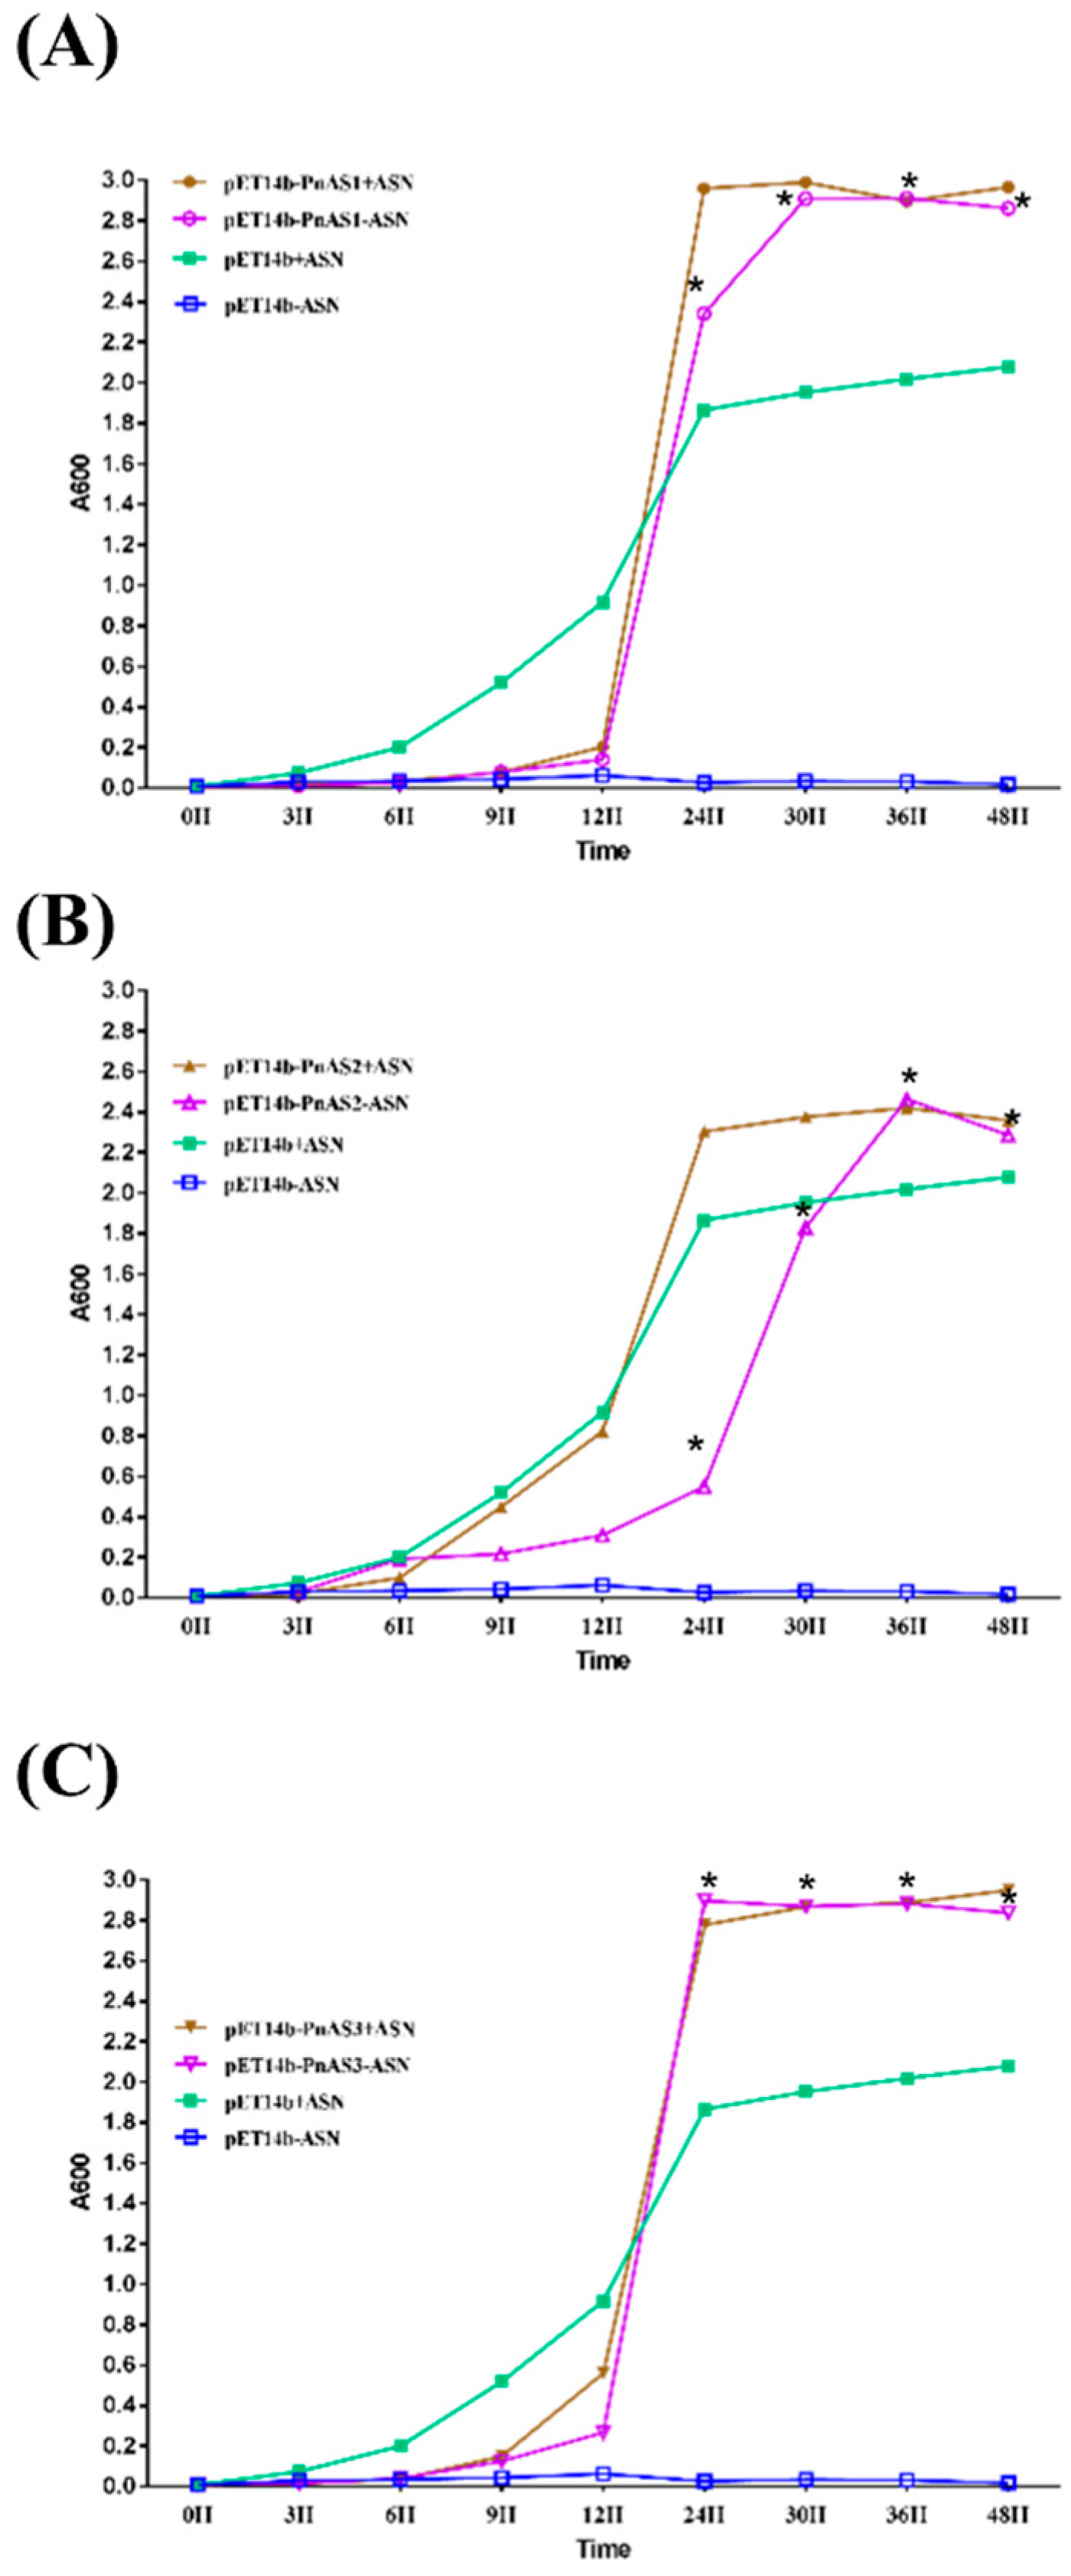
3.2. Asn-Deficient Escherichia coli Complementation Experiment

The newly constructed prokaryotic expression vectors pET-14b, pET-14b-PnAS1, pET-14b-PnAS2, and pET-14b-PnAS3 were transformed into an E. coli auxotrophic ER strain lacking AS activity (asnA, asnB, thi-1, relA, spoT1) [29]. In medium lacking Asn, the growth of E. coli ER transformed with the empty vector was very weak, and the growth curve barely changed. In contrast, the E. coli auxotrophic ER strain transformed with pET-14b-PnAS1, pET-14b-PnAS3, or pET-14b-PnAS2 could be grown in M9 medium without Asn and exhibited an S-type growth curve. These results confirm that all three asparagine syntheases can significantly improve the growth ability of E. coli. (Figure 2).
The E. coli auxotrophic ER strain transformed with pET-14b-PnAS3 had the highest OD value at 24 h, while the ER strains transformed with pET-14b-PnAS1 or pET-14b-PnAS2 reached their maximum growth at 30 h and 36 h, respectively. These results indicate that PnAS1, PnAS2, and PnAS3 genes play roles in the synthesis of asparagine synthetase and maintained the growth of the E. coli auxotrophic ER strain in the absence of Asn. In addition, the recovery ability of PnAS3 was slightly higher than that of PnAS1 and PnAS2 (Figure 2).

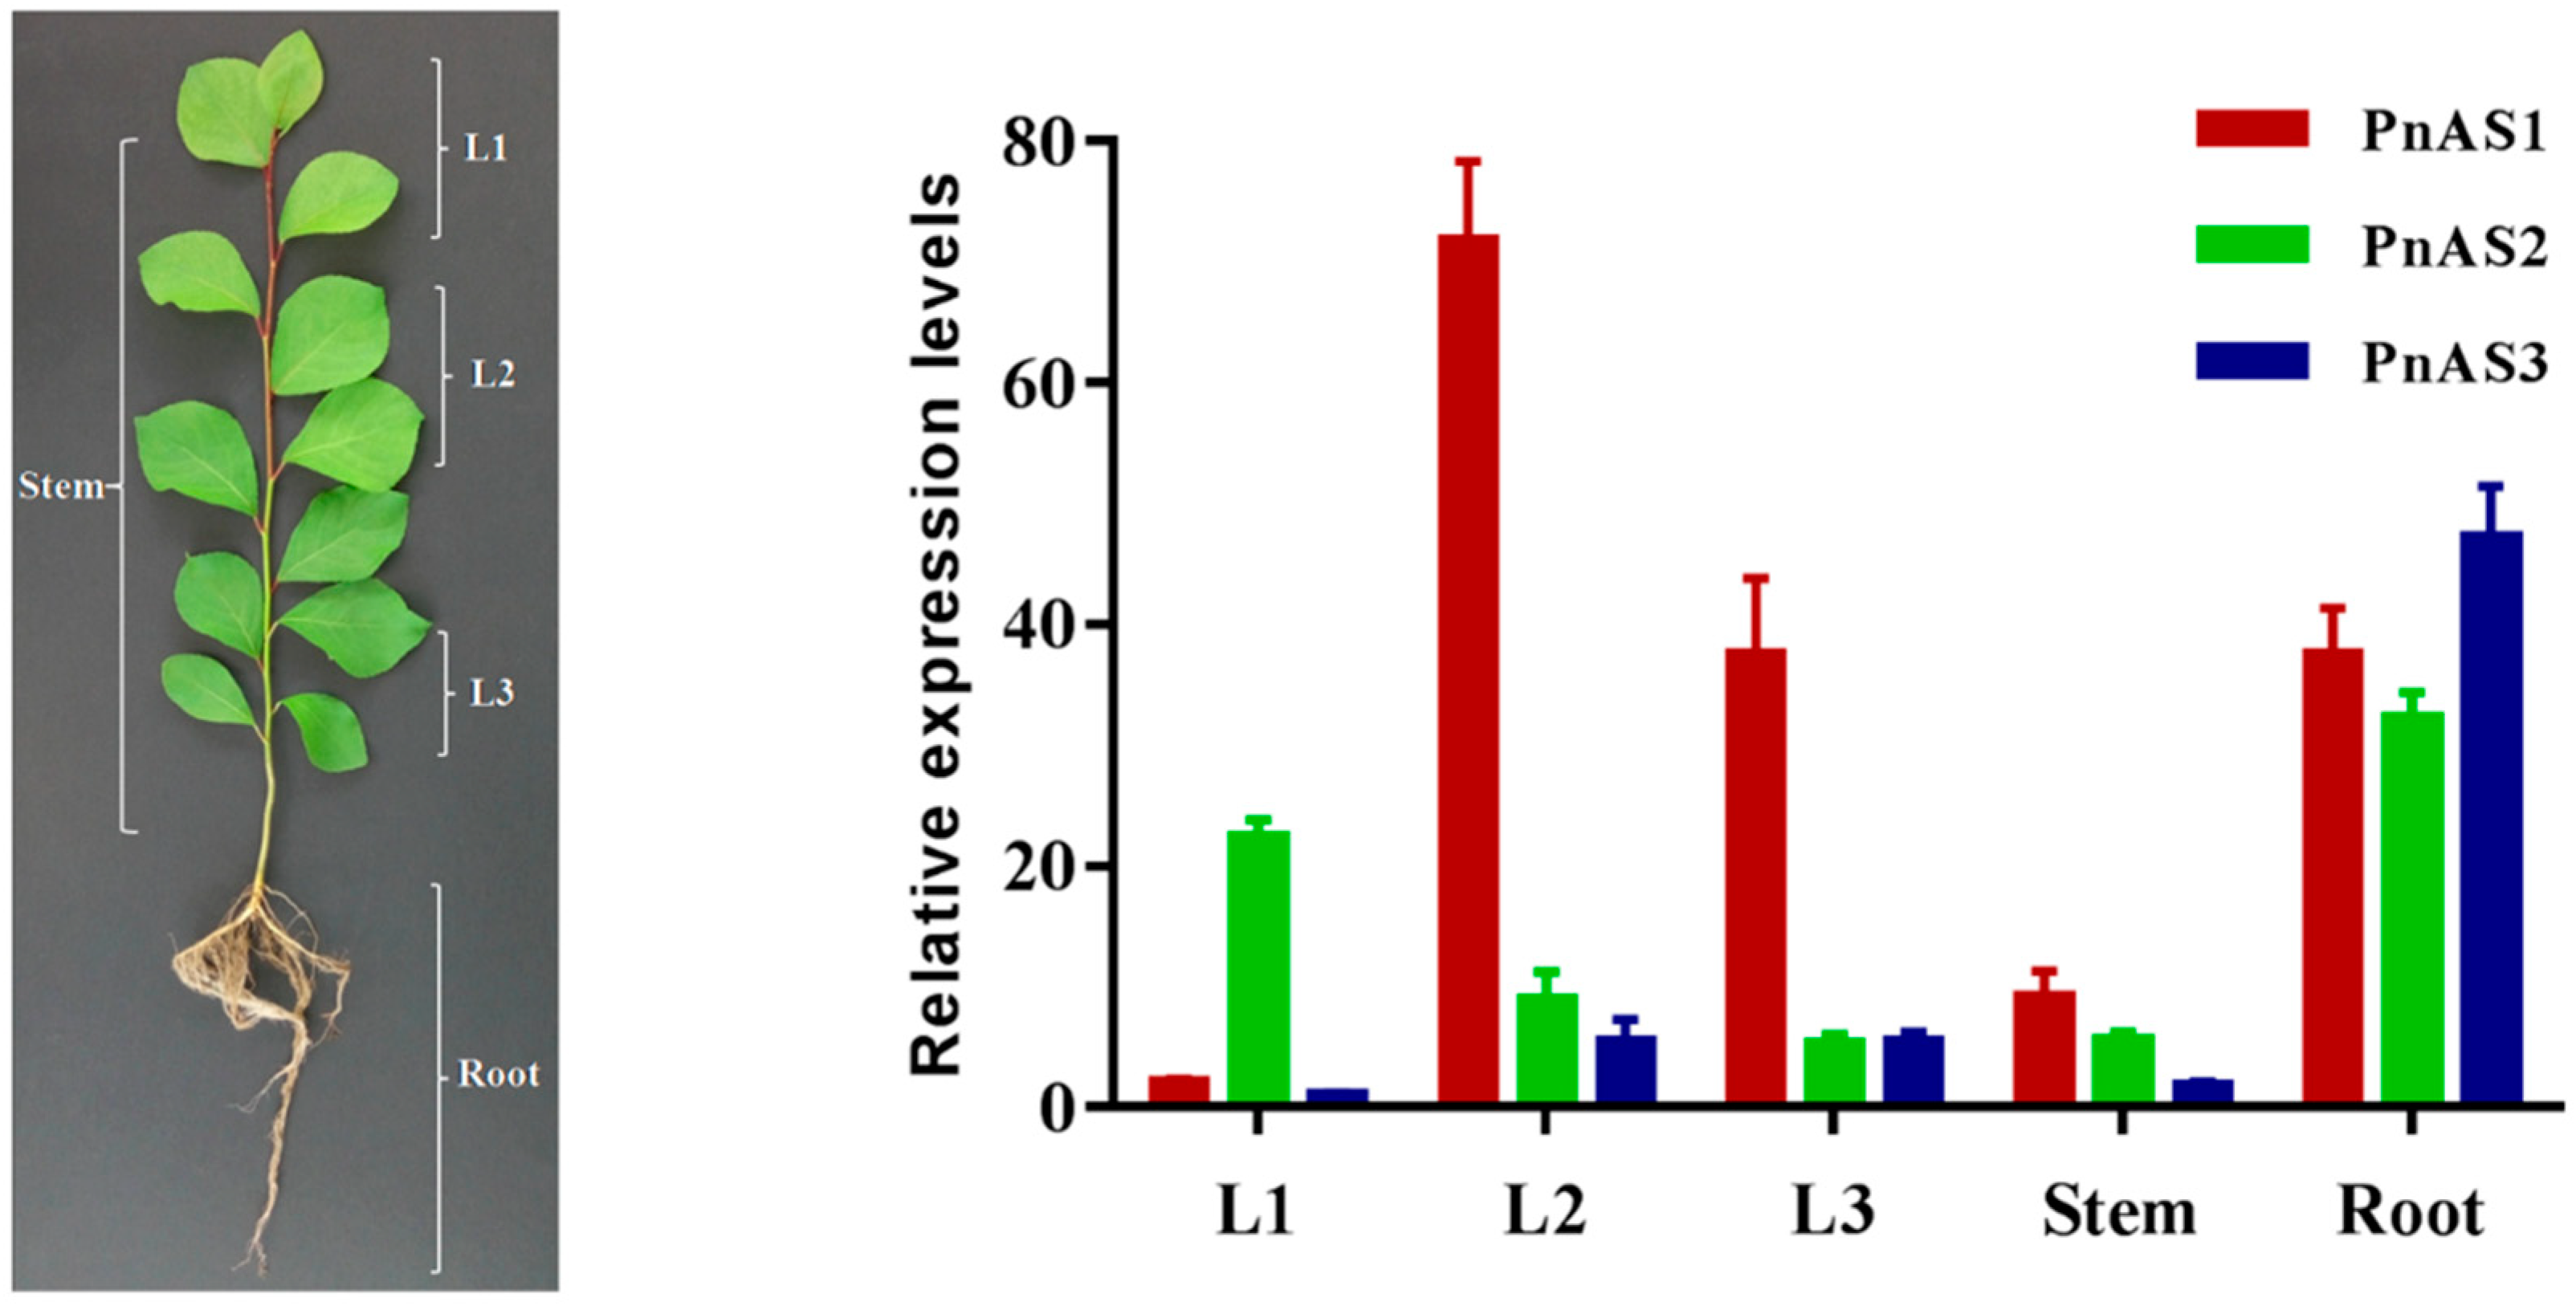
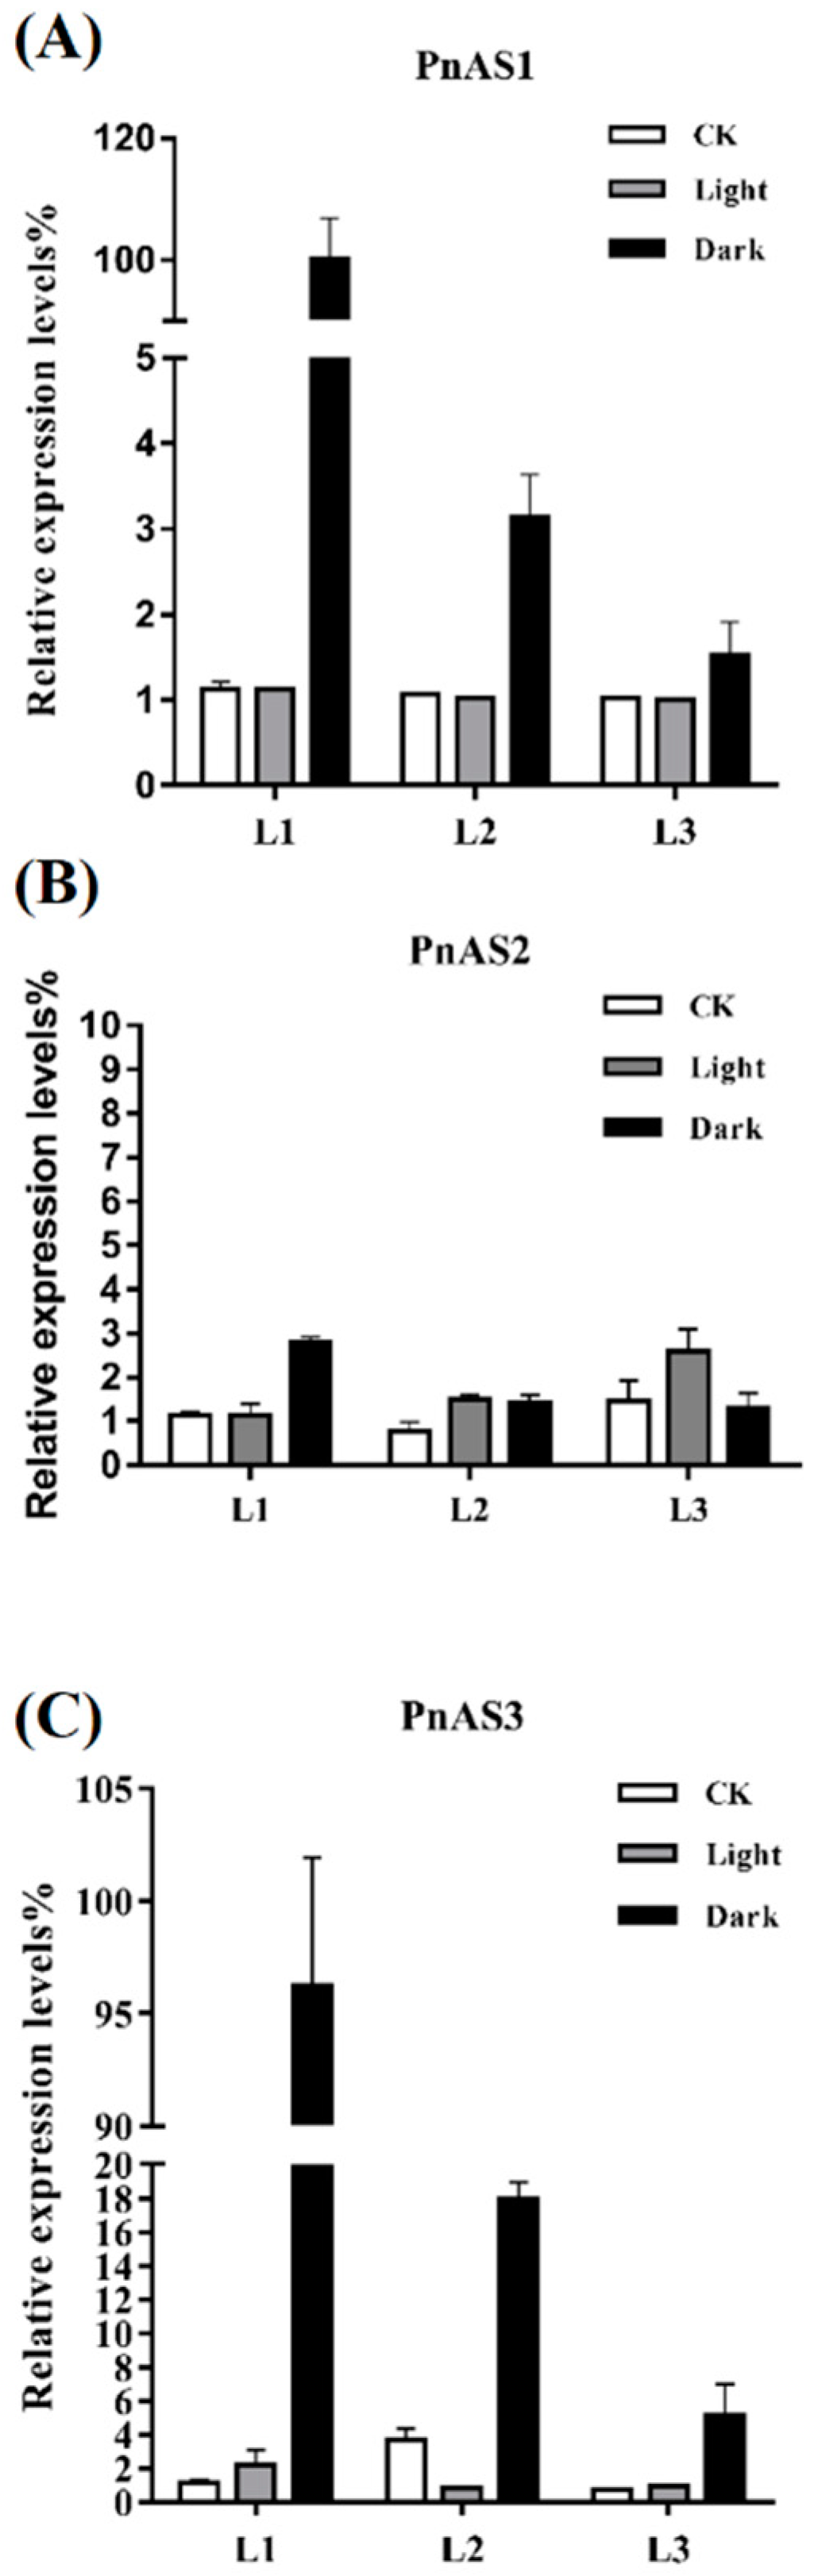
3.3. Spatiotemporal Specific Expression Patterns of the Three AS Genes in Populus simonii × P. nigra

We studied the expression patterns of the three asparagine synthetase genes in Populus simonii × P. nigra by real-time PCR. According to the results, the three genes were expressed in roots, stems, and leaves, but their expression levels were not consistent. PnAS1 gene expression was particularly high in leaves (L2 and L3), especially in L2 leaves, whereas PnAS2 was highly expressed in L1 leaves and in roots. The expression of PnAS3 was low in all tissues except roots (Figure 3).
The effect of diurnal rhythm on the above three genes is shown in Figure 4. In general, the expression levels of PnAS1 and PnAS2 genes varied with time. In L1 leaves, the expression level of PnAS2 was higher than that of PnAS1. In L2 leaves, the expression level of PnAS2 was basically the same as that of PnAS1, except around 3:00 and 15:00. In L3 leaves, the expression of PnAS1 fluctuated, and PnAS2 expression was lower than that of PnAS1. PnAS3 expression levels were low in leaves from the three different positions and were apparently unaffected by diurnal rhythm, consistent with the weak expression of PnAS3 observed in shoots.
At the transcriptional level, the three genes exhibited significant changes under continuous light or dark treatments (Figure 5). In the case of continuous light, the expression levels of PnAS1 at the three different leaf positions were not significantly different from that under a normal photoperiod, but increased significantly under dark treatment. In particular, PnAS1 expression at the L1 leaf position exhibited the greatest increase under dark treatment, followed by L2 and then L3. The expression pattern of PnAS3 was very similar to that of PnAS1, but the expression level of PnAS2 seemed to be unrelated to conditions such as long-term illumination or dark treatment.

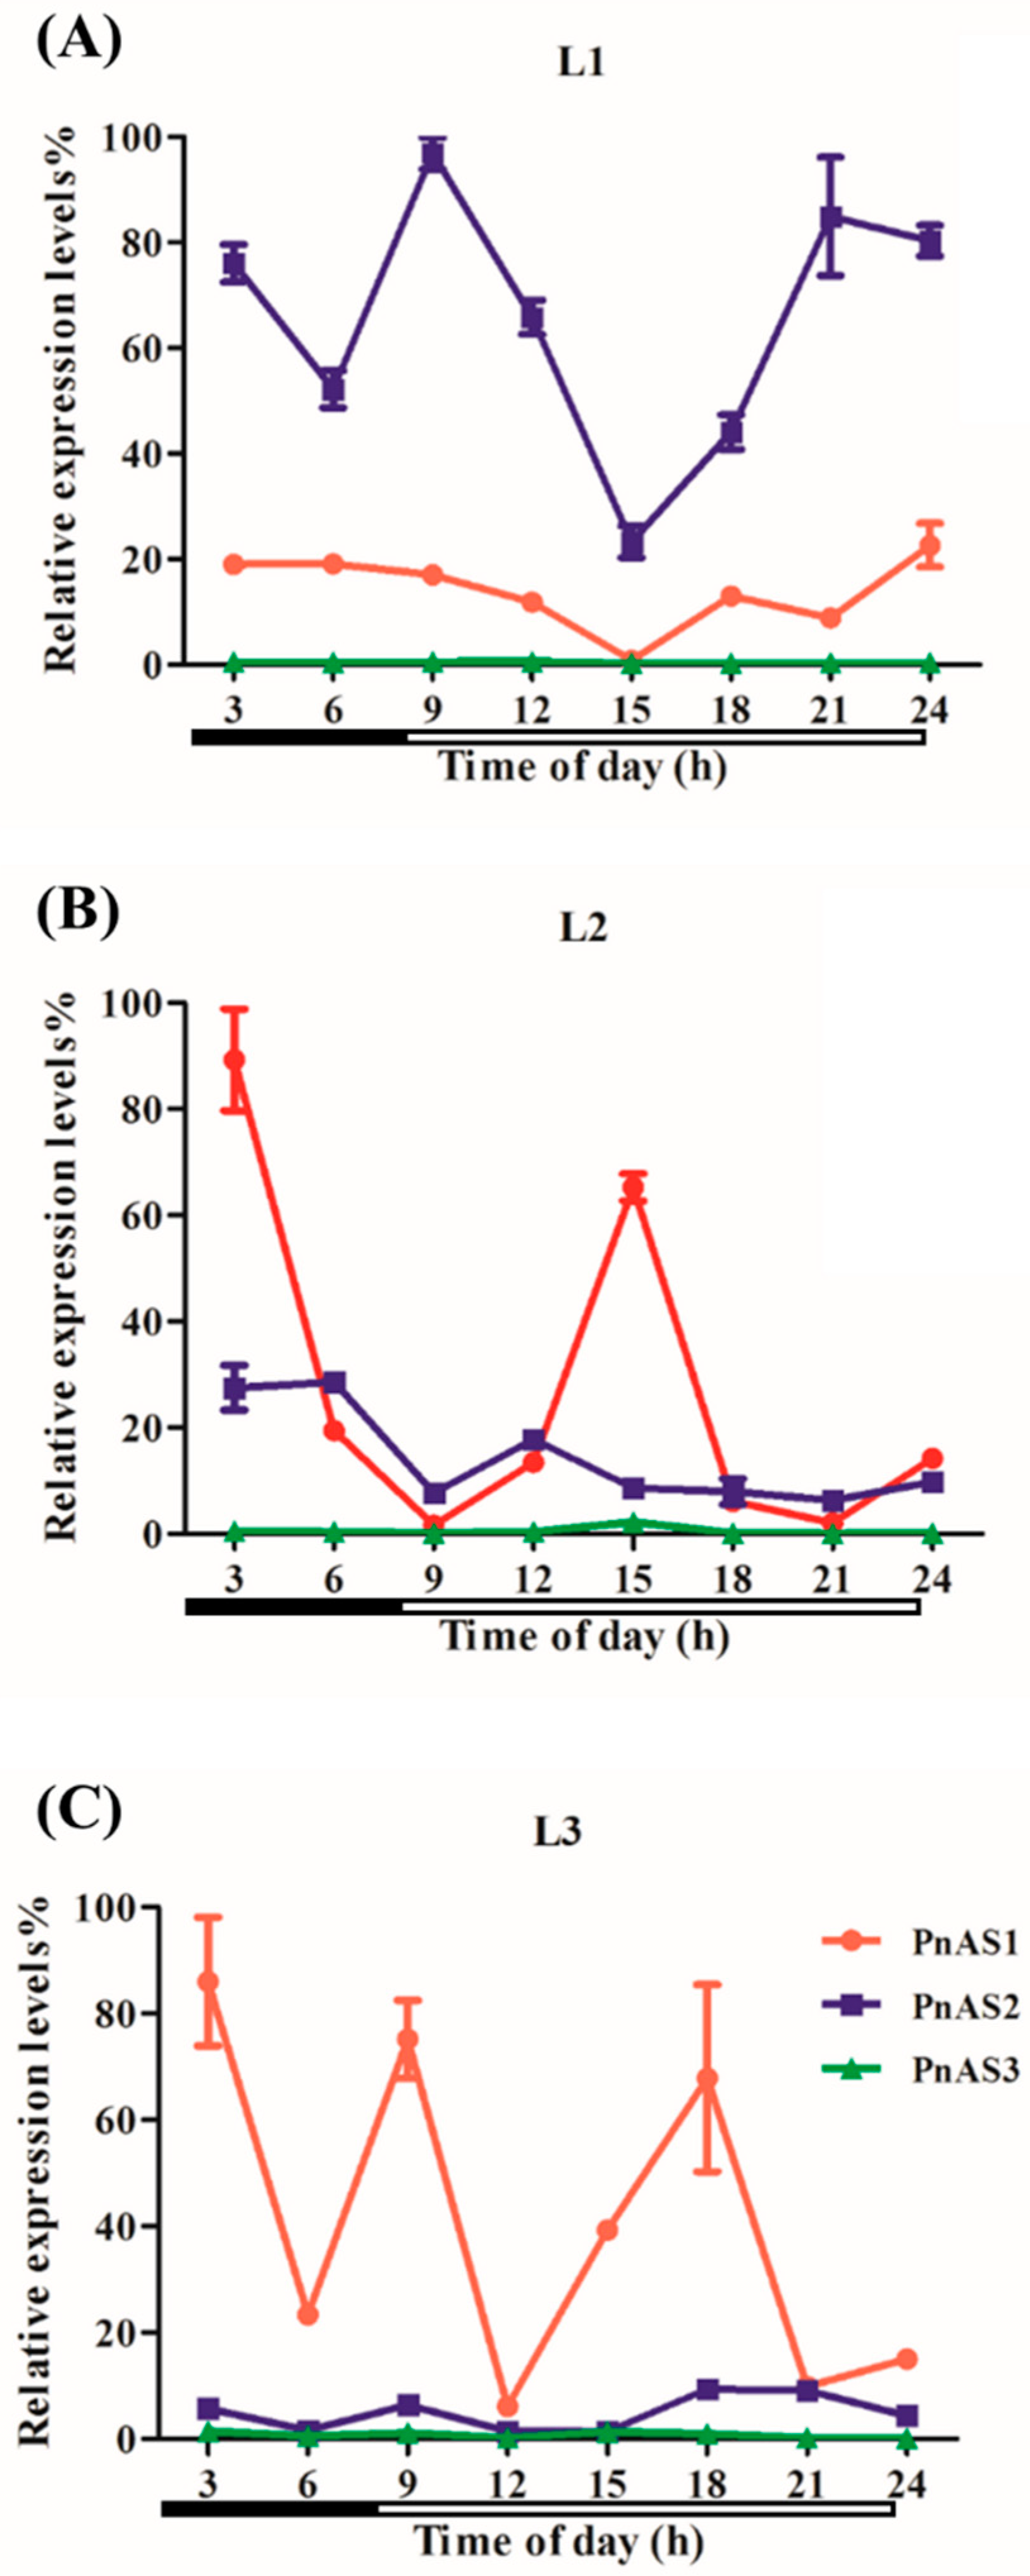
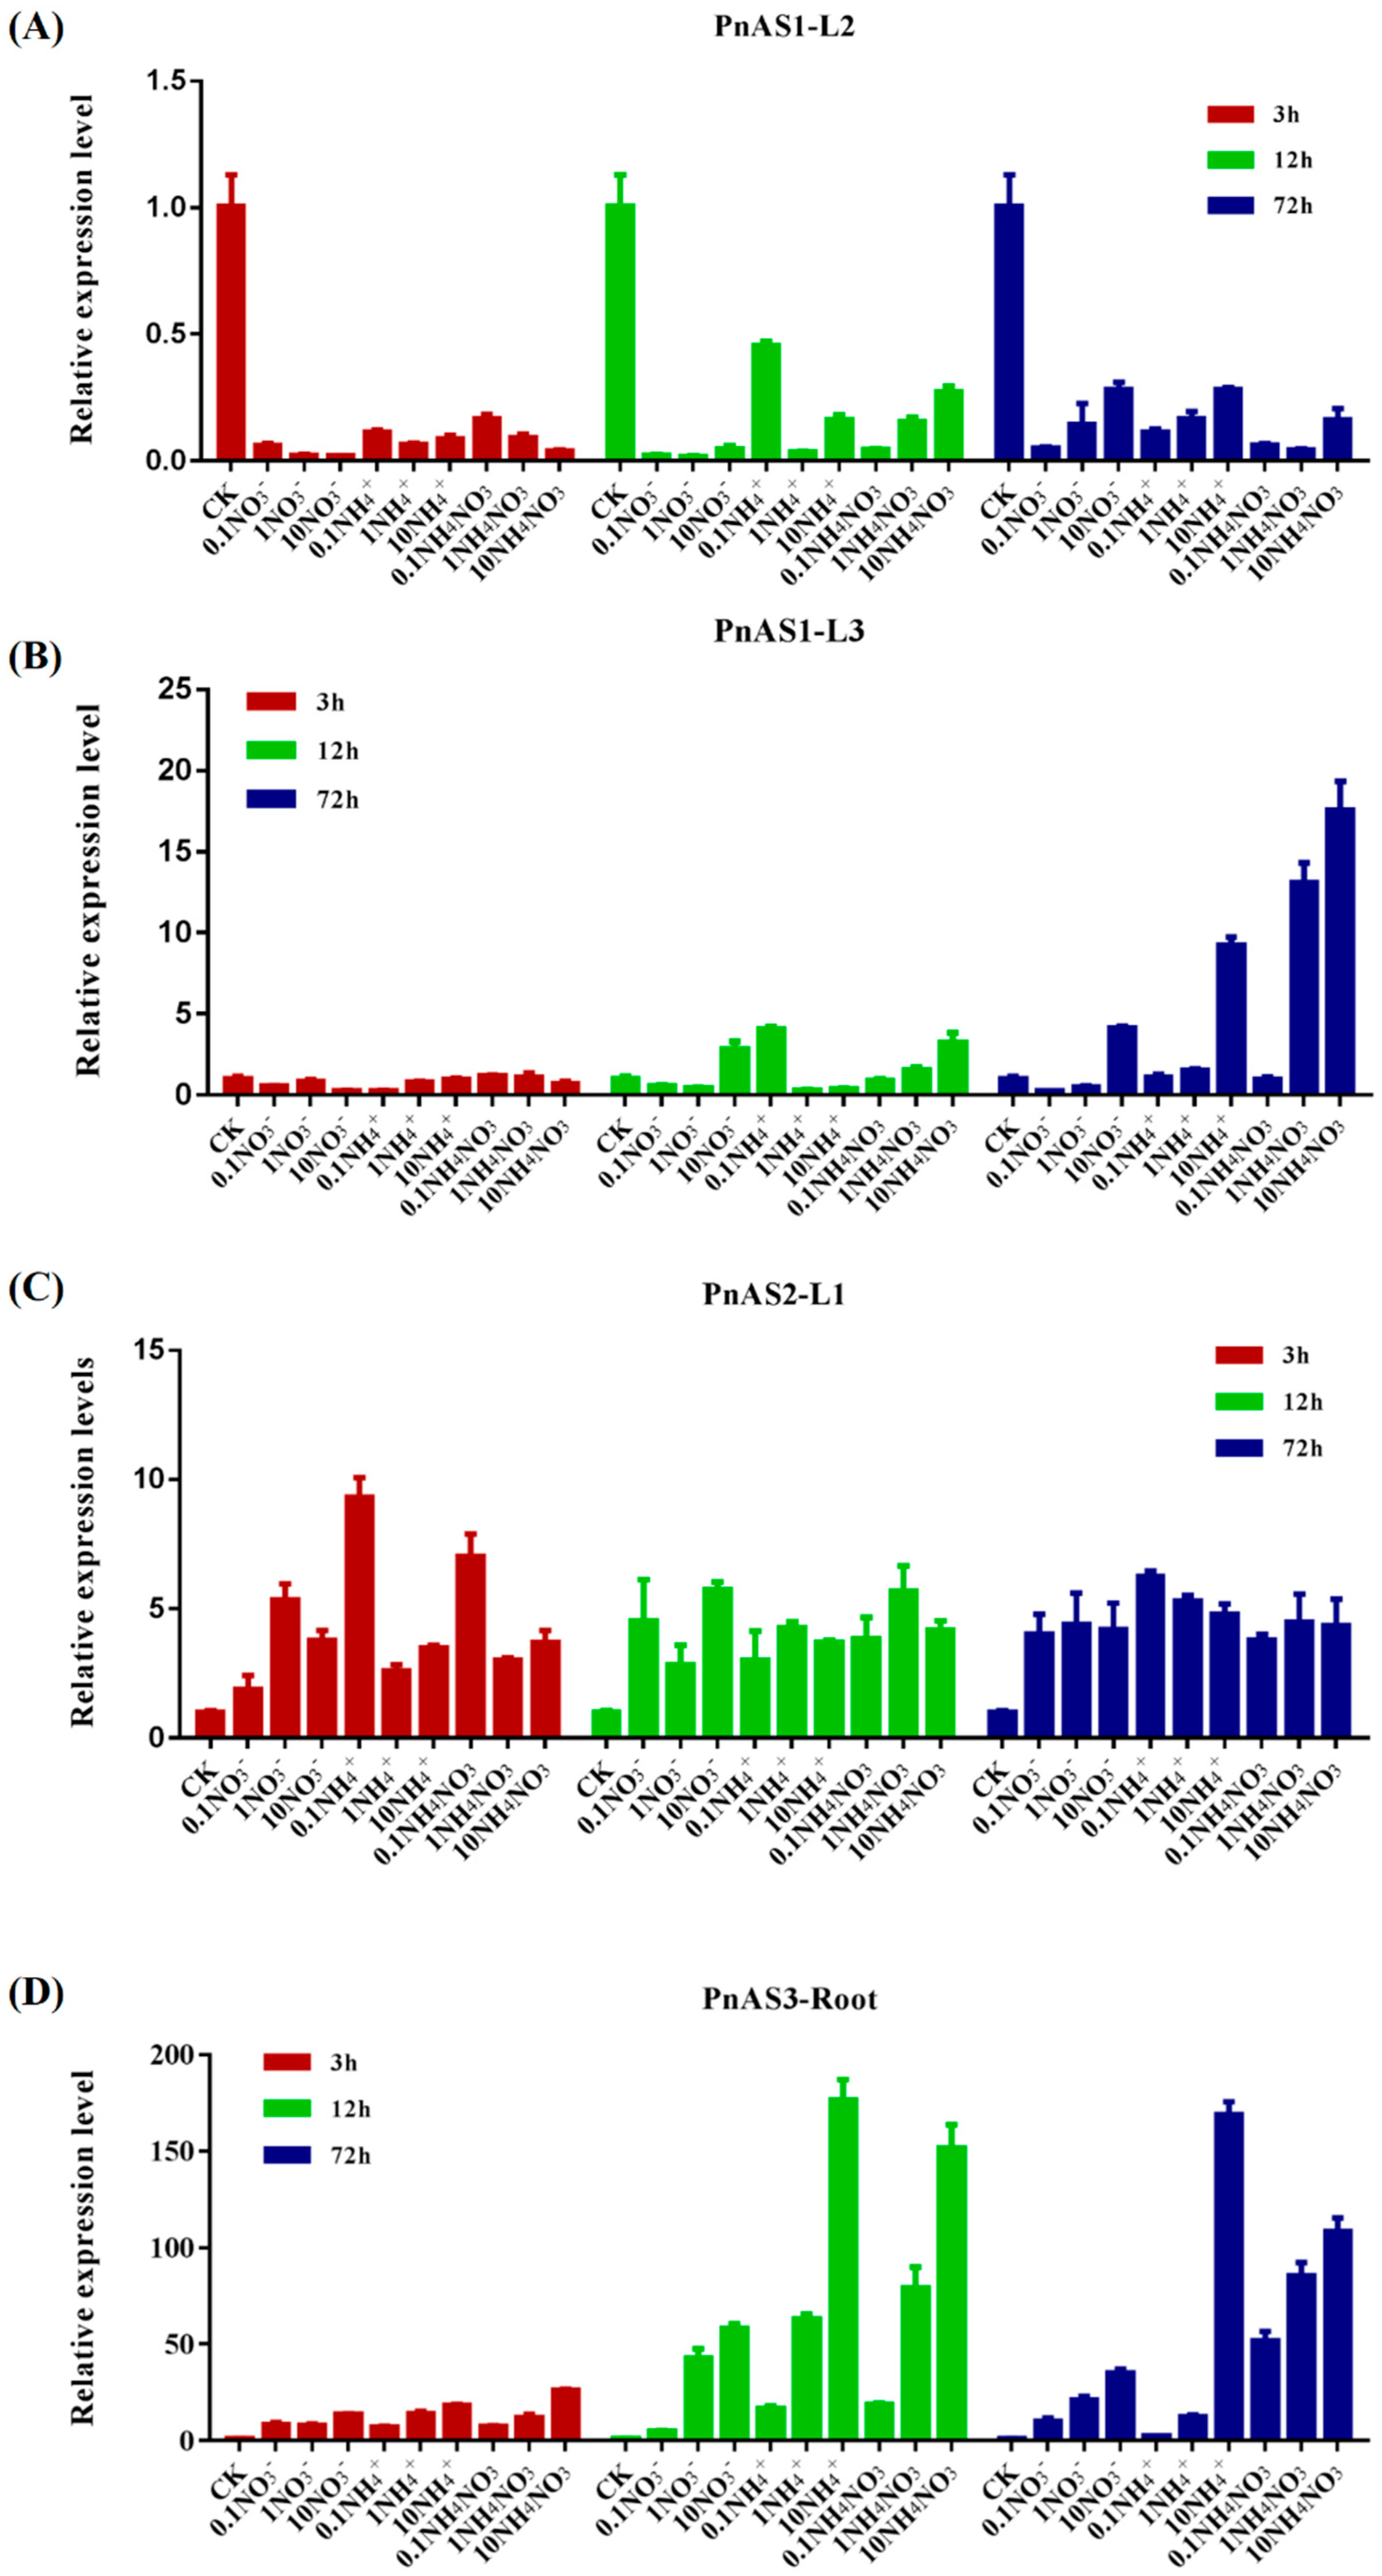
3.4. The Effect of Exogenous Nitrogen on Patterns of Asparagine Synthetase Gene Expression

Asparagine synthetase is closely related to nitrogen assimilation. We therefore treated Populus simonii × P. nigra with different nitrogen forms (ammonium or nitrate) and concentrations and studied the induction of the three asparagine synthetase genes. The results are shown in Figure 6.
Relative changes in PnAS1 expression in response to different nitrogen forms and concentrations are displayed in Figure 6A,B. As shown in the figure, PnAS1 expression was significantly decreased at the L2 position under treatment; in L3 leaves, in contrast, high concentrations of nitrogen (>1 mM) for 72 h increased the expression of PnAS1. As can be seen in Figure 6C, which shows the relative change in PnAS2 expression under different nitrogen forms and concentrations, the gene was induced in L1 leaves by all nitrogen forms and concentrations. Figure 6D shows the relative change in PnAS3 expression under different forms and concentrations of nitrogen; the gene was strongly induced by nitrogen in roots and its expression level was increased, with its expression increasing as the nitrogen treatment was prolonged. These observations indicate that the three members respond differently to external nitrogen treatment, a result possibly related to their different functions.

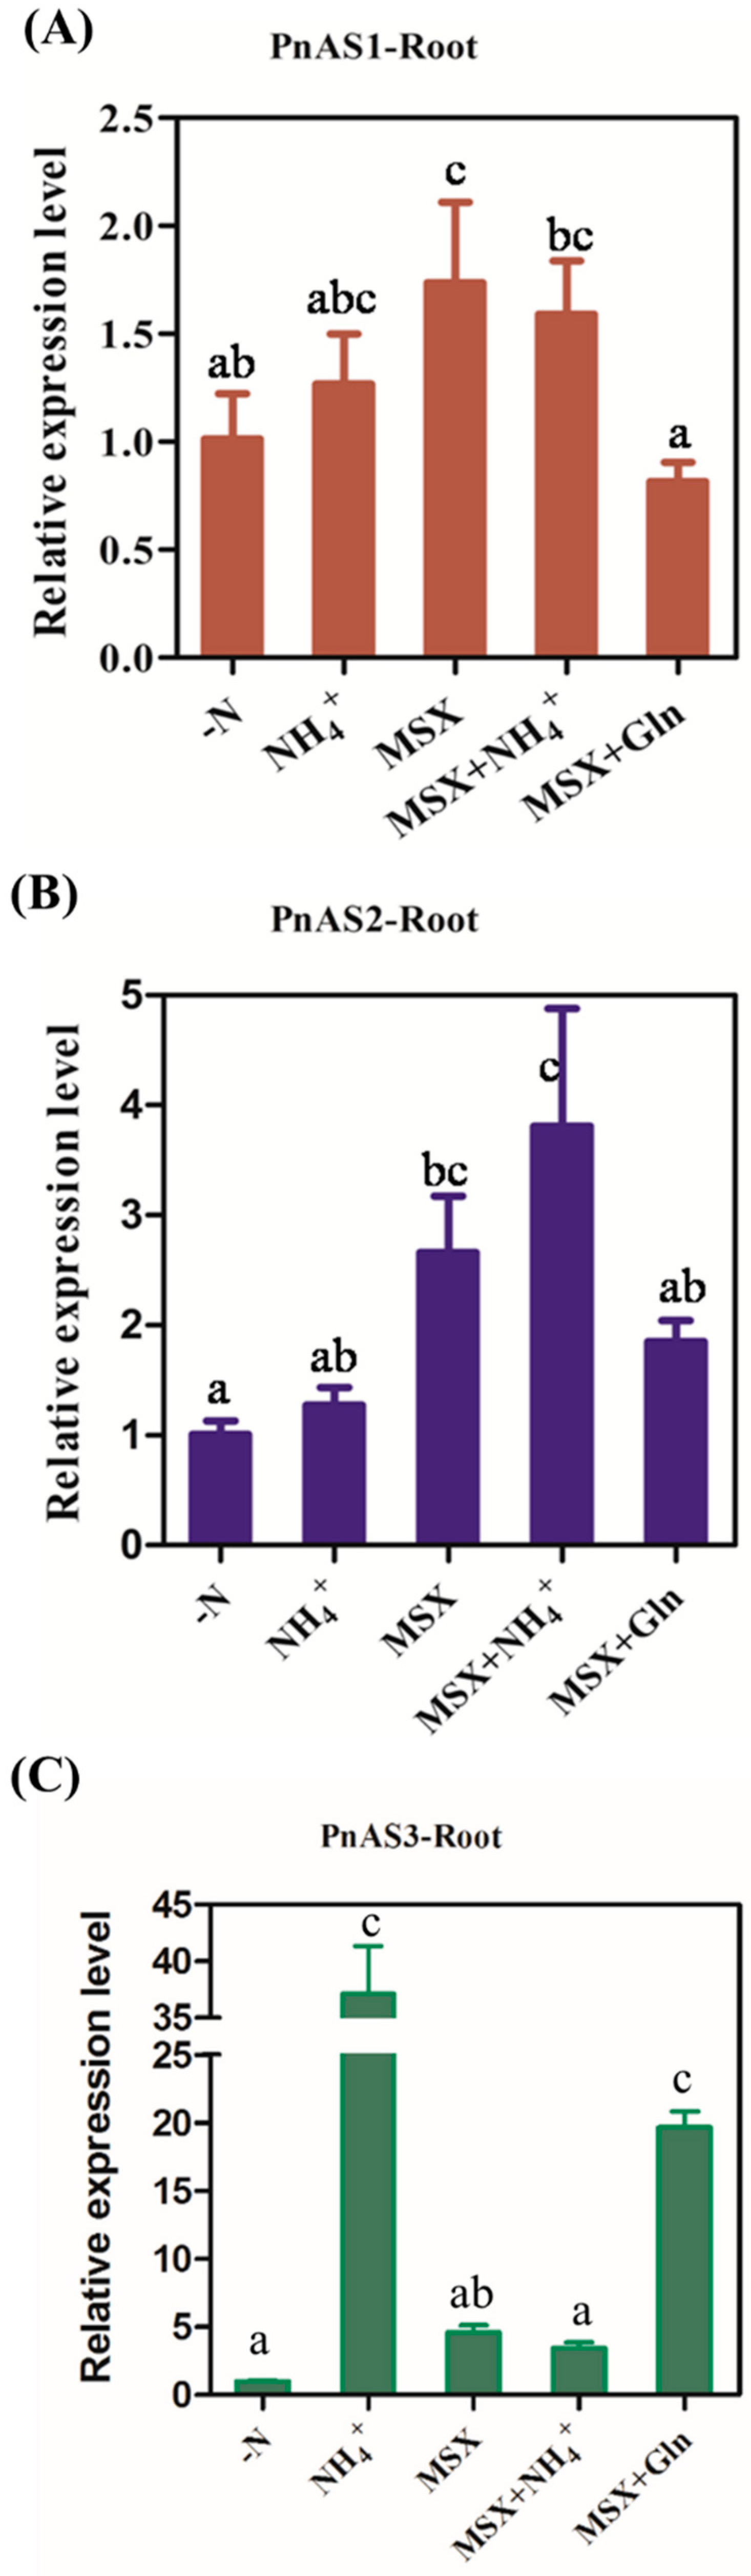
3.5. Expression Trend of PnAS under MSX Treatment

As shown in Figure 7, the PnAS3 gene was strongly induced by NH4+, and its expression level increased. After addition of the glutamine synthetase inhibitor MSX, the expression level of the PnAS3 gene was significantly lower than that observed after addition of NH4+, and its expression could not be restored by exogenous application of NH4+. After the addition of Gln, however, PnAS3 gene expression was still at a high level even in the presence of MSX, which indicates that the expression of PnAS3 is regulated by Gln or Gln derivatives, and the PnAS1 and PnAS2 genes expression level were only slightly increased by NH4+.

4. Discussion

Asparagine synthetase, an aminotransferase encoded by a small gene family, is widely present in plants. Plant asparagine synthetases can be classified into two categories, namely Class I and Class II [16,17]. Asparagine synthetase uses NH4+ or Gln to synthesize Asn, which plays an important role in nitrogen metabolism and transportation and is one of the main compounds involved in nitrogen transport in plants. The transportation of asparagine allows the required amide nitrogen to be shuttled to different positions in plants [20,30].
Previous studies have found that exogenous nitrogen sources are also one of the main factors regulating the expression of AS genes [3,23,31]. For example, nitrate nitrogen can induce the expression of PVAS1 and PVAS2 in Phaseolus vulgaris [21] and SAS1, SAS2, and SAS3 in soybean [3]. High concentrations of ammonium are more likely to up-regulate the barley AS gene [32]. In poplar, however, AS gene types and quantities, temporal and spatial expression patterns, and regulation methods are still unclear. In this study, we analyzed three putative poplar PnAS genes and determined that all three play a role in Asn synthesis. Phylogenetic analysis revealed that these three genes belong to the two major classes. According to an analysis of spatiotemporal expression patterns, PnAS1, PnAS2, and PnAS3 had their highest expressions in old leaves, new leaves, and roots, respectively. PnAS1 and PnAS2 were affected by diurnal rhythm and light/darkness treatments. PnAS1, PnAS2, and PnAS3 were found to be respectively up-regulated in old leaves, new leaves, and roots by exogenous nitrogen. An experiment involving an MSX inhibitor indicated that Gln can induce up-regulation of PnAS3. These experiments lay a foundation for further functional elucidation of poplar AS genes.
Asn is a major nitrogen transport compound in poplar and is important in the process of nitrogen transportation from roots to shoots [33,34,35]. In previous studies, the expression patterns of nitrogen-assimilation related genes were not consistent between different poplar leaf positions [36]. In this study, we therefore divided the leaves into three regions and investigated the differences of PnAS1-3 expression characteristics in each region. We found that the expression levels of the three PnAS family members were not consistent in different tissues. As shown in Figure 3, PnAS1, PnAS2, and PnAS3 had their highest expressions in old leaves, new leaves, and roots, respectively. Previous studies have shown that most AS gene family members in plants exhibit temporal- and spatial-specific expression that is closely related to the functions of these genes in different plant parts [21,37,38]. We therefore speculate that the three family members exert their respective roles in different parts of the plant. As revealed by the results of exogenous nitrogen treatment shown in Figure 6, different forms and concentrations of nitrogen can induce or inhibit high-expression gene family members in certain tissues, consistent with the results of previous studies [3,20,23,31], but the effect on other relatively lowly expressed genes in the same tissue is more complicated.
As shown in Figure 4, the effect of diurnal rhythm on the different AS gene members was not consistent. PnAS2 had the highest expression in L1 leaves, but its expression fluctuated dramatically and decreased between 9:00 and 21:00. In L2 leaves, the expression level of PnAS1 was higher than that of PnAS2 around 3:00 and 15:00; in other time periods, however, the expression of PnAS1 was similar to that of PnAS2. Previous studies have shown that HAS1 and HAS1.1 genes identified in H. annuus exhibit enhanced transcript expression under dark conditions that is inhibited by the addition of sucrose [20]. In Arabidopsis thaliana, light also inhibits the expression of Asn1 mRNA, and sucrose can produce a similar inhibitory effect; plants may thus have some sort of mechanism to sense organic nitrogen and carbon to allow metabolic pathway regulation [19].
Because previous studies have shown that exogenous light and sucrose can cause changes in the expression levels of AS1 and AS2 [16,20], we examined changes in expression patterns of genes such as PnAS1 and PnAS2 under long-term light and dark conditions. We observed that PnAS1 and PnAS3 expressions were significantly increased under dark conditions, while PnAS2 expression significantly increased only in L1 leaves under dark conditions (Figure 5). Asparagine and glutamine are the two major nitrogen transport compounds in plants [34,35]. Asparagine has a higher N/C ratio (2N:4C) than glutamine (2N:5C). Under dark conditions, plant photosynthesis stops and sugar content decreases; consequently, the use of asparagine for nitrogen transport is more economical compared with glutamine. PnAS genes are therefore induced by dark conditions, and their increased expressions may be related to the need to synthesize asparagine for plant nitrogen utilization under dark conditions.
Previous studies have shown that both NH4+ and Gln may act as signaling substances to regulate nitrogen assimilation-related genes [39,40]. In plants, NH4+ can be assimilated by glutamine synthetase to form Gln.Some members of the AS family are up-regulated by exogenous nitrogen. For example, Wong et al. found that Arabidopsis AS2 is up-regulated by NH4+ [23], and a similar result has been observed for the AS gene in soybean [3]. After exogenous application of NH4+, the expression level of poplar PnAS3 in roots was significantly increased in our study; after adding the glutamine synthetase inhibitor MSX, however, PnAS3 relative expression was restored to a level close to that before the addition of nitrogen, and this was still true even after applying exogenous NH4+. Even if MSX was present, the expression level of PnAS3 was also up-regulated after the addition of Gln, and its level was nearly the same as that observed when only NH4+ was applied.
PnAS1 and PnAS2 were also up-regulated by NH4+ in roots, but the expression levels of both were increased by the action of MSX. After adding Gln, however, their expression levels did not increase. We hypothesize that poplar PnAS3 is up-regulated by Gln but not by NH4+, while PnAS2 and PnAS1 seem to be more inhibited by Gln. This result indicates that the regulatory patterns of different members of the family are also different. Exogenous Gln and NH4+ may control the expressions of different AS gene family members. The mode of regulation of expressions of the different members vary greatly. Previous studies have also shown that different AS genes have diverse responses to external conditions [16,41,42,43,44].
In summary, we have studied the functions of three presumed asparagine synthetase genes in poplar. We observed that the three putative asparagine synthetases had biological activities and high expression levels in leaves and roots, but their expression patterns in response to exogenous nitrogen were inconsistent. We hypothesize that these genes are regulated differently and that PnAS3 expression is affected by Gln. Because the regulatory modes of these three genes are still unclear, we plan to explore the regulatory mechanisms in more detail and to further reveal the respective functions of poplar asparagine synthetases during nitrogen assimilation and mobilization.

Author Contributions

B.H. and G.L. organized all the experiments. Y.W. and C.Y. collected the samples for gene cloning and library preparation, collated the sequences, and analyzed the data. Z.X. carried out the bioinformatics analysis and compiled the results. C.Q. and G.L. conceived the study and wrote the manuscript. X.X. further coordinated writing of the manuscript and the overall work. All the authors have read and approved the final manuscript.

Funding

This study was supported by the National Natural Science Foundation of China (No. 31570648 and 31600534) and the National High Technology Research and Development Program of China (863 Program, 2013AA102702).

Acknowledgments

We express our appreciation to the E. coli Genetic Stock Center (CGSC) for kindly providing the E. coli ER strain.

Conflicts of Interest

The authors declare no conflict of interest.

References

  1. Lea, P.J.; Sodek, L.; Parry, M.A.J.; Shewry, R.; Halford, N.G. Asparagine in plants. Ann. Appl. Biol. 2007, 150, 1–26. [Google Scholar] [CrossRef]
  2. Fukumorita, T.; Chino, M. Sugar, amino acid and inorganic contents in rice phloem sap. Plant Cell Physiol. 1982, 23, 273–283. [Google Scholar]
  3. Antunes, F.; Aguilar, M.; Pineda, M.; Sodek, L. Nitrogen stress and the expression of asparagine synthetase in roots and nodules of soybean (glycine max). Physiol. Plant. 2008, 133, 736–743. [Google Scholar] [CrossRef]
  4. Diaz-Leal, J.L.; Galvez-Valdivieso, G.; Fernandez, J.; Pineda, M.; Alamillo, J.M. Developmental effects on ureide levels are mediated by tissue-specific regulation of allantoinase in phaseolus vulgaris L. J. Exp. Bot. 2012, 63, 4095–4106. [Google Scholar] [CrossRef] [PubMed]
  5. Funayama, K.; Kojima, S.; Tabuchi-Kobayashi, M.; Sawa, Y.; Nakayama, Y.; Hayakawa, T.; Yamaya, T. Cytosolic glutamine synthetase1;2 is responsible for the primary assimilation of ammonium in rice roots. Plant Cell Physiol. 2013, 54, 934–943. [Google Scholar] [CrossRef] [PubMed]
  6. Hayashi, H.; Chino, M. Chemical composition of phloem sap from the uppermost internode of the rice plant. Plant Cell Physiol. 1990, 31, 247–251. [Google Scholar]
  7. Puiatti, M.; Sodek, L. Waterlogging affects nitrogen transport in the xylem of soybean. Plant Physiol. Biochem. 1999, 37, 767–773. [Google Scholar] [CrossRef]
  8. Van Heeke, G.; Schuster, S.M. Expression of human asparagine synthetase in escherichia coli. J. Biol. Chem. 1989, 264, 5503–5509. [Google Scholar]
  9. Davies, K.M.; King, G.A. Isolation and characterization of a cdna clone for a harvest-induced asparagine synthetase from asparagus officinalis L. Plant Physiol. 1993, 102, 1337–1340. [Google Scholar] [CrossRef]
  10. Lam, H.M.; Peng, S.S.; Coruzzi, G.M. Metabolic regulation of the gene encoding glutamine-dependent asparagine synthetase in arabidopsis thaliana. Plant Physiol. 1994, 106, 1347–1357. [Google Scholar] [CrossRef]
  11. Tsai, F.Y.; Coruzzi, G.M. Dark-induced and organ-specific expression of two asparagine synthetase genes in pisum sativum. EMBO J. 1990, 9, 323–332. [Google Scholar] [CrossRef] [PubMed]
  12. Mei, B.; Zalkin, H. A cysteine-histidine-aspartate catalytic triad is involved in glutamine amide transfer function in purf-type glutamine amidotransferases. J. Biol. Chem. 1989, 264, 16613–16619. [Google Scholar]
  13. Mantsala, P.; Zalkin, H. Cloning and sequence of bacillus subtilis pura and guaa, involved in the conversion of imp to amp and gmp. J. Bacteriol. 1992, 174, 1883–1890. [Google Scholar] [CrossRef] [PubMed]
  14. Shi, L.; Twary, S.N.; Yoshioka, H.; Gregerson, R.G.; Miller, S.S.; Samac, D.A.; Gantt, J.S.; Unkefer, P.J.; Vance, C.P. Nitrogen assimilation in alfalfa: Isolation and characterization of an asparagine synthetase gene showing enhanced expression in root nodules and dark-adapted leaves. Plant Cell 1997, 9, 1339–1356. [Google Scholar] [CrossRef]
  15. Galvez-Valdivieso, G.; Alamillo, J.M.; Fernandez, J.; Pineda, M. Molecular characterization of pvas3: An asparagine synthetase gene from common bean prevailing in developing organs. J. Plant Physiol. 2013, 170, 1484–1490. [Google Scholar] [CrossRef]
  16. Herrera-Rodríguez, M.B.; Carrasco-Ballesteros, S.; Maldonado, J.M.; Pineda, M.; Aguilar, M.; Pérez-Vicente, R. Three genes showing distinct regulatory patterns encode the asparagine synthetase of sunflower (helianthus annuus). New Phytol. 2002, 155, 33–45. [Google Scholar] [CrossRef]
  17. Gaufichon, L.; Reisdorf-Cren, M.; Rothstein, S.J.; Chardon, F.; Suzuki, A. Biological functions of asparagine synthetase in plants. Plant Sci. 2010, 179, 141–153. [Google Scholar] [CrossRef]
  18. Parra-Peralbo, E.; Pineda, M.; Aguilar, M. Pvas3, a class-ii ubiquitous asparagine synthetase from the common bean (phaseolus vulgaris). Mol. Biol. Rep. 2009, 36, 2249–2258. [Google Scholar] [CrossRef] [PubMed]
  19. Canales, J.; Rueda-Lopez, M.; Craven-Bartle, B.; Avil, C.; Canovas, F.M. Novel insights into regulation of asparagine synthetase in conifers. Front. Plant Sci. 2012, 3. [Google Scholar] [CrossRef]
  20. Lam, H.M.; Hsieh, M.H.; Coruzzi, G. Reciprocal regulation of distinct asparagine synthetase genes by light and metabolites in arabidopsis thaliana. Plant J. 1998, 16, 345–353. [Google Scholar] [CrossRef]
  21. Osuna, D.; Galvez-Valdivieso, G.; Piedras, P.; Pineda, M.; Aguilar, M. Cloning, characterization and mrna expression analysis of pvas1, a type i asparagine synthetase gene from phaseolus vulgaris. Planta 2001, 213, 402–410. [Google Scholar] [CrossRef] [PubMed]
  22. Osuna, D.; Galvez, G.; Pineda, M.; Aguilar, M. Rt-pcr cloning, characterization and mrna expression analysis of a cdna encoding a type ii asparagine synthetase in common bean. BBA 1999, 1445, 75–85. [Google Scholar] [CrossRef]
  23. Wong, H.K.; Chan, H.K.; Coruzzi, G.M.; Lam, H.M. Correlation of asn2 gene expression with ammonium metabolism in arabidopsis. Plant Physiol. 2004, 134, 332–338. [Google Scholar] [CrossRef]
  24. Rennenberg, H.; Wildhagen, H.; Ehlting, B. Nitrogen nutrition of poplar trees. Plant Biol. 2010, 12, 275–291. [Google Scholar] [CrossRef]
  25. Brunner, A.M.; Busov, V.B.; Strauss, S.H. Poplar genome sequence: Functional genomics in an ecologically dominant plant species. Trends Plant Sci. 2004, 9, 49–56. [Google Scholar] [CrossRef] [PubMed]
  26. Tamura, K.; Peterson, D.; Peterson, N.; Stecher, G.; Nei, M.; Kumar, S. Mega5: Molecular evolutionary genetics analysis using maximum likelihood, evolutionary distance, and maximum parsimony methods. Mol. Biol. Evol. 2011, 28, 2731–2739. [Google Scholar] [CrossRef]
  27. Wu, X.Y.; Yang, H.; Qu, C.P.; Xu, Z.R.; Li, W.; Hao, B.Q.; Yang, C.P.; Sun, G.Y.; Liu, G.J. Sequence and expression analysis of the amt gene family in poplar. Front. Plant Sci. 2015, 6. [Google Scholar] [CrossRef] [PubMed]
  28. Livak, K.J.; Schmittgen, T.D. Analysis of relative gene expression data using real-time quantitative pcr and the 2− δδct method. Methods 2001, 25, 402–408. [Google Scholar] [CrossRef] [PubMed]
  29. Felton, J.; Michaelis, S.; Wright, A. Mutations in two unlinked genes are required to produce asparagine auxotrophy in escherichia coli. J. Bacteriol. 1980, 142, 221–228. [Google Scholar]
  30. Waterhouse, R.N.; Smyth, A.J.; Massonneau, A.; Prosser, I.M.; Clarkson, D.T. Molecular cloning and characterisation of asparagine synthetase from lotus japonicus: Dynamics of asparagine synthesis in n-sufficient conditions. Plant Mol. Biol. 1996, 30, 883–897. [Google Scholar] [CrossRef]
  31. Herrera-Rodriguez, M.B.; Maldonado, J.M.; Perez-Vicente, R. Light and metabolic regulation of has1, has1.1 and has2, three asparagine synthetase genes in helianthus annuus. Plant Physiol. Biochem. PPB 2004, 42, 511–518. [Google Scholar] [CrossRef]
  32. Avila-Ospina, L.; Marmagne, A.; Talbotec, J.; Krupinska, K.; Masclaux-Daubresse, C. The identification of new cytosolic glutamine synthetase and asparagine synthetase genes in barley (hordeum vulgare l.), and their expression during leaf senescence. J. Exp. Bot. 2015, 66, 2013–2026. [Google Scholar] [CrossRef] [PubMed]
  33. Escher, P.; Eiblmeier, M.; Hetzger, I.; Rennenberg, H. Spatial and seasonal variation in amino compounds in the xylem sap of a mistletoe (viscum album) and its hosts (populus spp. And abies alba). Tree Physiol. 2004, 24, 639–650. [Google Scholar] [CrossRef]
  34. Kato, T. Major nitrogen compounds transported in xylem vessels from roots to top in citrus trees. Physiol. Plant. 2010, 52, 275–279. [Google Scholar] [CrossRef]
  35. Muttucumaru, N.; Keys, A.J.; Parry, M.A.; Powers, S.J.; Halford, N.G. Photosynthetic assimilation of (1)(4)c into amino acids in potato (solanum tuberosum) and asparagine in the tubers. Planta 2014, 239, 161–170. [Google Scholar] [CrossRef] [PubMed]
  36. Castro-Rodriguez, V.; Garcia-Gutierrez, A.; Canales, J.; Avila, C.; Kirby, E.G.; Canovas, F.M. The glutamine synthetase gene family in populus. BMC Plant Biol. 2011, 11, 119. [Google Scholar] [CrossRef] [PubMed]
  37. Galvez-Valdivieso, G.; Osuna, D.; Maldonado, J.M.; Pineda, M.; Aguilar, M. Purification of a functional asparagine synthetase (pvas2) from common bean (phaseolus vulgaris), a protein predominantly found in root tissues. Plant Sci. 2005, 168, 89–94. [Google Scholar] [CrossRef]
  38. Gaufichon, L.; Masclaux-Daubresse, C.; Tcherkez, G.; Reisdorf-Cren, M.; Sakakibara, Y.; Hase, T.; Clement, G.; Avice, J.C.; Grandjean, O.; Marmagne, A.; et al. Arabidopsis thaliana asn2 encoding asparagine synthetase is involved in the control of nitrogen assimilation and export during vegetative growth. Plant Cell Environ. 2013, 36, 328–342. [Google Scholar] [CrossRef]
  39. Lima, J.E.; Kojima, S.; Takahashi, H.; von Wiren, N. Ammonium triggers lateral root branching in Arabidopsis in an AMMONIUM TRANSPORTER1;3-dependent manner. Plant Cell 2010, 22, 3621–3633. [Google Scholar] [CrossRef]
  40. Patterson, K.; Cakmak, T.; Cooper, A.; Lager, I.; Rasmusson, A.G.; Escobar, M.A. Distinct signalling pathways and transcriptome response signatures differentiate ammonium- and nitrate-supplied plants. Plant Cell Environ. 2010, 33, 1486–1501. [Google Scholar] [CrossRef]
  41. Gao, R.; Curtis, T.Y.; Powers, S.J.; Xu, H.; Huang, J.; Halford, N.G. Food safety: Structure and expression of the asparagine synthetase gene family of wheat. J. Cereal Sci. 2016, 68, 122–131. [Google Scholar] [CrossRef] [PubMed]
  42. Byrne, E.H.; Prosser, I.; Muttucumaru, N.; Curtis, T.Y.; Wingler, A.; Powers, S.; Halford, N.G. Overexpression of gcn2-type protein kinase in wheat has profound effects on free amino acid concentration and gene expression. Plant Biotechnol. J. 2012, 10, 328–340. [Google Scholar] [CrossRef] [PubMed]
  43. Jiang, L.; Ball, G.; Hodgman, C.; Coules, A.; Zhao, H.; Lu, C.G. Analysis of gene regulatory networks of maize in response to nitrogen. Genes Basel 2018, 9, 151. [Google Scholar] [CrossRef] [PubMed]
  44. Todd, J.; Screen, S.; Crowley, J.; Peng, J.X.; Andersen, S.; Brown, T.; Qi, Q.G.; Fabbri, B.; Duff, S.M.G. Identification and characterization of four distinct asparagine synthetase (asns) genes in maize (zea mays l.). Plant Sci. 2008, 175, 799–808. [Google Scholar] [CrossRef]
Figure 1. Sequence and phylogenetic analyses of poplar PnAS proteins. (A) Alignment between PnAS1–3, Arabidopsis AtAS1–3, and Escherichia coli EcASNB protein sequences. Dots indicate identical amino acids, and dashes represent gaps introduced to maximize similarity. Essential residues of glutamine- and aspartate-binding domains are denoted by solid and open squares. Solid circles indicate residues involved in the anchoring of the AMP moiety, and residues in the pyrophosphate-binding area are marked with open circles. Residues conserved in all class-II AS proteins are boxed. (B) Phylogenetic tree of asparagine synthetase sequences from Populus simonii × P. nigra, Arabidopsis thaliana, Escherichia coli, Helianthus annuus, Vitis vinifera, Prunus trichocarpa, Astragalus sinicus, Vicia faba, Lotus japonicus, Glycine max, Phaseolus vulgaris, and Sorghum bicolor. The tree was generated from the aligned sequences by the neighbor-joining method in MEGA5.
Genes 10 00326 g001
Figure 2. Asn-deficient E. coli complementation experiment. Transformed ER strains harboring pET-14b (AC), pET-14b-PnAS1 (A), pET-14b-PnAS2 (B), or pET-14b-PnAS3 (C) were grown in Asn-free and Asn-containing media, and OD values were measured at 0, 3, 6, 9, 12, 24, 30, 36, and 48 h. The asterisk indicates a significant difference in the OD values between the pET-14b-ASN and pET-14b-PnAS1/2/3-ASN groups (p ≤ 0.05).
Genes 10 00326 g002
Figure 3. Relative expression levels of PnAS1, PnAS2, and PnAS3 in different organs of poplar seedlings. The real-time qRT-PCR analysis was performed on total RNA samples extracted from roots (R), stems (S), and leaves from different plant regions, namely, apical bud (L1), intermediate (L2), and more basal (L3) regions. PnAS1 expression levels in L1 were referred to show relative expression.
Genes 10 00326 g003
Figure 4. Changes in expression patterns of three AS genes at (A) L1, (B) L2, (C) L3 leaf positions in response to diurnal rhythm. White bars and black bars represent light and dark phrase, respectively.
Genes 10 00326 g004
Figure 5. Relative expression levels of PnAS1 (A), PnAS2 (B), and PnAS3 (C) under continuous light/dark conditions. The control (CK) reflects expression under a normal photoperiod.
Genes 10 00326 g005
Figure 6. Changes in expression patterns of three AS genes in response to different forms and concentrations of nitrogen. (AD) Changes in expression patterns of the PnAS1 gene at the L2 leaf position (A), the PnAS1 gene at the L3 leaf position (B), the PnAS2 gene at the leaf L1 position (C), and the PnAS3 gene in roots (D).
Genes 10 00326 g006
Figure 7. Expression trends of PnAS1 (A), PnAS2 (B), and PnAS3 (C) in roots after treatment with -N, NH4+, MSX, MSX+NH4+, or MSX+Gln.
Genes 10 00326 g007
Table 1. Primers used for insertion of PnAS coding regions into the prokaryotic expression vector.
NameForward (5′–3′)Reverse (5′–3′)
PnAS1-HFCATGCCATGGGCATGTGTGGGATAATAGTTTAGCGGCCGCCTAACTGTG
PnAS2-HFCCGCTCGAGATGTGCGGCATCCTATAGTTTAGCGGCCGCTCAAGCAACT
PnAS3-HFCATGCCATGGGCATGTGTGGGATAATAGTTTAGCGGCCGCCTAACTTTG
Table 2. Primers used for real-time PCR.
GeneAccession NoForward (5′–3′)Reverse (5′–3′)
PnAS1KT161263TGTTGGAAGTTAGTGCTTCGGGACAACACACGACTTCAAAGGA
PnAS2KT161264ACCAAGGCTGCCAGTCAGAATAACGTACCCTAACTAAAGCGAACGAAA
PnAS3KT161265GAGGACCGAAGTACATGCCCAACAAGGTGCCAACACTACT
ActinXM_002298946CACAACTGCTGAACGGGAAATCAGGGCAACGGAAACACTCT
Table 3. Primers used for cloning of PnAS1–3.
NameForward (5′–3′)Reverse (5′–3′)
PnAS1ATGTGTGGGATACTTGCTGCTAACTGTGGATCGCAAC
PnAS2ATGTGCGGCATCCTCGCTGTCAAGCAACTGTTGCAGT
PnAS3ATGTGTGGGATACTTGCTGTTTCTAACTTTGGATTGCAACTCCTG
Table 4. Protein and nucleic acid sequence similarities between three distinct Populus simonii × P. nigra asparagine synthetases.
PnAS1PnAS3PnAS2
PnAS191%68.80%
PnAS394%69.50%
PnAS280%77.80%
Note: Protein similarities (left side of matrix, bold font) and nucleic acid similarities (right side of matrix, italics) were calculated with NCBI BLAST.

