Effect of Unmanned Aerial Vehicle Flight Height on Droplet Distribution, Drift and Control of Cotton Aphids and Spider Mites


Abstract
:1. Introduction
2. Materials and Methods
2.1. Experimental Site
2.2. Insecticide and Reagents
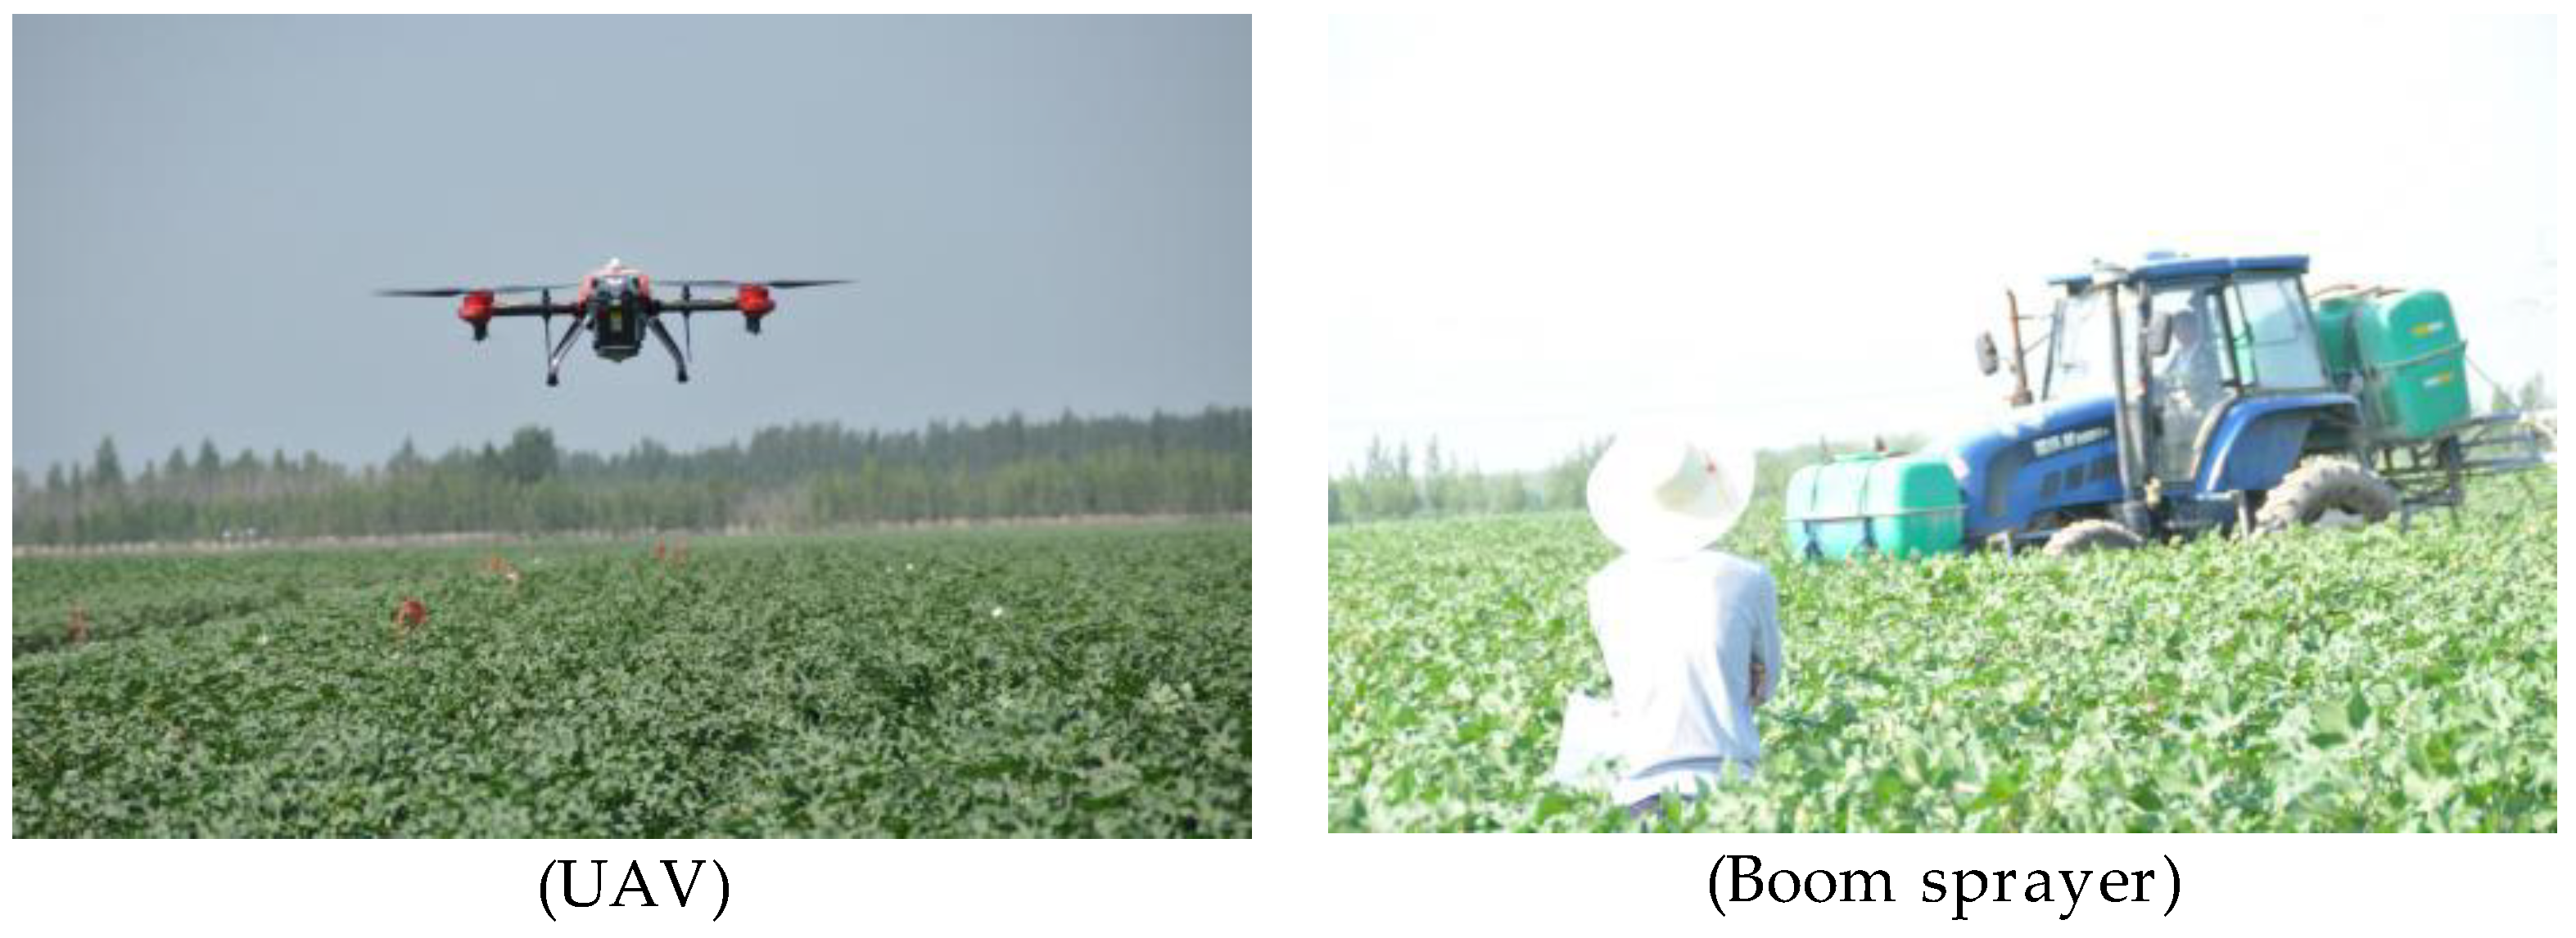
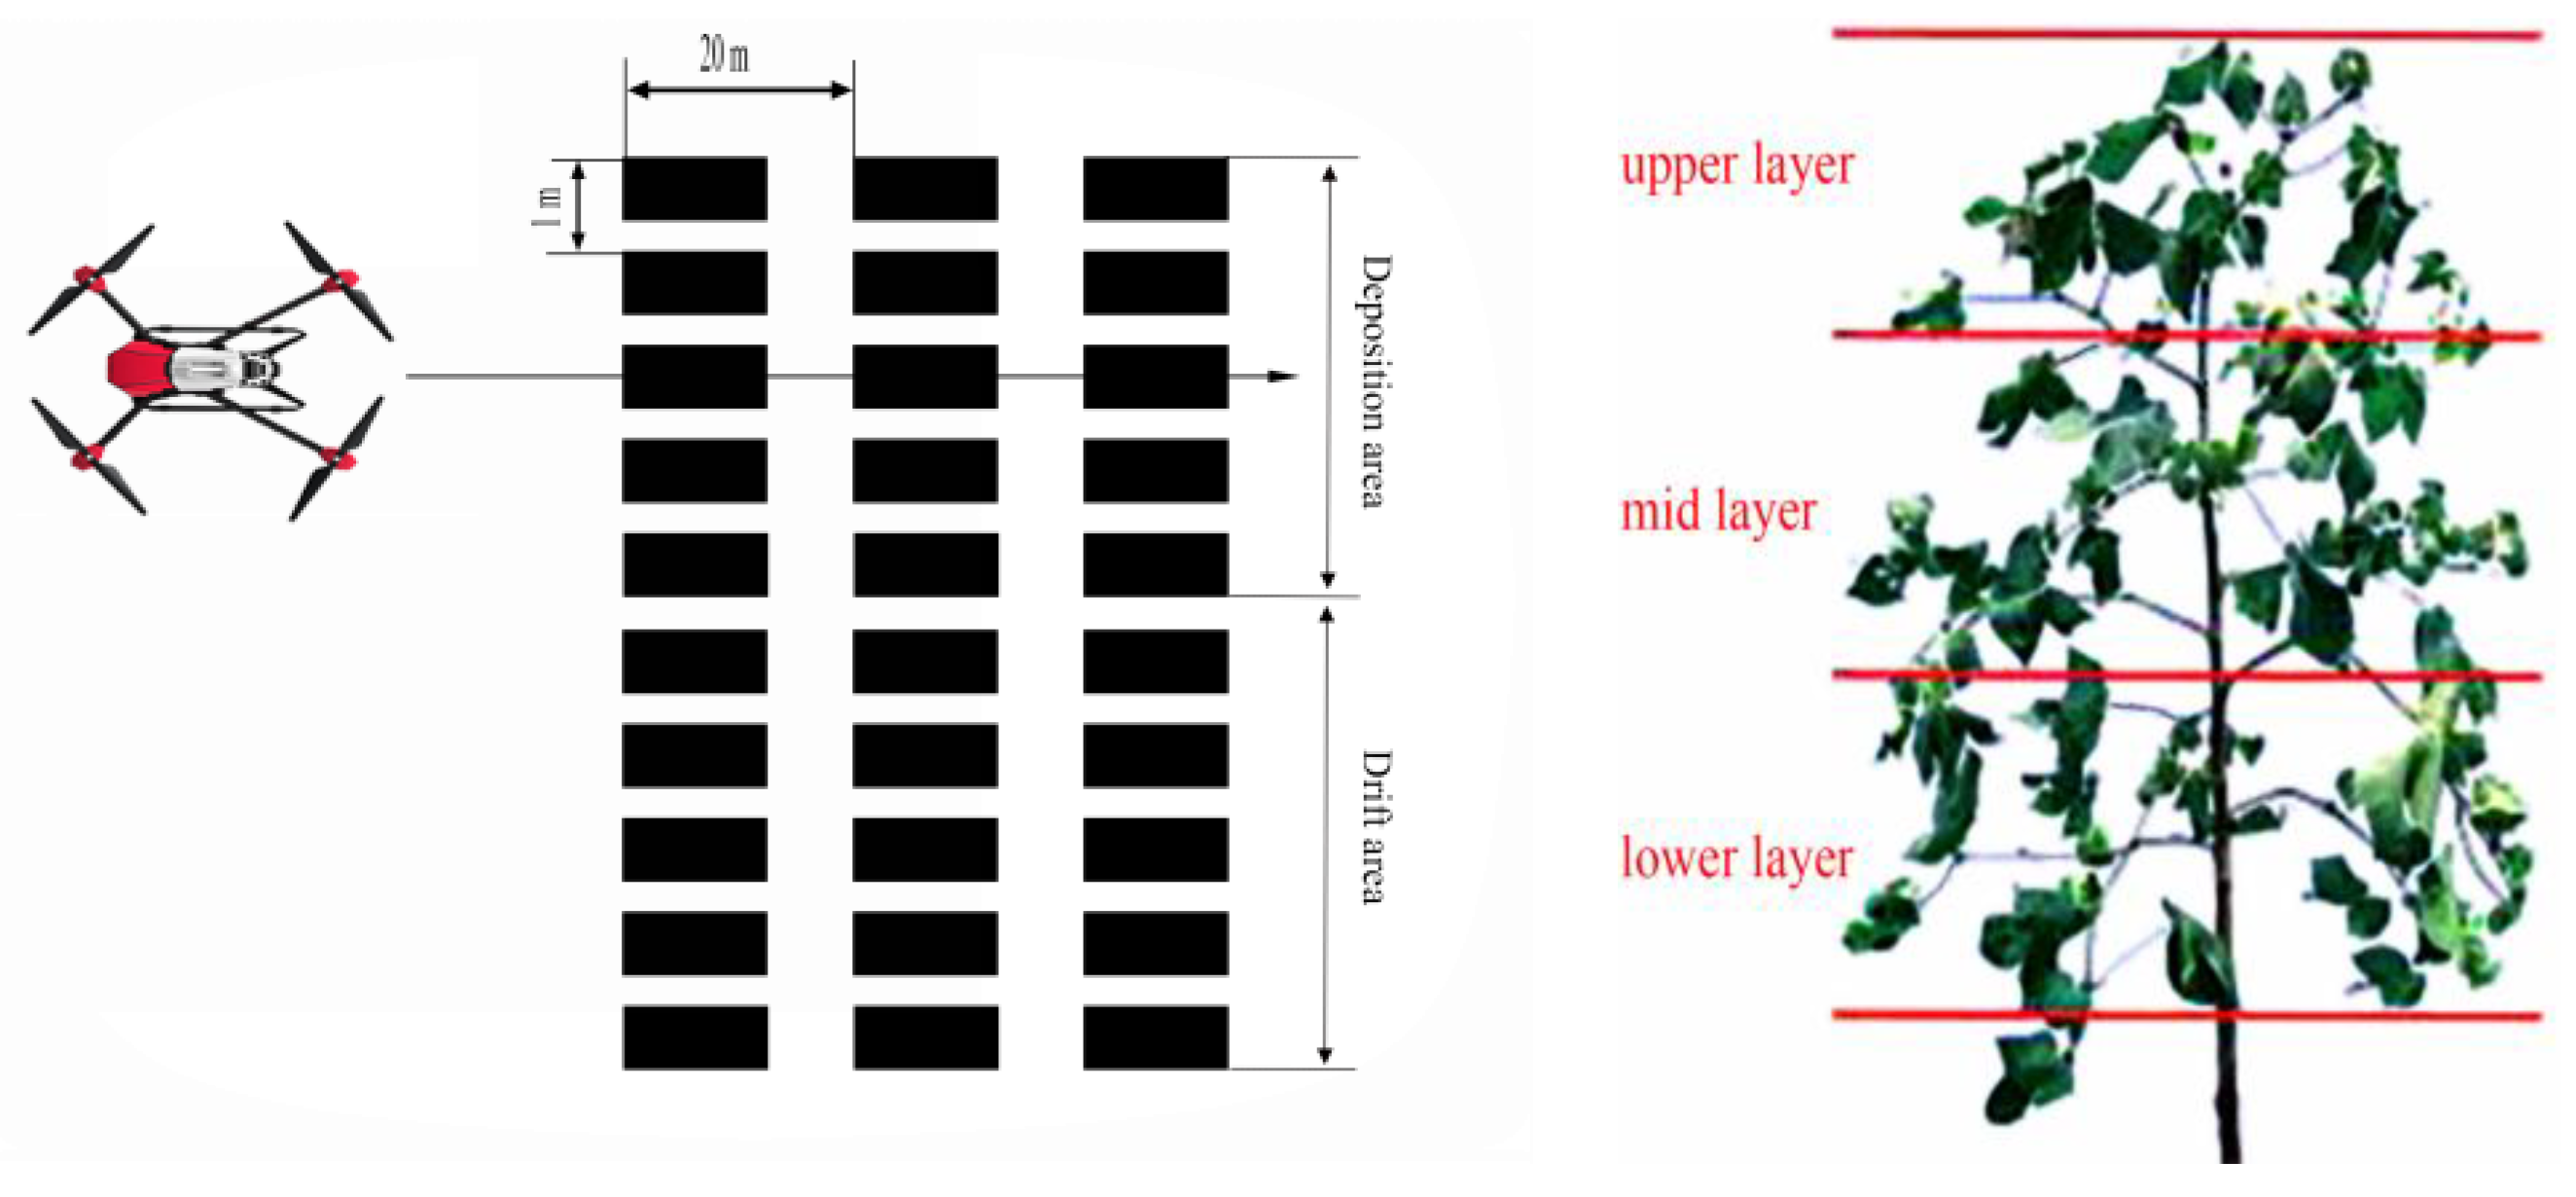
2.3. Experimental Design
2.4. Evaluation of Droplet Deposition
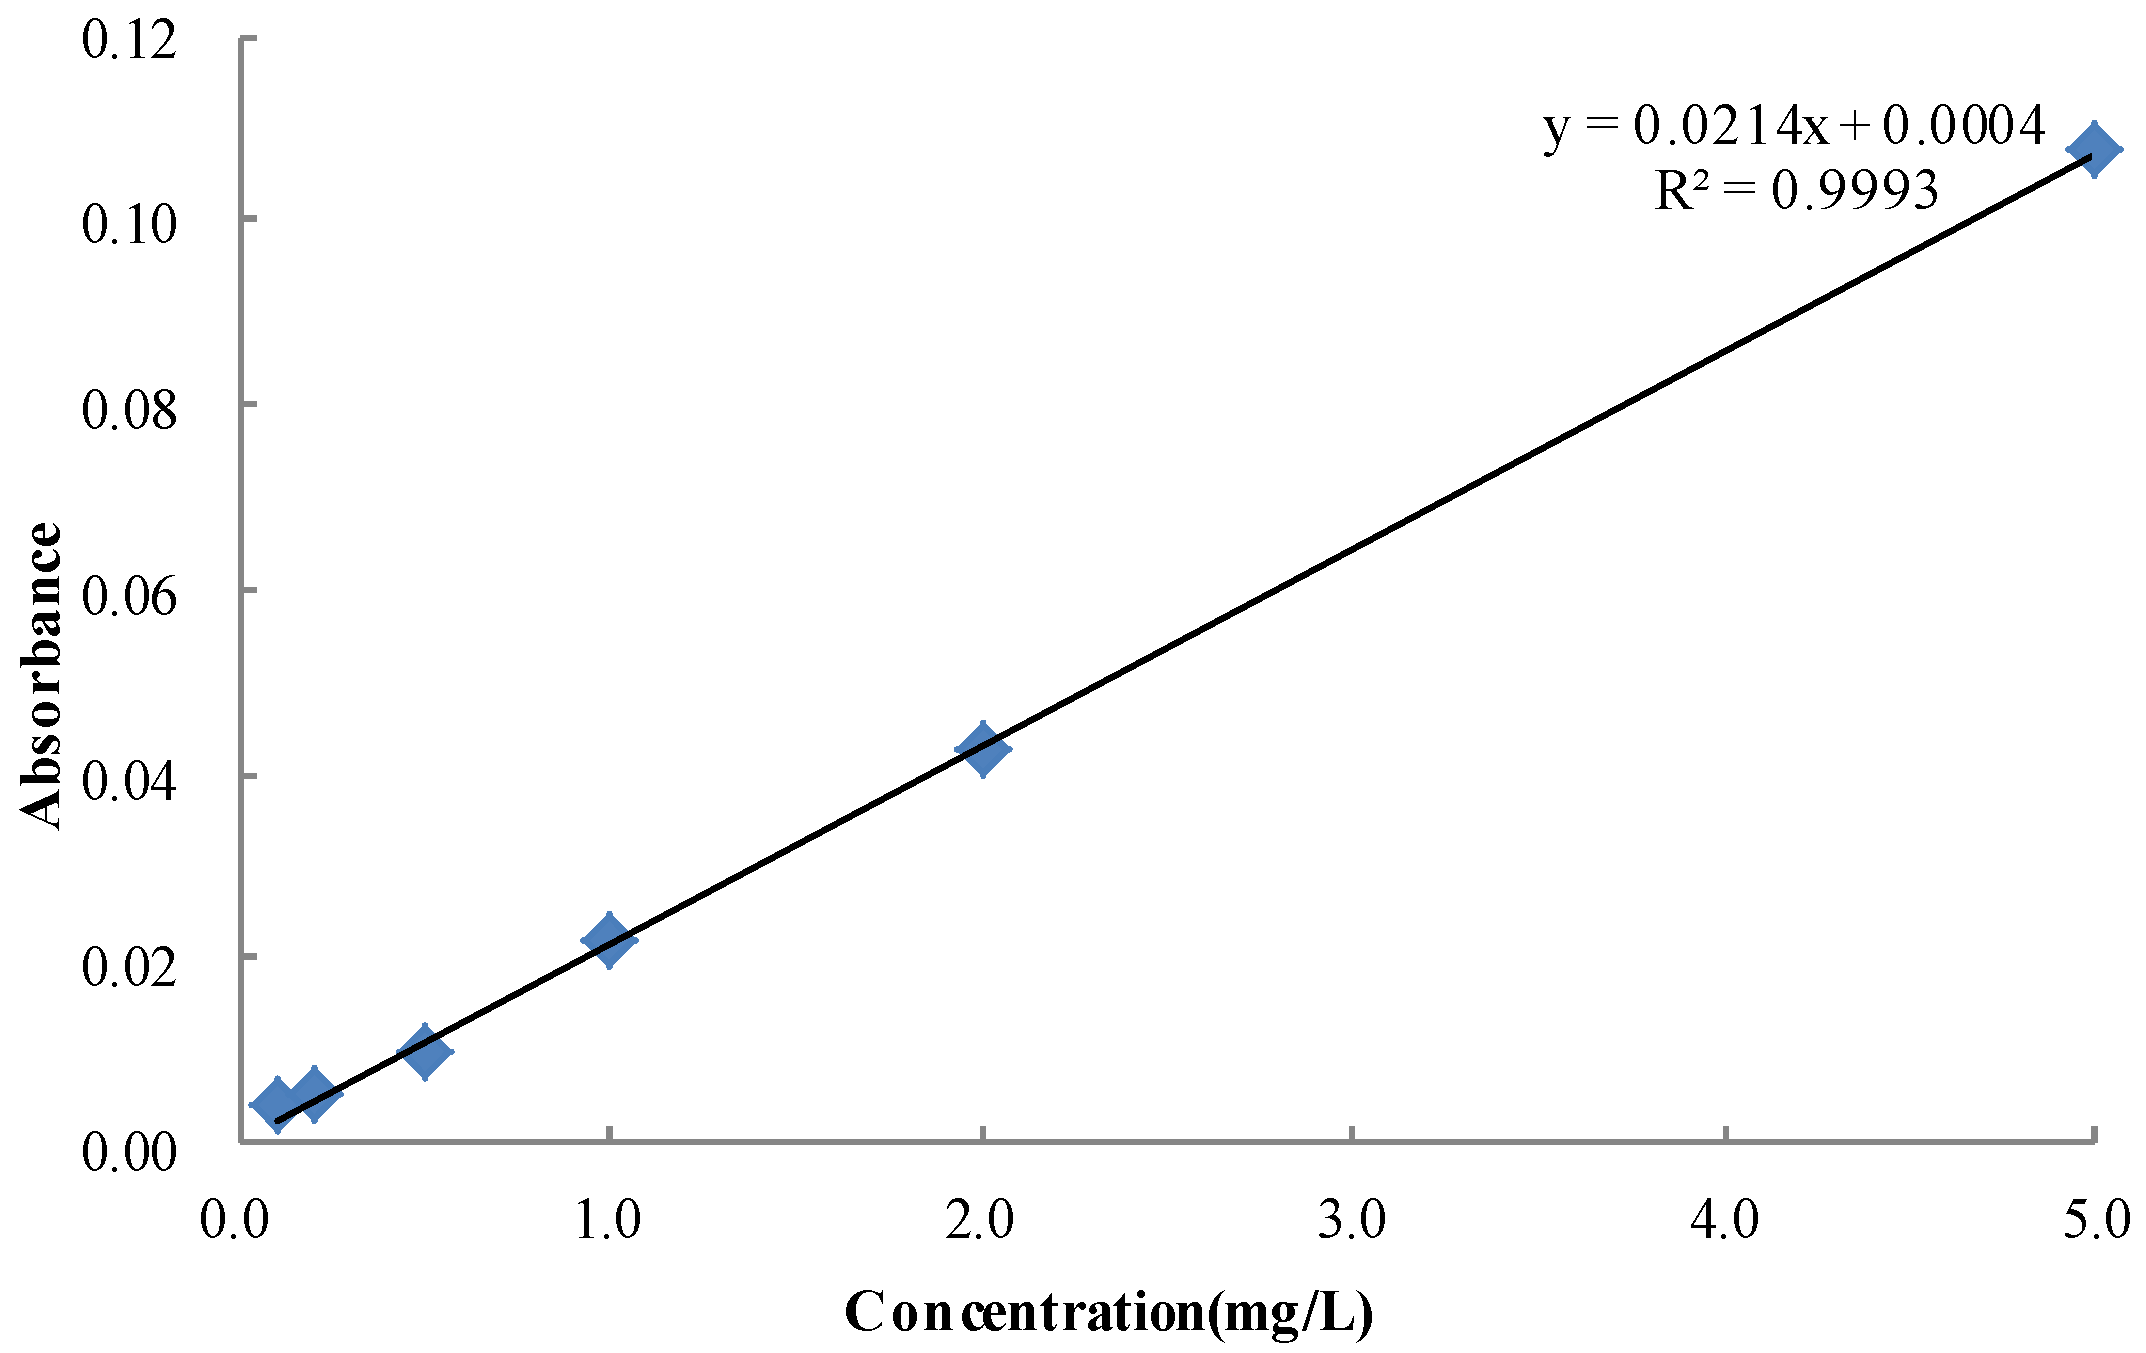
Allura Red Concentration: Absorbance Demarcation
2.5. Control of Cotton Aphids and Spider Mites
2.6. Attachment and Absorption of Cotton Leaves
2.6.1. Sample Extraction and Purification
2.6.2. Chromatographic Conditions
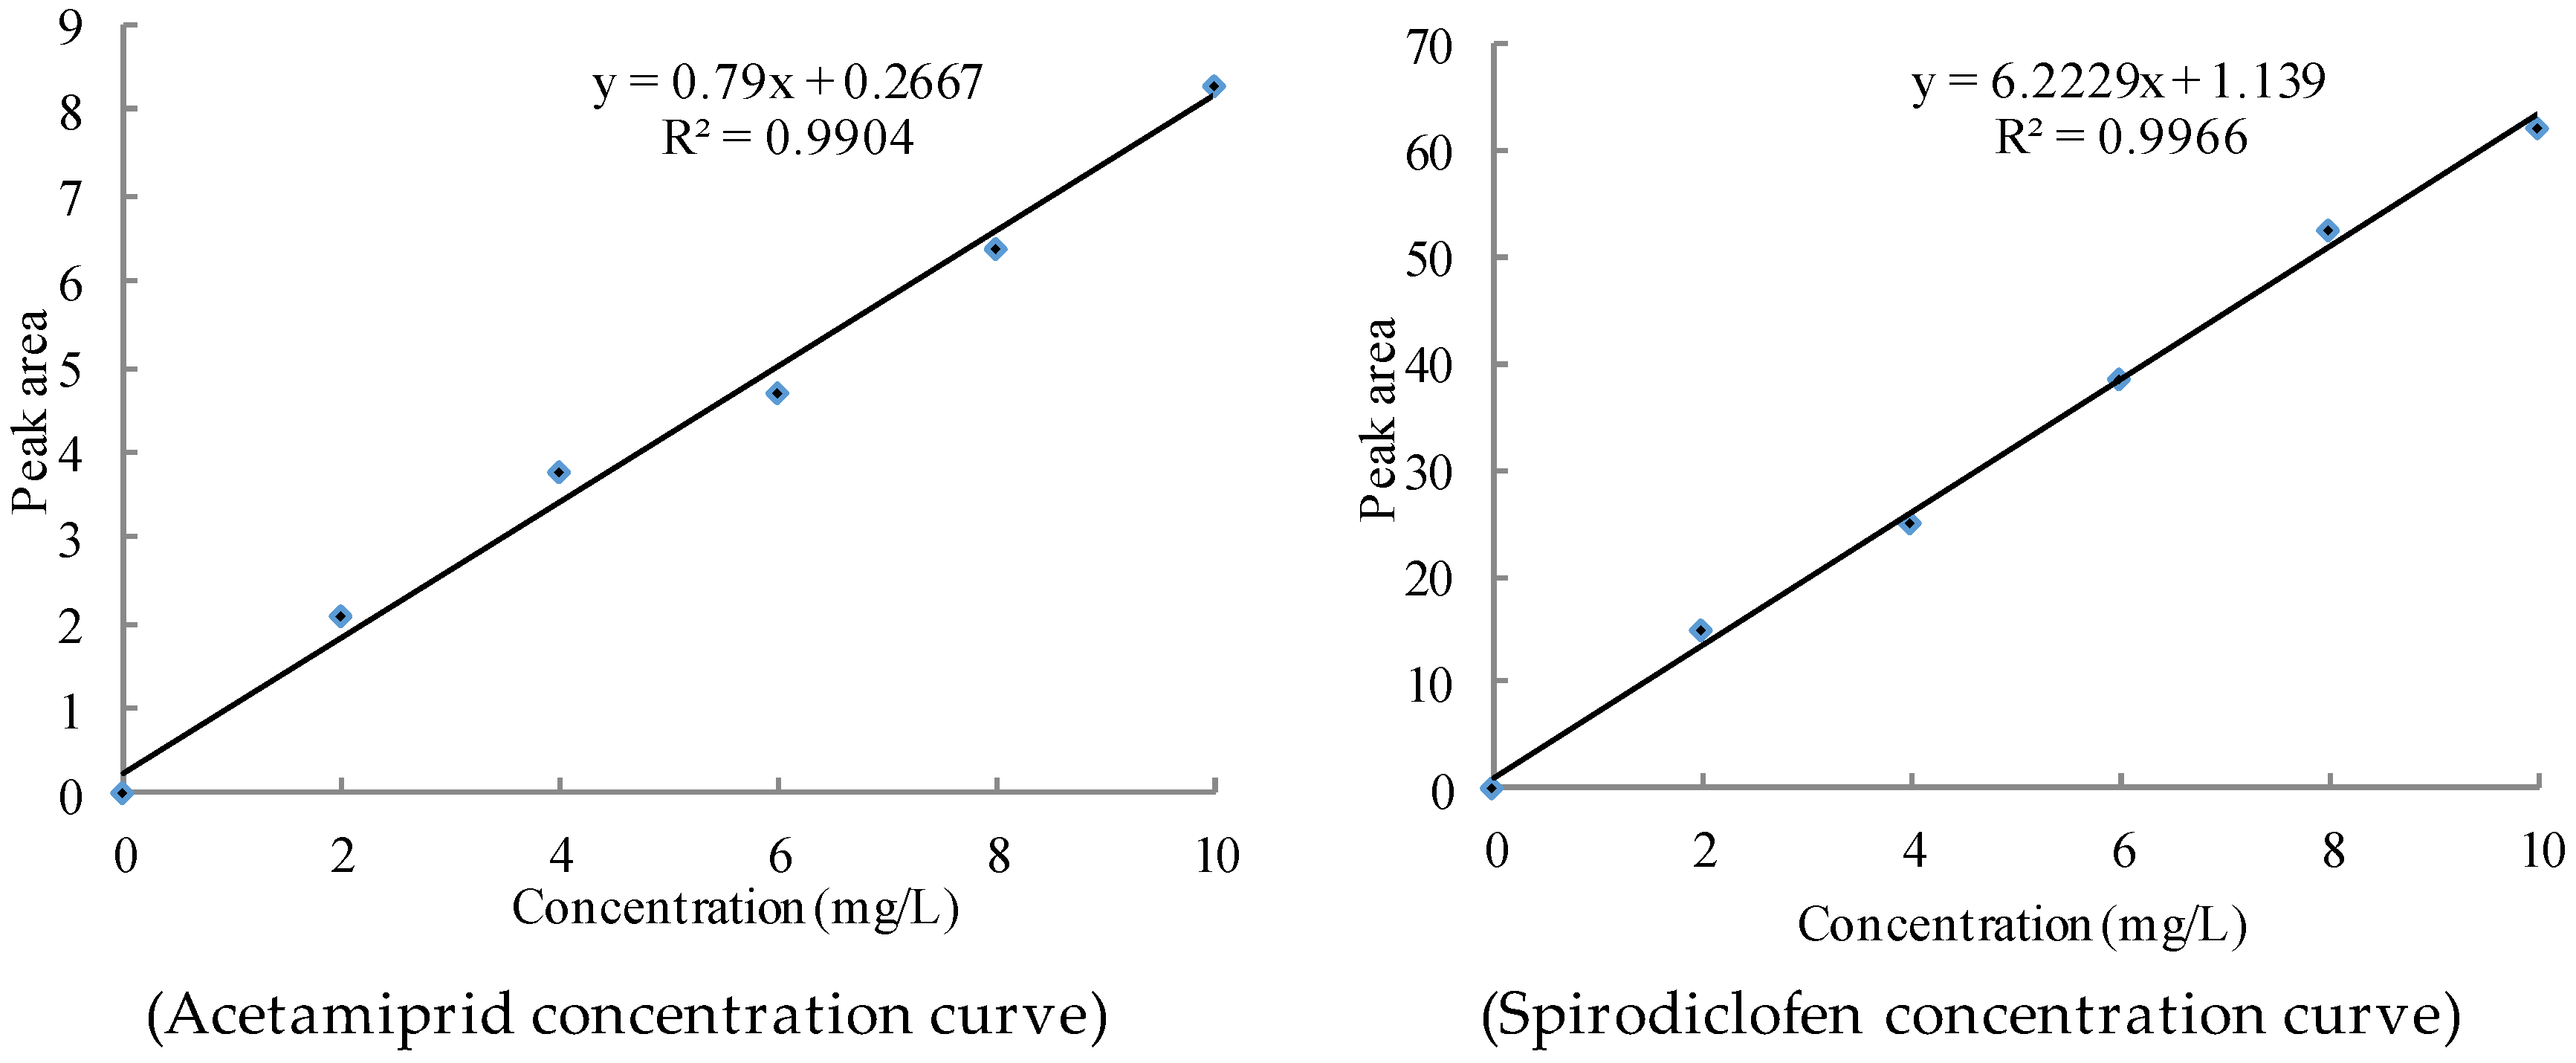
2.6.3. Standard Curves of Spirodiclofen and Acetamiprid Concentration
2.6.4. Determination of Recovery
3. Results and Discussion
3.1. Statistics and Data Processing
3.2. Droplet Deposition
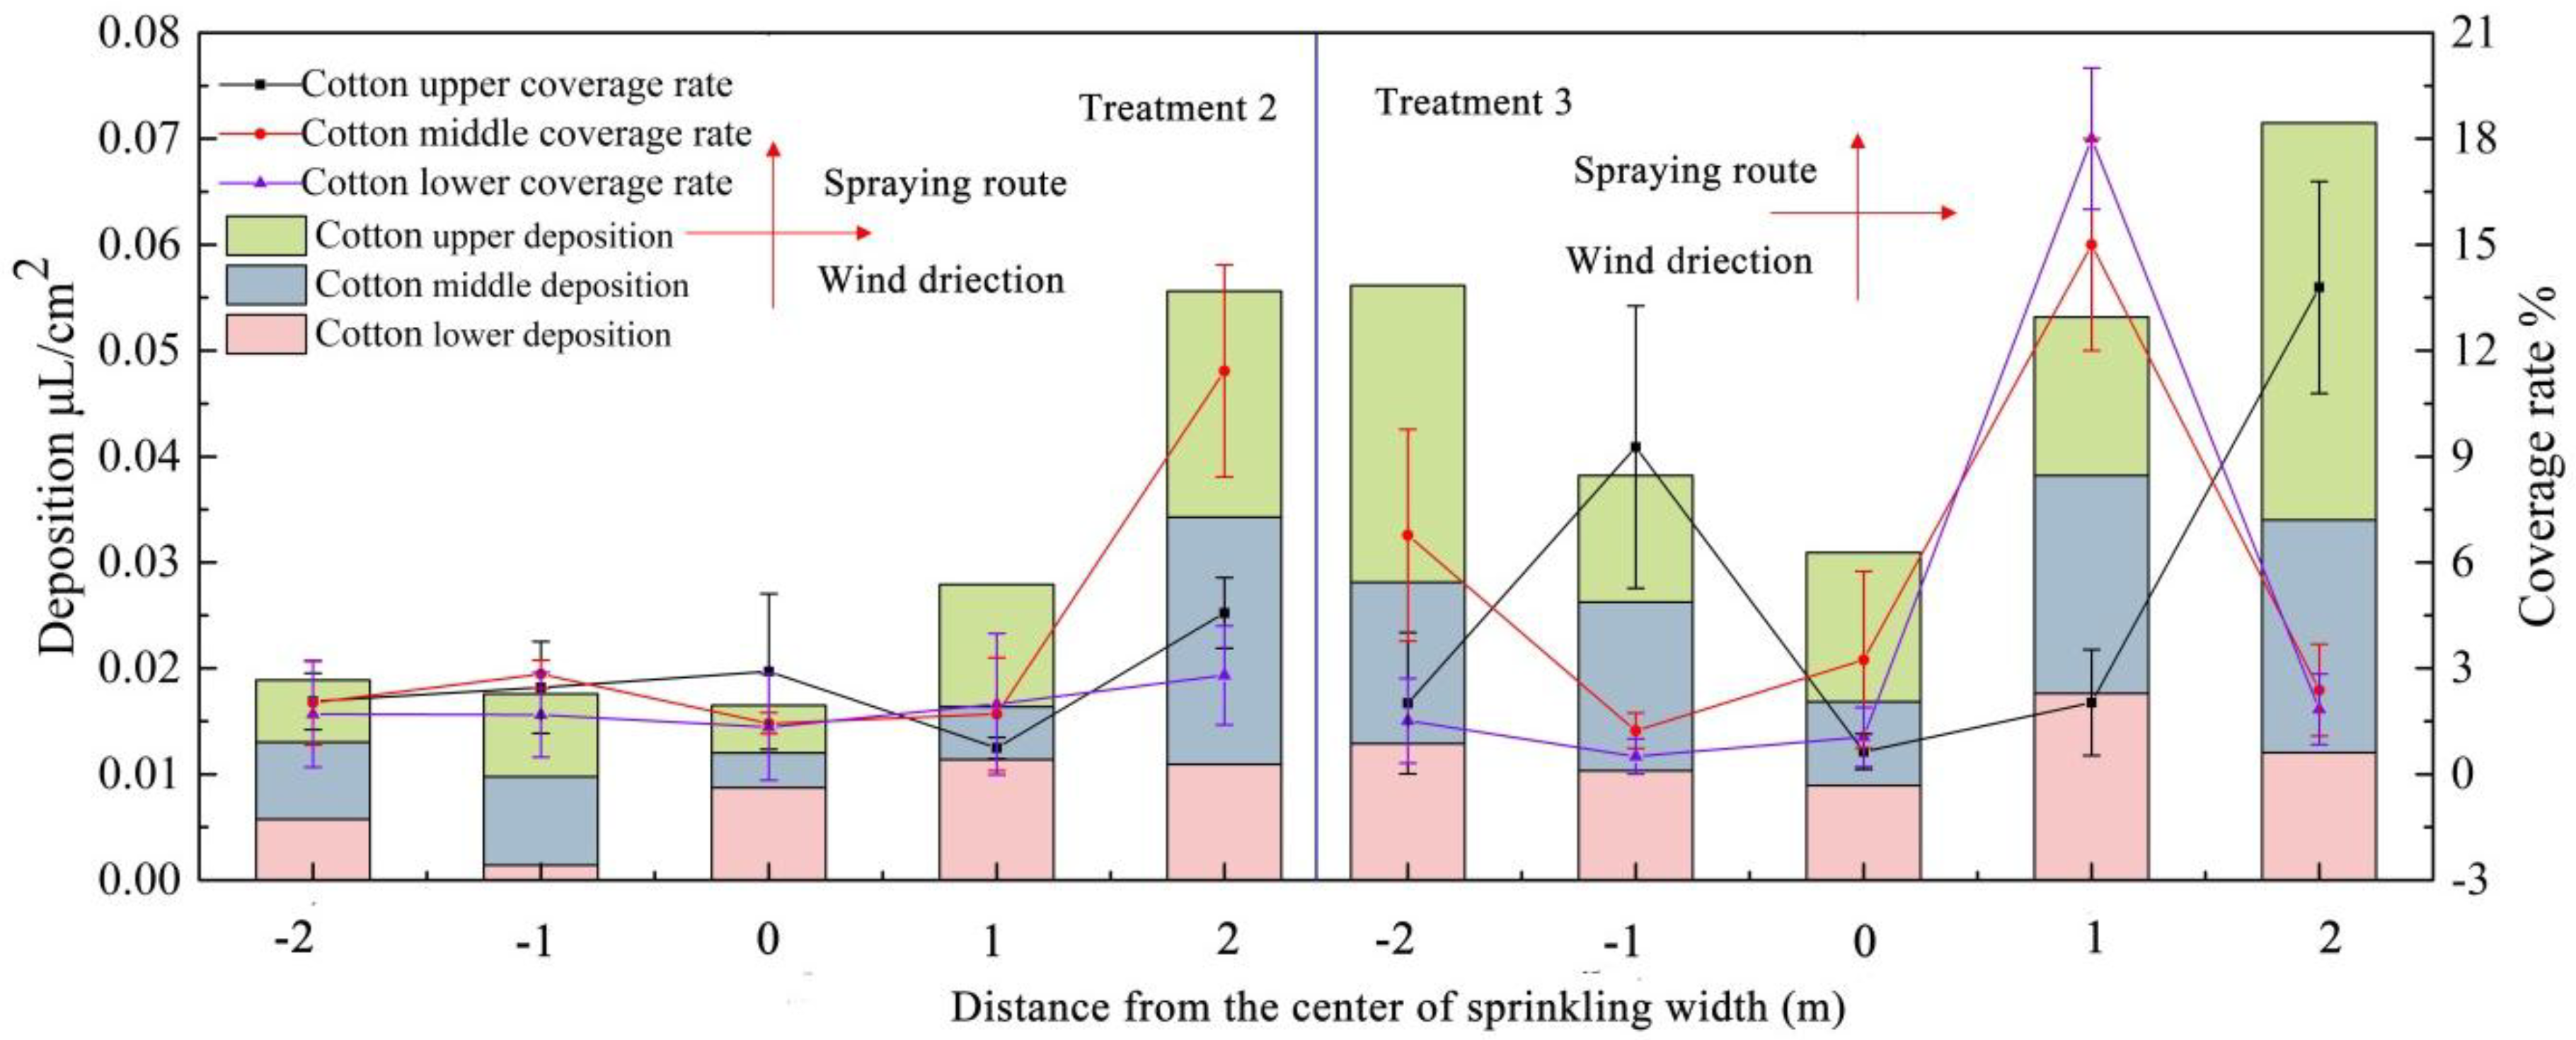
3.3. Droplet Deposition Distribution
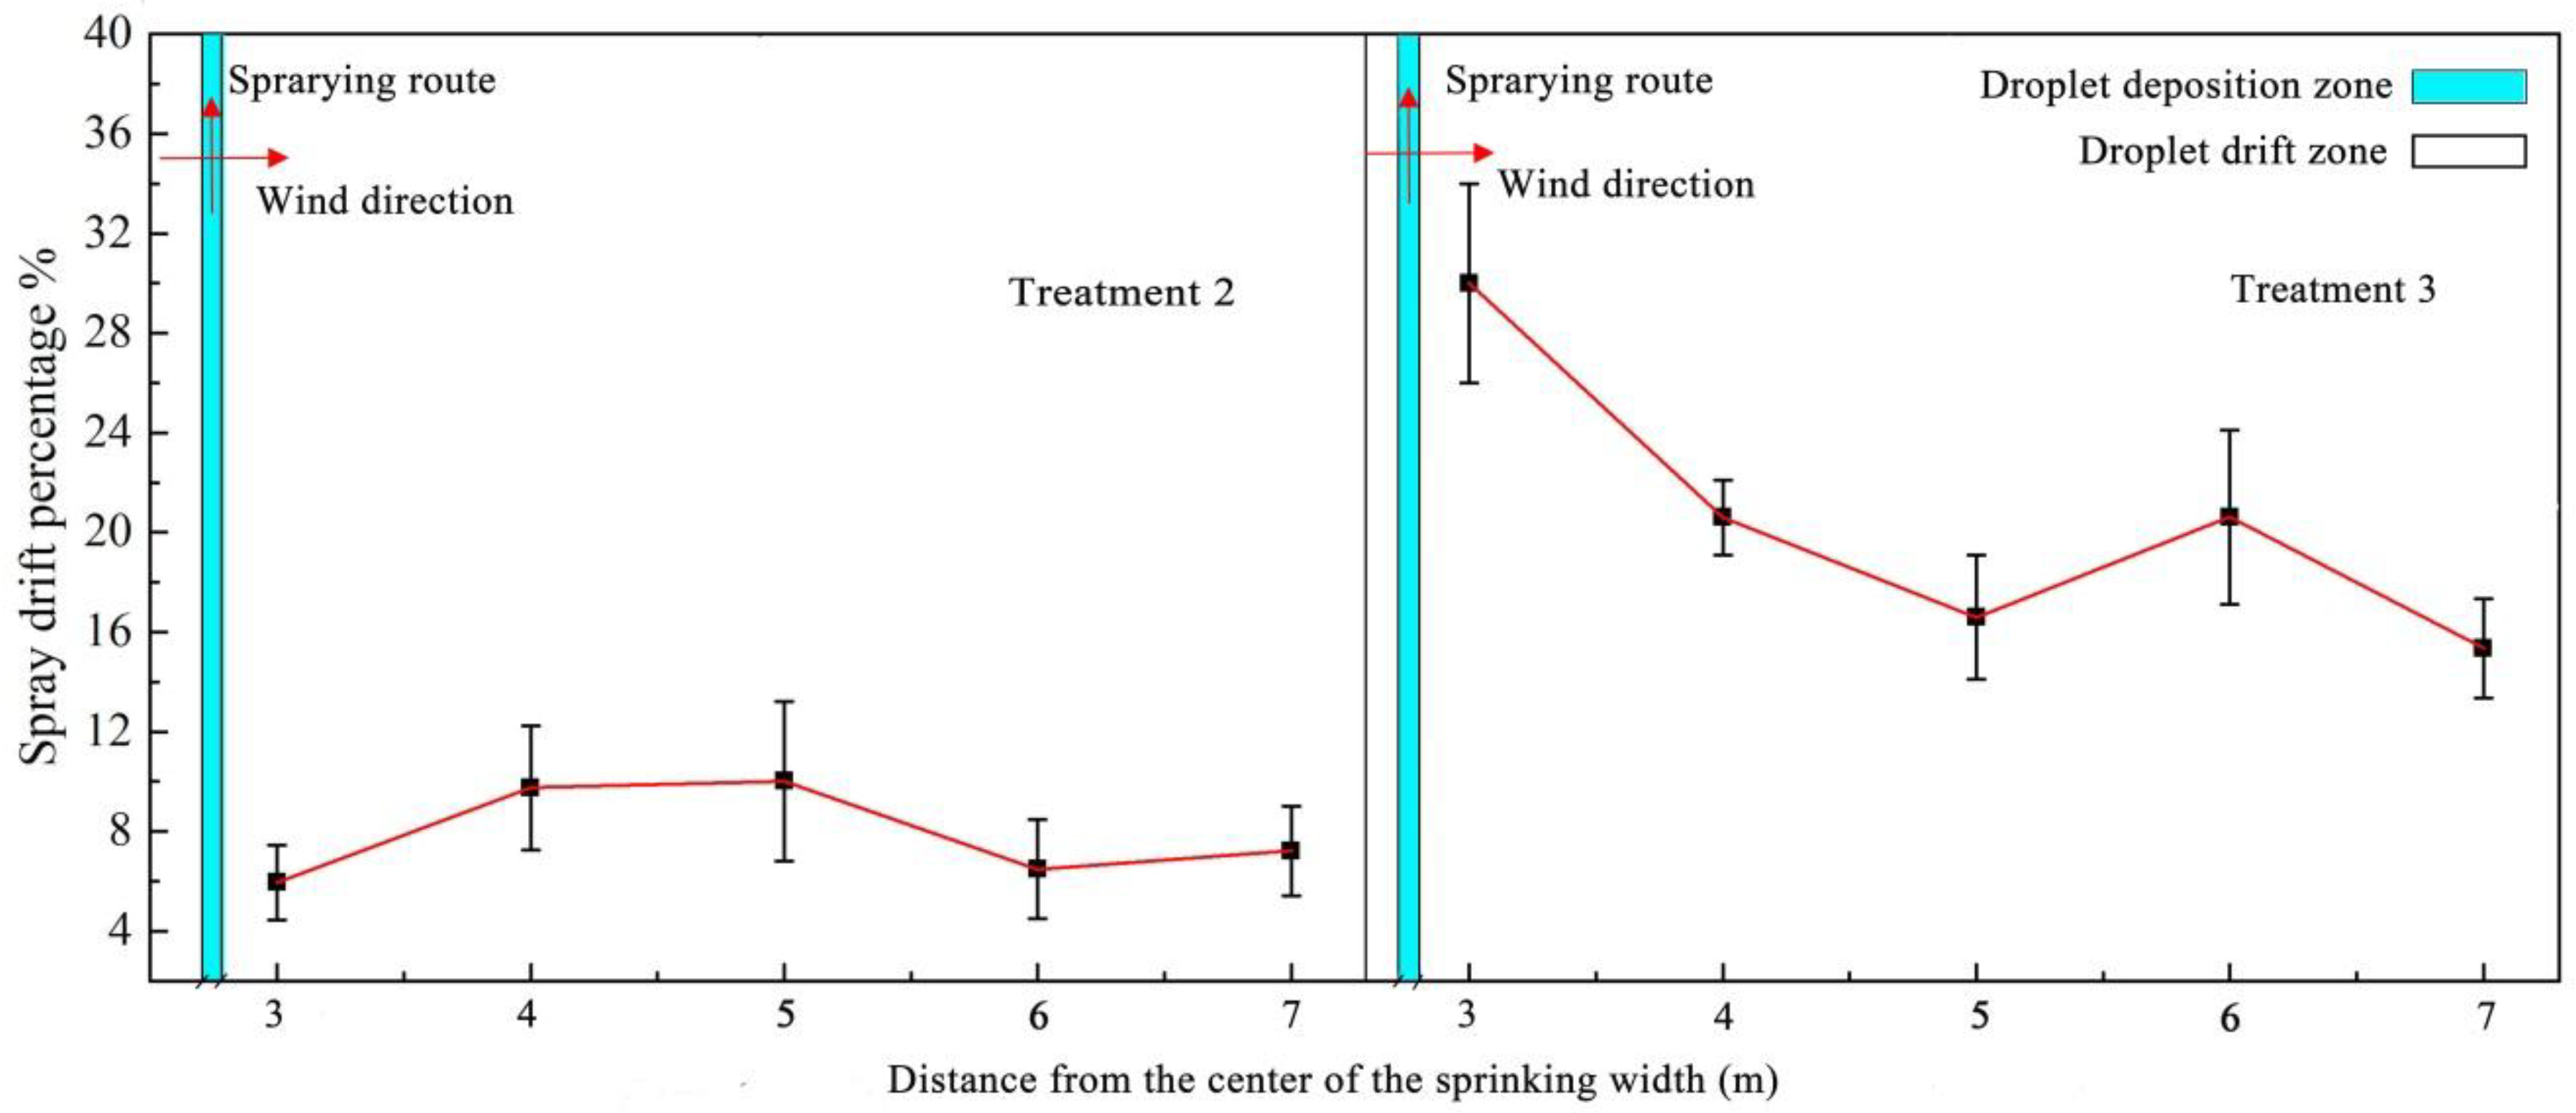
3.4. Droplet Drift
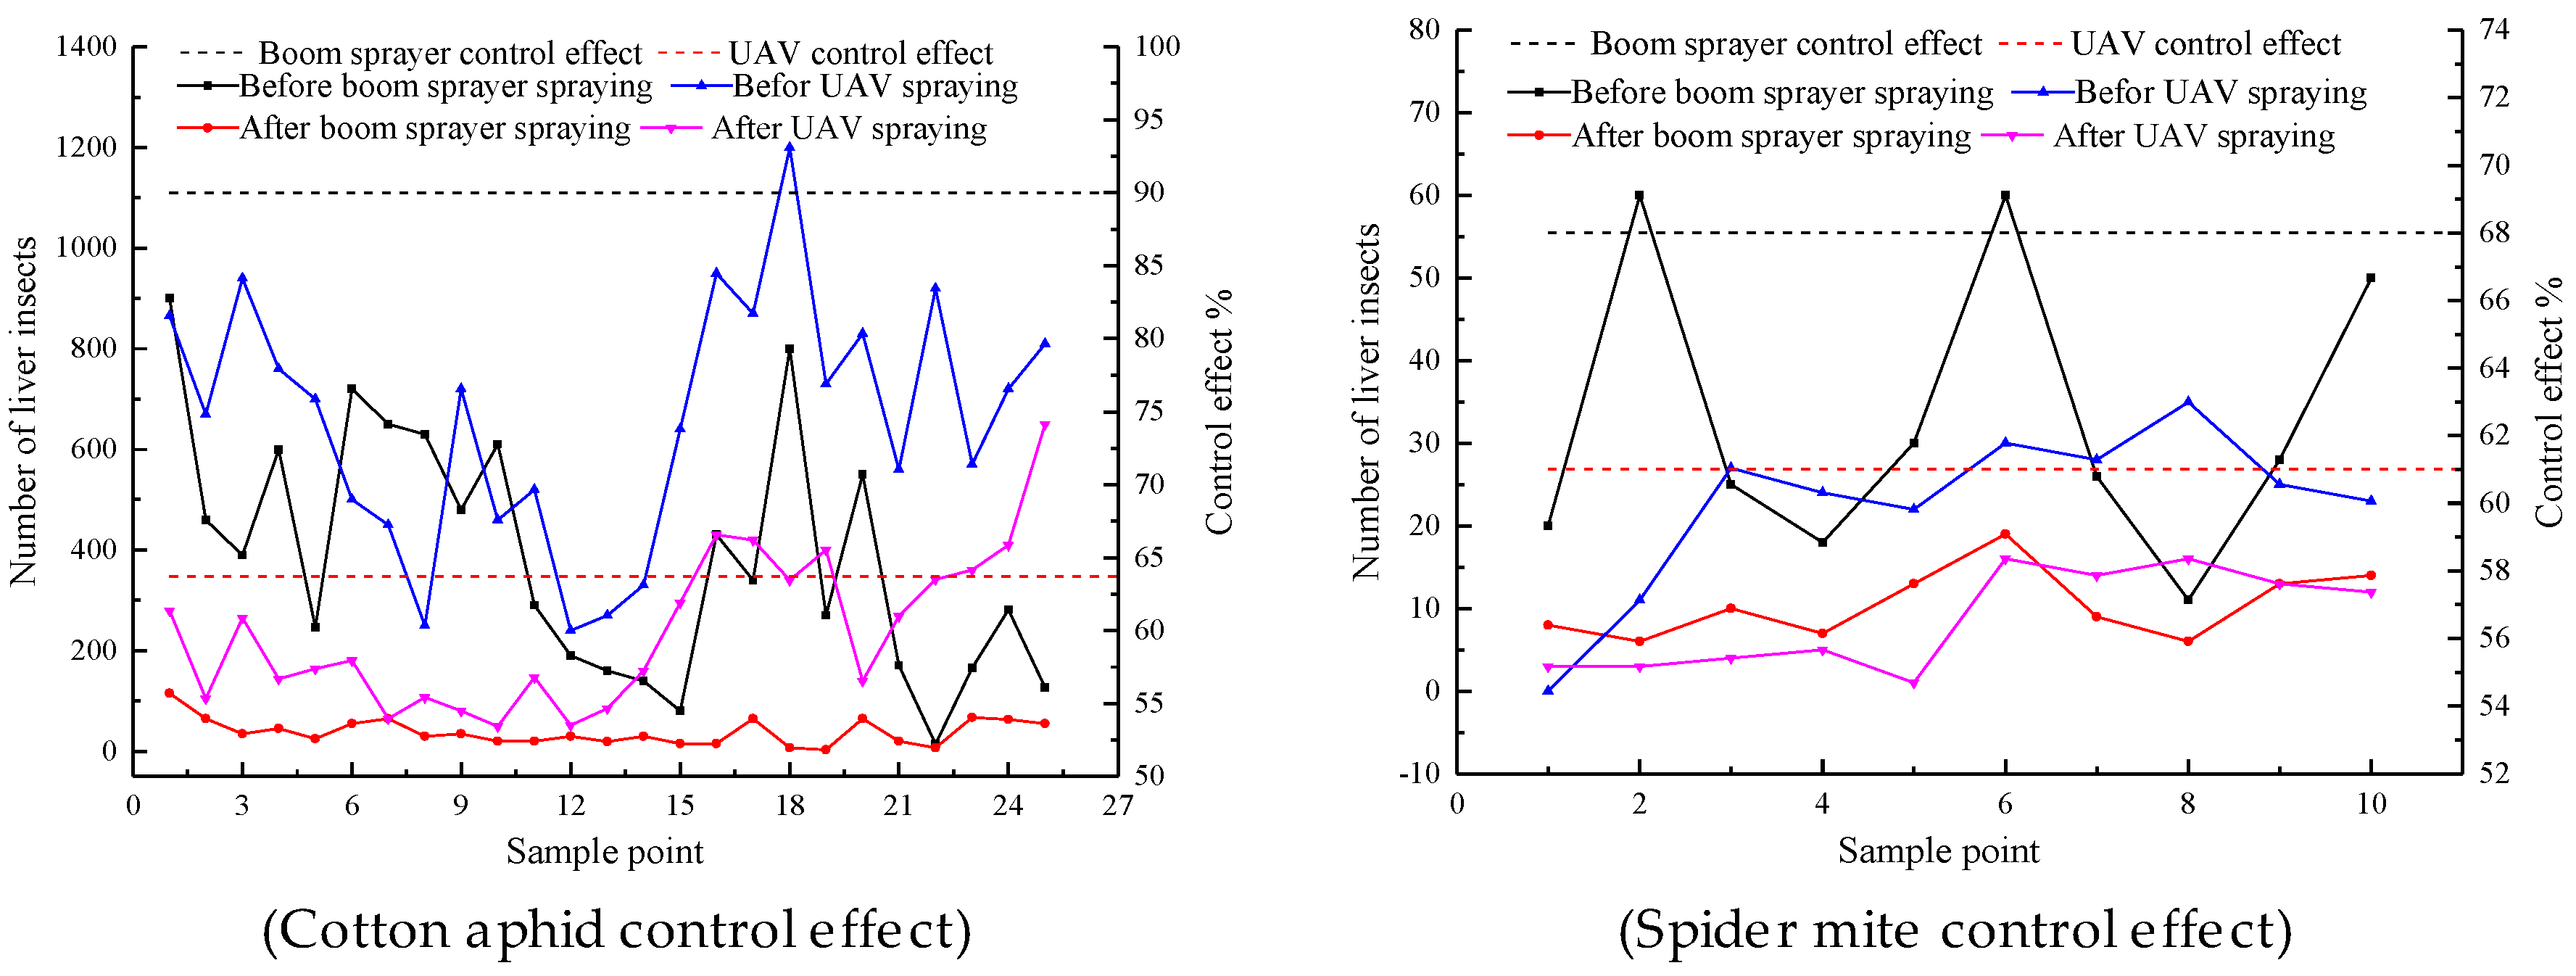
3.5. Control Efficiency of Cotton Aphid and Spider Mite
3.6. Attachment and Absorption of Pesticide on Cotton Leaves
4. Conclusions
Supplementary Materials
Author Contributions
Acknowledgments
Conflicts of Interest
References
- Ma, X.Y.; Wang, Z.G.; Jiang, W.L. Analysis of current status and application prospects of unmanned Aerial Vehicle Plant protection technology in cotton field in China. China Cotton 2016, 43, 7–11. [Google Scholar]
- Marco, G.; Emilio, G.; Paolo, B. Advances in developing a new test method to assess spray drift potential from air blast sprayers. Span. J. Agric. Res. 2017, 15, e0207. [Google Scholar]
- Sierra, J.G.; Canavate, J.O.; Sanhneza, J.R. Short communication Performance of pneumatic spraying with an over-the-row sprayer in high density apple tree orchards. Span. J. Agric. Res. 2006, 4, 26–30. [Google Scholar] [CrossRef]
- Ramon, S.; Cruz, G.; Rafael, G. Description of the airflow produced by an air-assisted sprayer during pesticide applications to citrus. Span. J. Agric. Res. 2015, 13, e208. [Google Scholar]
- Yuan, H.Z.; Yang, D.B.; Yan, X.J. Pesticide efficiency and the way to optimize the spray application. Plant Prot. 2011, 37, 14–20. [Google Scholar]
- Li, L.; He, X.K. Development and experiment of automatice detection device for infrared target. ASAE 2012, 28, 159–163. [Google Scholar]
- Hilz, E.; Vermeer, A.W.P. Spray drift review: The extent to which a formulation can contribute to spray drift reduction. Crop Prot. 2013, 44, 75–83. [Google Scholar] [CrossRef]
- Kirk, I.W. Aerial spray drift from different formulations of glyphosate. Trans. ASABE 2000, 43, 555–559. [Google Scholar] [CrossRef]
- Huang, Y.; Thomson, S.J. Characterization of spray deposition and drift from a low drift nozzle for aerial application at different application altitudes. Int. J. Agric. Biol. Eng. 2011, 4, 28–33. [Google Scholar]
- Zhu, H.; Zondag, R.H.; Derksen, R.C. Influence of Spray Volume on Spray Deposition and Coverage within Nursery Trees. J. Environ. Hortic. 2007, 26, 1–27. [Google Scholar]
- Zhang, J.; He, X.K.; Song, J.L. Influence of spraying parameters of unmanned aircraft on droplets deposition. Trans. CSAM 2012, 43, 94–96. (In Chinese) [Google Scholar]
- Qiu, B.J.; Wang, L.W.; Cai, D.L. Effect of flight height and speed of unmanned helicopter on spray deposition uniform. Trans. CSAE 2013, 29, 25–32. (In Chinese) [Google Scholar]
- Zhang, S.C.; Xue, X.Y.; Qin, W.C. Simulation and experimental verification of aerial spraying drift on N-3 unmanned spraying helicopter. Trans. CSAE 2015, 31, 87–93. (In Chinese) [Google Scholar]
- Qin, W.C.; Qiu, B.J.; Xue, X.Y. Droplet deposition and control effect of insecticides sprayed with an unmanned aerial vehicle against plant hoppers. Crop Prot. 2016, 85, 79–88. [Google Scholar] [CrossRef]
- Wang, C.L.; He, X.K.; Wang, X.N. Testing method of spatial pesticide spraying deposition quality balance for unmanned aerial vehicle. Trans. CSAE 2016, 32, 54–61. (In Chinese) [Google Scholar] [CrossRef]
- Wang, S.L.; Song, J.L.; He, X.K. Performances evaluation of four typical unmanned aerial vehicles used for pesticide application in China. Int. J. Agric. Biol. Eng. 2017, 10, 22–31. [Google Scholar]
- Zheng, Y.J.; Yang, S.H.; Zhao, C.J. Modelling operation parameters of UAV on spray effects at different growth stages of corns. Int. J. Agric. Biol. Eng. 2017, 10, 57–66. [Google Scholar]
- Chen, S.D.; Lan, Y.B.; Li, J.Y. Effect of wind field below rotor on distribution of aerial spraying droplet deposition by using multi-rotor UAV. Trans. CSAM 2017, 48, 105–113. (In Chinese) [Google Scholar]
- Xu, T.Y.; Yu, F.H.; Cao, Y.L. Veetical distribution of spray droplet deposition of plant protection multi rotor UAV for japonica rice. Trans. CSAM 2017, 48, 101–107. (In Chinese) [Google Scholar]
- Fritz, B.K.; Kirk, I.W.; Hoffmann, W.C. Aerial application methods for increasing spray deposition on wheat heads. ASAE 2006, 22, 357–364. [Google Scholar]
- Zhu, H.; Derksen, R.C.; Krause, C.R. Dynamic Air Velocity and Spray Deposition inside Dense Nursery Crops with a Multi-Jet Air-Assist Sprayer; ASAE Paper No. 061125; ASAE: St. Joseph, MI, USA, 2006. [Google Scholar]
- Kirk, I.W. Measurement and prediction of atomization parameters from fixed-wing aircraft spray nozzles. ASAE 2007, 50, 693–703. [Google Scholar]
- Derksen, R.C.; Zhu, H.; Ozkan, H.E. Determining the influence of spray quality, nozzle type, spray volume, and air-assisted application strategies on deposition of pesticides in soybean canopy. ASAE 2008, 51, 1529–1537. [Google Scholar] [CrossRef]
- Ferguson, J.C.; Chechetto, R.G.; Hewitt, A.J. Assessing the deposition and canopy penetration of nozzles with different spray qualities in an oat (Avena sativa L.) canopy. Crop Prot. 2016, 81, 14–19. [Google Scholar] [CrossRef]
- Berger-Neto, A.; Jaccoud-Filho, D.S.; Wutzki, C.R. Effect of spray droplet size, spray volume and fungicide on the control of white mold in soybeans. Corp Prot. 2017, 92, 190–197. [Google Scholar] [CrossRef]
- Xue, X.Y.; Tu, K.; Qin, W.C. Drift and deposition of ultra-low height and low volume application in paddy field. Int. J. Agric. Biol. Eng. 2014, 7, 23–28. [Google Scholar]
- Feng, Y.Z.; Jin, J.; Pan, J.J. Residues and degradation dynamics of thidiazuron and diuron in cotton. Mod. Agrochem. 2017, 4, 35–38. [Google Scholar]
- Wu, Y.J.; Ru Yi Chen, Z.L. The determination of acetamiprid residues in pear by GC. Agrochemicals 2009, 3, 211–212. [Google Scholar]
- Yao, W.X.; Lan, Y.B.; Wang, J. Droplet drift characteristics of aerial spraying of AS350B3e helicopter. Trans. CSAE 2017, 33, 75–83. (In Chinese) [Google Scholar]
- Qin, W.C.; Xue, X.Y.; Zhou, L.X. Effects of spraying parameters of unmanned aerial vehicle on droplets deposition distribution of maize canopies. Trans. CSAM 2014, 30, 50–56. (In Chinese) [Google Scholar]
- Oeko-Tex Associationa. Oeko-Tex Satandard 100; Oeko-Tex Associationa: Zurich, Switzerland, 2012. [Google Scholar]


| Parameter | UAV | Boom Sprayer |
|---|---|---|
| Dimensions (m) | 1.18 × 1.18 × 0.41 | 1.28 × 2.5 × 1.765 |
| Spraying width (m) | 1.5–3 | 18 |
| Nozzle type | Centrifugal nozzle | Hollow conical nozzle |
| Nozzle numbers | 4 | 36 |
| Flow rate (mL/min) | 200–800 | 1580 |
| Spraying height (m) | 1–10 | 1.75 |
| Driving speed (m/s) | 1–8 | 0.5–1 |
| Tank capacity (L) | 6, 8, 10 | 1000 |
| Spraying pattern | Low volume and high concentration | High volume and high concentration |
| Treatment | Spray Volume (L/hm2) | Dosage (a.i. g/hm2) | |||
|---|---|---|---|---|---|
| Acetamiprid | Spirodiclofen | Avermectin | Allura Red | ||
| 1 | 450 | 60 | 72 | 22.5 | 150 |
| 2 | 12 | 60 | 72 | 22.5 | 150 |
| 3 | 12 | 60 | 72 | 22.5 | 150 |
| Added Concentration mg/kg | Acetamiprid | ||||
|---|---|---|---|---|---|
| 1 | 2 | 3 | Average Recovery % | RSD % | |
| 0.05 | 107.06 | 102.94 | 94.41 | 101.5 | 4.8 |
| 0.5 | 87.19 | 92.73 | 93.39 | 91.1 | 3.7 |
| 5.0 | 91.65 | 89.77 | 90.90 | 90.8 | 6.9 |
| Factor | Indicators | SS | df | p | Significance | F |
|---|---|---|---|---|---|---|
| Flight height | Droplet deposition | 0.0024 | 1 | 0.022 | * | 5.95 |
| Spray drift percentage | 0.0013 | 1 | 0.0013 | ** | 13.207 |
| Working Height (m) | Sampling Site | Droplet Density (Deposition/cm2) | Max | Min | S | CV (%) |
|---|---|---|---|---|---|---|
| 1.5 m | Upper | 2.01f | 6.20 | 0.70 | 2.35 | 117.1 |
| Middle | 7.23d | 30.20 | 0.77 | 12.88 | 178.1 | |
| Lower | 3.21e | 6.40 | 0.73 | 2.76 | 85.8 | |
| 2 m | Upper | 11.35a | 26.13 | 2.23 | 9.01 | 79.4 |
| Middle | 9.35b | 16.37 | 3.40 | 4.70 | 50.3 | |
| Lower | 9.17c | 32.97 | 0.57 | 13.42 | 146.4 |
| Absorption (mg/kg) | Boom Sprayer | UAV 1.5 m | UAV 2 m | ||||||
|---|---|---|---|---|---|---|---|---|---|
| Upper | Middle | Lower | Upper | Middle | Lower | Upper | Middle | Lower | |
| Acetamiprid absorption | 8.02b | 11.18c | 12.45a | 10.42c | - | - | 10.55c | 11.18b | 6.88a |
| Spirodiclofen absorption | 2.92c | 0.67a | 1.10b | 1.78b | - | - | 0.85b | 0.46a | 0.77a |
© 2018 by the authors. Licensee MDPI, Basel, Switzerland. This article is an open access article distributed under the terms and conditions of the Creative Commons Attribution (CC BY) license (http://creativecommons.org/licenses/by/4.0/).
Share and Cite
Lou, Z.; Xin, F.; Han, X.; Lan, Y.; Duan, T.; Fu, W. Effect of Unmanned Aerial Vehicle Flight Height on Droplet Distribution, Drift and Control of Cotton Aphids and Spider Mites. Agronomy 2018, 8, 187. https://doi.org/10.3390/agronomy8090187
Lou Z, Xin F, Han X, Lan Y, Duan T, Fu W. Effect of Unmanned Aerial Vehicle Flight Height on Droplet Distribution, Drift and Control of Cotton Aphids and Spider Mites. Agronomy. 2018; 8(9):187. https://doi.org/10.3390/agronomy8090187
Chicago/Turabian StyleLou, Zhaoxia, Fang Xin, Xiaoqiang Han, Yubin Lan, Tianzhu Duan, and Wei Fu. 2018. "Effect of Unmanned Aerial Vehicle Flight Height on Droplet Distribution, Drift and Control of Cotton Aphids and Spider Mites" Agronomy 8, no. 9: 187. https://doi.org/10.3390/agronomy8090187
APA StyleLou, Z., Xin, F., Han, X., Lan, Y., Duan, T., & Fu, W. (2018). Effect of Unmanned Aerial Vehicle Flight Height on Droplet Distribution, Drift and Control of Cotton Aphids and Spider Mites. Agronomy, 8(9), 187. https://doi.org/10.3390/agronomy8090187