Abstract
Rice is one of the world’s most important staple crops, and outbreaks of insect pests pose a persistent threat to yield stability and food security in major rice-growing regions. Reliable field-scale rice pest detection remains challenging due to limited datasets, heterogeneous imaging conditions, and inconsistent annotations. To address these limitations, we construct RicePest-30, a field-oriented dataset comprising 8848 images and 62,227 annotated instances covering 30 major rice pest species. Images were collected using standardized square-framing protocols to preserve spatial context and visual consistency under diverse illumination and background conditions. Based on RicePest-30, YOLOv11 was adopted as the primary detection framework and optimized through a systematic hyperparameter tuning process. The learning rate was selected via grid search within the range of 0.001–0.01, yielding an optimal value of 0.002. Training was conducted for up to 300 epochs with an early-stopping strategy to prevent overfitting. For fair comparison, YOLOv5s, YOLOv8s, Faster R-CNN, and RetinaNet were trained for the same number of epochs under unified settings, using the Adam optimizer with a learning rate of 0.001. Model performance was evaluated using Precision, Recall, AP@50, mAP@50:95, and counting error metrics. The experimental results indicate that YOLOv11 provides the most balanced performance across precision, localization accuracy, and counting stability. However, all models exhibit degraded performance in small-object scenarios, dense pest distributions, and visually similar categories. Error analyses further reveal that class imbalance and field-scene variability are the primary factors limiting detection robustness. Overall, this study contributes a high-quality, uniformly annotated rice pest dataset and a systematic benchmark of mainstream detection models under realistic field conditions. The findings highlight critical challenges in fine-grained pest recognition and provide a solid foundation for future research on small-object enhancement, adaptive data augmentation, and robust deployment of intelligent pest monitoring systems.
1. Introduction
Rice serves as the staple food for nearly half of the global population, making its stable production essential for ensuring food security [1]. However, agricultural pests remain one of the most persistent and severe threats to rice growth [2], and large-scale outbreaks can cause substantial yield losses and even jeopardize regional food stability [3]. Efficient monitoring and accurate identification of field pests have therefore become critical components of modern rice production. Traditional pest monitoring relies on manual field inspection and specimen comparison, which is labor-intensive, prone to subjective errors, and unable to meet the requirements of real-time, large-scale, and precise monitoring in modern agriculture [4]. With the rise of smart agriculture and machine vision, image-based automated recognition has emerged as a promising solution. Nevertheless, the effectiveness of such approaches fundamentally depends on the availability of high-quality, large-scale, and multi-scene image datasets.
To support model training and evaluation, several datasets such as IP102 [5], RP11 [6], and Pest24 [7] have been released. Despite their contributions, these datasets still exhibit notable limitations: although IP102 is large, its rice-related subset includes only 14 categories and 1248 images; RP11 focuses mainly on adult pests and contains only 11 categories with limited diversity; Pest24 provides fine-grained annotations but suffers from circular field-of-view imaging, resulting in large black margins that hinder feature extraction. Overall, existing datasets often suffer from uneven class distribution, limited sample size, and restricted imaging scenarios, making them insufficient for multi-scale pest detection in complex field environments, and thus constraining the performance of advanced detection models.
Image-based pest monitoring has therefore become an important research direction [8]. Early approaches relied on handcrafted features and traditional Machine-Learning classifiers such as SVM and KNN [9,10], but these methods lacked robustness under varying illumination and background conditions [11]. With advancements in imaging hardware and artificial intelligence, deep learning-based detection methods have rapidly gained attention in crop pest monitoring [12,13,14]. Models such as Faster R-CNN, R-FCN, and SSD significantly improved accuracy through end-to-end feature learning [15,16]. In particular, the YOLO family has demonstrated outstanding performance in balancing speed and accuracy, with improved models (e.g., YOLOv5, YOLOv7) achieving over 90% average precision in rice [17,18], maize [19], and tea plant [20] pest detection.
In recent years, advances in deep learning and computer vision have spurred a new wave of research in rice pest detection. For example, RP-DETR (2025) introduced Transformer architectures into rice pest detection for the first time, enabling end-to-end inference, multi-scale feature fusion, and lightweight model design, thereby offering a new paradigm for pest detection under complex field conditions [21]. Meanwhile, Rice-YOLO—an improved lightweight variant of YOLOv8 incorporating attention mechanisms—achieved strong mAP across multiple pest species while substantially reducing computational cost, making on-device or edge deployment more feasible [22]. In addition, several studies have implemented pest and disease detection systems on mobile phones, demonstrating the practical viability of bringing such models directly to farmers [23].
Despite these advances, several key challenges remain unresolved. Most existing studies rely solely on RGB images and seldom consider visual degradation caused by low illumination, shadow occlusion, or nighttime light-trap settings [15,24]. Although some efforts explore multisource data (e.g., UAV imagery, light-trap images, visible–NIR fusion), these datasets are typically limited in scale and scenario diversity, failing to capture the wide range of conditions present in real agricultural environments [25,26].
With respect to data resources, publicly available datasets remain limited in scale, species coverage, and annotation consistency. Most rely on single-modality RGB images and lack scenarios involving low light, occlusion, dense distributions, small objects, or multisource imaging (light-trap images, laboratory close-ups, UAV data, web-collected samples) [27,28]. Existing datasets often suffer from small category sets, inconsistent annotation formats, and homogeneous scenes, thereby constraining model robustness and generalization [29,30]. Building a large-scale dataset that spans multiple scenes, modalities, and pest developmental stages has therefore become a critical bottleneck for advancing the field.
Taken together, current research has yet to meet the combined requirements of “multisource/multimodal data, diverse scenes, multi-scale targets, deployable lightweight models, and high generalization stability.” Addressing this gap, we constructed RicePest-30—a new rice pest image dataset comprising field ultraviolet light-trap images, laboratory close-up images, and curated web-sourced samples. Covering 30 common rice pest categories, it better reflects the diversity and complexity of real-world scenarios. Based on this dataset, we adopt YOLOv11 as the core detection framework and incorporate transfer learning to leverage its strong capability in high-precision object detection. The goal is to significantly enhance multi-scale pest recognition performance under complex backgrounds. Ultimately, this work aims to develop a comprehensive rice pest image database and a robust YOLOv11-based detection model, providing reliable data resources and technical support for intelligent pest monitoring and precision crop protection.
2. Materials and Methods
2.1. Image Acquisition
Field images were primarily collected using ultraviolet (UV) light trap systems (RNCB-III, Hunan RNXN Tech, Changsha, China) deployed across major rice-growing regions in Hunan Province, including Suining, Taoyuan, and Wangcheng. Each trap was equipped with an LED light source operating at a central wavelength of 360–400 nm (Figure 1). The systems were automatically activated at night and captured images at two-hour intervals, which were transmitted to a central server in real time.
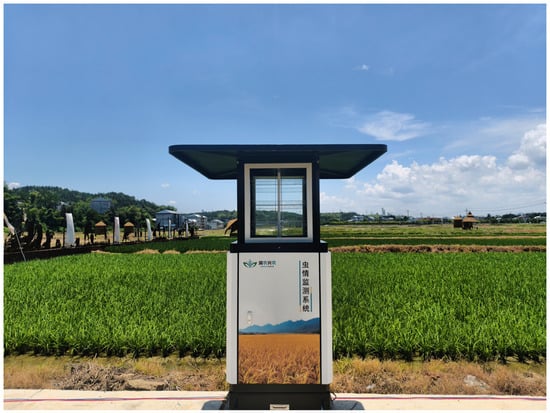
Figure 1.
Field ultraviolet light trap.
All traps were installed at a height of approximately 1.5 m, with an inter-site spacing of 300–500 m to ensure adequate spatial representativeness. Image acquisition was performed using high-definition surveillance and digital cameras with a minimum resolution of 3200 × 2700 pixels. Data collection covered dusk, nighttime, and early morning periods, corresponding to peak pest activity.
To supplement fine-grained morphological information, individual insect images were captured under controlled laboratory conditions. These images focused on detailed features such as body shape and color patterns, enhancing the model’s capacity for individual-level feature learning. In addition, white-background images were prepared by removing complex environmental backgrounds and isolating the insect body. This process emphasized key structural characteristics, including wing venation, antennae, and body segments, thereby supporting more precise feature extraction.
To address class imbalance, additional images were selectively obtained from authorized online sources. All such images were manually inspected, and only those consistent with natural field conditions were retained.
In total, the dataset comprises 8848 images covering 30 major rice pest species. This includes 6452 field images, 1597 single-insect laboratory images, and 799 online-supplemented images, with a total of 62,227 annotated instances. The resulting dataset provides a diverse and well-structured foundation for model training and performance evaluation.
2.2. Data Annotation and Quality Control
All images were annotated in the COCO format using CVAT v2.45.0. To ensure consistency and accuracy, a standardized annotation protocol was established. Each recognizable insect instance was enclosed within a bounding box, even under conditions of mild blur or partial occlusion, while severely occluded or unidentifiable individuals were excluded.
A dual-annotation and cross-validation strategy was employed, with 10% of the images randomly selected for triple independent reviews to minimize human bias and guarantee annotation reliability. The final annotation files contain essential metadata, including image information, class identifiers, and bounding box coordinates. A sample of the dataset is shown in Figure 2, example images for the 10 pest categories are provided in Figure 3, and a complete set of examples for all pest categories can be found in Table S1.
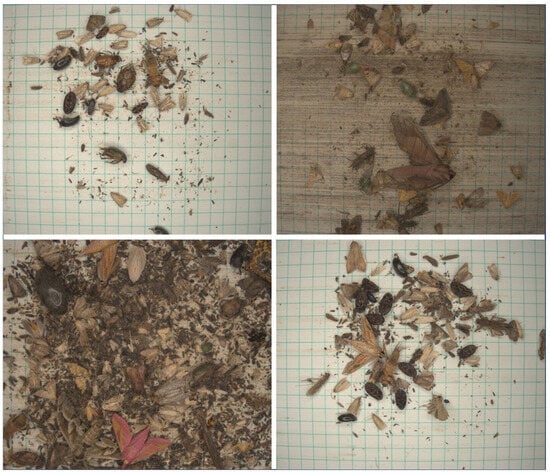
Figure 2.
Example images of the RicePest-30.
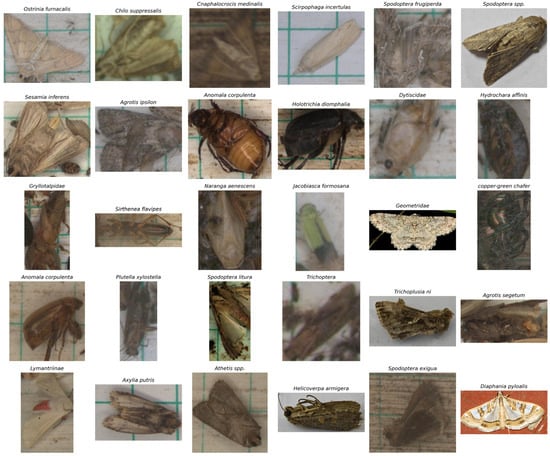
Figure 3.
Sample visualization for each pest category in the RicePest-30.
In total, 62,227 high-quality annotations were produced, covering 30 major rice pest species. The class distribution of images and annotated instances is summarized in Table 1, providing a statistical overview of dataset composition. The resulting multi-class rice pest detection dataset, RicePest-30, will be publicly available for research purposes at: https://github.com/kkb20334-lang/RicePest-30 (URL accessed on 21 December 2025).

Table 1.
Number of images and annotated instances for each pest category in the RicePest-30.
2.3. Dataset Partitioning for Model Training
Following precise manual annotation, the dataset was divided into training and testing subsets with an approximate ratio of 9:1, ensuring proportional representation across all pest categories. The pest categories in the dataset are shown in Table 2.
Table 2.
Number of images and annotated instances for each pest category in the RicePest-30. Number of annotated pest instances across different dataset partitions.
A total of 953 images were randomly selected as the test set for model performance evaluation, while the remaining samples were allocated to the training set for model learning and parameter optimization.
This partitioning strategy maintains balanced class distributions and effectively prevents data leakage, thereby ensuring the objectivity and reliability of model evaluation.
2.4. Model Architecture and Training Configuration
In recent years, object detection techniques have advanced rapidly within the field of computer vision [31]. Among these approaches, the You Only Look Once (YOLO) series has become one of the most representative single-stage detection frameworks, owing to its end-to-end architecture and strong balance between accuracy and real-time performance [32].
This study adopts YOLOv11 [33], one of the latest developments in the YOLO family. The model consists of three core components: a Backbone, a Neck, and a Detection Head.
In the Backbone, YOLOv11 integrates enhanced Cross Stage Partial (CSP) modules together with dynamic convolution units, improving feature extraction efficiency and multi-scale representation capability.
The Neck employs an optimized Path Aggregation Network–Feature Pyramid Network (PAN-FPN) to enable effective interaction between low-level spatial features and high-level semantic information, thereby enhancing robustness to complex pest morphologies.
In the Detection Head, YOLOv11 combines anchor-based and anchor-free paradigms and incorporates dynamic label assignment and adaptive loss re-weighting strategies, which jointly improve classification confidence and bounding-box localization accuracy.
During training, Mosaic and MixUp data augmentation techniques were applied to improve model generalization under complex field conditions. During inference, an improved Non-Maximum Suppression (NMS) strategy was used to suppress redundant detections and enhance prediction stability. Overall, YOLOv11 demonstrates a favorable trade-off between detection accuracy and computational efficiency, making it well suited for multi-class rice pest detection tasks [34].
To further optimize performance, the learning rate of YOLOv11 was determined through a grid-search strategy in the range of 0.001 to 0.01 with a step size of 0.001, and the optimal value was identified as 0.002. The optimizer was configured in automatic mode to select an appropriate optimization strategy during training. Model training was conducted for a maximum of 300 epochs, with an early-stopping mechanism that terminated training if no performance improvement was observed over 100 consecutive epochs.
For comparative evaluation, YOLOv5s, YOLOv8s, Faster R-CNN, and RetinaNet were selected as benchmark models. All comparison models were trained for 300 epochs using the Adam optimizer with a fixed learning rate of 0.001 and their default data augmentation and architectural settings as provided in the official implementations. Although a unified hyperparameter search across all models was not conducted due to computational constraints, identical training durations and evaluation protocols were adopted to ensure a consistent and transparent performance comparison.
2.5. Evaluation Metrics
To comprehensively evaluate the performance of the proposed model on rice pest detection, this study adopts widely used metrics from the COCO and Pascal VOC evaluation protocols, including Precision, Recall, Average Precision (AP), and mean Average Precision (mAP). Precision and Recall assess the model’s performance under a single confidence threshold, whereas AP and mAP provide an integrated measurement across multiple confidence levels, offering a more holistic view of detection capability.
Precision and Recall are defined as follows:
where TP, FP, TN, and FN denote the numbers of True Positives, False Positives, True Negatives, and False Negatives.
Model performance is further evaluated using mAP@0.5 and mAP@0.5:0.95, strictly following the standard evaluation protocols adopted in object detection benchmarks such as COCO and Pascal VOC. In this study, average precision (AP) is defined as the area under the precision–recall (PR) curve, rather than pointwise precision computed at a single confidence threshold. The PR curve is obtained by varying the detection confidence threshold and computing precision and recall across all recall levels.
Specifically, mAP@0.5 denotes the mean of per-class AP values calculated at a fixed Intersection over Union (IoU) threshold of 0.5, reflecting the detection performance under a relatively lenient localization criterion. In contrast, mAP@0.5:0.95 represents the average AP across multiple IoU thresholds ranging from 0.5 to 0.95 with a step size of 0.05, thereby providing a more stringent and comprehensive assessment of localization accuracy and bounding-box regression robustness under complex field conditions and varying object scales.
The overall mAP is computed as:
where denotes the average precision of the i-th pest class and n is the total number of classes. Collectively, these metrics enable a rigorous and unambiguous evaluation of multi-class pest detection performance in real agricultural environments, while explicitly distinguishing integrated AP-based indicators from pointwise precision and recall.
3. Results
3.1. Experimental Environment and Parameter Settings
To achieve high-precision recognition of multiple rice pest species, this study employed YOLOv11 as the core detection framework and optimized its hyperparameters through a systematic experimental process. The optimal configuration was obtained when the learning rate was set to 0.002, the optimizer was configured in auto mode to automatically determine the most suitable strategy.
All experiments were conducted on an Ubuntu server equipped with an NVIDIA GeForce RTX 3090 GPU, with the software environment comprising Python 3.10.18, PyTorch 2.6.0, Ultralytics 8.3.181, Scikit-learn 1.7.2, and CUDA 12.4. This setup provided a stable computational foundation, ensuring reproducibility and reliability in model training and evaluation.
3.2. Prediction Performance Evaluation
To ensure a fair and interpretable comparison, YOLOv5s, YOLOv8s, Faster R-CNN [35], and RetinaNet [36] were selected as baseline detectors. All models were trained using their official implementations, and the training duration was kept consistent with YOLOv11. Performance comparisons are presented in Table 3 using standard object detection metrics.
Table 3.
Accuracy of each model.
YOLOv11 achieves the most consistent performance across evaluation criteria. Its pointwise precision (0.7969) and recall (0.7071) indicate a balanced trade-off between detection accuracy and sensitivity. Meanwhile, the integrated metrics mAP@0.5 (0.7550) and mAP@0.5:0.95 (0.5513) demonstrate reliable localization performance and robustness across multiple IoU thresholds.
YOLOv5s attains slightly higher recall but lower precision, reflecting a tendency to detect more targets at the cost of increased false positives. YOLOv8s exhibits a noticeable decline in both mAP@0.5 and mAP@0.5:0.95, suggesting insufficient robustness when applied to complex, multi-class field scenarios. Faster R-CNN and RetinaNet achieve relatively high mAP@0.5 values for selected pest species; however, their low precision indicates a substantial false-positive burden, limiting their practical usability.
Taken together, the results confirm that YOLOv11 offers the most balanced and stable detection performance when both pointwise and integrated metrics are jointly considered.
Figure 4 illustrates the detection performance of the YOLOv11 model across nine representative rice pest species that exert significant impact in Hunan Province, evaluated using Precision, Recall, AP@0.5, and AP@0.5:0.95 metrics. Overall, YOLOv11 achieved consistently high accuracy across most pest categories, demonstrating strong stability and generalization ability.
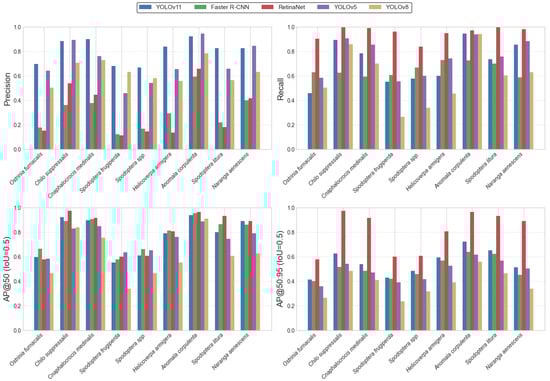
Figure 4.
Bar chart of accuracy for each model.
Although YOLOv11 did not attain the highest Recall for certain species such as Ostrinia furnacalis, it maintained the most stable performance and the best trade-off among all models in terms of Precision and overall balance. These results indicate that YOLOv11 can accurately detect multiple pest species under complex field conditions, highlighting its robustness and practical value for reliable automated pest monitoring in agricultural environments.
A comparative analysis reveals that RetinaNet achieves strong performance in Recall and AP@0.5:0.95 across most categories; however, its markedly low Precision indicates a substantial tendency toward false positives. Although the model detects a large number of potential instances, this imbalance undermines its overall reliability. The abnormally high AP@0.5:0.95 observed in several categories further suggests an over-sensitivity or systematic misclassification, limiting the model’s suitability for field-scale pest monitoring, where both accuracy and stability are essential.
YOLOv8 exhibits notable declines in AP@0.5 and AP@0.5:0.95 for several pest categories. Given the distributional characteristics of the dataset, these deficiencies likely arise from insufficient sample size or imbalance across categories, constraining the model’s ability to learn robust multi-scale and cross-scenario representations. Notably, YOLOv11 also shows reduced AP@0.5:0.95 for a small subset of morphologically similar pests, indicating that its localization precision and bounding-box regression remain improvable under stricter IoU thresholds.
To evaluate the counting performance of different models under complex field conditions, 50 test images containing diverse, dense, and partially overlapping pest individuals were selected. Manual inspection indicated that the number of pest instances per image ranged from 25 to 98, resulting in a total of 1237 annotated targets.
Among the evaluated models, YOLOv11 produced count estimates that were closest to the manual annotations, with an absolute error of 17 instances. In comparison, YOLOv5 and Faster R-CNN exhibited larger counting deviations, with absolute errors of 79 and 86 instances, respectively. These results suggest that YOLOv11 offers more stable counting behavior in dense and cluttered scenes, although other models may outperform it on individual detection metrics. Overall, the counting experiment highlights a trade-off between detection sensitivity and counting stability, with YOLOv11 demonstrating comparatively robust performance in scenarios involving high object density and overlap (Figure 5).
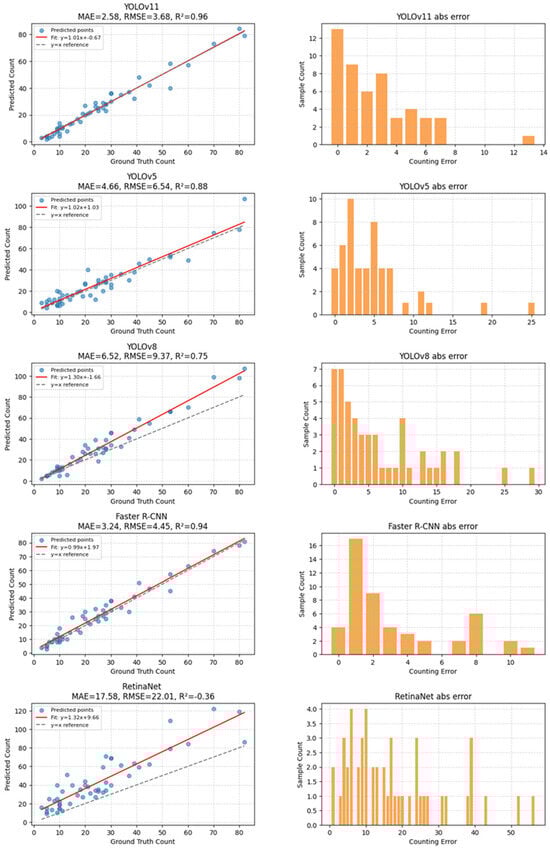
Figure 5.
Model Counting Test Results.
To further assess the class-specific recognition performance of YOLOv11, a confusion matrix was constructed at an IoU threshold of 0.5 (Figure 6), and detailed analyses were performed for each pest category. The results indicate that the model exhibits strong discriminative ability for most classes, though some misclassifications remain. For example, Spodoptera spp. and Sesamia inferens were occasionally confused, some Geometridae samples were misidentified as Spodoptera frugiperda or Spodoptera litura, and Agrotis ipsilon individuals were occasionally classified as Spodoptera litura. These confusions are primarily attributed to morphological similarity and limited sample numbers, which increase classification difficulty. Further examination of the evaluation metrics in Table S1 shows that Scotogramma trifolii, Tryporyza incertulas, and Agrotis ipsilon exhibit the lowest AP@50 values. Among them, Scotogramma trifolii records an AP@50 of only 0.4335, with an identification accuracy of merely 0.3524. These results are fully consistent with the confusion patterns observed in the earlier confusion matrix, further confirming the model’s difficulty in accurately recognizing these specific categories.
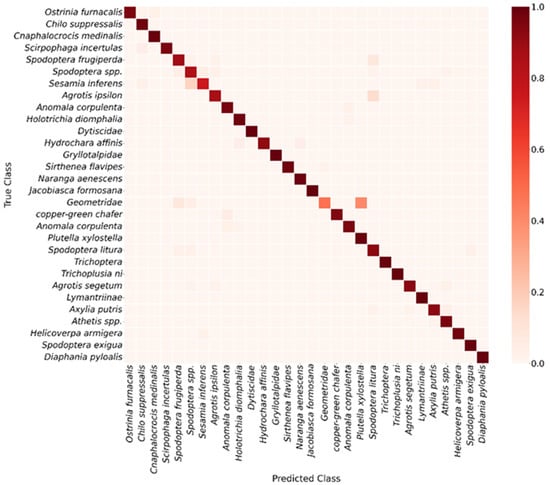
Figure 6.
Confusion matrix of YOLOv11 model.
To visually demonstrate the model’s field detection performance, selected test samples were annotated with ground-truth and predicted bounding boxes (Figure 7). The results show that YOLOv11 accurately detects the majority of pest instances, with predicted boxes closely overlapping ground-truth annotations. Target localization is precise and bounding boxes align well. In images with clear pest features and minimal background interference, the model achieved detection results nearly identical to manual annotations, reflecting strong feature extraction and spatial localization capabilities.
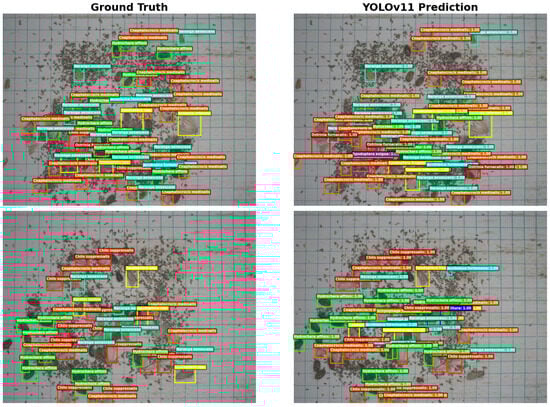
Figure 7.
Prediction results and ground truth boxes of the YOLOv11 model.
In more challenging scenarios with overlapping pests or uneven illumination, YOLOv11 effectively distinguished adjacent individuals and produced reasonable predictions, demonstrating robustness in dense-object environments. Minor false positives and missed detections mainly occurred in regions where pest coloration closely matched the background or individuals were partially occluded, reflecting inherent challenges related to sample distribution and subtle small-object features. Overall, YOLOv11 exhibited high detection accuracy and stability across multiple pest categories, with predicted results closely aligned with ground-truth annotations, supporting its practical application in automated field pest identification and population monitoring.
4. Discussion
In this study, we constructed the RicePest-30 dataset based on field insect images collected using UV light traps, supplemented by a limited amount of web-sourced data. The dataset covers 30 major rice pest species and contains 8848 images with approximately 62,227 annotated bounding boxes. Its design and construction exhibit notable characteristics and research value.
Compared with earlier datasets such as Pest24, which adopted circular framing, RicePest-30 uniformly uses square compositions. This avoids the black-edge regions caused by circular fields of view and enhances spatial completeness and effective image utilization. Moreover, the square layout captures richer spatial context, such as pest distribution patterns and environmental background, enabling models to extract more informative features. These properties significantly improve dataset robustness and representativeness under real-world field conditions with variable illumination, complex backgrounds, and overlapping insects. In addition, the dataset implements refined bounding-box annotations and strict verification procedures to ensure label accuracy and consistency. It also preserves natural class distribution and diversity in capture conditions (e.g., illumination, angle, distance), providing a realistic, reproducible, and extensible benchmark platform for pest detection research.
The YOLOv11 model trained on RicePest-30 achieved strong performance, with a mAP@50 of 0.7550. The model performs particularly well on categories with clear insect structures but exhibits certain false positives and false negatives on small targets, heavily occluded insects, or images with uneven illumination—issues closely related to the morphological complexity of pest species and class imbalance within the dataset [37].
Comparisons with previous versions (YOLOv5 and YOLOv8) demonstrate that YOLOv11 achieves substantial improvements in both accuracy and inference speed, increasing mAP@50 by approximately 1.8% and 16.36%, respectively, and improving inference speed by about 12% [38]. These gains largely stem from its enhanced feature extraction and fusion modules (e.g., C2f and GELAN) and improved multi-scale detection strategies [39]. In contrast, two-stage models such as Faster R-CNN retain advantages when detecting larger or sparsely distributed pests but suffer from slow inference and reduced localization accuracy in dense small-object scenarios. Although the RetinaNet model achieves very high precision for certain pest categories, its performance is poor across several other categories, accompanied by a substantial risk of false positives, resulting in insufficient overall detection balance.
Visualization results further confirm that YOLOv11 produces bounding boxes highly consistent with ground truth, demonstrating accurate spatial localization and strong discrimination ability. Even under challenging conditions such as illumination variation and cluttered backgrounds, the model can effectively differentiate adjacent individuals, reflecting robust generalization performance. The remaining errors are mainly associated with insects blending into the background or partially occluded, which may be mitigated through targeted sample enrichment and small-object optimization strategies [40]. However, when the IoU threshold is raised to 0.5:0.95, the AP values for several pest categories drop markedly, indicating that the model’s boundary regression and localization precision still have room for improvement under stricter criteria. Overall, while YOLOv11 demonstrates clear advantages in overall performance, stability, and practical applicability, its localization robustness for small targets, morphologically similar categories, and high-IoU conditions remains somewhat limited.
YOLOv11 demonstrates stable and consistent performance in counting tasks under dense field conditions. The counting experiment was conducted on 50 test images selected to represent challenging scenarios, including high insect density, multi-species coexistence, and partial target overlap. These images cover a wide range of infestation levels, with pest counts per image spanning from low-density to highly crowded conditions, thereby enabling a focused evaluation of counting robustness beyond standard detection metrics.
Based on regression analysis, YOLOv11 achieved a total counting error of 17 instances across the selected images. The corresponding regression slope (1.01), intercept (−0.67), coefficient of determination (R2 = 0.96), and RMSE (3.68) indicate a strong linear agreement between predicted and ground-truth counts. In comparison, YOLOv5 and Faster R-CNN exhibited larger counting deviations, while YOLOv8 and RetinaNet showed substantially broader error distributions, with long-tailed absolute errors exceeding 30–40 insects in multiple samples. In particular, RetinaNet displayed pronounced over- and under-counting in high-density scenes, suggesting limited stability when insect overlap becomes severe.
It should be noted that the counting experiment focuses primarily on dense and complex scenes, where detection ambiguity and object overlap are most pronounced. While this setting highlights the relative robustness of YOLOv11 in high-density scenarios, model behavior under sparse or moderately populated conditions may differ. Therefore, the reported results should be interpreted as evidence of improved counting stability under challenging field conditions, rather than as a universal advantage across all insect density levels.
Analysis of the confusion matrix alongside AP@50 metrics reveals that while YOLOv11 performs well across most pest categories, it faces substantial challenges with morphologically similar or poorly delineated classes. For instance, pests such as Geometridae, Sesamia inferens, Spodoptera spp. show elevated misclassification rates, indicating that even at an IoU threshold of 0.5, the model’s discriminative capacity remains constrained. These pests exhibit minimal differences in fine-grained features such as wing venation, texture patterns, and body coloration, and their appearances in field images are often complicated by variable postures, occlusions, and lighting conditions, resulting in highly overlapping feature spaces. Consequently, AP@50 values for species like Geometridae, Sesamia inferens, Agrotis ipsilon are notably low, consistent with high misclassification rates observed in the confusion matrix. Collectively, these “confusing classes” highlight inherent limitations of current deep detection models in handling morphologically similar, small-sample, and boundary-ambiguous targets, and emphasize the need for future work to improve performance via multi-scale feature enhancement, fine-grained representation learning, and strategies addressing class imbalance.
Overall, YOLOv11 offers a strong combination of high accuracy, robustness, and inference efficiency across pest detection and counting tasks, making it suitable for automated field pest monitoring. Nonetheless, its performance is still constrained by class imbalance, small-object detection challenges, and feature drift under varying illumination. It should also be noted that YOLOv11 benefited from task-specific hyperparameter tuning, whereas the benchmark models were trained using default configurations from their official implementations; although this reflects common practice in applied studies, it may introduce a degree of bias in direct performance comparison. Future work may therefore explore more homogeneous optimization strategies across models to further strengthen comparative fairness. Future work may address these issues by: (1) integrating structures with improved global feature modeling capability [41]; (2) expanding sample diversity via adaptive data augmentation or generative adversarial networks (GANs); and (3) incorporating multimodal information, such as meteorological factors and time-series pest data, to enable spatiotemporal pest prediction [42].
5. Conclusions
This study constructs RicePest-30, a field-oriented rice pest detection dataset with 8848 images and 62,227 annotations across 30 categories, addressing limitations of existing resources in diversity, annotation quality, and real-scene complexity. Based on this dataset, YOLOv11 shows stable performance but still encounters errors in small, dense, and illumination-disturbed scenarios, mainly due to class imbalance and high intra-class variability. Our contributions lie in building a comprehensive, standardized dataset and providing systematic model evaluation and error analysis rather than proposing architectural advances. RicePest-30 offers a reproducible benchmark for future research, and further progress may come from multimodal fusion, enhanced small-object detection, and advanced data augmentation or generation strategies.
Supplementary Materials
The following supporting information can be downloaded at: https://www.mdpi.com/article/10.3390/agronomy16010053/s1, Table S1: Detailed per-class detection results of YOLOv11 for rice pest species.
Author Contributions
Conceptualization, C.C.; methodology, B.M.; software, Q.Z. and C.L.; validation, Z.Z.; formal analysis, Z.Z.; investigation, C.L.; resources, B.M.; data curation, Q.Z. and C.L.; writing—original draft preparation, Z.Z.; writing—review and editing, B.M. and Z.Z.; visualization, C.L.; supervision, C.C.; project administration, C.C.; funding acquisition, B.M. and C.C. All authors have read and agreed to the published version of the manuscript.
Funding
This research was funded by the Science and Technology Innovation Program of Hunan Province under the grant 2023ZJ1080, Yuelushan Laboratory Breeding Program under the grant YLS-2025-ZY01015, and the Hunan Natural Science Foundation under the grant 2025JJ60419.
Data Availability Statement
The data presented in this study are openly available in GitHub at: https://github.com/kkb20334-lang/RicePest-30 (accessed on 21 December 2025).
Acknowledgments
During the preparation of this manuscript/study, the authors used generative AI tools for the purposes of smooth translation. The authors have reviewed and edited the output and take full responsibility for the content of this publication.
Conflicts of Interest
The authors declare no conflicts of interest.
References
- Bandumula, N. Rice production in Asia: Key to global food security. Proc. Natl. Acad. Sci. India Sect. B. Biol. Sci. 2018, 88, 1323–1328. [Google Scholar] [CrossRef]
- McBeath, J.H.; McBeath, J. Plant diseases, pests and food security. In Environmental Change and Food Security in China; Springer: Berlin/Heidelberg, Germany, 2010; pp. 117–156. [Google Scholar]
- Savary, S.; Ficke, A.; Aubertot, J.N.; Hollier, C. Crop losses due to diseases and their implications for global food production losses and food security. Food Secur. 2012, 4, 519–537. [Google Scholar] [CrossRef]
- Zheng, Y.; Zheng, W.; Du, X. A lightweight rice pest detection algorithm based on improved YOLOv8. Sci. Rep. 2024, 14, 1–18. [Google Scholar] [CrossRef] [PubMed]
- Wu, X.; Zhan, C.; Lai, Y.-K.; Cheng, M.-M.; Yang, J. IP102: A large-scale benchmark dataset for insect pest recognition. In Proceedings of the IEEE/CVF Conference on Computer Vision and Pattern Recognition, Long Beach, CA, USA, 15–20 June 2019; pp. 8787–8796. [Google Scholar]
- Ding, B.; Tian, Y.; Guo, X.; Wang, L.; Tian, X. Improving Rice Pest Management Through RP11: A Scientifically Annotated Dataset for Adult Insect Recognition. Life 2025, 15, 910. [Google Scholar] [CrossRef]
- Wang, Q.J.; Zhang, S.Y.; Dong, S.F.; Zhang, G.C.; Yang, J.; Li, R.; Wang, H.Q. Pest24: A large-scale very small object data set of agricultural pests for multi-target detection. Comput. Electron. Agric. 2020, 175, 105585. [Google Scholar] [CrossRef]
- Yuan, Y.; Chen, L.; Wu, H.; Li, L. Advanced agricultural disease image recognition technologies: A review. Inf. Process. Agric. 2022, 9, 48–59. [Google Scholar] [CrossRef]
- Iqbal, Z.; Khan, M.A.; Sharif, M.; Shah, J.H.; ur Rehman, M.H.; Javed, K. Automated detection and classification of citrus plant diseases using image processing techniques: A review. Comput. Electron. Agric. 2018, 153, 12–32. [Google Scholar] [CrossRef]
- Kumar, R.; Martin, V.; Moisan, S. Robust Insect Classification Applied to Real Time Greenhouse Infestation Monitoring. In Proceedings of the 20th International Conference on Pattern Recognition on Visual Observation and Analysis of Animal and Insect Behavior Workshop, Istanbul, Turkey, 22 August 2010. [Google Scholar]
- Yalcin, H. Vision-based automatic inspection of insects in pheromone traps. In Proceedings of the Fourth International Conference on Agro-Geoinformatics, Istanbul, Turkey, 20–24 July 2015; pp. 333–338. [Google Scholar]
- Tugrul, B.; Elfatimi, E.; Eryigit, R. Convolutional neural networks in detection of plant leaf diseases: A review. Agriculture 2022, 12, 1192. [Google Scholar] [CrossRef]
- Wang, S.; Xu, D.; Liang, H.; Bai, Y.; Li, X.; Zhou, J.; Su, C.; Wei, W. Advances in deep learning applications for plant disease and pest detection: A review. Remote Sens. 2025, 17, 698. [Google Scholar] [CrossRef]
- Upadhyay, A.; Chandel, N.S.; Singh, K.P.; Subeesh, A.; Chakraborty, S.K.; Nandede, B.M.; Kumar, M.; Upendar, K.; Salem, A.; Elbeltagi, A. Deep learning and computer vision in plant disease detection: A comprehensive review of techniques, models, and trends in precision agriculture. Artif. Intell. Rev. 2025, 58, 92. [Google Scholar] [CrossRef]
- Fuentes, A.; Yoon, S.; Kim, S.C.; Park, D.S. A robust deep-learning-based detector for real-time tomato plant diseases and pests recognition. Sensors 2017, 17, 2022. [Google Scholar] [CrossRef] [PubMed]
- Lin, T.L.; Chang, H.Y.; Chen, K.H. Pest and Disease Identification in the Growth of Sweet Peppers using Faster R-CNN. In Proceedings of the IEEE International Conference on Consumer Electronics-Taiwan (ICCE-TW), Yilan, Taiwan, 20–22 May 2019. [Google Scholar]
- Yang, H.; Lin, D.; Zhang, G.; Zhang, H.; Wang, J.; Zhang, S. Research on Detection of Rice Pests and Diseases Based on Improved yolov5 Algorithm. Appl. Sci. 2023, 13, 10188. [Google Scholar] [CrossRef]
- Zhou, T.; Wei, L. YOLO-DP: A detection model of fifteen common rice diseases and pests. Sci. Rep. 2025, 15, 35968. [Google Scholar] [CrossRef] [PubMed]
- Yang, S.; Xing, Z.; Wang, H.; Dong, X.; Gao, X.; Liu, Z.; Zhang, X.; Li, S.; Zhao, Y. Maize-YOLO: A new high-precision and real-time method for maize pest detection. Insects 2023, 14, 278. [Google Scholar] [CrossRef]
- Yang, Z.J.; Feng, H.L.; Ruan, Y.P.; Weng, X. Tea tree pest detection algorithm based on improved YOLOv7-Tiny. Agriculture 2023, 13, 1031. [Google Scholar] [CrossRef]
- Wang, J.; Wang, T.; Xu, Q.; Gao, L.; Gu, G.; Jia, L.; Yao, C. RP-DETR: End-to-end rice pests detection using a transformer. Plant Methods 2025, 21, 63. [Google Scholar] [CrossRef]
- Yin, J.; Huang, P.; Xiao, D.; Zhang, B. A lightweight rice pest detection algorithm using improved YOLOv8. Agriculture 2024, 14, 1052. [Google Scholar] [CrossRef]
- Deng, J.; Yang, C.; Huang, K.; Lei, L.; Ye, J.; Zeng, W.; Zhang, J.; Lan, Y.; Zhang, Y. Deep learning-based rice disease and insect pest detection on a mobile phone. Agronomy 2023, 13, 2139. [Google Scholar] [CrossRef]
- Irtiza, M.S.; Ahmed, F.; Haque, M.T.; Tamim, A.R.; Sultana, S. Analysis of Deep Learning Models on Low-Light Pest Detection. Ph.D. Thesis, Brac University, Dhaka, Bangladesh, 2022. [Google Scholar]
- Zhang, J.; Liu, Z.; Yu, K. MSFNet-CPD: Multi-scale cross-modal fusion network for crop pest detection. arXiv 2025, arXiv:2505.02441. [Google Scholar]
- Qian, Y.; Xiao, Z.; Deng, Z. Fine-grained crop pest classification based on multi-scale feature fusion and mixed attention mechanisms. Front. Plant Sci. 2025, 16, 1500571. [Google Scholar] [CrossRef]
- Wang, R.; Liu, L.; Xie, C.; Yang, P.; Li, R.; Zhou, M. AgriPest: A large-scale domain-specific benchmark dataset for practical agricultural pest detection in the wild. Sensors 2021, 21, 1601. [Google Scholar] [CrossRef] [PubMed]
- Ejaz, M.H.; Bilal, M.; Habib, U. Crop pest classification using deep learning techniques: A review. arXiv 2025, arXiv:2507.01494. [Google Scholar] [CrossRef]
- Ahmed, S.; Marwat, S.N.K.; Brahim, G.B.; Khan, W.U.; Khan, S.; Al-Fuqaha, A.; Koziel, S. IoT based intelligent pest management system for precision agriculture. Sci. Rep. 2024, 14, 31917. [Google Scholar] [CrossRef] [PubMed]
- Shafay, M.; Hassan, T.; Owais, M.; Hussain, I.; Khawaja, S.G.; Seneviratne, L.; Werghi, N. Recent advances in plant disease detection: Challenges and opportunities. Plant Methods 2025, 21, 140. [Google Scholar] [CrossRef]
- Guo, B.; Wang, J.; Guo, M.; Chen, M.; Chen, Y.; Miao, Y. Overview of pest detection and recognition algorithms. Electronics 2024, 13, 3008. [Google Scholar] [CrossRef]
- Shoaib, M.; Sadeghi-Niaraki, A.; Ali, F.; Hussain, I.; Khalid, S. Leveraging Deep Learning for Plant Disease and Pest Detection: A Comprehensive Review and Future Directions. Front. Plant Sci. 2025, 16, 1538163. [Google Scholar] [CrossRef]
- Khanam, R.; Hussain, M. YOLOv11: An Overview of the Key Architectural Enhancements. arXiv 2024, arXiv:2410.17725. [Google Scholar] [CrossRef]
- Zhang, M.; Ye, S.; Zhao, S.; Wang, W.; Xie, C. Pear Object Detection in Complex Orchard Environment Based on Improved YOLO11. Symmetry 2025, 17, 255. [Google Scholar] [CrossRef]
- Ren, S.; He, K.; Girshick, R.; Sun, J. Faster R-CNN: Towards Real-Time Object Detection with Region Proposal Networks. IEEE Trans. Pattern Anal. Mach. Intell. 2016, 39, 1137–1149. [Google Scholar] [CrossRef]
- Lin, T.; Goyal, P.; Girshick, R.; He, K.; Dollár, P. Focal Loss for Dense Object Detection. In Proceedings of the 2017 IEEE International Conference on Computer Vision (ICCV), Venice, Italy, 22–29 October 2017; pp. 2999–3007. [Google Scholar]
- Barbedo, J.G.A. Detecting and Classifying Pests in Crops Using Proximal Images and Machine Learning: A Review. AI 2020, 1, 312–328. [Google Scholar] [CrossRef]
- Zhao, Q.; Zhu, J. An Improved YOLOv11 Architecture with Multi-Scale Attention and Spatial Fusion for Fine-Grained Residual Detection. Results Eng. 2025, 27, 107061. [Google Scholar] [CrossRef]
- He, L.; Zhou, Y.; Liu, L.; Cao, W.; Ma, J. Research on object detection and recognition in remote sensing images based on YOLOv11. Sci. Rep. 2025, 15, 14032. [Google Scholar] [CrossRef]
- Iqra; Giri, K.J.; Javed, M. Small object detection in diverse application landscapes: A survey. Multimed. Tools Appl. 2024, 83, 88645–88680. [Google Scholar] [CrossRef]
- Li, Y.; Mao, H.; Girshick, R.; He, K. Exploring Plain Vision Transformer Backbones for Object Detection. In European Conference on Computer Vision; Springer: Cham, Switzerland, 2022; pp. 280–296. [Google Scholar]
- Kopton, J.; de Bruin, S.; Schulz, D.; Luedeling, E. Combining Spatio-Temporal Pest Risk Prediction and Decision Theory to Improve Pest Management in Smallholder Agriculture. Comput. Electron. Agric. 2025, 236, 110426. [Google Scholar] [CrossRef]


Disclaimer/Publisher’s Note: The statements, opinions and data contained in all publications are solely those of the individual author(s) and contributor(s) and not of MDPI and/or the editor(s). MDPI and/or the editor(s) disclaim responsibility for any injury to people or property resulting from any ideas, methods, instructions or products referred to in the content. |
© 2025 by the authors. Licensee MDPI, Basel, Switzerland. This article is an open access article distributed under the terms and conditions of the Creative Commons Attribution (CC BY) license.