Abstract
Real-time and accurate monitoring of rice nitrogen status is essential for precision nitrogen management. Although unmanned aerial vehicle (UAV)-based spectral sensors have been widely used, existing estimation models that rely solely on crop phenotypes still suffer from limited accuracy and stability. In this study, the UAV vegetation indices (VIs), meteorological parameters (M) and fertilization (F) data were incorporated as input variables to establish rice N nutrition index (NNI) estimation models using three machine learning (ML) algorithms (adaptive boosting (AB), partial least squares (PLSR) and random forest (RF). The results showed that the models’ predictive accuracy ranked as follows based on input variable combinations: VI + M + F > VI + F > VI + M > VI. Among the three ML models, the RF algorithm demonstrated the best performance and achieved validation R2 values ranging from 0.94 to 0.95 across all growth stages. Both meteorology and fertilization factors benefited the model, with their incorporation greatly improving model accuracy. This demonstrated the potential to enhance the diagnosis of seasonal rice nitrogen status and provide guidance for in-season site-specific N management through consumer-grade UAV imagery and machine learning.
1. Introduction
Nitrogen (N) status is an important diagnostic indicator of rice growth [1], and accurate, real-time nitrogen (N) monitoring is vital for guiding site-specific fertilization in modern rice production, which is a key aspect in modern agriculture [2]. Improving the utilization of N fertilizer has important strategic value for environmental protection, food security and climate change [3,4].
Nitrogen nutrient index (NNI) is defined as the ratio of actual plant N concentration to a critical N concentration derived from biomass [5], enabling a growth-stage-adjusted assessment of N status. It has been widely used as a key indicator to evaluate the adequacy of N content in crops and used as a basis for N application decisions in recent years. The traditional method required destructive sampling and then laboratory measurements to obtain measured NNI data [6]. This method was costly and time-inefficient, making it difficult to meet the needs of modern agriculture. With the advancement of technology, some handheld spectral sensors were used to achieve crop growth indicator monitoring with the advantage of non-destructive sampling [7]. Active canopy sensors GreenSeeker (Trimble Inc., Sunnyvale, CA, USA) and Soil Plant Analysis Development (SPAD, Minolta Camera Co., Osaka, Japan) were two of the most widely used tools for rapid, non-contact diagnosis of crop N status [8,9]. SPAD was used to quickly measure the relative chlorophyll content of plant leaves; this information was applied to N management to improve N fertilizer utilization and increase crop yield [8]. GreenSeeker was used to measure the crop canopy and calculate the VI of the crop at a particular sampling point by using the different bands obtained, such as the normalized difference vegetation index (NDVI), and then the crop N status was indirectly diagnosed and estimated by establishing the relationship between the vegetation index and the crop N index [10]. Measuring the N status of rice by handheld spectral sensors was destructive and efficient; however, this method only achieved single-point measurement, which made it difficult to achieve representative monitoring at the field and regional scales.
Remote sensing technology, as an emerging technology, has been widely used to monitor crop growth indicators at the regional scale by using the electromagnetic spectrum in recent years. Various types of images acquired by satellite remote sensing could cover large-scale crops, from which band information and relevant VIs were extracted. This enabled the monitoring and estimation of crop biomass [11], LAI [12], N and yield by analyzing and establishing relationships with crop growth indicators [13,14]. However, it was difficult for satellite remote sensing to meet the needs at the field scale because of its low resolution; at the same time, satellite remote sensing was seriously influenced by weather, making it difficult to provide real-time information. The emergence of UAV remote sensing, which not only provided high-precision remote sensing images at the field scale but was also very timely, promoted the development of precision agriculture. Using UAVs with multiple types of cameras achieved the monitoring of crop leaf area [15], dry biomass [16,17], N status [18] and yield estimation [19].
When using UAVs for image processing, wavelet transforms are often used [20]. The use of single VIs to establish a rice NNI estimation model resulted from limited band information. For example, the normalized difference vegetation index (NDVI) was only combined with red and near-infrared bands. Other band information from UAV images might also correlate well with rice NNI, so a combination of multiple VIs for predicting rice NNI could improve the estimation accuracy [21]. In recent years, machine learning (ML) algorithms, such as adaptive boosting (AB), partial least squares (PLSR) and random forest (RF), have been used for the estimation of crop growth parameters and have performed very well [22]. When using ML algorithms to establish rice NNI estimation models, a large number of VIs were synthesized.
The monitoring of rice indicators by extracting the corresponding VIs from UAVs is usually based on crop phenotypes and lacks the analysis of rice growth mechanistic factors. During the growth of rice, meteorology and fertilizer application were important influencing factors to determine the nutrient uptake of the crop [23,24]. It was well known that meteorological factors could affect photosynthesis and yield of the crop, and that the nutrient uptake of rice might change under climate change conditions. For example, temperature increase and canopy warming showed different effects on nutrient concentration, nutrient accumulation and utilization efficiency [25]. It was found that soil moisture deficiency led to plant water stress, which affected physiological regulation while limiting assimilation and thus increased the risk of crop yield loss [26]. Precipitation, as an important source of soil moisture, indirectly affected rice growth, N uptake, transformation and accumulation [27]. Meanwhile, the amount and radiation efficiency of solar radiation during the key growth period were important factors affecting crop yield. Studies have found that increasing radiation resources was beneficial for increasing crop productivity [28].
In summary, current UAV-VI approaches estimate NNI solely from canopy spectral information and ignore the mechanistic drivers—weather dynamics and fertilization regimes—that govern N uptake and transformation. This omission limits model accuracy and stability across seasons and environments, creating a clear need to integrate multi-source data for robust, growth-stage-specific N monitoring. The objectives of this study, then, are as follows: (1) to evaluate the possibility of using UAV-VIs and ML algorithms to estimate rice NNI at different growth periods; (2) to explore the roles of meteorology and fertilization parameters for NNI estimation.
2. Materials and Methods
2.1. Experimental Design
Field experiments were conducted over two consecutive growing seasons (2019–2020) in the Pukou (32°04′15″ N, 118°28′21″ E) and Luhe (32°25′4″ N, 118°59′18″ E) districts of Nanjing, Jiangsu Province, China (Figure 1). The experimental region experiences a tropical humid climate with a mean annual temperature of 15.4 °C. We employed the japonica rice cultivar Nanjing 5055, selected for its strong disease resistance. The derived models may not capture the nitrogen-uptake dynamics of other genotypes and should be validated across diverse cultivars before wider application. A uniform planting density of 105 kg ha−1 was maintained across all experimental plots. Seedlings were transplanted using a standard 20 cm × 20 cm spacing, initiated when they reached the two-tiller stage. Specific treatment details are provided in Figure 1 and Table 1.
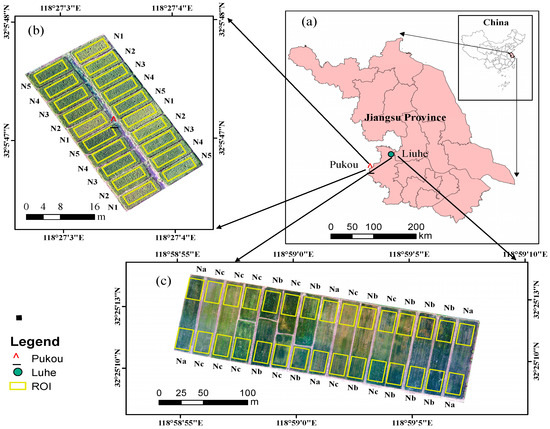
Figure 1.
Location and layout of experimental plots. (a) Map of Nanjing City, Jiangsu Province, China, showing the Pukou and Luhe districts. (b) UAV orthophoto of the 0.27 ha Pukou site divided into 20 plots (four replicates × five N treatments: N1–N5). (c) UAV orthophoto of the 3 ha Luhe site divided into 15 plots (five replicates × three N treatments: Na–Nc). Yellow rectangles mark the regions of interest (ROIs) used for vegetation-index extraction and ground-truth sampling.

Table 1.
Fertilization treatments in field experiments.
For the Pukou experimental site, the 0.27 ha experimental field was divided into 20 plots, comprising five treatments with four replicates each (Figure 1, Table 1). The soil was classified as paddy soil, with the following properties: organic matter 22.26 g kg−1, total N 1.31 g kg−1, Olsen-P 15.41 mg kg−1 and NH4OAc-K 146.4 mg kg−1. Rice was transplanted on 12 June 2019 and 20 June 2020, with harvests occurring on 2 November 2019 and 10 November 2020, respectively. For the Luhe experimental site, a 3 ha field was divided into 15 plots for three treatments with five replicates. The silt loam soil exhibited these characteristics: organic matter 26.56 g kg−1, total N 1.58 g kg−1, Olsen-P 15.21 mg kg−1 and NH4OAc-K 166.2 mg kg−1. Transplanting dates were 18 June 2019 and 20 June 2020; corresponding harvests took place on 5 November 2019 and 16 November 2020.
The controlled-release urea (CRU) coated with 10% waterborne polyacrylate (Jiangsu ISSAS New Fertilizer Engineering & Technology Co., Ltd., Yangzhou, China) was used with a N content of 42% and a N release longevity of 3 months. Superphosphate and potassium chloride were incorporated into the 10–15 cm soil layer for all treatments at rates of 75 kg P2O5 ha−1 and 120 kg K2O ha−1 as basal fertilizers. Agronomic practices were identical across plots and years. Before transplanting, fields were puddled to a depth of 15 cm and leveled with a laser-guided board. Irrigation followed the conventional mid-season drainage pattern: 5 cm standing water was maintained for the first 10 d after transplanting, followed by alternate wetting and drying cycles until 10 d before harvest. Weeds were controlled with pre-emergence bensulfuron-methyl (60 g a.i. ha−1) followed by one hand weeding at 30 d after transplanting. Stem-borer and leaf-folder infestations were managed with two applications of chlorantraniliprole (20 g a.i. ha−1) at panicle initiation and full heading. No additional P or K fertilizer was applied beyond the basal doses described above.
2.2. Crop Data Acquisition
Rice sampling and UAV photography were conducted at the jointing, flowering, filling and maturity stages in 2019 and 2020 (Table 2). In every region of interest (ROI) (Figure 1) of the Luhe and Pukou experimental plots, three representative hills of rice were collected as a sample and then processed in the laboratory for analysis. The aboveground part of each rice sample was heated at 105 °C for 30 min, and then dried at a constant temperature of 80 °C to a constant weight. The dry weights of the rice aboveground parts were recorded as the aboveground biomass (AGB) for each sample, and the total N content of the rice aboveground parts was determined using the Kjeldahl method [29]. Total N concentration in the dried, ground plant material was determined by the micro-Kjeldahl method. Briefly, 0.2 g of sample was digested in 5 mL concentrated H2SO4 with a Kjeltabs™ catalyst (3.5 g K2SO4 + 0.4 g CuSO4·5H2O) at 380 °C until clear. The digest was distilled on a Kjeltec™ 8400 Auto Sampler System (FOSS, Hilleroed, Denmark) with 40% NaOH and the liberated NH3 trapped in 4% boric acid. Titration was performed with 0.01 N HCl, and N content (%) was calculated as follows:
N (%) = [(V_sample − V_blank) × N_HCl × 14.007 × 100]/(sample wt. × 1000)
Table 2.
Date of the UAV flights and sampling in the corresponding rice growth stages.
All analyses were run in duplicate and results were averaged. NNI was the ratio between AGB and critical N concentration of rice, which described the N status of rice, independent of the growth stage and different biomass. An NNI value close to 1 indicated optimal N supply, NNI > 1 indicated excess N nutrient supply and NNI < 1 indicated N deficiency or insufficient supply [30]. Using a single literature-derived critical nitrogen dilution curve assumes constant biomass–N relationships across years and environments; this simplification may not capture genotype- or site-specific variability and could introduce systematic error into NNI estimates. Table 3 presents the descriptive statistics of the rice NNI at different stage of rice growth.
Table 3.
Descriptive statistics of the NNI at different stage of rice growth.
The NNI was defined as the ratio of the critical N content (N_c) and the critical N concentration (N_a), with N_c being calculated following the equation developed according to Wang et al. [31]:
where N_c was the critical N content as a percentage of dry biomass and AGB was the dry weight of aboveground biomass in kg ha−1.
The NNI was calculated using Equation (3):
where N_a was the measured N concentration.
2.3. Meteorology Data Acquisition
Daily meteorological records were not measured in situ; instead, they were obtained from the National Meteorological Information Centre of the China Meteorological Administration (http://data.cma.cn). Accumulated daily precipitation (PRE), accumulated daily average temperature (DAT) and accumulated solar radiation hours (SRHs) were extracted for the Luhe and Pukou stations and then summed from transplanting to each sampling date. Using regional weather station data assumes spatially homogeneous meteorological conditions across plots; unaccounted microclimatic variation (e.g., differences in soil type, slope or wind exposure) could introduce additional uncertainty into the model.
Three important indicators, namely accumulated daily precipitation (PRE), accumulated daily average temperature (DAT) and accumulated solar radiation hours (SRHs), were selected as the variable factors for model input. These three meteorology indicators of daily data are shown as Figure 2, and the input factors for each growth period were obtained by summing the daily data from the transplanting date to the sampling date.
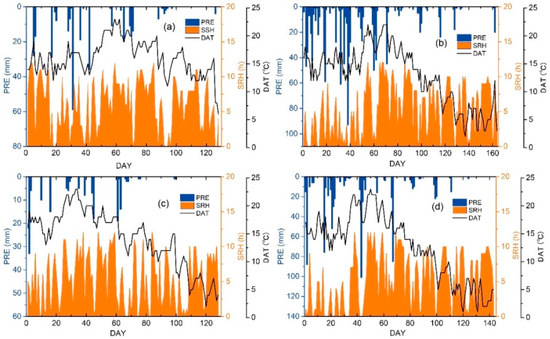
Figure 2.
Daily meteorological data for the rice growing season in 2019 and 2020. (a) Daily meteorological data for the 2019 Pukou rice growing season, (b) daily meteorological data for the 2020 Pukou rice growing season, (c) daily meteorological data for the 2019 Liuhe rice growing season, (d) daily meteorological data for the 2020 Liuhe rice growing season; PRE = daily precipitation (mm); DAT = Cumulative daily average temperature above the benchmark of 10 °C; SRH = daily hours of solar radiation; DAY = d after sowing. The data comes from the National Meteorological Information Center of the China Meteorological Administration.
In this study, accumulated daily average temperature (DAT) was calculated by the following equation:
where T_ave was the daily average temperature and T_base was set as 10 °C.
DAT = T_ave − T_base
2.4. Acquisition of UAV Images
High-spatial-resolution imagery of both experimental fields was acquired at each sampling interval using a DJI Phantom 4 Professional UAV (SZ DJI Technology Co., Shenzhen, China) equipped with a 20-megapixel visible light (RGB) camera (Figure 3). Flights were conducted at 100 m above ground level (AGL) with a speed of 8 m s−1. Image side and forward overlap were set between 60% and 80%. All flights occurred under clear, cloudless and windless conditions between 11:00 and 13:00 (solar noon) to ensure consistent illumination. The camera automatically captured images every 2 s, saving files in both JPEG and DNG (digital negative) formats. For radiometric calibration of the RGB imagery, three diffuse reflective calibration plates (reflectivity: 10%, 50%, 90%; Changhui Electronic Technology Co., Ltd., Guangzhou, China) (Figure 3) were deployed on the ground during UAV operations.
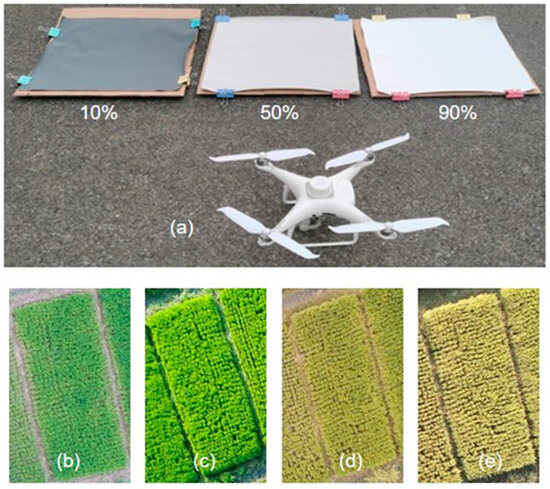
Figure 3.
UAV platform and radiometric calibration setup. (a) Phantom 4 Professional quadcopter and three diffuse-reflectance calibration panels (10%, 50%, 90% reflectance). The numbers on the panels indicate their certified reflectance values used to convert raw digital numbers to surface reflectance. (b–e) Representative RGB photographs of rice at jointing, flowering, filling and maturity stages, respectively.
2.5. UAV Image Processing and Index Extraction
Orthophotos were generated from the acquired imagery using Pix4Dmapper software (https://www.pix4d.com/). The processing workflow comprised the following steps: (1) Initial processing: the software automatically loaded all images captured during a single flight period using their embedded geolocation data. Overlapping images were aligned via feature point matching. (2) Georeferencing: ten evenly distributed ground control points (GCPs) were used to georeference the aligned image set. (3) Camera calibration: internal camera parameters (focal length, principal point, lens distortion) were estimated through bundle adjustment using the aligned photos and GCP positions. (4) Dense point cloud generation: a sharp depth filter was applied during dense point cloud reconstruction to enhance small detail preservation. (5) Orthophoto export: the 3D mesh and textures were built using default parameters, and the final orthophoto mosaic was exported as a GeoTIFF file. Radiometric calibration was performed using the deployed calibration plates. The image digital numbers (DNs) were converted to surface reflectance values based on the known reflectance percentages (10%, 50%, 90%) of these plates. The calibration formulas are given by Equations (5)–(7).
was the reflectance of the i-th band, was the incremental correction coefficient, was the correction deviation, was the grayscale value of the the i-th band, and were the maximum and minimum grayscale values of the UAV image, was the maximum reflectance of the calibration plate and was the minimum reflectance of the calibration plate.
The reflectance values of the red (r), green (g) and blue (b) bands of the UAV images in each field were extracted. Then Python 3.7.8 (https://www.python.org/) was used to calculate the corresponding VIs (Table 4). ArcGIS10.3 (https://www.esri.com) was used to draw the region of interest (ROI) (Figure 1) in the center of each plot, and the average value of various VIs was extracted at different periods in each ROI as the VI of each plot.
Table 4.
List of vegetation indices (VIs) used in this study.
2.6. Rice NNI Estimation Modeling
In the modeling process, AB, PLSR and RF were selected because they represent distinct modeling philosophies relevant to high-dimensional, small-sample remote-sensing data: AB sequentially combines weak learners to reduce bias; PLSR handles multicollinearity among vegetation indices while maximizing covariance with NNI; and RF captures non-linear interactions and variable importance through ensemble decision trees. Their contrasting approaches facilitate a comprehensive evaluation of algorithmic suitability for UAV-based NNI estimation. AB is an iterative algorithm whose main idea is to train different weak classifiers for a training set, and then collect these weak classifiers together to form a strong classifier. AB can perform classification and regression problems. PLSR can combine the basic functions of ML regression, canonical correlation analysis and principal component analysis; this combination can avoid non-normal distribution of data and eliminate multiple linearity among independent variables while maintaining the relationship between independent variable and dependent variable. The RF algorithm combines multiple decision trees to improve the performance of a single-tree regression [42,43].
A three-step ML workflow was implemented. (1) Data pre-processing: UAV-derived VIs were extracted for each ROI and temporally matched with corresponding meteorological (M) and fertilization (F) variables. Missing values (<0.5%) were imputed by k-nearest-neighbors (k = 5). All predictors were centered and scaled to zero mean and unit variance. (2) Model training: 80% of plots were randomly selected for training stratified by growth stage and N treatment; the remaining 20% served as an independent validation set. Hyper-parameters for each algorithm were tuned by 5-fold cross-validation on the training set (RF: ntree = 300, mtry = √p; AB: learning rate = 0.1, n_estimators = 200; PLSR: optimal latent variables determined by leave-one-out cross-validation). (3) Evaluation: Model performance was quantified with R2, RMSE and MAE on the untouched validation set. All analyses were performed in Python 3.8 using scikit-learn 1.2 and stats models 0.14.
2.7. Model Development and Validation
Three different ML algorithms were used to combine the measured rice NNI with UAV-VI, meteorology and fertilization variable factors for modeling, and 80% of the data were used for model training and 20% for validation. While the 80/20 random split reduces overfitting, both training and validation data derive from the same geographic areas and single cultivar; external validity across different regions, seasons or genotypes remains to be tested. Coefficient of determination (R2) and root mean square error (RMSE) were calculated to verify the reliability of the model. R2 represented the fitting effect of the simulated value of the model and measured value. RMSE reflected the degree of dispersion between the simulated and measured values. MAE reflected the actual situation of the predicted value error. These values were calculated as follows:
where and were estimated values and measured values, respectively, and were the average estimated values and measured values, respectively, and was the number of samples.
In order to evaluate the changed degree of the inclusion of various variable factors on the model, the changed rate of model validation accuracy (CRMA) was used comparing the new model with the original VI-based training model. The CRMA was the changed degree of rice NNI estimation model comparing the new model established by incorporating meteorology and fertilization factors with the original model based on the UAV-VIs, which was given by the following equation:
where was the validation accuracy of the model established by incorporating other variable factors, was the validation accuracy of the model established using UAV-VIs and n represented the incorporating variable factor.
3. Results
3.1. Correlation Analysis of Variables for Rice NNI at Different Growth Periods
The relationships between UAV-VIs, meteorology fertilization and rice NNI at different growth periods were analyzed (Table 5). It was found that there were fewer UAV-VIs with good correlation with NNI at the jointing stage; this might result from the relatively low canopy cover, as the UAV images were disturbed by soil, water and other factors. As the rice growing period advanced, more UAV-VIs showed better correlations with rice NNI; among these, VARI, GRVI, MGBVI and RGRI correlation coefficients were greater than 0.5, while those for GLI, GLA and ExG with NNI were less than 0.3 in each different growth period, indicating that these three VIs were not sensitive to the effect of rice NNI. Therefore, these three indices were excluded when establishing a rice NNI estimation model using UAV-VIs. The correlation between fertilization and rice NNI was most significant at the jointing stage, indicating that fertilization was an important factor affecting the N nutrition status at the early growth stage. Importantly, the jointing stage—where low canopy cover introduces substantial background noise—exhibited the greatest accuracy gain when meteorological and fertilization data were integrated, reinforcing the practical value of multi-source data fusion for early-season nitrogen monitoring. From jointing to maturity, the correlation between fertilization and NNI became weaker as the growth period progressed, indicating that the effect of fertilization on rice N nutrition gradually decreased. Since the meteorological data used in this study were from regional meteorological stations, the meteorological values were the same for all fields in the same experimental area at the same time. Thus, the low correlation between meteorological indicators and NNI was normal at each growth period. However, when the four growth periods in the two study areas were combined, the correlations of PRE, DAT and SRHs with rice NNI were 0.62, 0.56 and 0.53, respectively. It indicated that meteorology indicated an important influence on the uptake and transformation of N in rice.
Table 5.
Correlation analysis between each input factor and rice nitrogen nutrient index at different growth periods and across-stage.
3.2. Rice NNI Estimation Based on UAV-VIs Using ML Algorithms
AB, PLSR and RF were used to establish NNI estimation models for different growth periods based on UAV-VIs and measured rice NNI. The validation results of the models are shown in Figure 4. The accuracy of the ABVI and PLSRVI models was relatively low in jointing, flowering and filling stages, with an R2 of less than 0.5, while the validation accuracy of the RFVI model was good in all four growth stages, with an R2 of around 0.85. For different growth stages, the three models performed better in the rice maturity stage, with the validation accuracy of the AB model being 0.59 and that of the PLSR model being 0.67, which was significantly better than the first three growth stages. The performance of the RFVI model was also stable with an R2 of 0.88. Overall, the RFVI model was the most accurate and best-performing model among the rice NNI estimation models established using UAV-Vis. Furthermore, among all growth periods, the model established at maturity demonstrated the highest estimation accuracy.
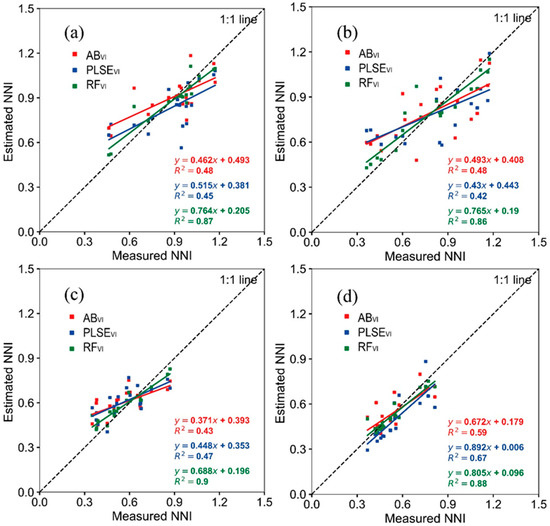
Figure 4.
Validation scatterplots of NNI models built with UAV-derived vegetation indices only (VIs). Black dashed line = 1:1 relationship; R2 = coefficient of determination; RMSE = root-mean-square error. (a) Jointing, (b) flowering, (c) filling, (d) maturity. All R2 values are significant at p < 0.01.
3.3. Estimating Rice NNI at Different Growth Periods in Combination with UAV-VI, Meteorology and Fertilization Factors
UAV-VI, meteorology and fertilizer application data were used as input factors, and AB, PLSR and RF were used to establish the rice NNI estimation models at different growth periods. The validation results of each model using different input variables at different growth periods are shown in Table 6, and it was found that the estimation accuracy of rice NNI was improved by using ML algorithms combined with multivariate factors. Estimation results using UAV-VIs alone as input factors showed the lowest accuracy, and the estimation accuracy of the model indicated a significant improvement with the addition of meteorological and fertilization factors. The model validation performance was expressed in the order as VI + M + F > VI + F > VI + M > VI.
Table 6.
Validation results of the rice NNI estimation model using different variables for different growth periods.
The validation accuracy of the RF model was the highest among different ML estimation models, and the model validation R2 results were all greater than 0.85. Although the validation accuracy of the established RFVI model was relatively high, there was a significant improvement compared with the VI + M + F model established by combining VI, meteorological and fertilizer application factors, which indicated that the model established by combining multivariate factors was more stable and reliable. The marginal improvement observed for the RF model when adding meteorological and fertilization variables is attributable to its already high baseline accuracy (R2 > 0.85), which left limited scope for further gains. Nevertheless, the jointing stage RFVI+M+F model—achieving R2 = 0.95 and RMSE = 0.05—delivers the earliest reliable NNI estimate and should therefore be regarded as a valuable decision-support tool for real-time, field-level nitrogen management within precision agriculture frameworks. Compared with different growth periods, the model performed best at the maturity stage, followed by the jointing stage. Since the purpose of monitoring rice NNI in this study was to carry out better N fertilizer management, it was believed that the NNI estimation model established at the jointing stage was more valuable in practical applications.
3.4. Estimating Rice NNI at Across-Stage in Combination with UAV-VI, Meteorology and Fertilization Factors
VI, VI + M, VI + F and VI + M + F at the across-stage were used as input factors, and the rice NNI estimation models were established using AB, PLSR and RF algorithms. Figure 5 shows the validation results of the models established using different input factors, and it was found that the NNI estimation model established using VI factors showed the lowest model accuracy compared with the model established by combining meteorological and fertilization factors. When meteorological data were added for modeling, the accuracy of the AB and PLSR models were improved, with an R2 of 0.59 and 0.53, and there was no change in the RF model. Compared with the model established by combining VI and meteorological factors, the AB model incorporating fertilization factors was slightly improved, with an R2 of 0.61, and the accuracy of the PLSR and RF models did not change. Then meteorological data and fertilizer factor were added for modeling, and it was found that the accuracy of the AB model and PLSR model showed a significant improvement, with the an R2 of greater than 0.6, which indicated that the amount of fertilizer application had a significant effect on rice NNI, and this variable factor played an important role in improving the accuracy of the rice NNI estimation model. Compared with both AB and PLSR models, the improvement of RF model accuracy was small or almost no change when incorporating meteorology and fertilization factors; this might be because the validation accuracy of the RF estimation model established by using VIs was already as high as 0.95, and the addition of other variable factors had a limited effect on the improvement of model accuracy. Figure 5 shows the model established by combining VI, meteorological and fertilizer application factors. R2 was 0.96, indicating that the RF model built by combining multivariate factors could still improve the modeling accuracy. Therefore, it was concluded that the RF model (RFVI + M + F) established by combining VI, meteorological and fertilizer application factors was the optimal model for rice NNI estimation. Notably, the integration of meteorological and fertilization variables significantly improved NNI estimation accuracy—particularly at the jointing stage, where UAV-derived VIs alone exhibited limited predictive capacity—providing critical support for timely nitrogen management interventions.
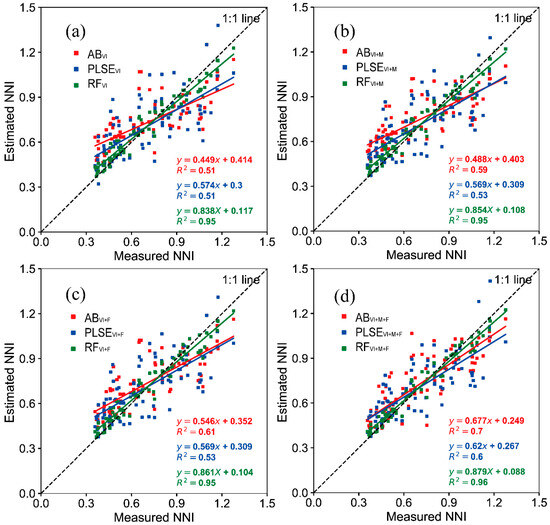
Figure 5.
Validation scatterplots of across-stage NNI models built with different input combinations: (a) VIs only, (b) VI + meteorological variables (M), (c) VI + fertilization variables (F), (d) VI + M + F. Black dashed line = 1:1 relationship. AB = adaptive boosting; PLSR = partial least squares regression; RF = random forest. All R2 values are significant at p < 0.01.
3.5. Effect of Different Input Factors on the Model
For comparing the changed degree of different rice NNI estimation models with the addition of variable factors (meteorology and fertilizer application), we calculated the change rate of validation accuracy (CRMA) of MLVI + M + F, MLVI + F and MLVI + M models compared with the MLVI model for different growth periods and the whole growth period. The results of the CRMA are shown in Figure 6. From the figure, it was found that the model validation accuracy of the NNI estimation model established with VI and meteorological data had different degrees of improvement compared with the model established using only VIs. The CRMA of the model built with VI and meteorological data as input variables was slightly improved. Then, fertilizer application was incorporated as an input variable for modeling based on the model of VI and meteorological data, and the results showed that the validation accuracy of the model was significantly increased, indicating that the fertilization factor has an important influence on the accumulation of N in rice. Among the three ML models, with the addition of meteorological and fertilization factors, the CRMA of the RF model was smaller, which was because the RF models established using VIs had already reached a relatively high accuracy with an R2 of more than 0.85. The RFVI + M + F models established at each growth period had different improvements of accuracy compared with the MLVI model, which further illustrated that combining VI, meteorological and fertilizer application data as modeling input factors could improve the accuracy of rice NNI estimation.
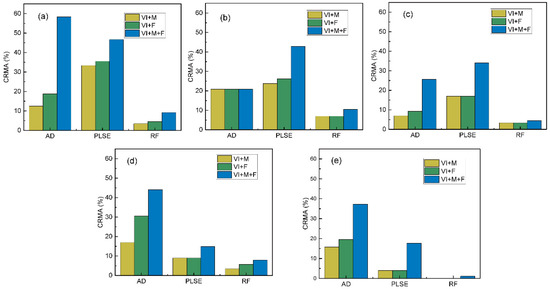
Figure 6.
Change rate of model accuracy (CRMA) achieved by adding meteorological (M) and/or fertilization (F) variables relative to the VI-only baseline for (a) jointing, (b) flowering, (c) filling, (d) maturity and (e) across-stage.
4. Discussions
4.1. Potential of Rice NNI Estimation Using ML Algorithms Based on UAV-VIs
Many VIs could be extracted from the combination of wavebands from UAV images and NNI prediction could be achieved by building a unitary linear model using UAV-VIs. However, this method requires selecting the optimal VI with the best correlation with rice NNI, which is a time-consuming process [13]; moreover, a single VI (e.g., normalized vegetation index NDVI) contains limited information. Therefore, a non-linear model was needed to predict rice NNI using ML algorithms that integrated information from each VI [16]. In recent years, many studies have used ML algorithms for prediction of crop growth indices [44,45], demonstrating the feasibility and unique advantages of using machine learning algorithms for these applications. In this study, three different ML algorithms were used to build an estimation model by combining UAV-VIs extracted from UAV images. The validation accuracy of the models showed that the RF model resulted in a relatively high accuracy, with an R2 of between 0.85 and 0.9 at each growth period. However, for AB and PLSR models, the R2 was less than 0.5 in all growth periods except at maturity, indicating that the RF model could achieve estimating rice NNI using UAV-VIs. The 2.7 cm pixel−1 resolution captured individual leaves and tillers, reducing spectral mixing with soil or shadow and thereby improving the correlation between UAV-derived vegetation indices and plot-level NNI; coarser resolutions (e.g., ≥10 cm) would likely dilute these relationships and lower model precision.
4.2. Effect of Meteorological and Fertilization Inputs on the Performance of Rice Estimation Models
To monitor crop growth parameters, UAVs need to take aerial photographs of crops through optical sensors and obtain crop phenotype information, which can reflect the differences in crop growth parameters through the wavebands. Although the waveband, texture and spectral information of the images were used to build models related to crop growth parameters, this was limited within crop phenotype. Moreover, model fine-tuning should account for the fact that different rice genotypes exhibit distinct growth habits and phenotypic characteristics [46], which may further influence the spectra–N relationships derived from UAV imagery. Since the formation of rice NNI was more complex, more factors should be considered when building the optimal model. It was found that appropriate high temperature significantly increased N concentration and leaf area of living leaves and improved photosynthetic capacity of rice at the growth stage [47]. Precipitation was an important factor affecting soil moisture, which could influence processes such as nutrient transport, crop development and root respiration during rice growth [26,27], thus having an impact on N uptake and transformation in rice. Different fertilizer application levels affect nutrient availability and crop nutrient uptake, with corresponding variability in transformation in the crop; this, in turn, is reflected in the N nutrient status and yield level of the crop [6,48]. Therefore, it was believed that meteorology and fertilizer application, as important factors affecting rice growth, might improve the accuracy of the model by using them as input variables for modeling. In this study, meteorology and fertilizer application factors were incorporated, which demonstrated important effects on rice growth, as variable factors in the process of establishing the rice NNI estimation model. By comparing the accuracy of the three models after incorporating different factors, it was found that both the single-stage model and the across-stage model were more significantly optimized than using VIs alone as an input variable. The rice NNI estimation method proposed in this study not only considered model construction from the perspective of crop phenotypes, but also added factors affecting crop growth mechanism aspects, which greatly improved the estimation accuracy of rice NNI.
4.3. Applications and Challenges in Fertilization
Timely and accurate acquisition of crop N nutrient status is beneficial for precision N management on farmland. However, the traditional experimental analysis showed obvious disadvantages of high cost and low timeliness. With the advancement of technology, non-contact sensors based on crop spectra appeared. Although handheld sensors reduced the cost and improved the timeliness, they were limited to single-point aspect monitoring, which made them unable to be popularized and applied in the accurate management of larger fields. UAV remote sensing technology, as an emerging means of monitoring features, has been widely used in agricultural production in recent years; its application has not only avoided the disadvantages of low resolution of satellite remote sensing and meteorology restrictions, but also solved the problem of traditional single-point monitoring.
The rice NNI estimation model established by using the ML algorithm to integrate the UAV-VI, meteorological and fertilizer application variable factors showed a high accuracy. The validation accuracy R2 of the RFVI + M + F model was greater than 0.9, indicating that the model established in this study could make a good N diagnosis. Meanwhile, the modeling dataset came from two experimental fields during 2019–2020, involving different locations and N application levels in this study; this further improved the generalizability of the model. With the rice NNI estimation model established in this study, the NNI status mapping (Figure 7) of rice fields using UAVs could reflect the overall rice N status of the whole field. However, the influence of rice varieties was not considered in this study; therefore, studies in future need to increase the rice species and incorporate the variety type as an influencing factor for modeling.
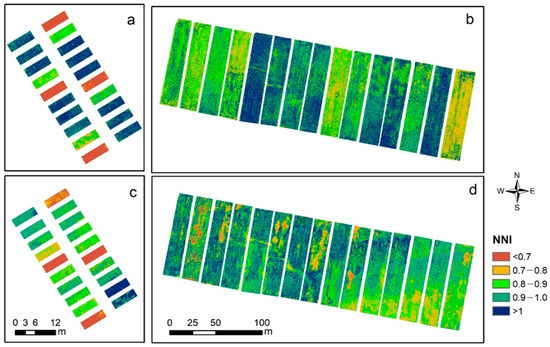
Figure 7.
Spatially explicit NNI maps generated by the RFVI+M+F model at the jointing stage for (a) Pukou 2019, (b) Luhe 2019, (c) Pukou 2020, (d) Luhe 2020. Warmer colors indicate higher NNI (N sufficiency); cooler colors indicate lower NNI (N deficiency).
4.4. Limitations and Future Directions
Although the RFVI+M+F model achieved high accuracy (R2 ≥ 0.94), several limitations should be acknowledged. First, this study was conducted with a single japonica cultivar (‘Nanjing 5055’) across two sites in Jiangsu Province; model transferability to other cultivars, ecotypes or climatic zones remains untested. Second, the meteorological data were obtained from regional weather stations rather than in-field micro-meteorological sensors, potentially masking local variation in temperature, humidity and radiation within plots. Third, RGB imagery alone was used; inclusion of multispectral or hyperspectral bands might further improve sensitivity to early-season N stress. Finally, destructive sampling for NNI reference data limits the method’s scalability.
Future work should (i) expand the cultivar and environmental matrix to quantify genotype × environment interactions, (ii) deploy in-field IoT weather stations for high-resolution micro-climate data, (iii) evaluate multispectral or hyperspectral UAV sensors and (iv) explore non-destructive reference measurements (e.g., leaf-clip N meters or proximal hyperspectral devices) to enable high-throughput model calibration. Integrating these improvements will enhance model robustness and facilitate operational deployment across diverse rice production systems.
4.5. Key Methodological Limitations
First, the use of consumer-grade RGB cameras excludes red-edge and near-infrared bands that are more sensitive to chlorophyll and nitrogen dynamics, potentially limiting model sensitivity compared with multispectral or hyperspectral systems. Second, the adoption of a single literature-derived critical nitrogen dilution curve assumes universal biomass–N relationships, yet these curves are known to vary among cultivars and environments. Third, this study was conducted with only one japonica cultivar, which precludes generalization to indica or hybrid varieties with differing nitrogen-use efficiencies. These constraints underscore the need for broader cultivar, sensor and environmental validation before large-scale deployment.
5. Conclusions
Across the jointing, flowering, filling and maturity stages, the random forest (RF) model consistently outperformed adaptive boosting (AB) and partial least squares regression (PLSR), delivering validation R2 values ≥ 0.86. Incorporating meteorological and fertilization variables improved model accuracy in the order VI + M + F > VI + F > VI + M > VI, with the largest gains observed at the jointing stage where canopy cover is low and background noise is high.
The jointing stage RFVI+M+F model (R2 = 0.95, RMSE = 0.05) enables the earliest reliable NNI estimate, offering growers a timely decision support tool for variable-rate N applications. These results demonstrate that integrating UAV imagery with agro-environmental data enhances model robustness and accuracy. Therefore, the RF model with combined input variables is recommended for practical nitrogen diagnosis and site-specific nitrogen management within precision agriculture frameworks. Consequently, the RF model integrating UAV-RGB imagery with meteorological and fertilization variables offers improved within-site accuracy for rice nitrogen diagnosis under the studied conditions. Broader validation across multiple cultivars, environments and sensor configurations is required before recommending routine adoption in precision nitrogen management systems.
Author Contributions
Conceptualization, Z.Q. and C.D.; methodology, Z.Q.; software, Z.Q.; validation, F.M. and J.Z.; formal analysis, Z.Q.; investigation, F.M.; resources, C.D.; data curation, Z.Q.; writing—original draft preparation, Z.Q.; writing—review and editing, Z.Q., J.Z. and C.D.; visualization, Z.Q. and C.D.; supervision, C.D.; project administration, C.D.; funding acquisition, C.D. All authors have read and agreed to the published version of the manuscript.
Funding
This work was supported by the National Key Research and Development Program of China (2022YFD170060104) and the National Agricultural Science and Technology Project (NK2022180503).
Institutional Review Board Statement
Not applicable.
Informed Consent Statement
Not applicable.
Data Availability Statement
The original contributions presented in this study are included in the article; further inquiries can be directed to the corresponding author.
Conflicts of Interest
The authors declare no conflicts of interest.
References
- Zhou, Y.; Ji, Y.; Li, Z.; Tu, D.; Xi, M.; Xu, Y. Yield loss of a rice ratoon crop is affected by nitrogen supply in a mechanized ratooning system. Food Energy Secur. 2025, 14, e70041. [Google Scholar] [CrossRef]
- Gao, S.; Qian, H.; Li, W.; Wang, Y.; Zhang, J.; Tao, W. Efficient fertilization pattern for rice production within the rice-wheat systems. Field Crops Res. 2025, 328, 109925. [Google Scholar] [CrossRef]
- Mueller, N.D.; Gerber, J.S.; Johnston, M.; Ray, D.K.; Ramankutty, N.; Foley, J.A. Closing yield gaps through nutrient and water management. Nature 2012, 490, 254–257. [Google Scholar] [CrossRef] [PubMed]
- Zhang, X.; Davidson, E.A.; Mauzerall, D.L.; Searchinger, T.D.; Dumas, P.; Shen, Y. Managing nitrogen for sustainable development. Nature 2015, 528, 51–59. [Google Scholar] [CrossRef] [PubMed]
- Rodriguez, I.M.; Lacasa, J.; van Versendaal, E.; Lemaire, G.; Belanger, G.; Jégo, G.; Ciampitti, I.A. Revisiting the relationship between nitrogen nutrition index and yield across major species. Eur. J. Agron. 2024, 154, 127079. [Google Scholar] [CrossRef]
- Wu, Y.; Lu, J.; Liu, H.; Gou, T.; Chen, F.; Fang, W.; Guan, Z. Monitoring the nitrogen nutrition index using leaf-based hyperspectral reflectance in cut chrysanthemums. Remote Sens. 2024, 16, 3062. [Google Scholar] [CrossRef]
- Islam, M.; Bijjahalli, S.; Fahey, T.; Gardi, A.; Sabatini, R.; Lamb, D.W. Destructive and non-destructive measurement approaches and the application of AI models in precision agriculture: A review. Precis. Agric. 2024, 25, 1127–1180. [Google Scholar] [CrossRef]
- Laveglia, S.; Altieri, G.; Genovese, F.; Matera, A.; Di Renzo, G.C. Advances in sustainable crop management: Integrating precision agriculture and proximal sensing. AgriEngineering 2025, 6, 3084–3120. [Google Scholar] [CrossRef]
- Zhang, K.; Liu, X.; Ma, Y.; Zhang, R.; Cao, Q.; Zhu, Y.; Tian, Y. A comparative assessment of measures of leaf nitrogen in rice using two leaf-clip meters. Sensors 2019, 20, 175. [Google Scholar] [CrossRef]
- Apolo-Apolo, O.; Martínez-Guanter, J.; Egea, G.; Raj, P.; Pérez-Ruiz, M. Deep learning techniques for estimation of the yield and size of citrus fruits using a UAV. Eur. J. Agron. 2020, 115, 126030. [Google Scholar] [CrossRef]
- Li, P.; Zhang, X.; Wang, W.; Zheng, H.; Yao, X.; Tian, Y.; Zhu, Y.; Cao, W.; Chen, Q.; Cheng, T. Estimating aboveground and organ biomass of plant canopies across the entire season of rice growth with terrestrial laser scanning. Int. J. Appl. Earth Obs. Geoinf. 2020, 91, 102132. [Google Scholar] [CrossRef]
- Wu, B.; Zhang, M.; Zeng, H.; Tian, F.; Potgieter, A.B.; Qin, X.; Loupian, E. Challenges and opportunities in remote sensing-based crop monitoring: A review. Natl. Sci. Rev. 2023, 10, nwac290. [Google Scholar] [CrossRef]
- Qiu, Z.; Ma, F.; Li, Z.; Xu, X.; Ge, H.; Du, C. Estimation of nitrogen nutrition index in rice from UAV RGB images coupled with machine learning algorithms. Comput. Electron. Agric. 2021, 189, 106421. [Google Scholar] [CrossRef]
- Sun, Y.; Qin, Q.; Ren, H.; Zhang, T.; Chen, S. Red-edge band vegetation indices for leaf area index estimation from Sentinel-2/MSI Imagery. IEEE Trans. Geosci. Remote Sens. 2020, 58, 826–840. [Google Scholar] [CrossRef]
- Wu, S.; Yang, P.; Ren, J.; Chen, Z.; Liu, C.; Li, H. Winter wheat LAI inversion considering morphological characteristics at different growth stages coupled with microwave scattering model and canopy simulation model. Remote Sens. Environ. 2020, 240, 111681. [Google Scholar] [CrossRef]
- Maimaitijiang, M.; Sagan, V.; Sidike, P.; Hartling, S.; Esposito, F.; Fritschi, F.B. Soybean yield prediction from UAV using multimodal data fusion and deep learning. Remote Sens. Environ. 2020, 237, 111599. [Google Scholar] [CrossRef]
- Zheng, H.; Cheng, T.; Zhou, M.; Li, D.; Yao, X.; Tian, Y.; Cao, W.; Zhu, Y. Improved estimation of rice aboveground biomass combining textural and spectral analysis of UAV imagery. Precis. Agric. 2018, 20, 611–629. [Google Scholar] [CrossRef]
- Lu, N.; Wang, W.; Zhang, Q.; Li, D.; Yao, X.; Tian, Y.; Zhu, Y.; Cao, W.; Baret, F.; Liu, S.; et al. Estimation of nitrogen nutrition status in winter wheat from unmanned aerial vehicle based multi-angular multispectral imagery. Front. Plant Sci. 2019, 10, 1601. [Google Scholar] [CrossRef]
- Fei, S.; Hassan, M.A.; Xiao, Y.; Su, X.; Chen, Z.; Cheng, Q.; Ma, Y. UAV-based multi-sensor data fusion and machine learning algorithm for yield prediction in wheat. Precis. Agric. 2023, 24, 187–212. [Google Scholar] [CrossRef]
- Zheng, Y.; Shcherbakova, G.; Rusyn, B.; Sachenko, A.; Volkova, N.; Kliushnikov, I.; Antoshchuk, S. Wavelet Transform Cluster Analysis of UAV Images for Sustainable Development of Smart Regions Due to Inspecting Transport Infrastructure. Sustainability 2025, 17, 927. [Google Scholar] [CrossRef]
- Wang, L.; Ling, Q.; Liu, Z.; Dai, M.; Zhou, Y.; Shi, X.; Wang, J. Precision estimation of rice nitrogen fertilizer topdressing according to the nitrogen nutrition index using UAV multi-spectral remote sensing: A case study in southwest China. Plants 2025, 14, 1195. [Google Scholar] [CrossRef]
- Han, L.; Yang, G.; Dai, H.; Xu, B.; Yang, H.; Feng, H.; Li, Z.; Yang, X. Modeling maize above-ground biomass based on machine learning approaches using UAV remote-sensing data. Plant Methods 2019, 15, 10. [Google Scholar] [CrossRef] [PubMed]
- Yu, X.; Keitel, C.; Zhang, Y.; Wangeci, A.N.; Dijkstra, F.A. Global meta-analysis of nitrogen fertilizer use efficiency in rice, wheat and maize. Agric. Ecosyst. Environ. 2022, 338, 108089. [Google Scholar] [CrossRef]
- Jiang, M.; Dong, C.; Bian, W.; Zhang, W.; Wang, Y. Effects of different fertilization practices on maize yield, soil nutrients, soil moisture, and water use efficiency in northern China based on a meta-analysis. Sci. Rep. 2024, 14, 6480. [Google Scholar] [CrossRef]
- Wang, J.; Li, L.; Lam, S.K.; Shi, X.; Pan, G. Changes in plant nutrient status following combined elevated [CO2] and canopy warming in winter wheat. Front. Plant Sci. 2023, 14, 1132414. [Google Scholar] [CrossRef]
- Zhang, J.; Guan, K.; Peng, B.; Pan, M.; Zhou, W.; Jiang, C.; Kimm, H.; Franz, T.E.; Grant, R.F.; Yang, Y.; et al. Sustainable irrigation based on co-regulation of soil water supply and atmospheric evaporative demand. Nat. Commun. 2021, 12, 5549. [Google Scholar] [CrossRef]
- Lv, P.; Sun, S.; Zhao, X.; Li, Y.; Zhao, S.; Zhang, J.; Zuo, X. Effects of altered precipitation patterns on soil nitrogen transformation in different landscape types during the growing season in northern China. Catena 2023, 222, 106813. [Google Scholar] [CrossRef]
- Du, X.; Wang, Z.; Xi, M.; Wu, W.; Wei, Z.; Xu, Y.; Zhou, Y.; Lei, W.; Kong, L. A novel planting pattern increases the grain yield of wheat after rice cultivation by improving radiation resource utilization. Agric. For. Meteorol. 2021, 310, 108625. [Google Scholar] [CrossRef]
- Nelson, D.W.; Sommers, L. Determination of total nitrogen in plant material. Agron. J. 1973, 65, 109–112. [Google Scholar] [CrossRef]
- Fabbri, C.; Mancini, M.; dalla Marta, A.; Orlandini, S.; Napoli, M. Integrating satellite data with a Nitrogen Nutrition Curve for precision top-dress fertilization of durum wheat. Eur. J. Agron. 2020, 120, 126148. [Google Scholar] [CrossRef]
- Wang, Y.; Shi, P.; Zhang, G.; Ran, J.; Shi, W.; Wang, D. A critical nitrogen dilution curve for japonica rice based on canopy images. Field Crop. Res. 2016, 198, 93–100. [Google Scholar] [CrossRef]
- Louhaichi, M.; Borman, M.M.; Johnson, D.E. Spatially located platform and aerial photography for documentation of grazing impacts on wheat. Geocarto Int. 2008, 16, 65–70. [Google Scholar] [CrossRef]
- Sun, Y.; Wang, B.; Zhang, Z. Improving leaf area index estimation with chlorophyll insensitive multispectral red-edge vegetation indices. IEEE J. Sel. Top. Appl. Earth Obs. Remote Sens. 2023, 16, 3568–3582. [Google Scholar] [CrossRef]
- Evstatiev, B.; Mladenova, T.; Valov, N.; Zhelyazkova, T.; Gerdzhikova, M.; Todorova, M.; Stanchev, G. Fast pasture classification method using ground-based camera and the modified green red vegetation index (mgrvi). Int. J. Adv. Comput. Sci. Appl. 2023, 14, 45–51. [Google Scholar] [CrossRef]
- Yang, B.; Wang, M.; Sha, Z.; Wang, B.; Chen, J.; Yao, X.; Cheng, T.; Cao, W.; Zhu, Y. Evaluation of aboveground nitrogen content of winter wheat using digital imagery of unmanned aerial vehicles. Sensors 2019, 19, 4416. [Google Scholar] [CrossRef]
- Xu, X.; Liu, L.; Han, P.; Gong, X.; Zhang, Q. Accuracy of vegetation indices in assessing different grades of grassland desertification from UAV. Int. J. Environ. Res. Public Health 2022, 19, 16793. [Google Scholar] [CrossRef]
- Chen, C.; Yuan, X.; Gan, S.; Luo, W.; Bi, R.; Li, R.; Gao, S. A new vegetation index based on UAV for extracting plateau vegetation information. Int. J. Appl. Earth Obs. Geoinf. 2024, 128, 103668. [Google Scholar] [CrossRef]
- Song, Z.; Lu, Y.; Ding, Z.; Sun, D.; Jia, Y.; Sun, W. A new remote sensing desert vegetation detection index. Remote Sens. 2023, 15, 5742. [Google Scholar] [CrossRef]
- Sewiko, R.; Sagala, H.A.M.U. The use of drone and visible atmospherically resistant index (VARI) algorithm implementation in mangrove ecosystem health’s monitoring. Asian J. Aquat. Sci. 2022, 5, 322–329. [Google Scholar]
- Farooque, A.A.; Afzaal, H.; Benlamri, R.; Al-Naemi, S.; MacDonald, E.; Abbas, F.; Ali, H. Red-green-blue to normalized difference vegetation index translation: A robust and inexpensive approach for vegetation monitoring using machine vision and generative adversarial networks. Precis. Agric. 2023, 24, 1097–1115. [Google Scholar] [CrossRef]
- Biró, L.; Kozma-Bognár, V.; Berke, J. Comparison of RGB indices used for vegetation studies based on structured similarity index (SSIM). J. Plant Sci. Phytopathol. 2024, 8, 007–012. [Google Scholar] [CrossRef]
- Salman, H.A.; Kalakech, A.; Steiti, A. Random forest algorithm overview. Babylon. J. Mach. Learn. 2024, 2024, 69–79. [Google Scholar] [CrossRef]
- Ghazwani, M.; Begum, M.Y. Computational intelligence modeling of hyoscine drug solubility and solvent density in supercritical processing: Gradient boosting, extra trees, and random forest models. Sci. Rep. 2023, 13, 10046. [Google Scholar] [CrossRef]
- Reisi Gahrouei, O.; McNairn, H.; Hosseini, M.; Homayouni, S. Estimation of crop biomass and leaf area index from multitemporal and multispectral imagery using machine learning approaches. Can. J. Remote Sens. 2020, 46, 84–99. [Google Scholar] [CrossRef]
- Yang, Q.; Shi, L.; Han, J.; Yu, J.; Huang, K. A near real-time deep learning approach for detecting rice phenology based on UAV images. Agric. For. Meteorol. 2020, 287, 107938. [Google Scholar] [CrossRef]
- Adnan, M.R.; Wilujeng, E.D.; Aisyah, M.D.; Alif, T.; Galushasti, A. Preliminary agronomic characterization of japonica rice carrying a tiller number mutation under greenhouse conditions. DYSONA-Appl. Sci. 2025, 6, 291–299. [Google Scholar]
- Wang, H.; Zhong, L.; Fu, X.; Huang, S.; Zhao, D.; He, H.; Chen, X. Physiological analysis reveals the mechanism of accelerated growth recovery for rice seedlings by nitrogen application after low temperature stress. Front. Plant Sci. 2023, 14, 1133592. [Google Scholar] [CrossRef] [PubMed]
- Liang, H.; Gao, S.; Hu, K. Global sensitivity and uncertainty analysis of the dynamic simulation of crop N uptake by using various N dilution curve approaches. Eur. J. Agron. 2020, 116, 126044. [Google Scholar] [CrossRef]
Disclaimer/Publisher’s Note: The statements, opinions and data contained in all publications are solely those of the individual author(s) and contributor(s) and not of MDPI and/or the editor(s). MDPI and/or the editor(s) disclaim responsibility for any injury to people or property resulting from any ideas, methods, instructions or products referred to in the content. |
© 2025 by the authors. Licensee MDPI, Basel, Switzerland. This article is an open access article distributed under the terms and conditions of the Creative Commons Attribution (CC BY) license (https://creativecommons.org/licenses/by/4.0/).