Abstract
The efficiency of water use in irrigated agriculture is a global priority to address water scarcity. A comprehensive meta-analysis was conducted to evaluate the effects of irrigation practices on potato yield, crop evapotranspiration (ETc), water productivity (WP), and irrigation water productivity (IWP) across diverse growing conditions, including soil texture, fertilizer application rates, annual precipitation, and soil organic carbon (SOC). The results revealed that supplementary irrigation increased potato yield by 55% and ETc by 39% while maintaining WP comparable to non-irrigated conditions. The greatest yield and WP improvements from supplementary irrigation occurred under drip irrigation with moderate N, P, and K application rates (150–250 kg ha−1) and irrigation amounts below 150 mm. This practice was particularly effective in sandy soils with 1.5–2.0% SOC and annual rainfall of 200–400 mm. Conversely, deficit irrigation reduced potato yield and ETc by 25% and 24%, respectively, but significantly enhanced WP and IWP by 9% and 28% compared to full irrigation. When a water-saving ratio of 10–20% was implemented under drip irrigation with optimal fertilizer rates (240–360 kg N ha−1, >104 kg P2O5 ha−1, 150–200 kg K2O ha−1), deficit irrigation improved WP without yield loss in sandy soils with annual rainfall of 600–800 mm when compared to full irrigation. The IWP increased with rising SOC levels, indicating that SOC improvement in low-carbon soils enhances water productivity in irrigated potato systems. These findings demonstrate that tailored irrigation strategies can simultaneously reduce water inputs and achieve higher yield and WP in potato production systems.
1. Introduction
Water scarcity constitutes a pressing global crisis by disrupting agricultural productivity and escalating food insecurity risks [1,2,3]. Concurrently, climate change exacerbates water resource shortages, critically endangering the sustainable development of worldwide agricultural systems [4]. Over the past two decades, excessive water extraction and pollution led to a reduction of over 20% in per capita annual freshwater availability [3]. With the global population projected to grow by 80 million annually, water demand is expected to surge by 6.4 × 10¹⁰ m3. Consequently, sustainable water resource management and food security are of great significance for the stable development of society [1,3].
Agriculture dominates global water consumption, accounting for 70% of total withdrawals [1,2,3]. In arid and semiarid regions, insufficient rainfall fundamentally constrains crop establishment, growth, and yield, while irrigation mitigates water shortages and enhances productivity. Although irrigated lands constitute only 20% of agricultural areas, they support over 40% of global food production [2,5]. This reliance has precipitated groundwater depletion, particularly through inefficient traditional methods like flood irrigation, which exhibit substantial water waste [2,6]. It is estimated that the global agricultural water waste rate reaches 40% [1], while traditional flood irrigation causes an astonishing 15–25% of irrigation water to be lost through leakage, evaporation, and runoff; additionally, sprinkler irrigation had 18% water lost through evaporation [7]. In response, modern strategies such as drip irrigation, deficit irrigation, and partial root-zone drying have been implemented to optimize water use efficiency [2].
Potatoes (Solanum tuberosum L.) originated in the Andean region over 7000 years ago and are the fourth most widely cultivated staple crop in the world, after corn, wheat, and rice [7]. In 2019, the global potato planting area was 17.34 million hectares, with a production of 370.4 million tons [8]. However, potato cultivation predominantly occurs in water-stressed regions with seasonal evapotranspiration demands of 400–800 mm, most of this production is obtained in Europe, Asia, and in the Russian Federation [7,9,10]. Furthermore, potato is a shallow-rooted crop, with approximately 85% of their roots growing between 0–30 cm of surface soil, where even short-term water deficits can cause significant yield reductions [6,11]. Although water stress universally impairs photosynthetic efficiency throughout all growth stages, its most detrimental effects occur during tuberization and bulking phases, leading to disproportionately severe yield losses [12,13]. Previous studies have shown that drought can cause potatoes to mature prematurely, inhibit plant growth, reduce tuber yield, decrease the number of tubers per plant, as well as tuber size and quality [12,14]. Irrigation is the most effective method to increase potato yield [15]. However, unreasonable irrigation in potato production leads to serious water resource waste and threatens the sustainable use of water resources [2,8]. Consequently, this underscores the critical need to enhance water productivity (WP) and reduce water resource consumption.
However, three key knowledge gaps persist: (1) global responses of potato yield and WP to irrigation methods, water volumes, and fertilizer interactions; (2) the feasibility of concurrently improving yield and WP through irrigation optimization; and (3) the comparative efficacy of deficit irrigation versus full irrigation, which hindered the high-yield cultivation of potatoes. A comprehensive synthesis of these aspects remains absent from current literature. To address these gaps, we conducted a meta-analysis of global field studies examining water management impacts on potato production. This statistical approach enables quantitative integration of diverse findings, revealing underlying response patterns across geographical scales. Our analysis specifically investigates: (1) the effects of irrigation practices on potato yield, evapotranspiration (ETc), water productivity (WP), and irrigation water productivity (IWP); (2) interactions between irrigation volume, soil properties (texture and organic carbon), fertilization, and productivity metrics. Our hypotheses are that (1) supplemental irrigation will increase yield but reduce WP compared to rainfed systems; (2) fixed and alternate partial root-zone irrigation methods will demonstrate comparable WP improvements; and (3) IWP will exhibit an inverse correlation with soil organic carbon content.
2. Materials and Methods
2.1. Findings and Collecting Data
Data on how irrigation methods affect potato yield and WP were collected using peer-reviewed publications. English-language sources from Google Scholar, Springer, and ISI-Web of Science, as well as Chinese-language sources from Baidu Scholar and CNKI, were utilized. The search employed keywords like potato, irrigation, yield, and WP, without restricting publication years except for excluding those after July 2024. To avoid biases in publication selection, the data were chosen according to the following criteria: (1) field studies had to include both an irrigation treatment and a non-irrigation control group, or they had to include both a full irrigation treatment and a deficit irrigation control, and (2) the necessary statistical parameters such as means, standard deviations (or standard errors), and sample sizes of the relevant variables had to be either directly provided or computable from the data.
After careful examination, 3740 observations from 132 research papers were selected for inclusion in the study (Figure 1), 860 observations for irrigation/non-irrigation (rainfed production) and 2880 observations for deficit irrigation/full irrigation. Most of the selected studies were carried out in China and the Middle East. Considering the multiplicity within the geography, climatic conditions, and soil textures, the soil textures were categorized into three classes: (1) Sandy soil, (2) Loam soil, and (3) Clay soil. Irrigation methods were divided are divided into flood, sprinkler, and drip irrigation. When analyzing the effect of supplementary irrigation on potato yield, the N fertilizers rate was classified as <150, 150–250, 250–350, and >350 kg N ha−1, the P fertilizers rate was classified as <65, 65–110, 110–155, >155 kg P ha−1, and the K fertilizers rate was classified as <125, 125–205, 205–290, >290 kg K ha−1. When analyzing the effect of deficit irrigation on potato yield, the N fertilizers rate was classified as <60, 60–120, 120–180, 180–240, 240–300, 300–360, 360–420, and >420 kg N ha−1, the P fertilizers rate was classified as <26, 26–52, 52–78, 78–104, 104–130, >130 kg P ha−1, and the K fertilizers rate was classified as <50, 50–100, 100–150, 150–200, 200–250, >250 kg K ha−1. Soil organic carbon concentration (SOC) was categorized as <0.5, 0.5–1.0, 1.0–1.5, 1.5–2.0, 2.0–2.5, and 2.5–3.0 (%). For supplementary irrigation subgroups (supplementary irrigation vs. non-irrigation), the amount of irrigation was classified as 0–30, 30–60, 60–90, 90–120, 120–150, 150–180, 180–250, 250–350, 350–500, and >500 mm. For deficit irrigation subgroups (deficit irrigation vs. full irrigation), the water-saving ratio of deficit irrigation treatment was classified as <0, 0–10, 10–20, 20–30, 30–40, 40–50, 50–60, 60–70, 70–80, 80–90, 90–100%, the control treatment was the full irrigation. Annual rainfall was classified as <200, 200–400, 400–600, 600–800, and >800 mm.
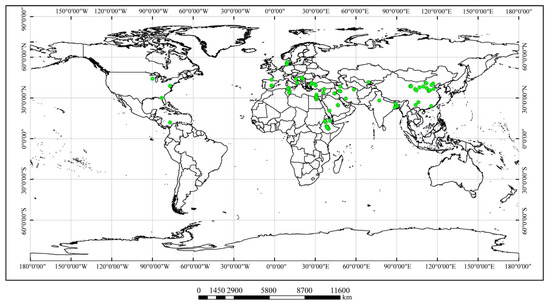
Figure 1.
Location of field experiments included in this meta-analysis.
2.2. Data Analysis Methods
Irrigation water productivity (IWP) was calculated using the following equation [16]:
where Yt denotes the potato yield under irrigation treatment, and I characterize the irrigation amount under irrigation treatment (m3).
IWP = Yt/I
Relative yield increase (RYi) was defined as the difference in yield between the treatment (Yt) and the control treatment (Yck), which could be computed using the collected data. The RYi and relative yield increase per unit of irrigation were determined using the following equation [17]:
where RYe indicates the relative yield increase per unit of irrigation amount (kg m–3). Yt is the potato yield for supplementary irrigation treatment, and Yck refers to the yield of potato under non-irrigation treatment (rainfed production).
RYi = (Yt − Yck)
The weight of individual observations was calculated by replications, with weights = (Ntreatment × Ncontrol)/(Ntreatment + Ncontrol), where Ntreatment and Ncontrol are the number of replicates for treatment and control, respectively [18]. The natural logarithm of the response ratio (lnR) was used to analysis the effect size [3].
Here, XT denotes the potato yield, ETc, or WP in the treatment, while XC represents the yield, WP, or ETc in the control. For the convenience of explaining the effects of irrigation methods, the percentage of change in yield, ETc, and WP was calculated as (ln R − 1) × 100. If the 95% confidence intervals (CI) for a dependent variable did not overlap zero, the effect of irrigation practice was considered significant.
A random model, involving 9999 iterations of sampling, was used to evaluate the influence of irrigation methods on each dependent component. Mean values and bias-corrected 95% CIs were computed using bootstrapping. MetaWin 2.1 (Systat Software, Inc., San Jose, CA, USA) was utilized for these analyses. In cases where the 95% confidence interval (CI) did not intersect with zero, treatments were deemed to have a noteworthy increase effect (>0) or decrease effect (<0) relative to the controls (p < 0.05). Statistical significance in variation among means for different categorical elements was identified when their bootstrapping 95% CIs did not intersect. In this study, we used random forest models by the “rfPermute” package in R to determine the importance of each variable parameter to yield [19].
3. Results
3.1. Comprehensive Impact of Irrigation Practices on Potato Yield, ETc, and WP
Irrigation practices significantly affected potato yield, ETc, and WP (Figure 2). Additional irrigation led to an increase in potato yield by 55% and ETc by 39%, respectively, without compromising WP compared to the non-irrigation control (Figure 2A). Conversely, deficit irrigation on average resulted in a significant decrease in potato yield and ETc by 25% and 24%, respectively, while significantly enhancing WP and IWP by 9% and 28%, respectively, compared to full irrigation control (Figure 2B).
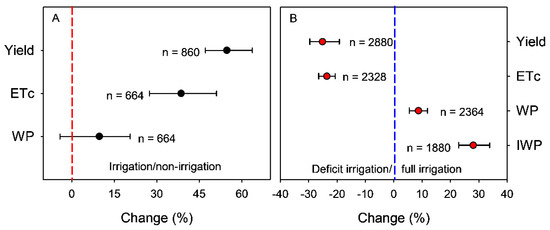
Figure 2.
Overall response of change in yield, evapotranspiration (ETc), water productivity (WP), and irrigation water productivity (IWP) to supplementary irrigation (A) and deficit irrigation (B). Error bars represent 95% confidence intervals. The “n” indicates number of total observations.
3.2. The Impact of Irrigation Practices on Potato Yield Formation and Quality
Supplementary irrigation significantly increased aboveground biomass at maturity and leaf area index during the swelling period by 40.0 and 15.6%, respectively, when compared to non-irrigation (Figure 3A). Compared to non-irrigation, supplementary irrigation significantly increased dry matter accumulation from tuber formation to maturity, N uptake, tuber number per plant, average tuber weight, and commodity rate by 71.7, 36.6, 20.9, 22.6, and 22.7%, respectively, but reduced proportion of tubers dry weight to total biomass by 3.8%. The root/shoot ratio and contribution of dry matter accumulation from tuber formation to maturity to tuber yield were not affected by supplementary irrigation (Figure 3A). Deficit irrigation significantly reduced aboveground biomass at maturity, leaf area index during the swelling period, and dry matter accumulation from tuber formation to maturity by 13.1, 10.5, and 27.9% compared to full irrigation, respectively (Figure 3B). N uptake at maturity, tuber number per plant, average tuber weight, and commodity rate under deficit irrigation were significantly decreased by 10.5, 13.6, 17.4, and 9.1%, respectively. Compared to full irrigation, deficit irrigation significantly improved the contribution of dry matter accumulation from tuber formation to maturity to tuber yield by 23.2%, while root/shoot ratio and proportion of tubers dry weight to total biomass were not significant different between deficit irrigation and full irrigation (Figure 3B). Random forest analysis shows that for supplementary irrigation subgroup, the indicators that contribute the most to yield are aboveground biomass at harvest, DMA, N uptake at harvest, PTB, and ATW (Figure 4A) (p < 0.05), while for deficit irrigation subgroup, the indicators that contribute the most to yield is ATW, aboveground biomass at harvest, TNP, N uptake, root/shoot ratio, PTB, DMA, and leaf area index at the swelling period (p < 0.05). Irrigation practices did not significantly affect potato quality traits such as starch, protein, reducing sugar, cellulose, vitamin C, calcium, iron, potassium, magnesium content, except for zinc under deficit irrigation (Figure S1).
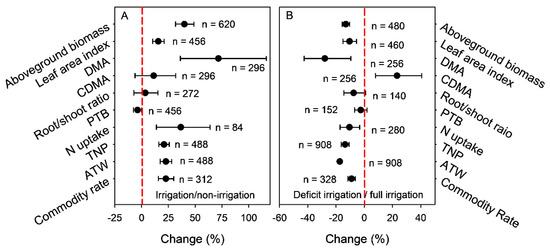
Figure 3.
Response of change in accumulation of aboveground biomass at maturity, leaf area index at the swelling period, dry matter accumulation from tuber formation to maturity (DMA), the contribution of post-anthesis dry matter accumulation to tuber yield (CDMA), root/shoot ratio, proportion of tubers dry weight to total biomass (PTB), nitrogen uptake at maturity, tuber number per plant (TNP), average tuber weight (ATW), and commodity rate (CR) to supplementary irrigation (A) and deficit irrigation (B). Error bars represent 95% confidence intervals. The “n” indicates number of total observations.
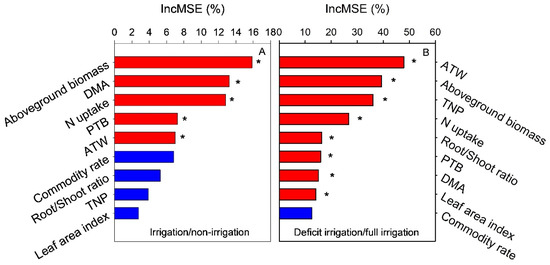
Figure 4.
Random forest analysis showed the associations between tuber yield and yield formation parameters including aboveground biomass at maturity, leaf area index at the swelling period, dry matter accumulation from tuberization to maturity (DMA), root/shoot ratio, proportion of tubers dry weight to total biomass (PTB), nitrogen uptake at maturity, tuber number per plant (TNP), average tuber weight (ATW), and commodity rate under irrigation/ non-irrigation (A) and deficit irrigation/full irrigation (B). *, significant at p ≤ 0.05%IncMSE is the percentage increase in mean square error. A higher %IncMSE represents higher variable importance.
3.3. The Impact of Irrigation Practices on Potato Yield, ETc, and WP Varied with Irrigation Methods
The impact of irrigation practices on potato yield, ETc, and WP varied with the irrigation methods, such as flood (including furrow irrigation), sprinkling, and drip irrigation (Figure 5 and Figure 6). In comparison to non-irrigation, flood irrigation significantly increased potato yield but slightly reduced WP. Sprinkler irrigation has a better effect on yield than flood irrigation. Drip irrigation significantly improved yield and WP without increasing ETc (Figure 5).

Figure 5.
The change in potato yield (A), crop evapotranspiration (ETc) (B), and water productivity (WP) (C) under supplementary irrigation compared to non-irrigation (rainfed production) under flood (including furrow irrigation), sprinkling, and drip irrigation. Error bars represent 95% confidence intervals. The “n” indicates number of total observations.
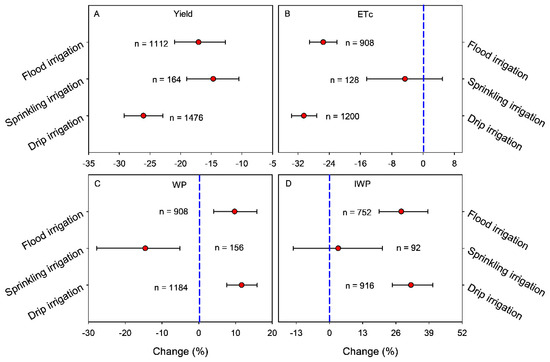
Figure 6.
The change in potato yield (A), evapotranspiration (ETc) (B), water productivity (WP) (C), and irrigation water productivity (IWP) (D) under deficit irrigation when compared to full irrigation under flood irrigation (including furrow irrigation), sprinkling irrigation, and drip irrigation. Error bars represent 95% confidence intervals. The “n” indicates number of total observations.
Under deficit irrigation, potato yield decreased by 17, 26 and 15% when irrigation was flooded, dripped, and sprinkled, respectively (p < 0.05) when compared to full irrigation. In addition, ETc under deficit irrigation was decreased by 26, 30 and 5% when irrigation was flooded, dripped, and sprinkled, respectively (p < 0.05) (Figure 6A,B). Deficit irrigation significantly increased WP by 9.7% and 11.6%, respectively, under flood irrigation and drip irrigation, but significantly reduced WP by 14.6% under sprinkling irrigation when compared to full irrigation (Figure 6C). Irrigation water productivity for deficit irrigation was higher by 28.1% and 31.9%, respectively, under flood irrigation and drip irrigation than that in full irrigation, but deficit irrigation with sprinkling irrigation did not affect IWP (Figure 6D).
3.4. The Effect of Irrigation Practices on Potato Yield, ETc, and WP as Influenced by Soil Textures, SOC, and Annual Rainfall
The effect of irrigation practices on yield, ETc, and WP varied with soil textures, SOC, and annual rainfall (Figure 7 and Figure 8). In comparison to non-irrigation, the increase in potato yield under supplementary irrigation was most marked in sandy soil, followed by clay soil, and least in loam soil; the greatest increase in WP under supplementary irrigation occurred in sandy soils, followed by loam soils, and lowest in clay soils (Figure 7A,C). The supplementary irrigation increased yield and WP with increasing SOC between 0 and 2.0%, except for WP at SOC levels of 1.0–1.5% compared to non-irrigation. As SOC exceeded 2.0%, the positive effect of supplementary irrigation on yield decreased with the increase in SOC (Figure 7D,F). Compared to non-irrigation, the greater increase in yield and ETc with supplementary irrigation occurred in areas with annual rainfall between 400 and 600 mm, followed by 200–400 mm, 0–200 mm, and >800 mm (Figure 7G,H).
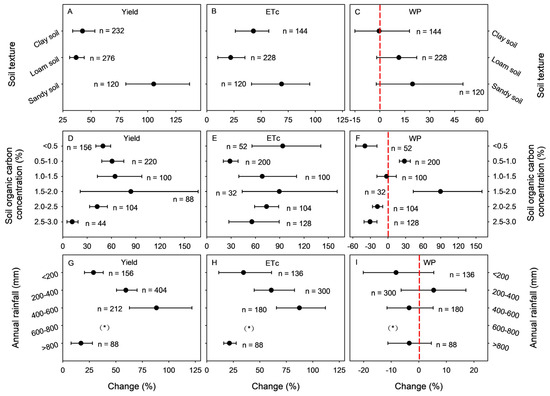
Figure 7.
Response of potato yield (A,D,G), crop evapotranspiration (ETc) (B,E,H), and water productivity (WP) (C,F,I) to supplementary irrigation compared to non-irrigation (rainfed production) at various soil textures (A–C), soil organic carbon concentration (D–F), and annual rainfall (G–I). Error bars represent 95% confidence intervals. The “n” indicates number of total observations. The asterisk represents a comparison of responses from less than three groups.
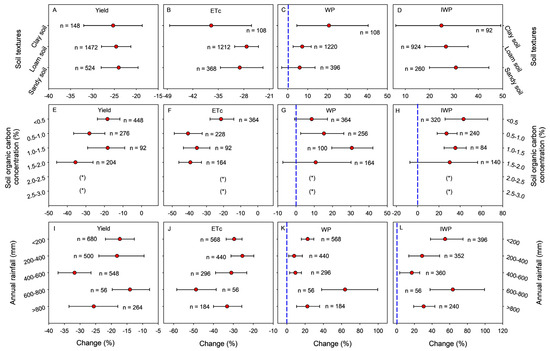
Figure 8.
Response of change in potato yield (A,E,I), evapotranspiration (ETc) (B,F,J), water productivity (WP) (C,G,K), and irrigation water productivity (IWP) (D,H,L) to deficit irrigation compared to full irrigation at various soil textures, soil organic carbon concentration, and annual rainfall. Error bars represent 95% confidence intervals. The “n” indicates number of total observations. The asterisk represents a comparison of responses from less than three groups.
Compared to full irrigation, potato yield decreased by 24% under deficit irrigation in sandy soil and by 25% in loam soil and clay soil (Figure 8A). Deficit irrigation reduced ETc by 27–37% in the three soil textures. WP under deficit irrigation increased by 21% in clay soil, 7% in loam soil, and 6% in sandy soil. The advantage of deficit irrigation on IWP was 31% in sandy soil, 27% in loam soil, and 25% in clay soil (Figure 8B–D). Compared to full irrigation, the greatest reduction in potato yield under deficit irrigation was found at 1.5–2.0% of SOC, followed by 0.5–1.0%, <0.5%, and was lowest at 1.0–1.5% of SOC (Figure 8E). The greatest reduction in ETc under deficit irrigation was found at 1.0–1.5% of SOC, followed by 1.5–2.0% and 0.5–1.0%, and was lowest at SOC < 0.5% (Figure 8F). WP under deficit irrigation reached its peak at a SOC of 1.0% (Figure 8G). Deficit irrigation did not significantly increase WP when SOC was below 0.5% or 1.5–2.0% (Figure 8G). IWP under deficit irrigation was increased by 43%, 27%, 35% (p < 0.05), and 30% (p > 0.05) at a SOC of <0.5, 0.5–1.0, 1.0–1.5, and 1.5–2.0%, respectively (Figure 8H). The decrease in potato yield under deficit irrigation was highest in areas with 400–600 mm, annual rainfall, followed by areas with >800 mm, and 0–400 mm, and was lowest in areas with 600–800 mm of annual rainfall (Figure 8I). The negative effect of deficit irrigation on ETc was highest at an annual rainfall of 600–800 mm, followed by >800 mm, 400–600 mm, <200 mm, and was lowest when annual rainfall 200–400 mm. Regardless of annual rainfall, deficit irrigation significantly increased WP and IWP by 8–64% and 17–64%, respectively. The increase in WP and IWP was highest in areas with 600–800 mm of annual rainfall, followed by areas with <200 mm and >800 mm, and were lowest when annual rainfall was 200–600 mm (Figure 8J–L).
Figure 9 illustrates the associations between SOC content and the comparative increase in yield per unit of irrigation. When the SOC is below 0.5%, the relative yield increase per unit of irrigation gradually diminishes with increasing SOC. However, this decline in relative yield increase per unit of irrigation amount becomes insignificant once the SOC exceeds 0.7% (Figure 9A). Under both deficit and full irrigation, the, SOC and IWP were linearly correlated with IWP increasing with SOC (Figure 9B). However, a high data variability was observed and regression coefficients were lower than 0.6.
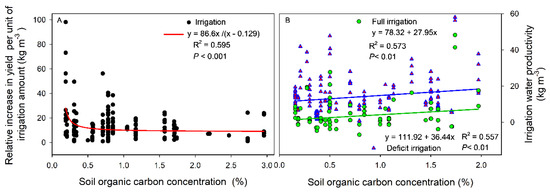
Figure 9.
Relationships between soil organic carbon content and relative yield increase per unit of irrigation amount under supplementary irrigation compared to non-irrigation (rainfed production) (A) and irrigation water productivity under deficit and full irrigation (WP) (B).
3.5. The Effect of Irrigation Practices on Potato Yield, ETc, and WP as Influenced by Fertilizer Rates
The effect of supplementary irrigation on potato yield, ETc, and WP varied with fertilizer rates (Figure 10). With the increase in N fertilization rate, the positive effect of supplementary irrigation on potato yield was gradually decreased, while ETc was gradually increased when compared to non-irrigation (Figure 10A,B). Potato yield under supplementary irrigation increased by 68, 76, and 53% at 0–65, 65–110, and 110–155 kg P ha−1, respectively, when compared to non-irrigation (Figure 10D). The effects of P fertilizer rate on ETc varied with the level of P as follows: 65–110, 0–65 and 110–155 kg P ha−1 (Figure 10E). The effects of K fertilizer rate on potato yield varied with the level of K as follows: 0–125 kg K ha−1 (100%), 125–205 kg K ha−1 (61%), and 205–290 kg K ha−1 (37%) (Figure 10G). ETc under irrigation was highest at 205–290 kg K ha−1 (20%), followed by 0–125 kg K ha−1 (19%), and was lowest at 125–205 kg K ha−1 (16%) (Figure 10H). Potato WP did not differ between supplementary irrigation and non-irrigation for all fertilizer rates (Figure 10C,F,I).
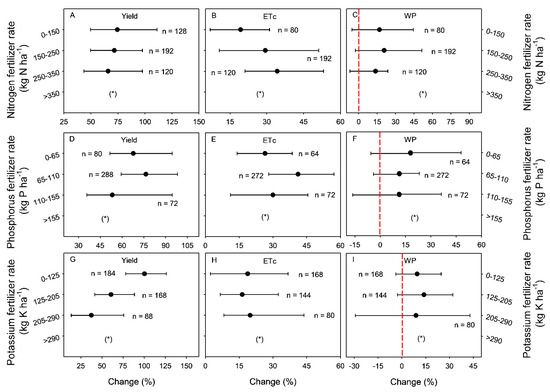
Figure 10.
Response of change in potato yield (A,D,G), evapotranspiration (ETc) (B,E,H), and water productivity (WP) (C,F,I) to supplementary irrigation compared to non-irrigation (rainfed production) at different nitrogen fertilizer rates (A–C), phosphorus fertilizer rates (D–F), and potassium fertilizer rates (G–I). Error bars represent 95% confidence intervals. The “n” indicates number of total observations. The asterisk represents a comparison of responses from less than three groups.
Compared to full irrigation, deficit irrigation reduced potato yield by 10–34% and 13% under 60–240 and 360–420 kg N ha−1, respectively, but did not affect potato yield when 240–360 kg N ha−1 was applied (Figure 11A). ETc was reduced by 14–40% under deficit irrigation, but as N fertilizer application increased in the range of 0–240 kg N ha−1, the negative effect of deficit irrigation on ETc increased gradually (Figure 11B). Under deficit irrigation, WP increased by 30, 14, 19, and 25% when 0–60, 120–180, 180–240, and 360–420 kg N ha−1 were applied, respectively (Figure 11C). The positive effect of deficit irrigation on IWP increased by 40, 36, 22, 124, and 34%, respectively, compared to full irrigation (Figure 11D).
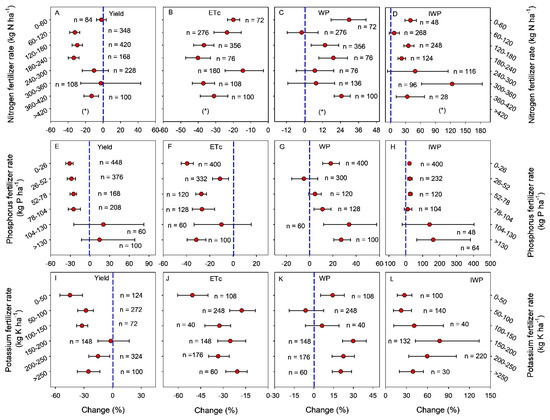
Figure 11.
Response of change in potato yield (A,E,I), evapotranspiration (ETc) (B,F,J), water productivity (WP) (C,G,K), and irrigation water productivity (IWP) (D,H,L) to deficit irrigation compared to full irrigation at different levels of nitrogen, phosphorus and potassium rates. Error bars represent 95% confidence intervals. The “n” indicates number of total observations. The asterisk represents a comparison of responses from less than three groups.
Potato yield, ETc, WP and IWP under deficit irrigation varied in responses to P fertilizer application rate (Figure 11E–H). As the P fertilizer application rate increased, the negative effect of deficit irrigation on yield gradually decreased. Deficit irrigation alone reduced yield by 25–31%, but potato yield did not decrease when the application of P fertilizer exceeded 104 kg P ha−1. The reduction in ETc under deficit irrigation was highest when 0–26 kg P ha−1 was applied, followed by >130, 52–104, 26–52 kg P ha−1, and lowest when 104–130 kg P ha−1 was applied. Deficit irrigation increased WP by 18, 11, 34, and 27% when 0–26, 78–104, 104–130, and >130 kg P ha−1 were applied respectively. When the rate of P fertilizer increased from 0 to 130 kg P ha−1, the positive effect of deficit irrigation on WP increased gradually, except in the range of 0–26 kg ha−1 of P fertilizer.
The response of potato yield, ETc, and WP to deficit irrigation varied with K fertilizers rate (Figure 11I–L). Compared to full irrigation, within the K fertilizer range of 0–200 kg K ha−1, the reduction in potato yield caused by deficit irrigation decreases with increasing K fertilization; however, when K fertilizer rate exceeds 200 kg K ha−1, the negative effect of deficit irrigation on yield intensifies with further increases in potassium fertilization. Under 150–200 kg K ha−1, deficit irrigation did not reduce potato yield. WP under deficit irrigation varied from −6.4–30% with the rate of K fertilizer application. Deficit irrigation increased WP, except when 50–150 kg K ha−1 was applied. IWP under deficit irrigation was increased by 27, 22, 41, 77, 60 and 39% under 0–50, 50–100, 100–150, 150–200, 200–250, and >250 kg K ha−1, respectively, compared to full irrigation.
3.6. The Effect of Supplementary Irrigation on Potato Yield, ETc, and WP Varied with Irrigation Amount
Potato yield and ETc increased with increasing irrigation amount, except for ETc under 120–180 mm of irrigation (Figure 12). WP under supplementary irrigation initially declined, but then increased with irrigation amount, reaching a maximum at 60–90 mm. Once irrigation exceeded 180 mm, WP under supplementary irrigation was significantly decreased relative to non-irrigation.
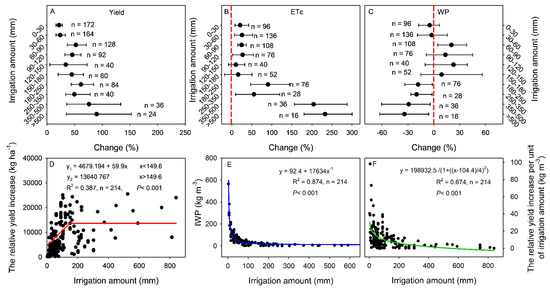
Figure 12.
Response of change in potato yield (A), evapotranspiration (ETc) (B), and water productivity (WP) (C) to supplementary irrigation compared to non-irrigation (rainfed production) at different levels of irrigation amount, and the relationships between irrigation amount and relative yield increase (D), irrigation water productivity (WP) (E), and relative yield increase per unit of irrigation amount (F) under supplementary irrigation compared to non-irrigation (rainfed production). In figure (A–C), error bars represent 95% confidence intervals, the values for “n” represent the corresponding number of comparisons. Figure D shows the relationship between yield and irrigation amount filled with the linear-plateau model, y1 indicates predicted grain yield, a and b indicate intercept, and slope, while y2 is the predicted plateau-grain yield fitted with the model. In the regression model (D–F), significance of regression coefficients and intercepts was determined with a F-test (p < 0.05), the “n” indicates number of total observations.
Figure 12D–F illustrate the relationship between amount of irrigation and relative yield increase, IWP, and potato yield increase per unit of irrigation. The relationship between the amount of irrigation and relative yield increase was fitted with the linear-plateau model. Once the amount of irrigation exceeded 149.6 mm, the comparative yield reached a plateau, and its increase was slow with further irrigation. The correlations between the amount of irrigation and IWP, as well as relative yield increase per unit of irrigation, were fitted as the inverse proportionality. With irrigation between 0 and 150 mm, IWP and relative yield increase per unit of irrigation but declined sharply with increasing irrigation. Beyond 150 mm of irrigation, the decline in IWP and relative yield increase per unit of irrigation slowed down.
3.7. The Effect of Deficit Irrigation on Potato Yield, ETc, and WP as Influenced by Different Water-Saving Ratio and Irrigation Methods
Overall, as the water-saving ratio under deficit irrigation increased, the reduction in yield and ETc increased (Figure 13). Excessive irrigation did not increase potato yield but did increase ETc, and deficit irrigation significantly reduced yield except under 10–20% water-saving ratio. Deficit irrigation significantly increased WP by 10–13% under 30–60% water-saving ratios, and IWP significantly increased by 15–148% under 10–80% water-saving ratios.
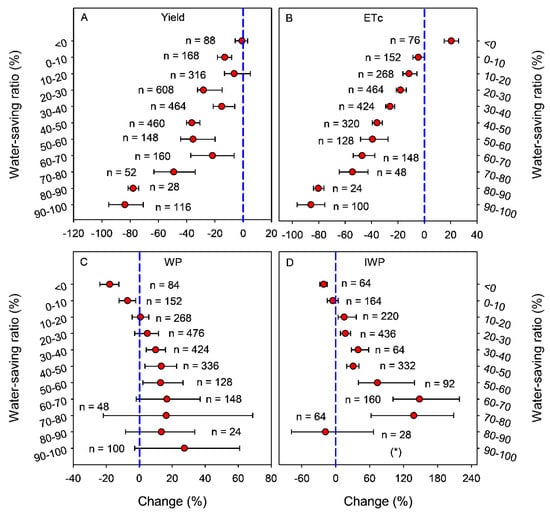
Figure 13.
(A) Response of potato yield, (B) evapotranspiration (ETc), (C) water productivity (WP), and (D) irrigation water productivity (IWP) to deficit irrigation when compared to full irrigation at different water-saving ratios. Error bars represent 95% confidence intervals. The “n” indicates number of total observations. The asterisk represents a comparison of responses from less than three groups.
4. Discussion
4.1. Impact of Irrigation Practices on Potato Yield and WP
In this study, supplementary irrigation demonstrated significant yield-enhancing effects in potato production. The main factors driving potato yield from random forest analysis are biomass accumulation at maturity, dry matter accumulation after flowering, nitrogen uptake, harvest index, and average tuber weight, in line with previous studies [8,20,21,22,23,24,25]. However, compared to rainfed production (non-irrigation), supplementary irrigation increases water consumption; thus, in most cases, supplementary irrigation will not increase WP, and may even decrease WP [23,26,27]. In this study, our results indicate that the impact of supplementary irrigation on WP is related to the amount of irrigation. Under excessive irrigation (i.e., >180 mm), WP is reduced, while under moderate irrigation (i.e., 60–90 mm), WP is increased. These results demonstrate that supplemental irrigation has the potential to synergistically enhance potato yield and WP with rational irrigation amounts.
Irrigation methods such as furrow irrigation, sprinkler irrigation, and drip irrigation are widely used in potato cropping, but their impact on potato yield and WP are not consistent. Drip irrigation saves water resources and increases WP, this is in line with previous studies [28,29,30], it is likely that potato yield and crop evapotranspiration (ETc) exhibited asynchronous responses under drip irrigation [29,31].
Rational irrigation should aim to both increase WP and maintain yield. Excessive irrigation can reduce potato yield and WP, as irrigation exceeding crop water requirements has a negative effect on yield formation [16,32]. This meta-analysis revealed that deficit irrigation failed to synergistically enhance yield and WP because it significantly improved WP and IWP but substantially reduced potato yield compared to full irrigation, as it has been shown in previous studies [33,34]. It was likely because deficit irrigation reducing tuber number per plant and average tuber weight, which were associated with decreases in aboveground biomass accumulation at maturity, N uptake, root/shoot ratio, proportion of tubers dry weight to total biomass, dry matter accumulation from tuber formation to maturity, and leaf area index. A study reported that when irrigation amounted to 50% of full water supply, deficit irrigation had no significant impact on potato yield or WP [35]. Our study further demonstrated that a water-saving ratio below 20% enabled deficit irrigation to improve IWP without yield loss compared to full irrigation. However, WP under deficit irrigation showed significant improvement only when the water-saving ratio exceeded 30%, as it has been shown in previous studies [32,36].
The amount of irrigation exerted significant effects on potato yield and WP. Irrigated potato crop yields increased proportionally with higher irrigation amounts [6,15,37,38]. Whether supplementary irrigation can synergistically enhance yield and WP remains a central debate in irrigated agriculture. This study found that supplementary irrigation at 60–90 mm simultaneously enhanced both crop yield and WP. However, supplementary irrigation exceeding 150 mm reduced both WP and IWP, primarily because yields showed no significant increase at this higher water supplying. Specifically, the relative yield gain per unit of irrigation declined progressively with increasing irrigation amount [15].
4.2. The Impact of Irrigation Practices on Potato Yield, ETc, and WP Under Different Soil Texture and SOC
Irrigated potato yield increased the most in sandy soils, as they are not easily compacted and have good water permeability, as shown in previous studies [39,40,41]. As reported in other studies [42,43,44,45], improving SOC had a positive effect on crop yield, because as SOC increases, there is an increase in soil fertility and an improvement in soil quality. Whether the increase in SOC can improve WP is an important question to be addressed. To date, few studies have explored the relationship between the relative increase in potato yield per unit of irrigation and SOC levels under irrigated conditions. For example, in wheat, increased SOC has been shown to enhance WP [43]. This meta-analysis highlights that the impact of irrigation on yield and WP is most pronounced in environments where the SOC ranges from 1.5% to 2.0%. Overall, this meta-analysis underscores the critical role of SOC management in simultaneously boosting crop yield and WP in agricultural systems.
4.3. Response of Potato Yield and WP to Irrigation Managements Under Fertilizers Rates
Supplementary irrigation influenced potato yield under all N, P, and K fertilizers rates but had no significant effect on WP, mainly because potato yield and ETc under irrigation do not increase proportionally, with the rise in ETc exceeding that of yield. Furthermore, the impact of deficit irrigation on potato yield and WP varied depending on N, P, and K fertilizer application rates. Overall, applying N, P, and K fertilizers under deficit irrigation enhanced both yield and WP. The primary reason is that fertilizer application stimulated crop root growth [46], enhanced drought resistance [47,48,49,50], and facilitated biomass accumulation. For example, high N fertilizer rates (e.g., 240–360 kg N ha−1) under deficit irrigation can maintain yield while improving WP and IWP. This is attributed to greater biomass accumulation driven by elevated N inputs, thereby enhancing yield. Similarly, the effect of P fertilizer under deficit irrigation mirrors that of N fertilizer, suggesting that optimal N and P application can improve WP without compromising yield. Conversely, if deficit irrigation aims to boost WP while maintaining yield, the recommended potassium fertilizer rate is 180–240 kg K2O ha−1. These findings highlight the critical role of balanced N, P, and K fertilization in optimizing crop yield and WP under water-limited conditions.
5. Conclusions
A comprehensive meta-analysis was conducted to evaluate the effects of irrigation practices on potato yield and water productivity. Improving SOC is beneficial for enhancing WP in irrigated potato systems. When the amount of supplementary irrigation is restricted to ≤150 mm under drip irrigation, supplementary irrigation can enhance potato yield and WP in sandy soils with SOC levels of 1.5–2.0% and annual rainfall of 200–400 mm, when moderate rates of N, P, and K fertilizers (150–250 kg ha−1) are applied. Similarly, deficit irrigation has the potential to improve WP without losing yield under drip irrigation in sandy soils with annual rainfall of 600–800 mm, but this requires optimal fertilizer rates (240–360 kg N ha−1, >104 kg P2O5 ha−1, and 150–200 kg K2O ha−1). These findings highlight the potential of tailored irrigation strategies to achieve sustainable yield gains and improve water productivity in global potato production.
Supplementary Materials
The following supporting information can be downloaded at: https://www.mdpi.com/article/10.3390/agronomy15081942/s1, Figure S1: Effect of irrigation practices on potato quality.
Author Contributions
Conceptualization, Y.N. and L.W.; methodology, L.L. and Z.L.; software, Y.N. and L.W.; validation, L.L. and L.W.; formal analysis, L.W. and Y.N.; investigation, L.W. and Y.N.; resources, and L.W.; data curation, L.W. and Y.N.; writing—original draft preparation, Y.N. and L.W.; writing—review and editing, S.K.F., J.A.P., S.L. and L.W.; visualization, L.W.; supervision, Y.N. and L.W.; project administration, L.W.; funding acquisition, L.W. All authors have read and agreed to the published version of the manuscript.
Funding
This research was funded by the National Key R&D Program of China (2023YFD1900403), the Natural Science Foundation of Gansu Province of China (24JRRA841), the Major Science and Technology Project of Gansu Province (25ZDNA007), the National Natural Science Foundation of China (42167008), the Fuxi young funds of Gansu Agricultural University (GAUfx-04Y09), the Science and Technology Project of Gansu Province (25JRRA807).
Data Availability Statement
The authors will supply the relevant data in response to reasonable requests.
Acknowledgments
We appreciate the excellent technical assistance for data collection by undergraduate and graduate students at the Gansu Agricultural University Rainfed Agricultural Experimental Station.
Conflicts of Interest
The authors declare no conflicts of interest.
References
- FAO. A report produced for the G20 Presidency of Germany. In Water for Sustainable Food and Agriculture; Food and Agriculture Organization of the United Nations: Rome, Italy, 2017; ISBN 978-92-5-109977-3. [Google Scholar]
- Kang, S.; Hao, X.; Du, T.; Tong, L.; Su, X.; Lu, H.; Li, X.; Huo, Z.; Li, S.; Ding, R. Improving agricultural water productivity to ensure food security in China under changing environment: From research to practice. Agric. Water Manag. 2017, 179, 5–17. [Google Scholar] [CrossRef]
- Wang, L.; Li, L.; Xie, J.; Luo, Z.; Sumera, A.; Zechariah, E.; Fudjoe, S.K.; Palta, J.A.; Chen, Y. Does plastic mulching reduce water footprint in field crops in China? A meta-analysis. Agric. Water Manag. 2022, 260, 107293. [Google Scholar] [CrossRef]
- Cheng, M.; Wang, H.; Fan, J.; Zhang, S.; Liao, Z.; Zhang, F.; Wang, Y. A global meta-analysis of yield and water use efficiency of crops, vegetables and fruits under full, deficit and alternate partial root-zone irrigation. Agric. Water Manag. 2021, 248, 106771. [Google Scholar] [CrossRef]
- Deng, X.; Shan, L.; Zhang, H.; Turner, N.C. Improving agricultural water use efficiency in arid and semiarid areas of China. Agric. Water Manag. 2006, 80, 23–40. [Google Scholar] [CrossRef]
- Li, Y.; Tang, J.; Wang, J.; Zhao, G.; Yu, Q.; Wang, Y.; Hu, Q.; Zhang, J.; Pan, Z.; Pan, X. Diverging water-saving potential across China’s potato planting regions. Eur. J. Agron. 2022, 134, 126450. [Google Scholar] [CrossRef]
- Shupe, S.J. Waste in Western Water Law: A Blueprint for Change. Or. L. Rev. 1982, 61, 483. [Google Scholar]
- Haverkort, A.; Struik, P. Yield levels of potato crops: Recent achievements and future prospects. Field Crops Res. 2015, 182, 76–85. [Google Scholar] [CrossRef]
- Djaman, K.; Irmak, S.; Koudahe, K.; Allen, S. Irrigation management in potato (Solanum tuberosum L.) production: A review. Sustainability 2021, 13, 1504. [Google Scholar] [CrossRef]
- De Jong, H. Impact of the potato on society. Am. J. Potato Res. 2016, 93, 415–429. [Google Scholar] [CrossRef]
- Li, Q.; Li, H.; Zhang, L.; Zhang, S.; Chen, Y. Mulching improves yield and water-use efficiency of potato cropping in China: A meta-analysis. Field Crops Res. 2018, 221, 50–60. [Google Scholar] [CrossRef]
- Zarzyńska, K.; Boguszewska-Mańkowska, D.; Nosalewicz, A. Differences in size and architecture of the potato cultivars root system and their tolerance to drought stress. Plant Soil Environ. 2017, 63, 159–164. [Google Scholar] [CrossRef]
- Feng, Z.; Kang, Y.; Wan, S.; Liu, S. Effect of drip fertigation on potato productivity with basal application of loss control fertilizer in sandy soil. Irrig. Drain. 2018, 67, 210–221. [Google Scholar] [CrossRef]
- Yuan, B.Z.; Nishiyama, S.; Kang, Y. Effects of different irrigation regimes on the growth and yield of drip-irrigated potato. Agric. Water Manag. 2003, 63, 153–167. [Google Scholar] [CrossRef]
- Onder, S.; Caliskan, M.E.; Onder, D.; Caliskan, S. Different irrigation methods and water stress effects on potato yield and yield components. Agric. Water Manag. 2005, 73, 73–86. [Google Scholar] [CrossRef]
- Shock, C.C.; Pereira, A.B.; Eldredge, E.P. Irrigation best management practices for potato. Am. J. Potato Res. 2007, 84, 29–37. [Google Scholar] [CrossRef]
- Cheng, M.; Wang, H.; Fan, J.; Wang, X.; Sun, X.; Yang, L.; Zhang, S.; Xiang, Y.; Zhang, F. Crop yield and water productivity under salty water irrigation: A global meta-analysis. Agric. Water Manag. 2021, 256, 107105. [Google Scholar] [CrossRef]
- Qaswar, M.; Jing, H.; Ahmed, W.; Dongchu, L.; Shujun, L.; Lu, Z.; Cai, A.; Lisheng, L.; Yongmei, X.; Jusheng, G.; et al. Yield sustainability, soil organic carbon sequestration and nutrients balance under long-term combined application of manure and inorganic fertilizers in acidic paddy soil. Soil Tillage Res. 2020, 198, 104569. [Google Scholar] [CrossRef]
- He, G.; Wang, Z.; Li, S.; Malhi, S.S. Plastic mulch: Tradeoffs between productivity and greenhouse gas emissions. J. Clean. Prod. 2018, 172, 1311–1318. [Google Scholar] [CrossRef]
- Archer, E. Estimate Permutation p-Values for Random Forest Importance Metrics. R Package Version. 2023. Available online: https://mirror.math.princeton.edu/pub/CRAN/web/packages/rfPermute/rfPermute.pdf (accessed on 8 August 2025).
- Rolbiecki, R.; Rolbiecki, S.; Figas, A.; Jagosz, B.; Stachowski, P.; Sadan, H.A.; Prus, P.; Pal-Fam, F. Requirements and effects of surface drip irrigation of mid-early potato cultivar Courage on a very light soil in Central Poland. Agronomy 2020, 11, 33. [Google Scholar] [CrossRef]
- Jiang, Y.; Stetson, T.; Phillips, J.; Kostic, A. Reducing yearly variation in potato tuber yield using supplemental irrigation. Potato Res. 2024, 67, 1625–1651. [Google Scholar] [CrossRef]
- Misgina, N.A.; Beshir, H.M.; Yohannes, D.B.; Gebreyohanes, G.H. Growth, Yield, and Water Productivity of Potato Genotypes Under Supplemental and Non-Supplemental Irrigation in Semi-Arid Areas of Northern Ethiopia. Agronomy 2024, 15, 72. [Google Scholar] [CrossRef]
- Machakaire, A.; Steyn, J.M.; Franke, A. Photosynthesis rate, radiation and water use efficiencies of irrigated potato in a semi-arid climate using Eddy covariance techniques. J. Agric. Sci. 2023, 161, 217–229. [Google Scholar] [CrossRef]
- Martínez-Maldonado, F.E.; Castaño-Marín, A.M.; Góez-Vinasco, G.A.; Marin, F.R. Gross primary production of rainfed and irrigated potato (Solanum tuberosum L.) in the colombian andean region using eddy covariance technique. Water 2021, 13, 3223. [Google Scholar] [CrossRef]
- Satognon, F.; Owido, S.F.; Lelei, J.J. Effects of supplemental irrigation on yield, water use efficiency and nitrogen use efficiency of potato grown in mollic Andosols. Environ. Syst. Res. 2021, 10, 38. [Google Scholar] [CrossRef]
- Li, Y.; Wang, J.; Fang, Q.; Hu, Q.; Huang, M.; Chen, R.; Zhang, J.; Huang, B.; Pan, Z.; Pan, X. Optimizing water management practice to increase potato yield and water use efficiency in North China. J. Integr. Agric. 2023, 22, 3182–3192. [Google Scholar] [CrossRef]
- Yang, P.; Wu, L.; Cheng, M.; Fan, J.; Li, S.; Wang, H.; Qian, L. Review on drip irrigation: Impact on crop yield, quality, and water productivity in China. Water 2023, 15, 1733. [Google Scholar] [CrossRef]
- Wang, Y.; Li, S.; Qin, S.; Guo, H.; Yang, D.; Lam, H.-M. How can drip irrigation save water and reduce evapotranspiration compared to border irrigation in arid regions in northwest China. Agric. Water Manag. 2020, 239, 106256. [Google Scholar] [CrossRef]
- Li, H.; Mei, X.; Wang, J.; Huang, F.; Hao, W.; Li, B. Drip fertigation significantly increased crop yield, water productivity and nitrogen use efficiency with respect to traditional irrigation and fertilization practices: A meta-analysis in China. Agric. Water Manag. 2021, 244, 106534. [Google Scholar] [CrossRef]
- Payero, J.O.; Tarkalson, D.D.; Irmak, S.; Davison, D.; Petersen, J.L. Effect of irrigation amounts applied with subsurface drip irrigation on corn evapotranspiration, yield, water use efficiency, and dry matter production in a semiarid climate. Agric. Water Manag. 2008, 95, 895–908. [Google Scholar] [CrossRef]
- Mora-Sanhueza, R.; Tighe-Neira, R.; López-Olivari, R.; Inostroza-Blancheteau, C. Assessment of Different Irrigation Thresholds to Optimize the Water Use Efficiency and Yield of Potato (Solanum tuberosum L.) Under Field Conditions. Plants 2025, 14, 1734. [Google Scholar] [CrossRef]
- Ahmadi, S.H.; Agharezaee, M.; Kamgar-Haghighi, A.A.; Sepaskhah, A.R. Effects of dynamic and static deficit and partial root zone drying irrigation strategies on yield, tuber sizes distribution, and water productivity of two field grown potato cultivars. Agric. Water Manag. 2014, 134, 126–136. [Google Scholar] [CrossRef]
- Alva, A.; Moore, A.; Collins, H. Impact of deficit irrigation on tuber yield and quality of potato cultivars. J. Crop. Improv. 2012, 26, 211–227. [Google Scholar] [CrossRef]
- Xie, K.; Wang, X.-X.; Zhang, R.; Gong, X.; Zhang, S.; Mares, V.; Gavilán, C.; Posadas, A.; Quiroz, R. Partial root-zone drying irrigation and water utilization efficiency by the potato crop in semi-arid regions in China. Sci. Hortic. 2012, 134, 20–25. [Google Scholar] [CrossRef]
- Yactayo, W.; Ramírez, D.A.; Gutiérrez, R.; Mares, V.; Posadas, A.; Quiroz, R. Effect of partial root-zone drying irrigation timing on potato tuber yield and water use efficiency. Agric. Water Manag. 2013, 123, 65–70. [Google Scholar] [CrossRef]
- Ierna, A.; Mauromicale, G. Potato growth, yield and water productivity response to different irrigation and fertilization regimes. Agric. Water Manag. 2018, 201, 21–26. [Google Scholar] [CrossRef]
- Kashyap, P.; Panda, R. Effect of irrigation scheduling on potato crop parameters under water stressed conditions. Agric. Water Manag. 2003, 59, 49–66. [Google Scholar] [CrossRef]
- Po, E.A.; Snapp, S.S.; Kravchenko, A. Potato yield variability across the landscape. Agron. J. 2010, 102, 885–894. [Google Scholar] [CrossRef]
- Miller, D.; Martin, M. Effect of daily irrigation rate and soil texture on yield and quality of Russet Burbank potatoes. Am. Potato J. 1983, 60, 745–757. [Google Scholar] [CrossRef]
- Zebarth, B.J.; Fillmore, S.; Watts, S.; Barrett, R.; Comeau, L.-P. Soil factors related to within-field yield variation in commercial potato fields in Prince Edward Island Canada. Am. J. Potato Res. 2021, 98, 139–148. [Google Scholar] [CrossRef]
- Martin, M.; Miller, D. Variations in responses of potato germplasm to deficit irrigation as affected by soil texture. Am. Potato J. 1983, 60, 671–683. [Google Scholar] [CrossRef]
- Wang, L.; Li, Q.; Coulter, J.A.; Xie, J.; Luo, Z.; Zhang, R.; Deng, X.; Li, L. Winter wheat yield and water use efficiency response to organic fertilization in northern China: A meta-analysis. Agric. Water Manag. 2020, 229, 105934. [Google Scholar] [CrossRef]
- Ma, Y.; Woolf, D.; Fan, M.; Qiao, L.; Li, R.; Lehmann, J. Global crop production increase by soil organic carbon. Nat. Geosci. 2023, 16, 1159–1165. [Google Scholar] [CrossRef]
- Pan, G.; Smith, P.; Pan, W. The role of soil organic matter in maintaining the productivity and yield stability of cereals in China. Agric. Ecosys. Environ. 2009, 129, 344–348. [Google Scholar] [CrossRef]
- Wang, L.; Wang, S.; Chen, W.; Li, H.; Deng, X. Physiological mechanisms contributing to increased water-use efficiency in winter wheat under organic fertilization. PLoS ONE 2017, 12, e0180205. [Google Scholar] [CrossRef]
- Ahmad, R.; Waraich, E.A.; Ashraf, M.; Ahmad, S.; Aziz, T. Does nitrogen fertilization enhance drought tolerance in sunflower? A review. J. Plant Nutr. 2014, 37, 942–963. [Google Scholar] [CrossRef]
- Hansel, F.D.; Amado, T.J.; Ruiz Diaz, D.A.; Rosso, L.H.; Nicoloso, F.T.; Schorr, M. Phosphorus fertilizer placement and tillage affect soybean root growth and drought tolerance. Agron. J. 2017, 109, 2936–2944. [Google Scholar] [CrossRef]
- Sedri, M.H.; Roohi, E.; Niazian, M.; Niedbała, G. Interactive effects of nitrogen and potassium fertilizers on quantitative-qualitative traits and drought tolerance indices of rainfed wheat cultivar. Agronomy 2021, 12, 30. [Google Scholar] [CrossRef]
- Tariq, A.; Pan, K.; Olatunji, O.A.; Graciano, C.; Li, Z.; Sun, F.; Sun, X.; Song, D.; Chen, W.; Zhang, A. Phosphorous application improves drought tolerance of Phoebe zhennan. Front. Plant Sci. 2017, 8, 274923. [Google Scholar] [CrossRef]
Disclaimer/Publisher’s Note: The statements, opinions and data contained in all publications are solely those of the individual author(s) and contributor(s) and not of MDPI and/or the editor(s). MDPI and/or the editor(s) disclaim responsibility for any injury to people or property resulting from any ideas, methods, instructions or products referred to in the content. |
© 2025 by the authors. Licensee MDPI, Basel, Switzerland. This article is an open access article distributed under the terms and conditions of the Creative Commons Attribution (CC BY) license (https://creativecommons.org/licenses/by/4.0/).