Article

Silage Maize Identification Using a Temporal Difference-Based Model with Sentinel-2 Data: Insights from a Harvest-Based and Temporally Transferable Approach

by
Zhenyu Lin
1,
Ran Huang
1,*,
Sihan Tan
1,
Lingbo Yang
1,
Jingfeng Huang
2,3,4,
Lijun Su
5 and
Zhichao Hu
5
1
School of Artificial Intelligence, Hangzhou Dianzi University, Hangzhou 310018, China
2
Key Laboratory of Environmental Remediation and Ecological Health, Ministry of Education, Zhejiang University, Hangzhou 310058, China
3
Institute of Applied Remote Sensing and Information Technology, Zhejiang University, Hangzhou 310058, China
4
Key Laboratory of Agricultural Remote Sensing and Information Systems, Hangzhou 310058, China
5
Hohhot Meteorological Bureau, Hohhot 010020, China
*
Author to whom correspondence should be addressed.
Agronomy 2025, 15(6), 1438; https://doi.org/10.3390/agronomy15061438
Submission received: 31 March 2025 / Revised: 8 June 2025 / Accepted: 10 June 2025 / Published: 12 June 2025
(This article belongs to the Section Grassland and Pasture Science)

Abstract

:
In response to the limited research on silage maize classification in China and the lack of data support for refined agricultural and livestock management, this study proposes a Temporal Difference-based Silage Maize Identification Model (TempDiff-SMID) using the Google Earth Engine (GEE) platform. By analyzing the phenological phases of silage maize and grain maize, we identified their critical harvest periods and established decision rules for classifying silage maize, grain maize, and other land cover types. Preprocessed Sentinel-2 imagery was smoothed using the Whittaker filter to construct the TempDiff-SMID model. After iterative threshold optimization, the decision tree model achieved an overall accuracy of 0.9291 and a Kappa coefficient of 0.8923, indicating robust classification performance. The user’s accuracies for silage maize, grain maize, and other land cover types were 0.9216, 0.9219, and 0.9404, respectively, while the producer’s accuracies reached 0.94, 0.9008, and 0.9467, demonstrating minimal omission and commission errors across all categories. Furthermore, the F1 scores for silage maize, grain maize, and other land cover types were 0.9307, 0.9112, and 0.9435, respectively, confirming the effectiveness of the TempDiff-SMID framework in leveraging harvest time differences for accurate silage maize identification. To evaluate performance, we compared the TempDiff-SMID with the RF Model for Silage Maize Classification (SMRF). The TempDiff-SMID outperformed the SMRF in both overall accuracy (0.9043 vs. 0.9291) and Kappa coefficient (0.8511 vs. 0.8923), while also providing an intuitive representation of spectral and phenological differences between silage maize and grain maize. When applied to multi-year data, TempDiff-SMID demonstrated strong temporal transferability, achieving overall accuracies of 0.8621 (2022) and 0.8816 (2021), thereby confirming its robustness across growing seasons. The proposed model offers simplicity in methodology, clear interpretability, and efficient deployment, making it a practical tool for agricultural and livestock management systems. Its ability to rapidly adapt to new regions or years underscores its significance in supporting precision agriculture and sustainable farming practices.

1. Introduction

Silage maize, a critical feedstock for the livestock industry, has seen a steady increase in the cultivation area. Studying the spatial distribution of silage maize and grain maize can guide the livestock sector in adjusting planting strategies and optimizing regional agricultural layouts. However, to date, numerous studies have explored the classification of spectrally and phenologically similar crops using machine learning, deep learning, and threshold-based methods. Many of these studies have demonstrated that maize can be effectively distinguished from other crop types. However, relatively limited research has been conducted on the finer classification of different maize varieties. Meanwhile, similar growth characteristics of silage maize and grain maize, particularly their overlapping growth stages, pose significant challenges for remote sensing-based classification and mapping, unlike the distinct separability typically observed between different crop types. Furthermore, the narrow harvest window between the two maize varieties complicates field surveys to map their spatial patterns. Therefore, developing image processing techniques to rapidly and accurately differentiate silage maize from grain maize, while ensuring cross-year applicability in maize mapping, is of substantial importance for advancing precision livestock farming and sustainable agricultural practices.
Recent studies around the world have used machine learning (ML) and deep learning (DL) approaches to achieve precise identification based on multisource remote sensing and maize acreage monitoring. These methods typically rely on large-scale sample datasets to train models, enabling the generation of high-resolution national maize distribution maps. For example, X. Li et al. generated 10 m resolution maize cultivation maps for China from 2017 to 2021 using Sentinel-2 satellite imagery, combined with the Normalized Difference Vegetation Index (NDVI) and Enhanced Vegetation Index (EVI) [1]. Their methodology leveraged both recurrent neural networks (RNNs) and random forest model, achieving overall classification accuracies ranging from 0.83 to 0.95 across the five-year data set. This work provides a vital reference for global food security research by offering spatially explicit insights into maize distribution patterns. Similarly, N. You et al. collected extensive ground-truth samples through field surveys and high-resolution image interpretation, covering major crops such as maize, soybean, and rice [2]. By employing an RF algorithm with spectral, temporal, and textural features, they implemented a hierarchical classification approach to distinguish croplands and crop types. The resultant annual 10-m resolution crop maps for Northeast China (2017–2019) demonstrated high reliability, with overall accuracies ranging from 0.81 to 0.86 and a strong consistency against statistical yearbook records (R2 = 0.83–0.99). B. Wang et al. developed the SSATNet, a deep learning architecture integrating 3D–2D convolutions, spectral–spatial morphological operations, and a Transformer encoder, based on a hyperspectral maize image dataset [3]. The model extracts spectral–spatial correlation features via 3D convolutions, enhances local structures through dilation/erosion morphological operations, and captures global dependencies using a cross-attention Transformer mechanism. It achieved exceptional performance on the test set, with 0.9865 precision, 0.9857 recall, and a Kappa coefficient of 0.9965, offering a high-performance and interpretable solution for hyperspectral crop classification and advancing precise variety identification in smart agriculture. H. Li et al. addressed the limitations of insufficient reference and training data in traditional supervised classification by collecting extensive samples through field surveys, statistical yearbook inferences, and existing crop maps [4]. They employed a random forest classifier with multispectral bands, vegetation indices, and time series data as input features, coupled with a regression estimator to integrate classification results with sample data for crop area estimation. By optimizing probability thresholds to align with sample area estimates, they successfully generated annual 10-m resolution maps of soybean and maize across China (2017–2021), significantly enhancing the accuracy of crop classification and area estimation. M. Gilcher et al. evaluated three classifiers—generalized linear model (GLM), random forest (RF), and support vector machine (SVM)—combined with the following two spatial autocorrelation mitigation methods: simple kriging (SK) and Gaussian blur [5]. The SVM and RF classifiers reliably distinguished maize pixels, with kappa values consistently exceeding 0.9, while GLM exhibited markedly inferior performance. Their study demonstrated that regression kriging and Gaussian blur both improved classification performance and reduced spatial autocorrelation under uniformly distributed samples. However, Gaussian blur proved to be more robust for clustered samples due to its lower dependency on sample distribution.
In recent years, increasing attention has been given to the interpretability and generalization ability of ML/DL methods. For instance, Ji Ge et al. proposed a novel interpretable deep learning model—explainable Mamba UNet (XM-UNet)—for mapping global rice cultivation areas [6]. By integrating selective scanning with convolutional neural networks, this model effectively balances the local and global spatial features of rice fields and provides interpretable temporal feature importance. This approach offers valuable guidance for rice distribution mapping and fills a notable gap in the existing research. Similarly, Yijia Xu et al. introduced a Transformer-based spectral–temporal network, STNet, which leverages the self-attention mechanism to extract informative features from time series remote sensing imagery for crop classification tasks [7]. In addition, they proposed a self-supervised pretraining framework, SITS-MoCo, which utilizes unlabeled remote sensing data to pretrain the model. This enables the learning of robust feature representations, reduces dependence on labeled data, and supports large-scale crop classification applications.
The threshold-based method is relatively simple to use, is especially easy to quickly deploy and apply on remote sensing data cloud platforms such as GEE, and its mechanism is clear. For example, TAO Jian-bin et al. proposed the Phenology-based Winter Rapeseed Index (PWRI), which effectively distinguishes winter rapeseed from winter wheat by analyzing their unique spectral characteristics at different phenological stages [8]. By integrating multi-temporal Sentinel-2 imagery on the Google Earth Engine platform, they employed a hierarchical classification method based on dynamic thresholds to identify winter rapeseed. This approach offers a novel solution for the large-scale, high spatial resolution mapping of winter rapeseed. Similarly, Gaoxiang Yang et al. developed a knowledge-guided machine learning method that integrates multi-source remote sensing and environmental data to extract annually updated training samples for the long-term mapping of winter wheat in China [9]. The study first identified key phenological stages based on crop growth dynamics, using variations in spectral or polarization features to enhance the separability between crop types. Then, annual training samples were automatically extracted and optimized from candidate crop pixels, and harmonic features were used to train a machine learning classifier to produce year-by-year distribution maps of winter wheat across China.
To mitigate the limited interpretability of ML/DL models, researchers have adopted phenology-based approaches for maize identification and monitoring. For instance, L. Zhong et al. developed a phenology-guided random forest classifier using Landsat TM/ETM+ imagery and meteorological data from Doniphan County, Kansas (2006–2010) [10]. By extracting phenological features from the Enhanced Vegetation Index (EVI) time series and integrating derived parameters like cumulative growing degree days (GDD), their model achieved the cross-year classification of maize and soybean, with average accuracies of 0.9010 (same-year training) and 0.8230 (cross-year validation). This framework provides a low-cost, high-frequency solution for agricultural remote sensing, particularly in scenarios with scarce ground truth data.
In another study, Zhong et al. extracted crop phenological stages by fitting EVI time series curves and utilized shortwave infrared (SWIR) band reflectance to differentiate soybean and maize [11]. They designed a decision tree classifier with expert-informed decision rules that synergized phenological and spectral characteristics, generating annual soybean and maize maps for Paraná State, Brazil (2010–2015). This robust algorithm enables the cost-effective production of multi-year consistent cropland cover data, with a specialized focus on soybean and maize discrimination, demonstrating adaptability to heterogeneous agricultural landscapes. However, phenological indices exhibit significant variability across regions and years, particularly under climate change or extreme weather events, where shifts in crop growth cycles may degrade classification accuracy.
Furthermore, despite the rapid advancement of satellite remote sensing as a cornerstone for land surface monitoring, natural resource surveys, and disaster response, pervasive data gaps persist due to cloud cover, sensor malfunctions, atmospheric disturbances, and temporal sampling limitations [12]. For instance, Li et al. evaluated the applicability of time series smoothing methods for grassland spring phenology (SOS) extraction on the Tibetan Plateau, emphasizing the impact of smoothing parameters on SOS accuracy [13]. While default parameters yielded acceptable results for most methods, Whittaker smoothing required parameter optimization, highlighting that both smoothing algorithms and SOS extraction methods jointly determine phenological accuracy. Zhou et al. systematically compared five time series reconstruction methods using MOD09GA data (2001–2014) to assess their performance across diverse geographies and vegetation types [14]. They synthesized pixel-wise NDVI reference sequences from raw daily NDVI data, simulated noise distributions based on QA flags, and demonstrated region-specific optimal methods, underscoring the lack of a universal solution. To address continuous data gaps, Cao et al. proposed the Spatio-Temporal Savitzky–Golay (STSG) method, which assigns weights to NDVI points by comparing raw values with initial estimates, then applies a weighted SG filter to enhance temporal continuity and accuracy [15]. Similarly, B. Qiu et al. developed a Successive Correction Wavelet Transform (SCWT) for smoothing MODIS 8-day EVI2 composites in China (2013) [16]. Compared to five conventional methods, SCWT excelled in handling complex multi-growth-cycle crop signals, preserving authentic local extrema while minimizing false inflection points, as validated by metrics including fidelity, smoothness, and phenological extraction efficiency.
In the context of silage maize-specific research, Hamid Salehi Shahrabi et al. introduced a novel parameter, SPGH/LOS (Spectral-Phenological Growth Height/Length of Season), and developed an automated silage maize detection framework using Sentinel-2 time series data [17]. This method leverages crop phenological rules to classify maize without requiring training data. Validated across four regions (Abyek, Marvdasht, Mashhad, and Tulare) in 2017, the framework achieved kappa coefficients of 0.89, 0.80, 0.90, and 0.80, respectively, with overall accuracies consistently exceeding 0.90, demonstrating robust generalizability for label-free crop mapping.
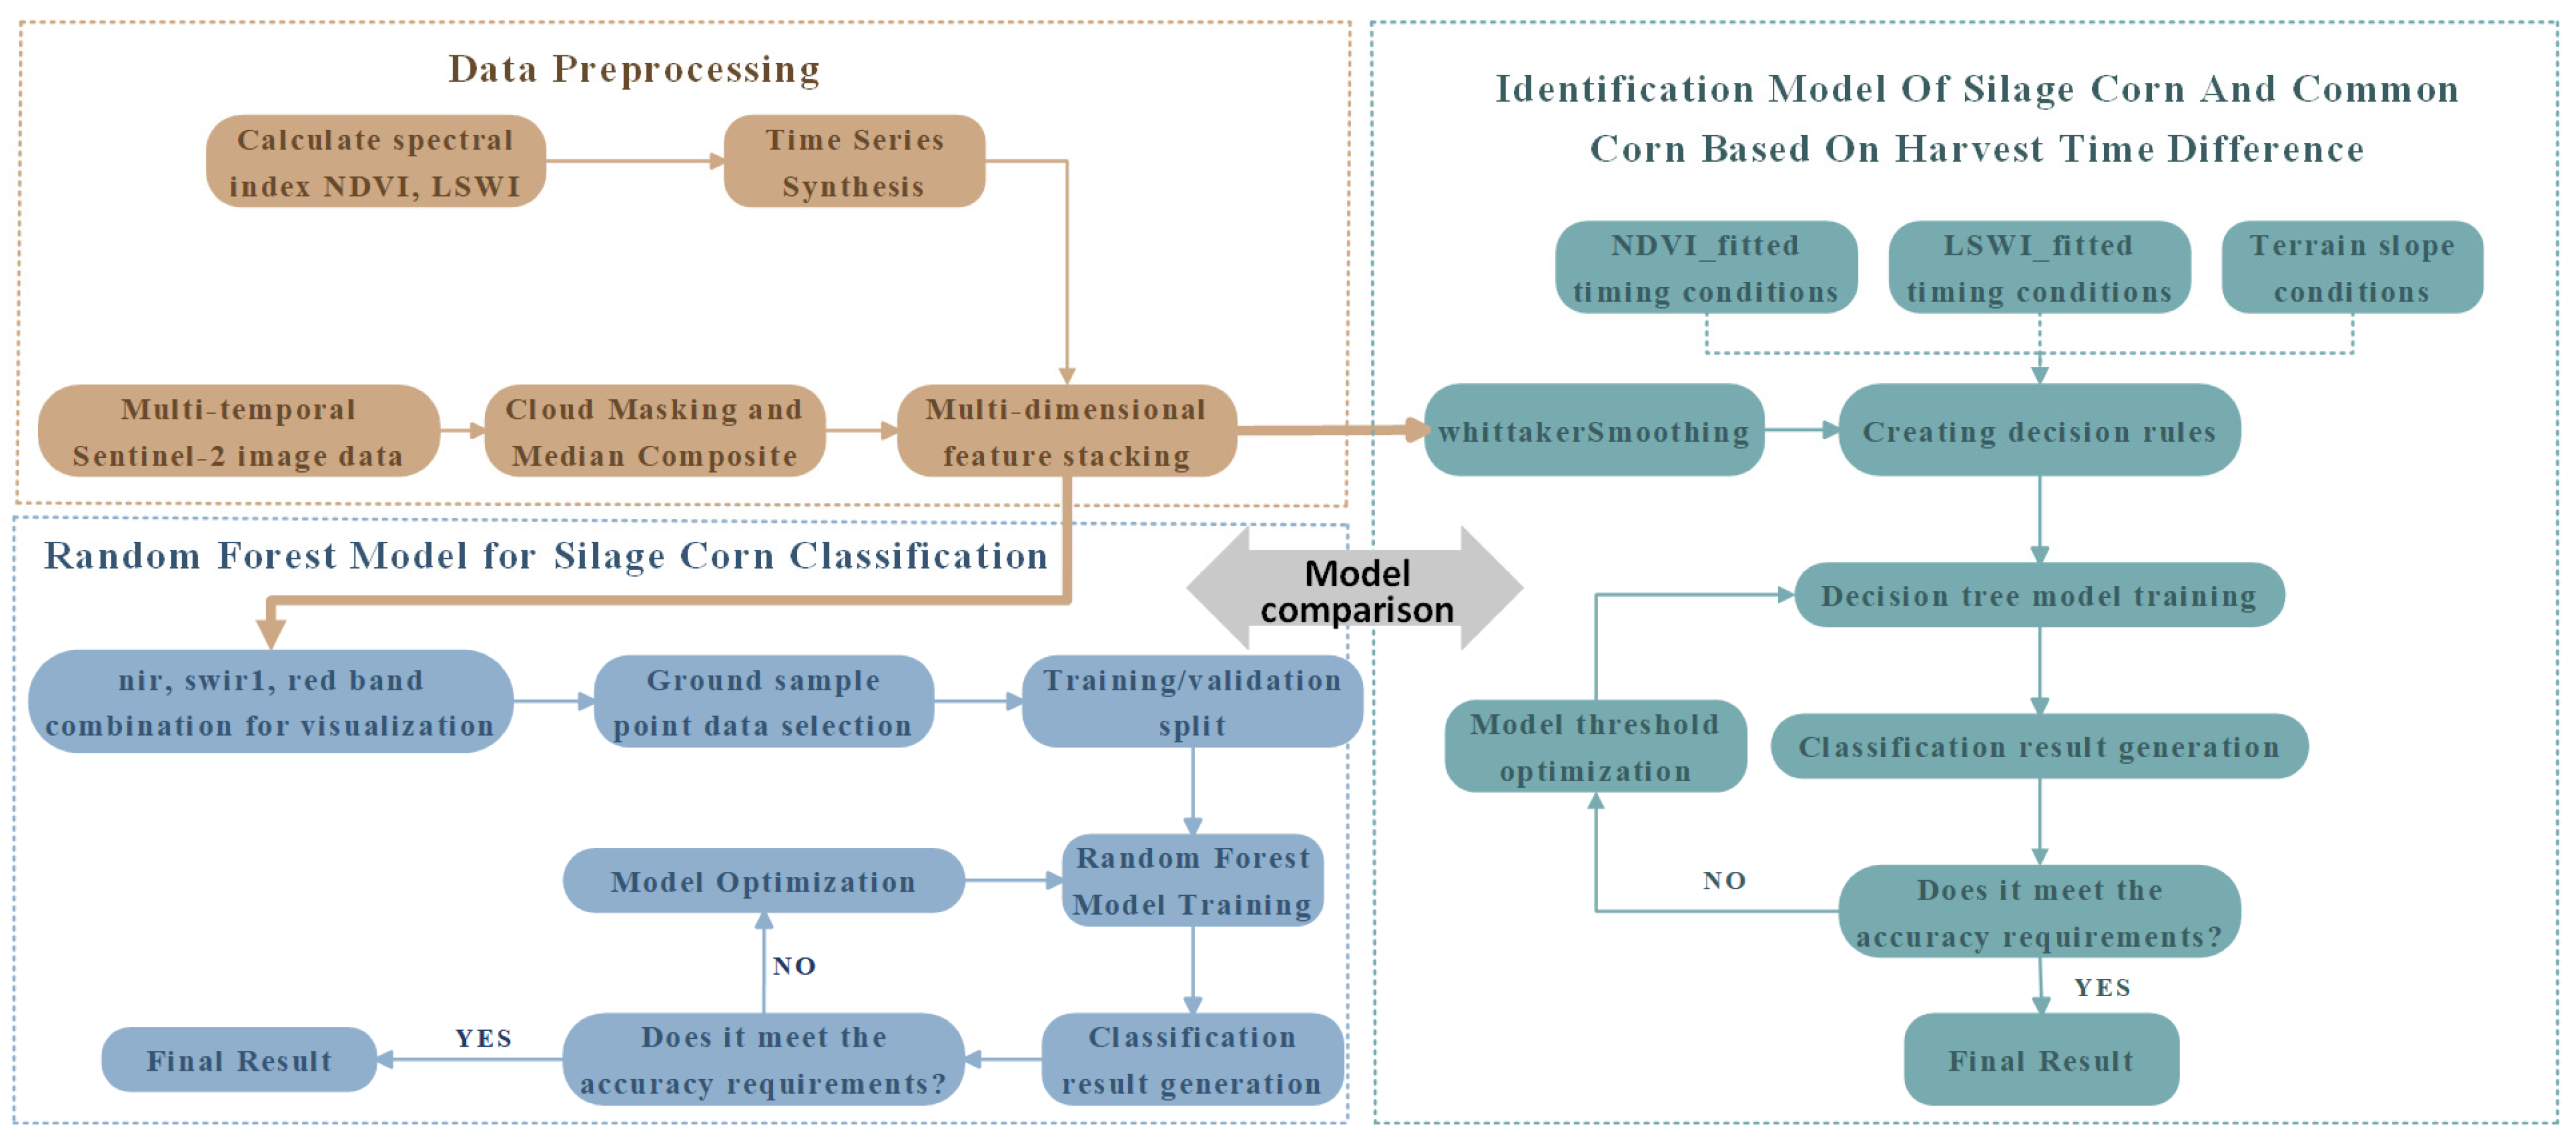
While existing studies have achieved substantial progress in multi-source remote sensing-based precise identification and acreage monitoring of maize, research focusing specifically on silage maize recognition and area quantification remains limited. To address this gap, this study leverages the GEE platform, utilizing preprocessed Sentinel-2 imagery from Hohhot City (2023) as the foundational dataset. Through the phenological analysis of silage maize and grain maize, we identified their critical harvest periods and applied the Whittaker smoothing filter to refine spectral–temporal profiles. This enabled the development of the Temporal Difference-based Silage Maize Identification Model (TempDiff-SMID), which exploits harvest timing disparities for classification. The TempDiff-SMID was rigorously benchmarked against the random forest-based Silage Maize Classification Model (SMRF), demonstrating superior accuracy. Furthermore, by optimizing temporal thresholds, the model exhibited robust cross-temporal applicability in multi-year silage maize mapping. This framework provides a scalable, interpretable solution for fine-scale differentiation and area monitoring of silage and grain maize, addressing critical needs in agricultural resource management.

2. Study Area and Data Sources

2.1. Study Area

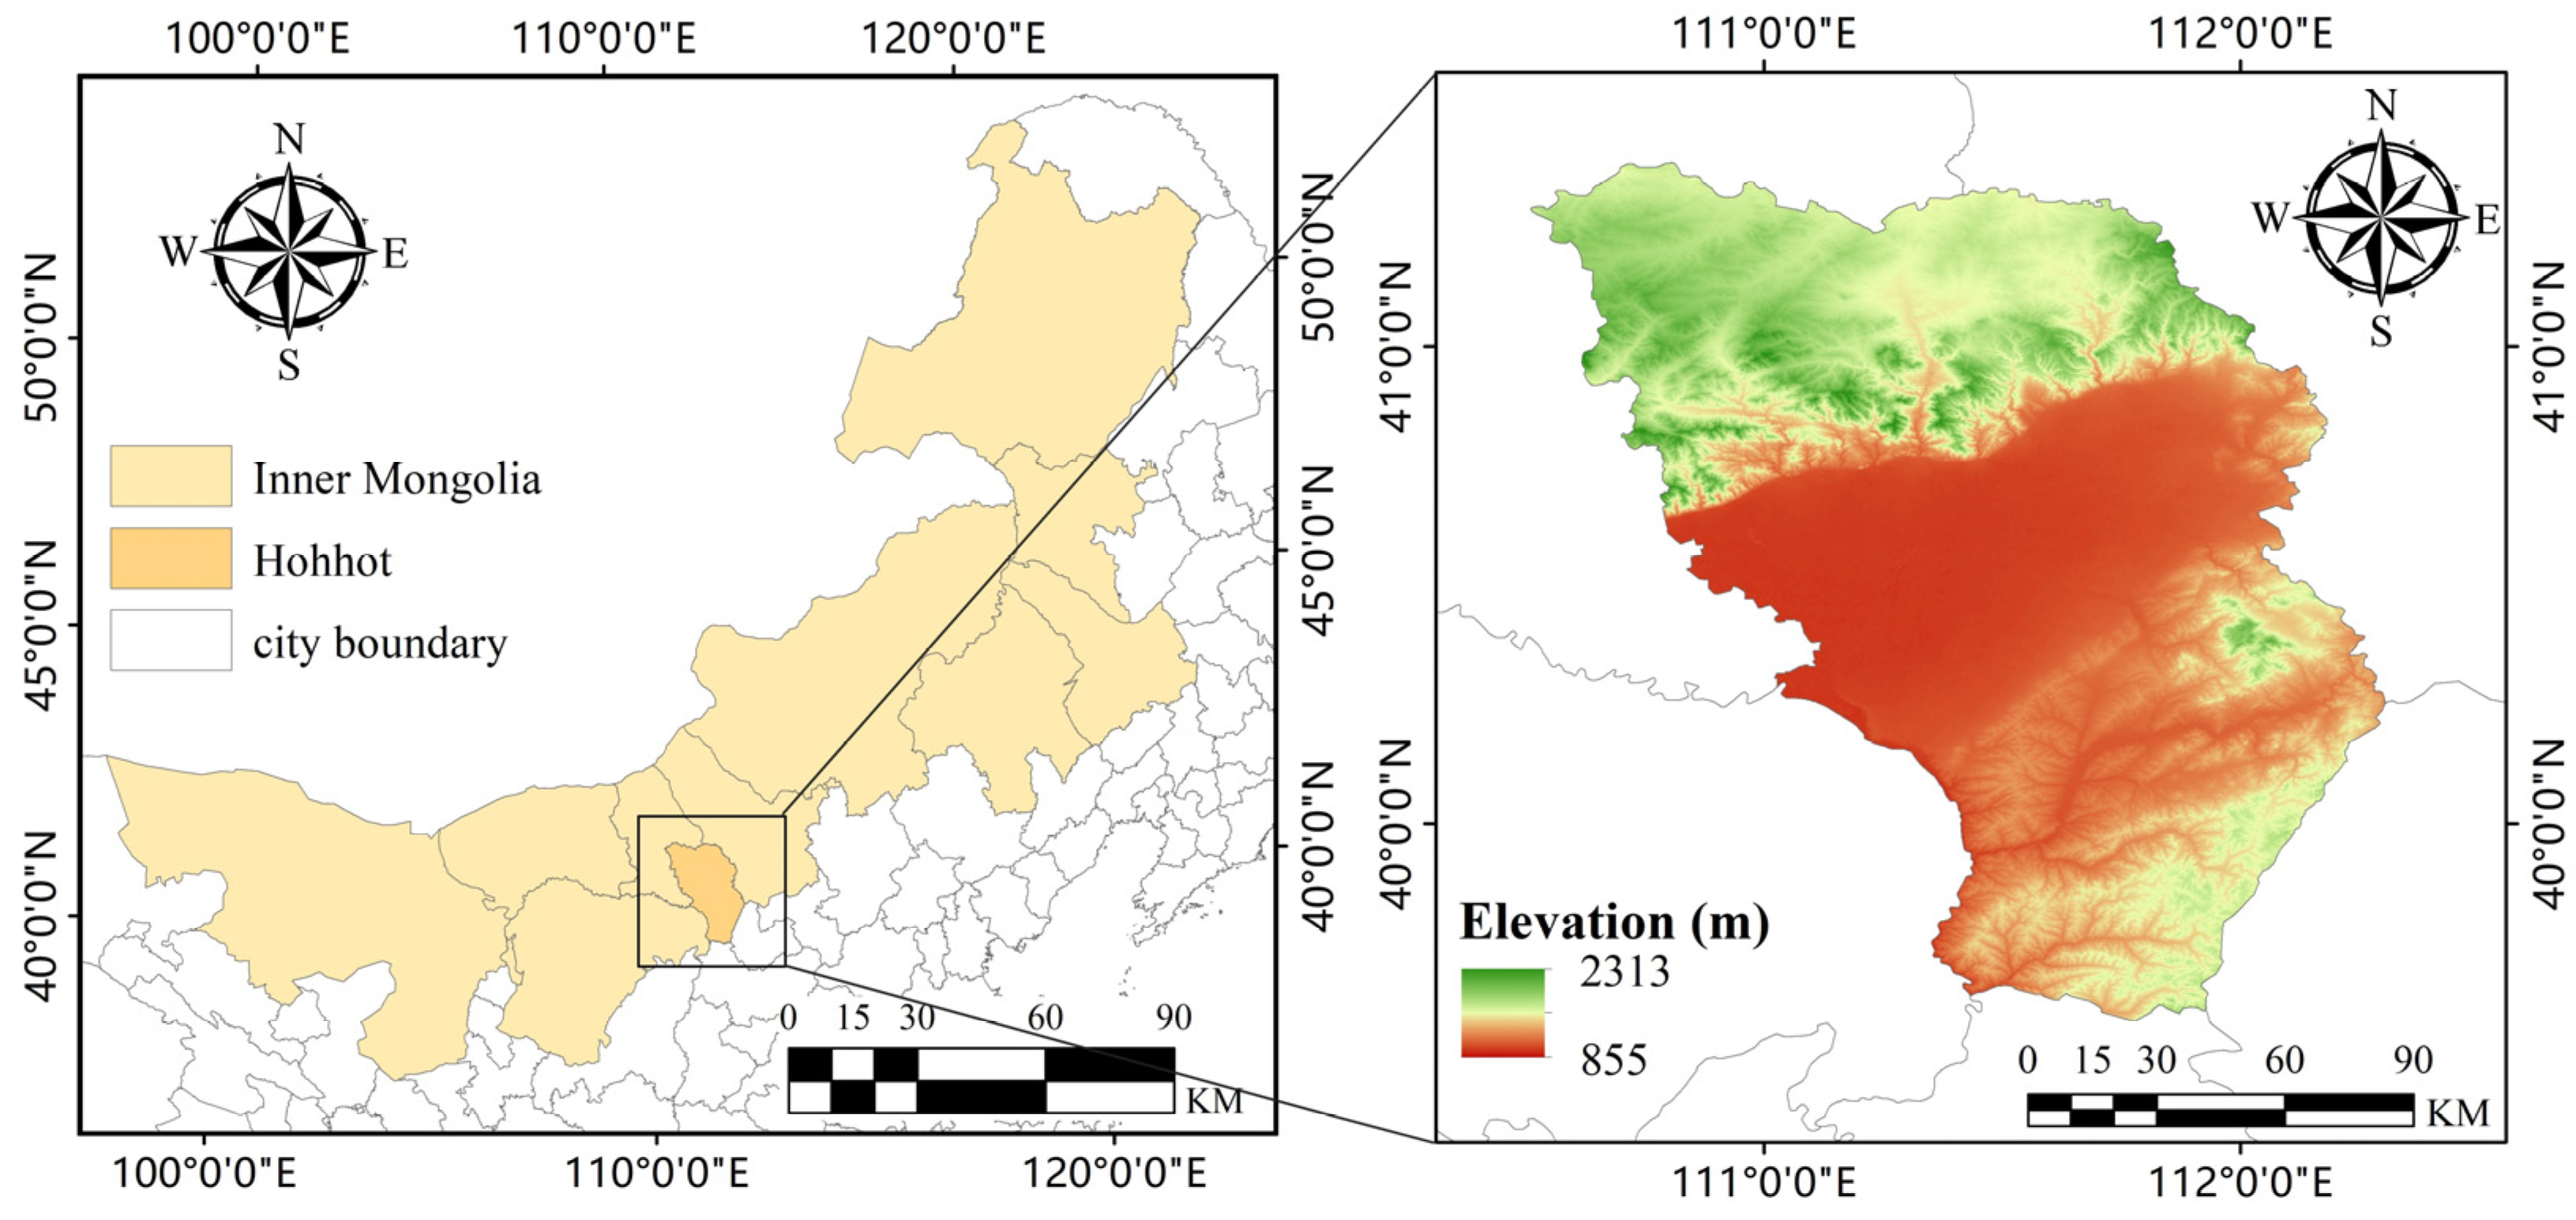
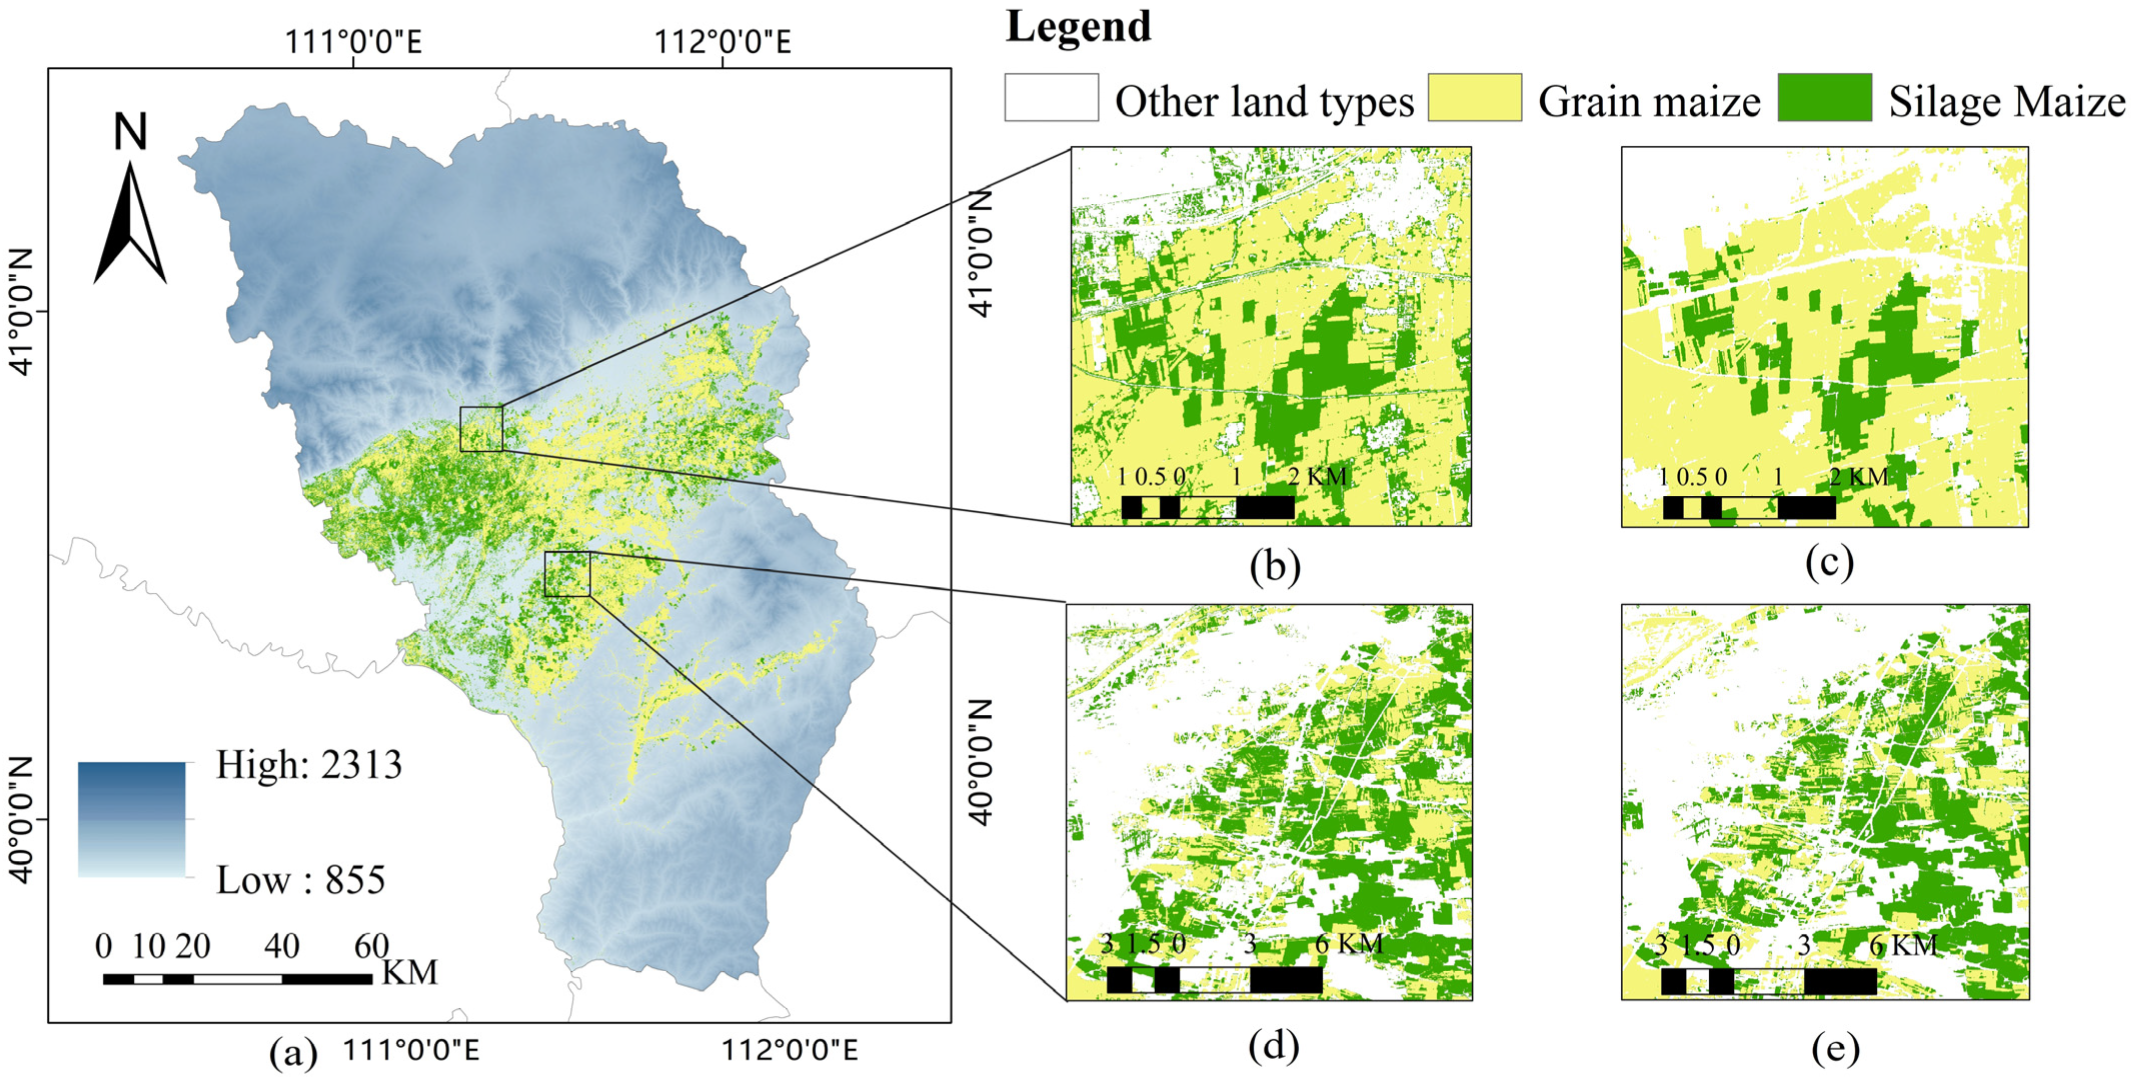
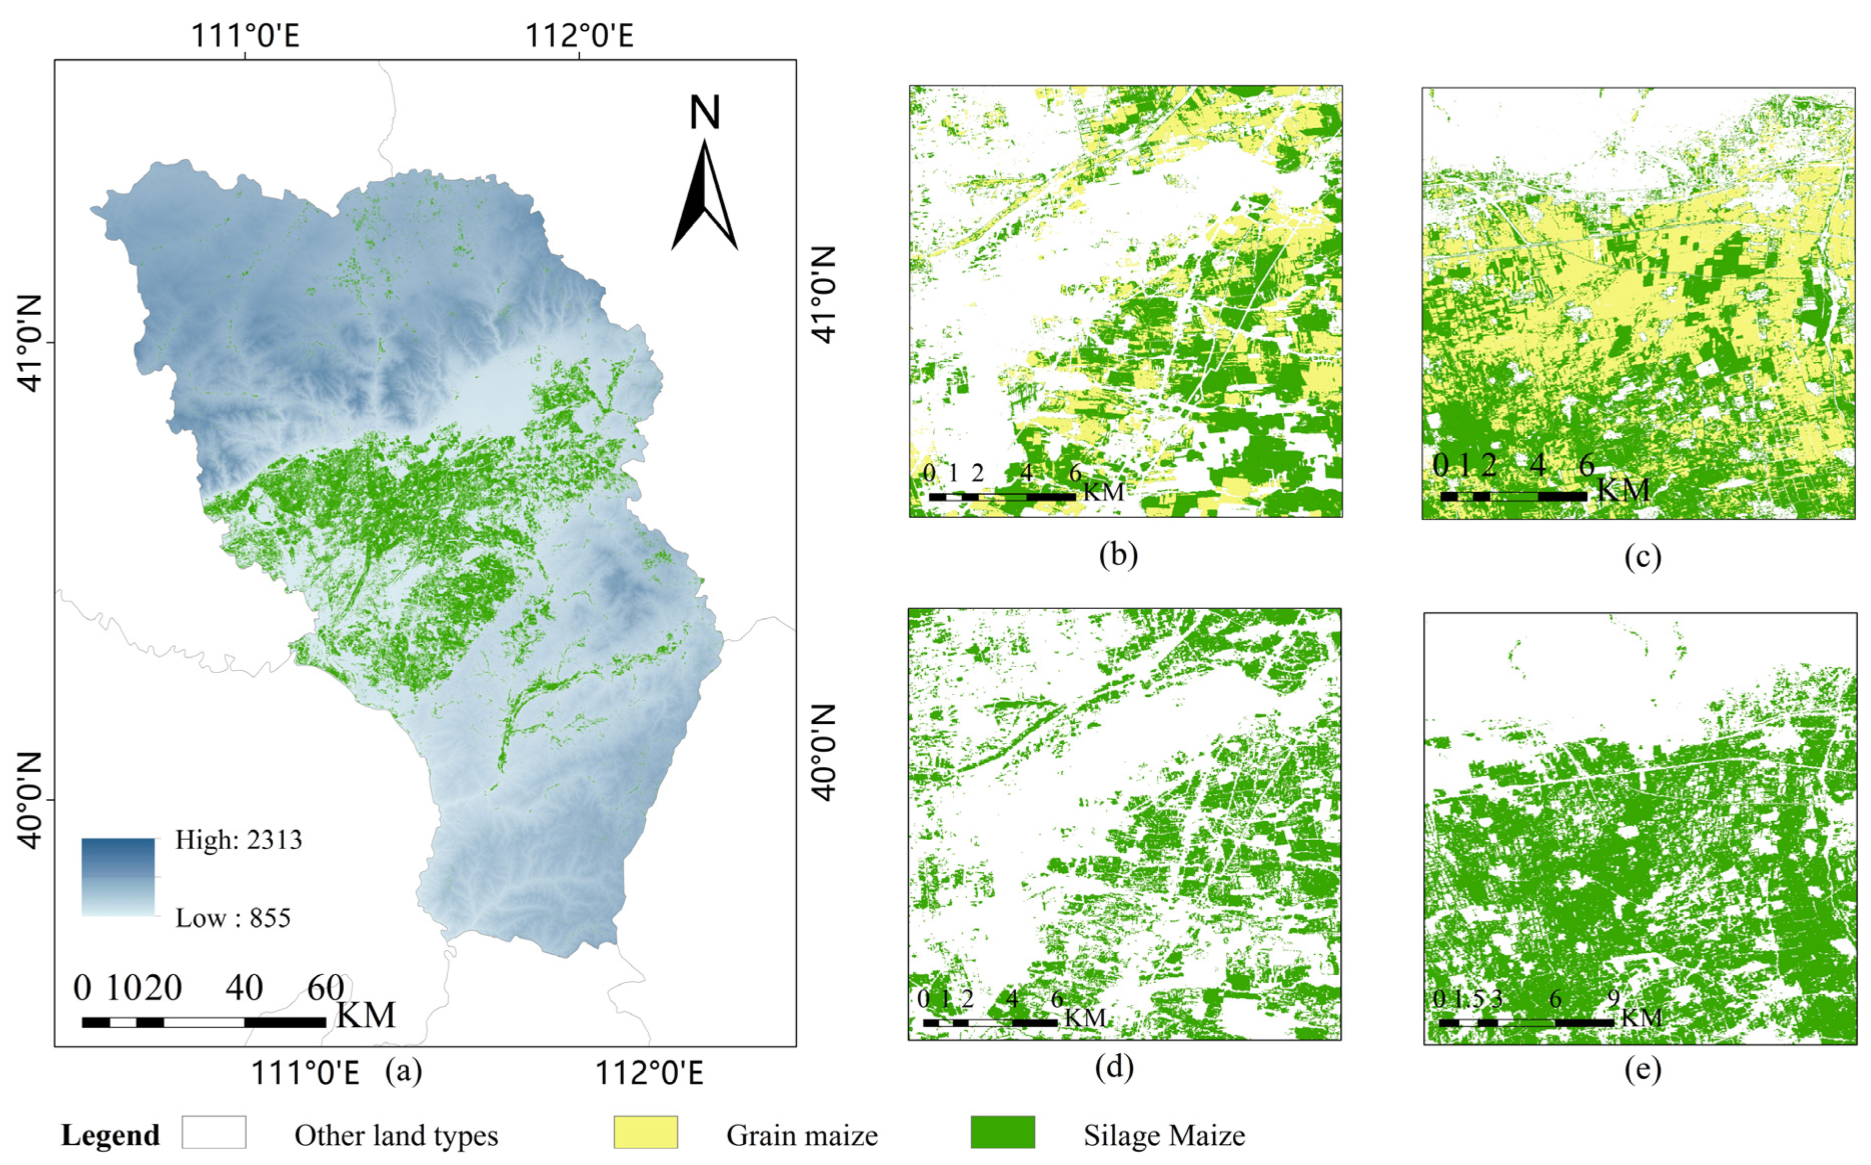
The study area encompasses Hohhot City, Inner Mongolia Autonomous Region, located between 40°51′–41°8′ N and 110°46′–112°10′ E, with a total area of 17,200 km2. Hohhot features a mid-temperate continental monsoon climate, characterized by synchronized rainfall and heat during the growing season, providing optimal thermal conditions for maize growth across all developmental stages.
Maize cultivation in Hohhot is concentrated in the Tumochuan Plain and the southern foothills of the Yin Mountains, which are regions endowed with abundant hydrothermal resources, sufficient sunlight, and fertile soils. According to 2024 statistical data, the total maize planting area in Hohhot reached 239,642 hectares, accounting for 0.711 of the city’s total grain-crop acreage. Other cereals account for only 39,000 hectares, and legumes cover just 16,700 hectares, indicating that Hohhot is predominantly a major production area for maize. Notably, the silage maize cultivation area has increased annually, reaching 81,733 hectares in 2024. The local cropping system follows a single annual harvest cycle, with maize typically sown from late April to early May and harvested between September and early October.
The spatial distribution of the study area is illustrated in Figure 1.

2.2. Data Sources

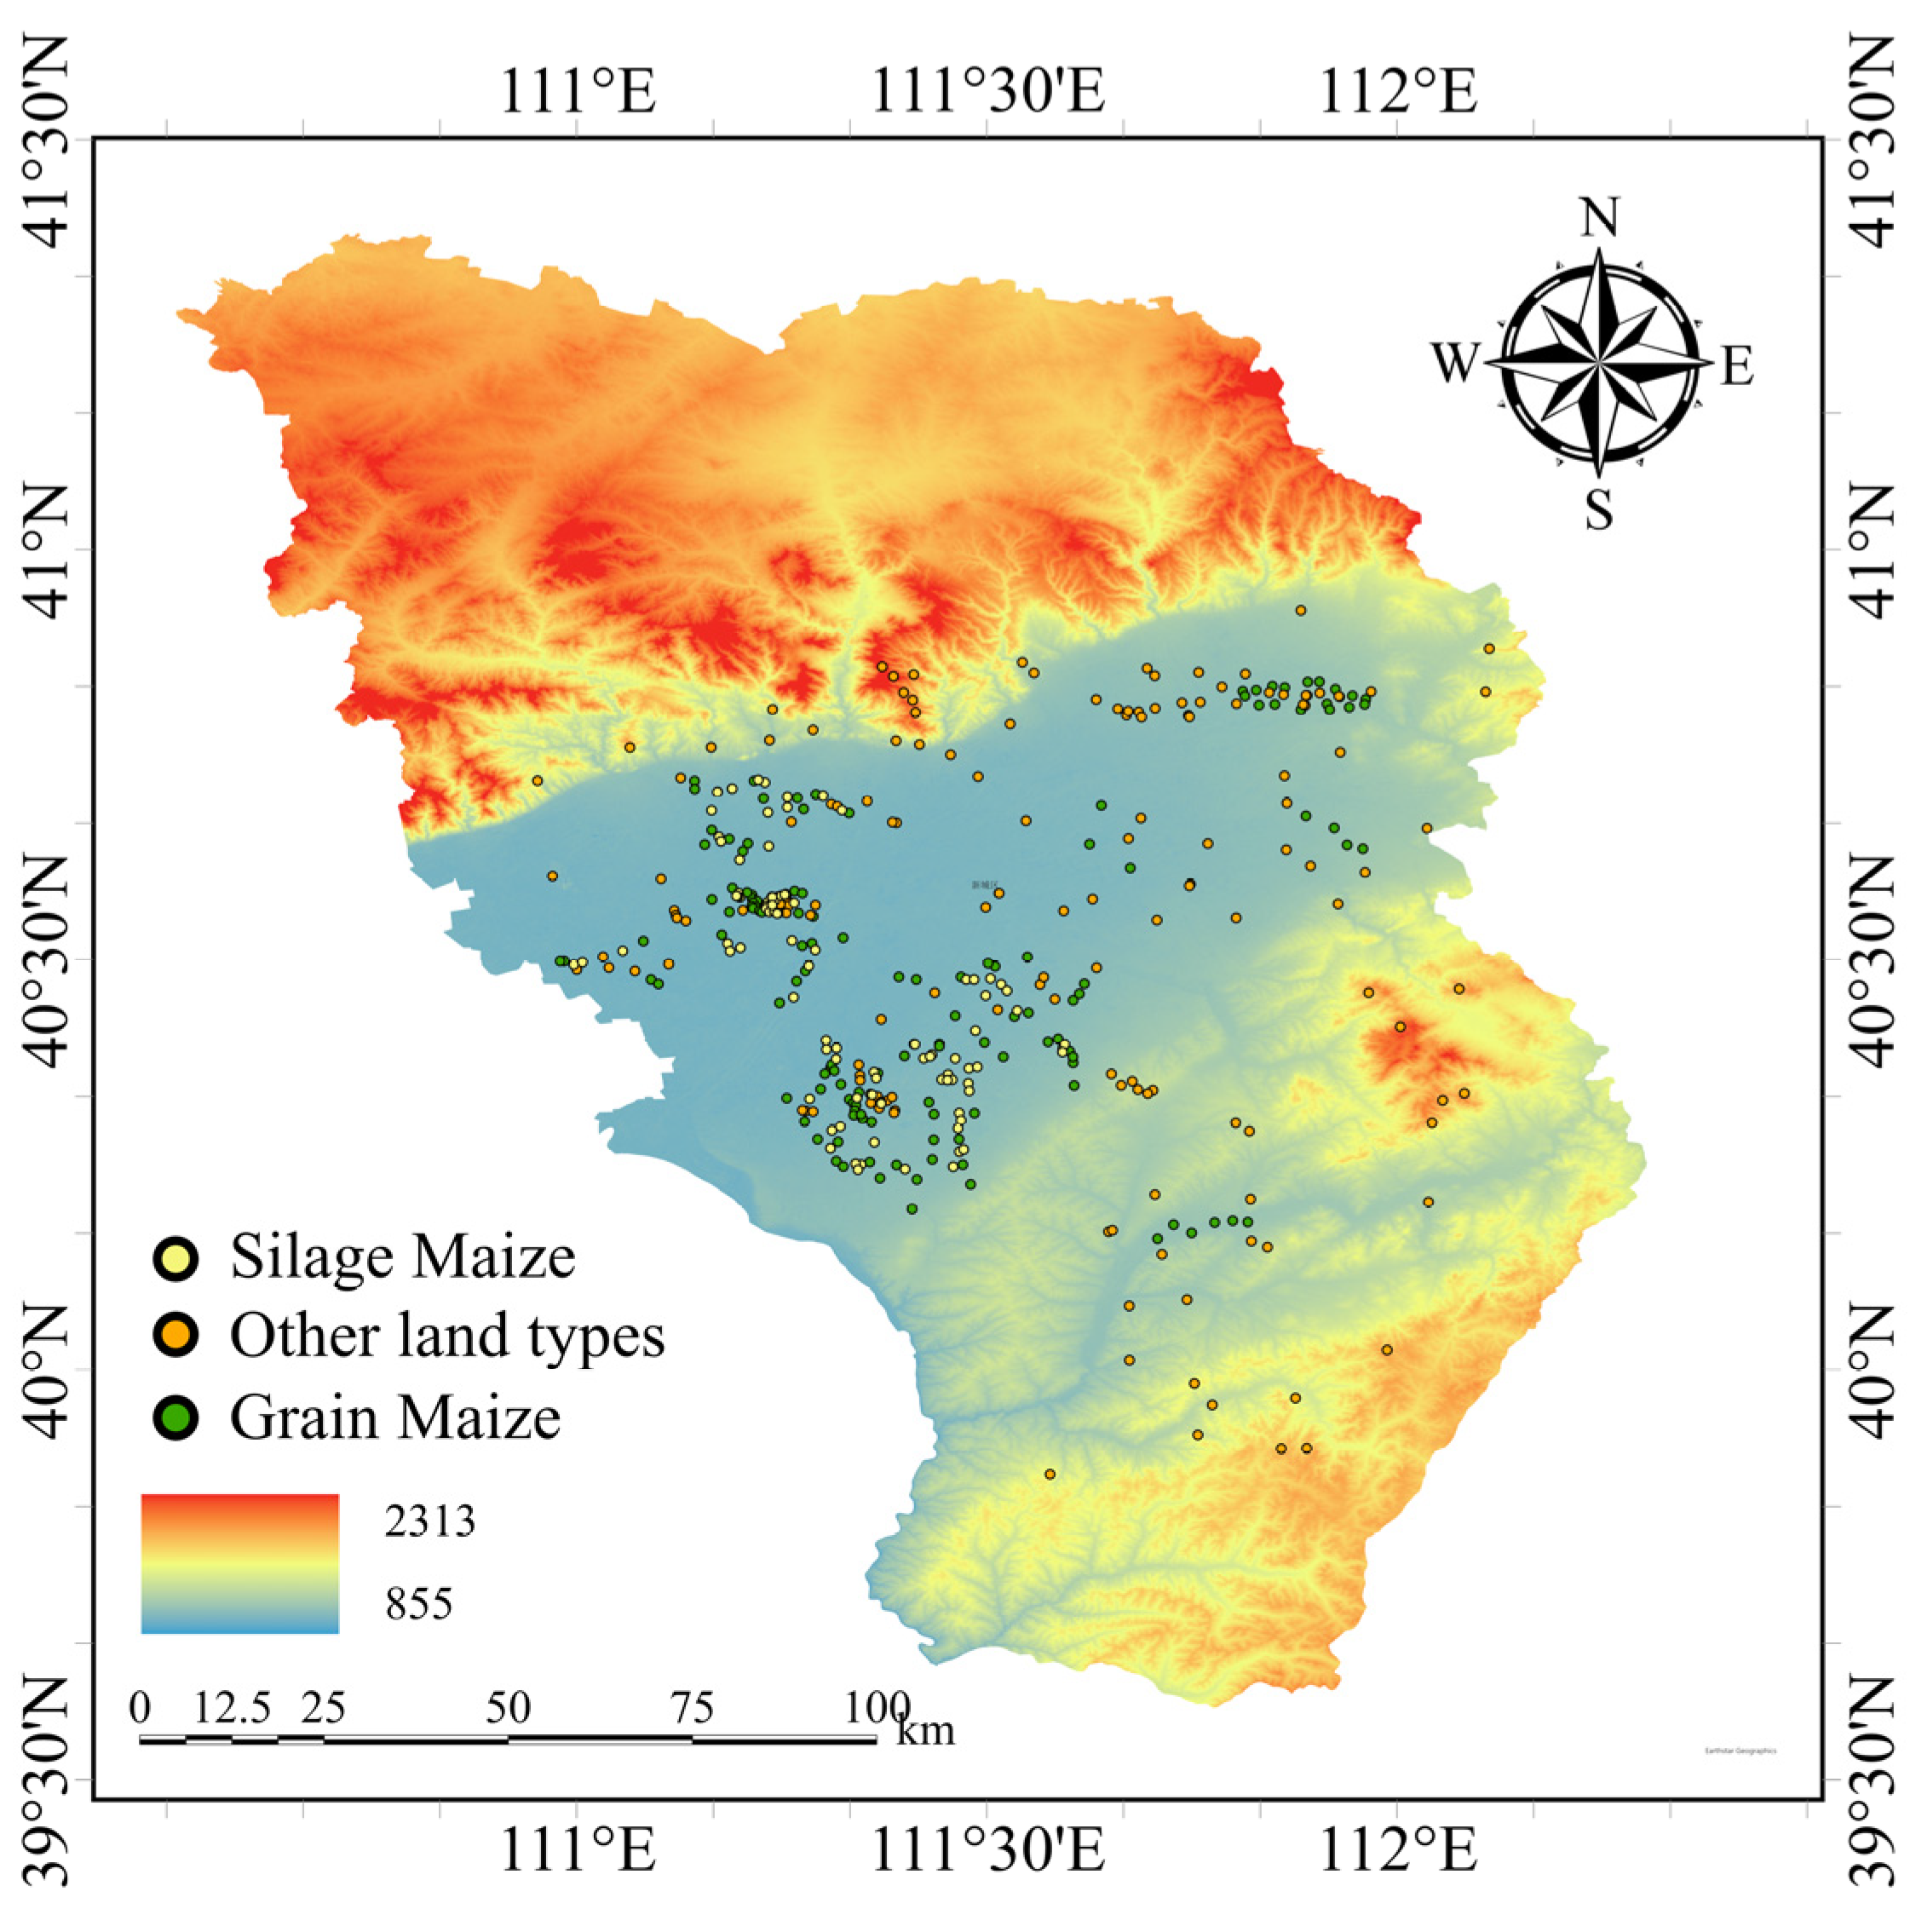
The research data include Sentinel-2 imagery, DEM data, statistical yearbook data, phenological data, and UAV data.
Sentinel-2 is an Earth observation satellite mission under the Copernicus Programme led by the European Space Agency (ESA). It carries 13 multispectral bands and focuses on high-resolution multispectral imaging for land, vegetation, and water monitoring. Its high spectral resolution enables the capture of richer spectral information, facilitating more accurate identification and classification of land cover types. Sentinel-2 data are widely used in agriculture, forestry, environmental monitoring, and disaster management [18]. The Sentinel-2 constellation comprises Sentinel-2A and Sentinel-2B, which together reduce the revisit cycle to five days. The COPERNICUS/S2-HARMONIZED dataset on the GEE platform is a preprocessed version of the raw data that incorporates geometric correction, radiometric calibration, cloud masking, band alignment, and temporal normalization.
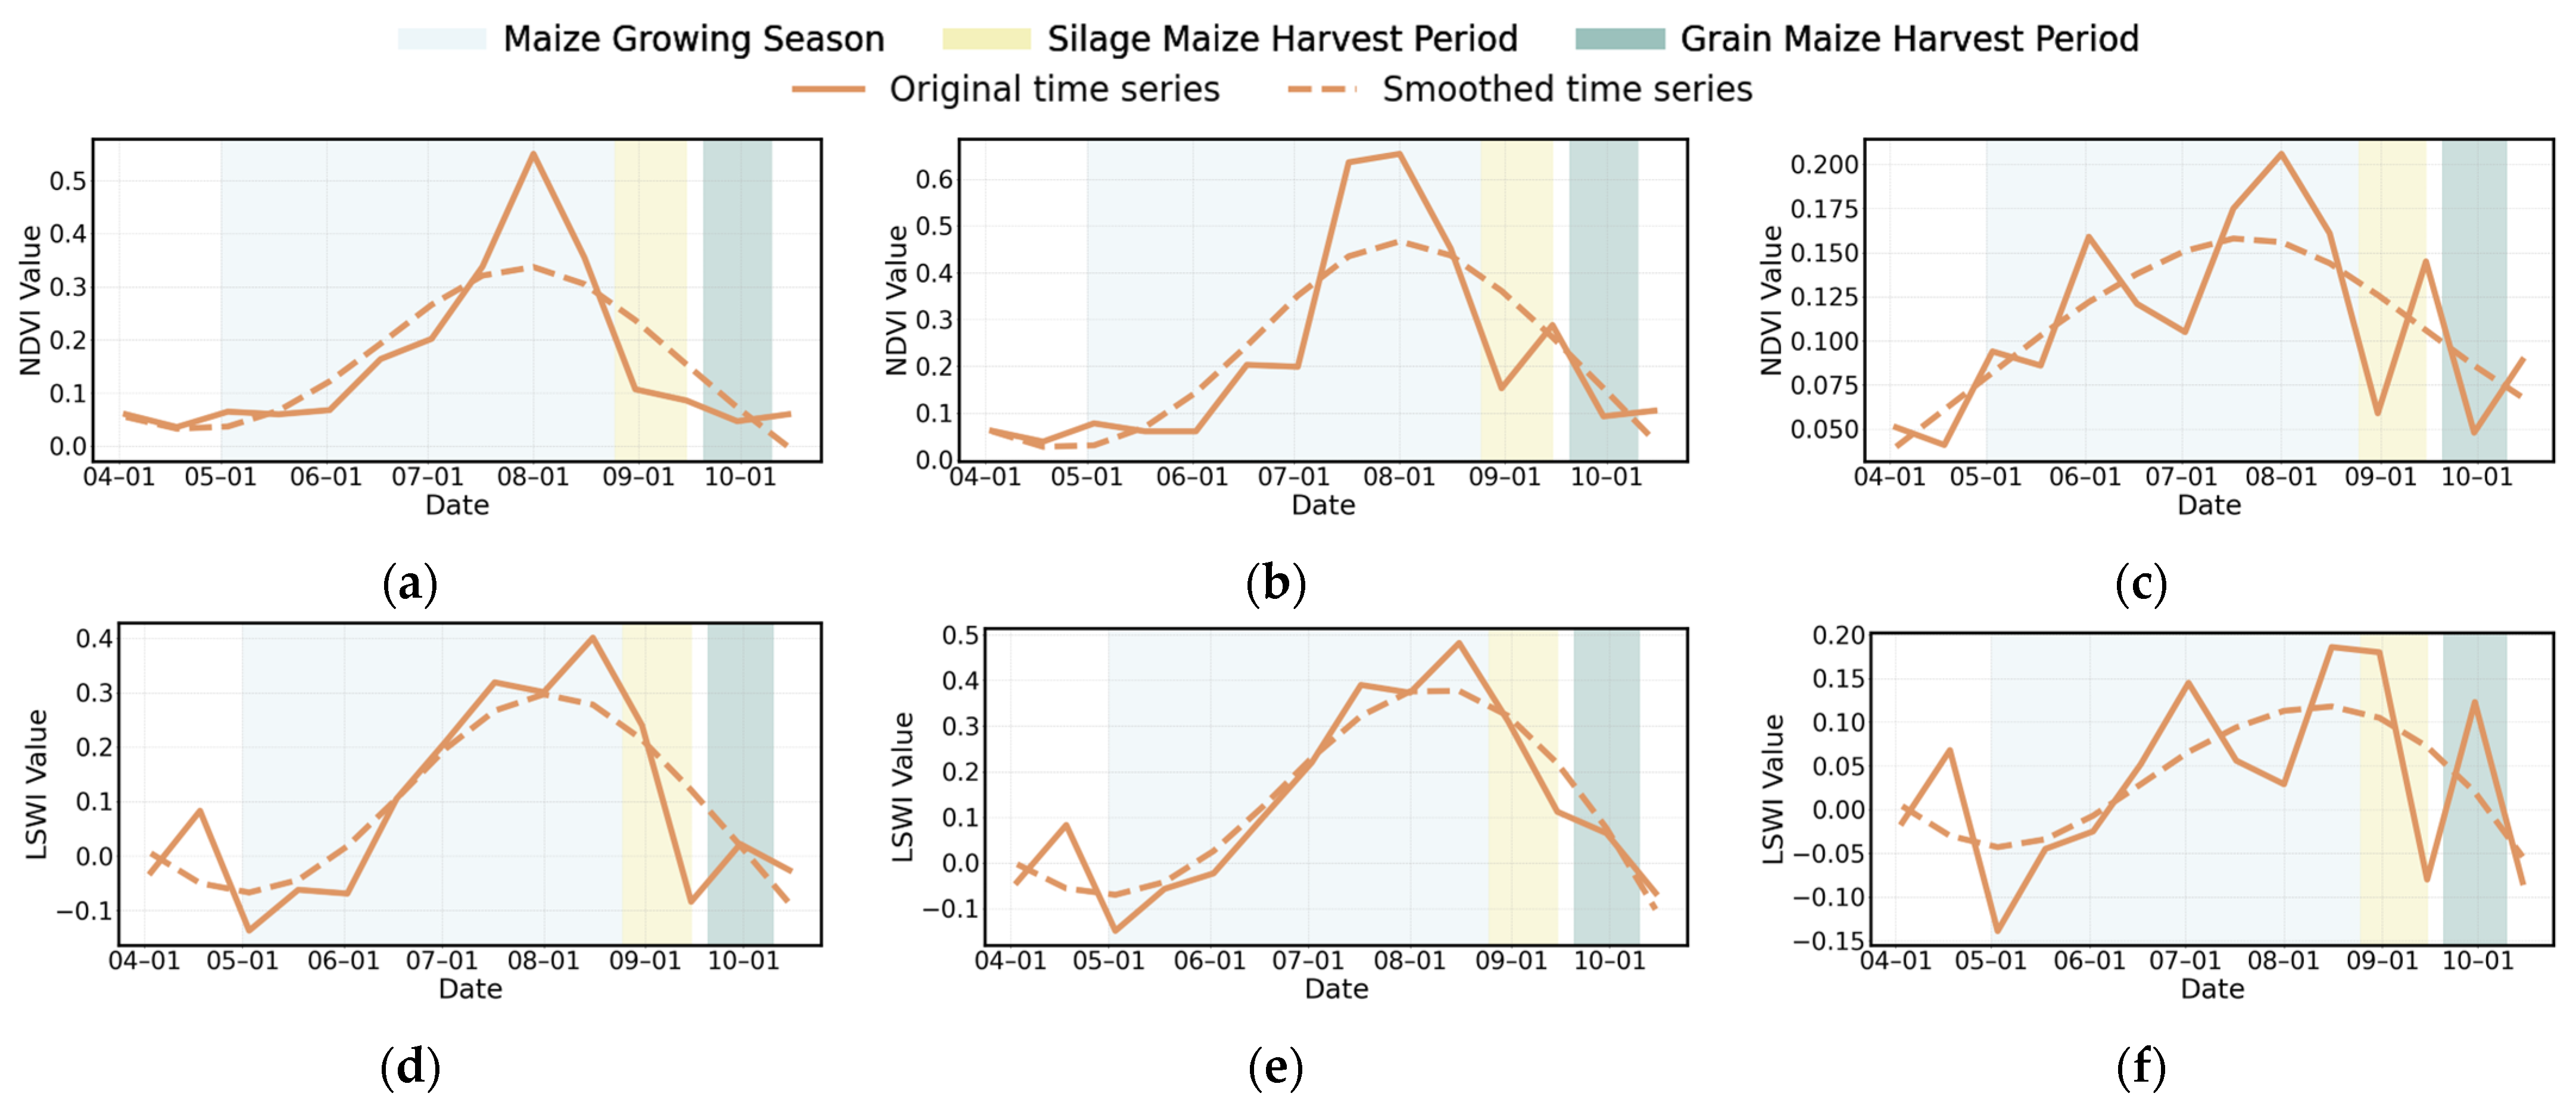
NDVI (Normalized Difference Vegetation Index), proposed by Rousea et al. in 1974, is based on the spectral reflectance characteristics of vegetation in the red (R) and near-infrared (NIR) bands. Vegetation exhibits strong absorption in the red band and high reflectance in the near-infrared band. NDVI leverages this distinct spectral behavior to quantify vegetation coverage and health status [19,20], as follows:
N D V I = ρ N I R ρ r e d ρ N I R + ρ r e d
In the equation, ρ N I R denotes the reflectance in the NIR band, and ρ S W I R denotes the reflectance in the R band.
LSWI (Land Surface Water Index), developed based on the spectral reflectance characteristics of vegetation in the shortwave infrared (SWIR) and near-infrared (NIR) bands, leverages this distinct spectral behavior to assess surface moisture conditions. Vegetation and water bodies exhibit lower reflectance in the SWIR band and higher reflectance in the NIR band. By quantifying this contrast, LSWI effectively captures variations in land surface water content, including vegetation canopy moisture and soil wetness [21], shown as follows:
L S W I = ρ N I R ρ S W I R ρ N I R + ρ S W I R
In the equation, ρ N I R denotes the reflectance in the NIR band, and ρ S W I R denotes the reflectance in the SWIR band.
A Digital Elevation Model (DEM) is a digital representation of terrain elevation that provides explicit spatial information on topographic relief, slope gradient, and aspect. DEM data are typically stored in raster format with spatial resolutions ranging from 30 m to sub-meter precision, supporting multi-scale research and applications [22]. Hohhot City is situated on the Inner Mongolia Plateau, which is characterized by a terrain dominated by plains and low hills, with generally gentle slopes but localized undulations. The northern region transitions into the Daqing Mountains, while the southern area comprises the Tumochuan Plain, creating significant topographic contrasts. The spatial distribution and elevation characteristics of the DEM data are illustrated in Figure 1.
The statistical data were sourced from the Hohhot Statistical Yearbook to quantify and validate the planting areas of grain maize and silage maize in Hohhot. In 2024, the total maize cultivation area in Hohhot reached 3.8159 million mu (about 254,393 hectares), with silage maize accounting for 1.226 million mu (about 81,733 hectares).
Phenological data play a critical role in agricultural planning, ecological studies, and climate change analysis. In Hohhot, silage maize is typically sown in early May, with a growth cycle of approximately 116 days, progressing through the following key developmental stages: emergence, jointing, tasseling, milking stage, and dough stage. The optimal harvest window for silage maize spans from the late milking stage to the early dough stage (mid-August to early September), when grains are not fully matured but the stalks and kernels exhibit peak nutritional value. Grain maize shares a similar sowing period (early May) but has a longer growth cycle of 120–130 days. Its harvest occurs during the full maturity stage, when grains are completely ripened, typically from late September to early October.

3. Research Methods

This study employed a three-phase approach: First, Sentinel-2 imagery was acquired on the Google Earth Engine (GEE) platform, followed by phenology-guided sampling to collect training data for silage maize, grain maize, and other land cover classes based on their distinct harvest timing. These samples were used to train the SMRF [23,24]. Second, time series NDVI and LSWI were computed alongside topographic features, smoothed using the Whittaker filter to enhance phenological signals, and analyzed to derive spectral index thresholds during key harvest stages. These thresholds, combined with topographic data, were integrated into the TempDiff-SMID [25,26,27]. Finally, both models (SMRF and TempDiff-SMID) were evaluated and compared using overall accuracy, Kappa coefficient, user’s/producer’s accuracies, and F1-scores [28], with the workflow illustrated in Figure 2.

3.1. Construction of SMRF Model

3.1.1. Sample Point Selection

Phenological analysis revealed a harvest timing disparity between silage maize and grain maize. Silage maize is optimally harvested during the late milking stage to early dough stage, whereas grain maize is harvested at full maturity, resulting in a 5–15 day difference in harvest windows. By leveraging Sentinel-2 imagery, we determined that silage maize in Hohhot City was fully harvested by 10 September 2023, a timeframe validated through spectral–temporal profiles and regional agronomic records. This temporal divergence underpins the TempDiff-SMID model’s ability to differentiate crop types based on harvest-driven spectral trajectories.
Sentinel-2 imagery was acquired and processed on the Google Earth Engine (GEE) platform, including cloud detection, cloud masking, and multi-temporal median compositing to minimize atmospheric interference. The display range of composite images was dynamically adjusted using the second and 98th percentiles for enhanced contrast, and they were visualized via NIR-SWIR1-Red band combinations to highlight vegetation and moisture gradients.
Training samples for silage maize, grain maize, and other land cover classes were collected through field surveys and visual interpretation. Collaborative efforts with Hohhot agro-meteorological stations provided georeferenced points and phenological records, which guided sample selection for silage and grain maize. Additional samples were identified by analyzing spectral differences in false-color composites and temporal Sentinel-2 imagery, ensuring the representative coverage of crop types and non-crop features.
Table 1 summarizes the image interpretation characteristics of land cover types in Hohhot City, including details of false-color composites across phenological stages, spectral curves, textural features, spatial distribution, and geometric shapes.
Silage maize is primarily distributed in Togtoh County and Tumd Left Banner, exhibiting smooth texture and regular linear strips. In false-color composites (NIR-SWIR1-Red), fields appear red prior to the August 2023 harvest period and transition to light green post-harvest (September 2023).
Grain maize is concentrated in Wuchuan County and Tumd Left Banner, with similar smooth texture and linear patterns. False-color composites show red tones before the September 2023 harvest and light green after harvest (October 2023).
Water bodies are dominated by the Yellow River tributaries (e.g., Heihe River) and lakes (e.g., Hasuhai), are characterized by a smooth texture and natural sinuous ribbons/sheets, and are dark blue in false-color composites.
Urban areas are distributed along transportation corridors as point-axis clusters, displaying rough texture, geometric polygons, and mottled dark blue tones.
Forests are widespread in mountainous regions, with coarse texture, irregular patches, and orange hues in false-color composites.
A total of 100 silage maize, 131 grain maize, and 150 non-maize samples were selected based on these criteria, ensuring representative coverage for phenological analysis and accuracy validation. The specific sample point distribution is shown in Figure 3.

3.1.2. Random Forest Algorithm

Random forest (RF), proposed by Breiman in 2001, is an ensemble learning algorithm that enhances generalization capability and robustness by constructing multiple decision trees and aggregating their predictions. The algorithm introduces dual randomization to mitigate overfitting risks inherent in individual trees; bootstrap sampling randomly selects subsets of training data for each tree, while feature subspace selection randomly chooses a fraction of features at each node split. By combining these mechanisms, RF decorrelates individual trees and reduces variance. For classification tasks (e.g., silage maize identification), predictions are determined through majority voting; for regression, outputs are averaged. This framework excels in handling high-dimensional, noisy datasets while maintaining interpretability via feature importance metrics [29].
This study developed a random forest-based Silage Maize Classification Model (SMRF) on the GEE platform to distinguish silage maize, grain maize, and other land cover types. By leveraging multi-temporal Sentinel-2 data and a training sample dataset, the model integrates spectral, temporal, and spatial features to achieve high-precision classification. The SMRF outputs serve as a benchmark to evaluate the performance of the decision tree-based Temporal Difference Silage Maize Identification Model (TempDiff-SMID), enabling the comparative analysis of classification accuracy, generalizability, and interpretability.
To capture maize phenological dynamics, the 2023 growing season was partitioned into five consecutive phases (10 June–10 July, 10 July–10 August, 10 August–10 September, 10 September–10 October, 10 October–10 November), encompassing critical growth stages such as sowing, heading, grain filling, and maturity. For each phase, Sentinel-2 L1C data underwent median compositing and cloud-masking optimization, generating a stacked multi-temporal image with 65 spectral features (13 bands × 5 phases).
A stratified random sampling approach divided the high-resolution image-derived sample dataset into 70% training and 30% validation sets, preserving class balance. The RF classifier was trained using spectral features as inputs and class labels (silage maize, grain maize, other land cover) as outputs. The trained model was then applied to the multi-temporal imagery, producing a three-class classification map for the study area.

3.2. Construction of TempDiff-SMID Model

3.2.1. Whittaker Smoothing Filter

The temporal dynamics of vegetation indices reflect maize growth stage transitions, typically exhibiting continuous and smooth trajectories. While the COPERNICUS/S2_HARMONIZED dataset on GEE provides preprocessed Sentinel-2 imagery, residual noise and data gaps persist due to atmospheric variability and sensor limitations. To address this, we applied the Whittaker smoothing filter to reconstruct 15-day interval NDVI and LSWI time series at a 10 m spatial resolution.
Proposed by Whittaker in 1922, this filter employs a penalized least squares principle to balance data fidelity and curve smoothness, effectively suppressing high-frequency noise while preserving phenological trends. Mathematically, it minimizes a cost function that combines residuals between observed and fitted values (data fidelity term) and a roughness penalty (smoothness term). The method is widely adopted in remote sensing for its robustness in handling irregularly sampled or noisy time series data [30,31,32,33].
The algorithm was implemented on the GEE platform to adaptively smooth Sentinel-2-derived NDVI and LSWI time series, particularly addressing noise caused by cloud contamination and sensor errors. Figure 4 illustrates the original and smoothed NDVI (NDVI_fitted) and LSWI (LSWI_fitted) time series curves for representative samples of silage maize, grain maize, and other land cover classes. The results demonstrate that Whittaker smoothing effectively reduces high-frequency noise while retaining the phenological trends of vegetation index dynamics, critical for distinguishing crop-specific growth stages.

3.2.2. Importance Analysis of Vegetation Index Characteristics

To evaluate the classification efficacy of multi-source vegetation indices, this study conducted a feature importance analysis using the Gini impurity reduction method, which quantifies each feature’s contribution to node splitting in the RF decision trees. This metric reflects how frequently and effectively a feature partitions data classes, with higher values indicating greater discriminative power for crop type classification.
The experimental results (Figure 5) revealed that the LSWI exhibited the highest feature importance, significantly outperforming other vegetation indices. This dominance is closely linked to LSWI’s sensitivity to canopy moisture content in the SWIR band. The NDVI ranked second in importance, validating its classical role in capturing vegetation coverage and chlorophyll dynamics. The observed importance gradient (LSWI > NDVI > RENDVI > EVI) highlights the key biophysical drivers of maize cultivation systems in the study area and confirms the appropriateness of integrating LSWI and NDVI as decision thresholds in the TempDiff-SMID. These findings underscore the synergistic value of moisture-sensitive (LSWI) and biomass-sensitive (NDVI) indices for phenology-driven crop discrimination.

3.2.3. Knowledge Decision Tree Model

To differentiate silage maize, grain maize, and other land cover classes, this study developed the TempDiff-SMID model on the GEE platform. The model integrates Whittaker-smoothed Sentinel-2 imagery (1 April–31 October 2023) and elevation, focusing on 15-day interval NDVI and LSWI composites to capture spectral dynamics during critical growth phases.
The classification logic follows a three-level structure (Table 2). First, condition 1 identifies potential corn-growing areas in the Tumochuan Plain by combining lower May NDVI (NDVI5)—indicating sparse vegetation after planting—with higher July NDVI (NDVI7) to confirm crop growth, while using elevation data to exclude non-corn-growing areas at high altitudes. Then, condition 2 distinguishes corn fields from drought-adapted vegetation by leveraging aged July LSWI (LSWI7), which reflects high canopy moisture at the heading stage. Finally, condition 3 distinguishes silage maize from regular corn using September LSWI (LSWI9), where the post-harvest moisture decline (bare soil after silage maize harvest) contrasts with the persistent moisture of regular corn.
The classification criteria (Table 3) define silage maize as pixels satisfying all three conditions, grain maize as those failing condition 3, and non-maize classes as pixels excluded by condition 1 or condition 2. This sequential approach aligns with phenological and spectral signatures, enabling the robust discrimination of crop types in heterogeneous landscapes.

3.3. Accuracy Verification

The classification accuracy was rigorously validated using a confusion matrix, assessed through the following five established metrics: Overall Accuracy (OA), Kappa Coefficient, User’s Accuracy (UA), Producer’s Accuracy (PA), and F1-Score. The Overall Accuracy, calculated as the ratio of correctly classified samples to the total sample size, provides a global measure of classification performance. To account for chance agreement inherent in imbalanced datasets, the Kappa Coefficient quantifies the consistency between classification results and ground truth, adjusted by the hypothetical probability of random agreement. User’s Accuracy reflects classification precision for a specific class, defined as the proportion of correctly classified samples within all predictions assigned to that class. Conversely, Producer’s Accuracy evaluates recall, representing the fraction of correctly identified samples relative to the true instances of a class. To harmonize precision and recall, the F1-Score serves as a balanced metric for class-specific performance.
For an n × n confusion matrix, where n denotes the number of classes, each element C i j corresponds to the count of samples with a true label of i predicted as class j. These metrics collectively ensure a comprehensive evaluation of classification robustness, minimizing biases from class imbalances or random chance while highlighting strengths and limitations in discriminative capability. The equations used are shown as follows:
O A = i = 1 n C i i i = 1 n j = 1 n C i j
P e = j = 1 n C i j × j = 1 n C j i ( i = 1 n j = 1 n C i j ) 2
K = O A P e 1 P e
U A i = C i i j = 1 n C j i
P A i = C i i j = 1 n C i j
F 1 i = 2 × U A i × P A i U A i + P A i
where P e is the expected accuracy based on random classification.

4. Results and Analysis

4.1. Construction and Accuracy Verification of SMRF Model

Validation samples were systematically applied to assess the classification results of the SMRF, yielding the accuracy metrics summarized as follows.
Table 4 presents the classification accuracy metrics for silage maize, grain maize, and other land cover classes derived from the SMRF. The model achieved an OA of 0.9043 and a Kappa coefficient of 0.8511, indicating strong agreement between predicted and ground truth classes.
UA values for silage maize, grain maize, and non-maize classes were 0.9231, 0.8571, and 0.9697, respectively, reflecting high precision in class-specific predictions. Corresponding PA values reached 0.8571, 0.9796, and 0.8421, demonstrating minimal omission and commission errors across all categories. The F1-scores (0.8889 for silage maize, 0.9143 for grain maize, and 0.9115 for non-maize classes) further validate the model’s balanced performance in harmonizing precision and recall, confirming its robustness in distinguishing phenologically similar crop types under heterogeneous agricultural landscapes.

4.2. Construction and Accuracy Verification of TempDiff-SMID Model

Validation samples were systematically applied to assess the classification results of the TempDiff-SMID, yielding the accuracy metrics summarized as follows.
Table 5 summarizes the accuracy metrics of the TempDiff-SMID for 2023, evaluating silage maize, grain maize, and other land cover classes. The model achieved an OA of 0.9291 and a Kappa coefficient of 0.8923, indicating exceptional agreement between predicted and ground truth classifications.
UA values for silage maize, grain maize, and non-maize classes were 0.9216, 0.9219, and 0.9404, respectively, demonstrating high precision in class-specific predictions. Corresponding PA values reached 0.94, 0.9008, and 0.9467, highlighting minimal omission and commission errors. The F1-scores (0.9307 for silage maize, 0.9112 for grain maize, and 0.9435 for non-maize classes) further validate the model’s balanced performance in reconciling precision and recall, confirming its robustness in crop-type discrimination.
Figure 6a illustrates the 2023 silage maize distribution in Hohhot City derived from the TempDiff-SMID, revealing concentrated cultivation in Tumd Left Banner and Togtoh County. Comparative analyses of classification results between the TempDiff-SMID (Figure 6b,d) and the SMRF (Figure 6c,e) in Tumd Left Banner and Xinyingzi Town demonstrate that the classification results of the decision tree model can well distinguish silage maize while enhancing marginal segmentation. The results show that each decision rule and condition can well distinguish silage maize, grain maize, and non-maize classes and can realize the identification and monitoring of silage maize.

4.3. Construction and Accuracy Verification of TempDiff-SMID in 2022 and 2021

The TempDiff-SMID, originally developed for 2023, was extended to 2022 and 2021 by adaptively adjusting decision thresholds to accommodate interannual variations in silage maize phenology. The optimized models achieved overall accuracies of 0.8621 in 2022 and 0.8816 in 2021, with Kappa coefficients of 0.7905 and 0.8192, respectively, as detailed in Table 6 and visualized in Figure 7.
These results underscore the model’s temporal generalizability, enabled by its phenology-driven threshold adaptation mechanism, which maintains robust performance despite shifts in growing season timing. By providing reliable multi-year classification outputs (2019–2023), the TempDiff-SMID framework establishes a scalable foundation for long-term silage maize monitoring, supporting precision agriculture and policy-driven crop management.

5. Discussion

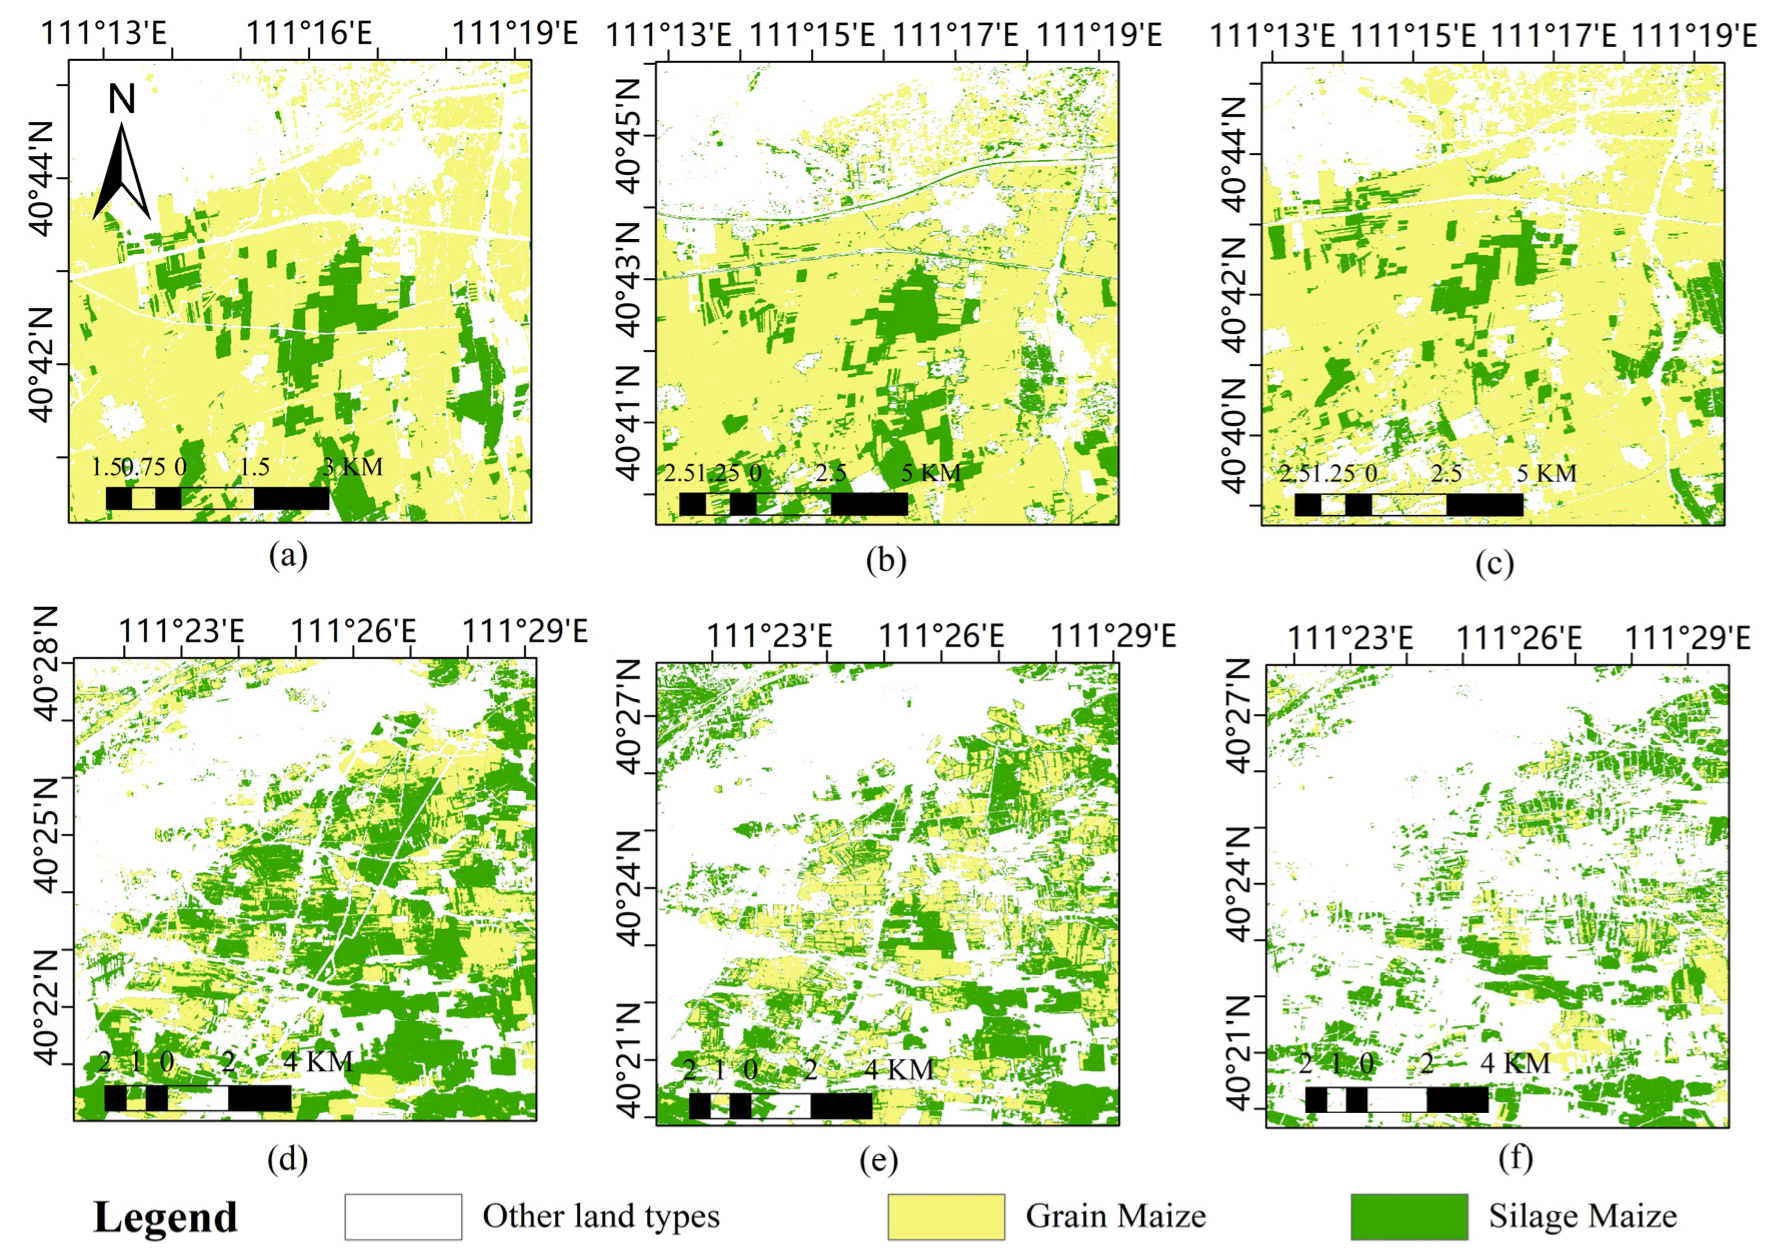
This study leverages the GEE platform and multi-temporal Sentinel-2 imagery to develop a TempDiff-SMID for discriminating silage maize and grain maize, capitalizing on their divergent phenological characteristics during critical growth stages. By integrating NDVI and LSWI time series data with Whittaker smoothing, the proposed model establishes explicit decision rules that, by leveraging the phenological differences between silage maize and grain maize, allowed it to achieve high-accuracy classification (overall accuracy: 92.91%, Kappa coefficient: 0.8923), enabling the fine-grained extraction of maize varieties. At present, research on silage maize in China remains limited, and there are no existing silage maize classification products available for direct comparison with our results. Therefore, we compared our classification outcomes with the publicly available national maize classification results for 2023. The comparison indicates that our classification exhibits consistent accuracy and spatial detail with existing products. Detailed comparisons are presented in Figure 8.
Unlike vanilla “black-box” approaches such as RF, the knowledge-driven framework provides hierarchical and explicit rules, whose classification logic directly maps to phenological transitions and spectral features. For instance, the model quantifies harvest timing differences through LSWI decline thresholds during the late milking stage, a feature intrinsically linked to silage maize’s earlier harvest. This transparency facilitates cross-year adaptability, enabling manual threshold adjustments to accommodate interannual phenological shifts (e.g., 2021–2022 applications achieved accuracies of 0.8816 and 0.8621, respectively). Compared to machine learning and deep learning methods, it reduces dependence on training samples and computational costs, making it well-suited for agricultural ap-plications characterized by limited data availability, high interpretability require-ments, and dynamic adaptation needs.
However, current threshold optimization relies on empirical adjustments, limiting scalability for large-scale multi-year monitoring. While the model enhances interpretability, it also imposes certain limitations on automation and cross-regional applicability, particularly in cases where phenological variations occur across years or regions. Future work could integrate machine learning-driven phenological phase detection or climate-informed dynamic parameterization to automate threshold tuning, thereby enhancing model generalizability while retaining interpretability. Such advancements could bridge the gap between rule-based and data-driven paradigms in agricultural remote sensing.
In addition, in terms of data sources, this study mainly relies on Sentinel-2 image data, combined with vegetation indices such as NDVI and LSWI to classify silage maize. Although Sentinel-2 data have advantages in spectral resolution and temporal resolution, a single data source may not be able to fully meet the classification needs in areas with complex terrain or heavy cloud coverage. In addition, issues such as spectral mixing and within-field heterogeneity at the parcel scale may further affect classification accuracy. Future research could consider the fusion of multi-source remote sensing data to enhance temporal resolution. For example, integrating optical imagery from Sentinel-2, Landsat-8/9, and MODIS with varying spatial and temporal resolutions could facilitate the construction of a temporally denser dataset, thereby improving the detection of key phenological windows for distinguishing between grain maize and silage maize. In regions characterized by frequent cloud cover and heavy rainfall, the incorporation of SAR data, such as Sentinel-1, in combination with optical imagery, may further enhance the robustness of silage maize identification under complex environmental conditions. Moreover, the remote sensing imagery used in this study has a spatial resolution of 10 m, which enables the distinction between silage maize and grain maize across relatively large spatial extents with reasonably high accuracy. If finer classification results at the field scale are desired, then the incorporation of higher-resolution UAV imagery could be considered in future work. However, this approach would significantly increase the cost of data acquisition. Therefore, the decision to employ UAV imagery must balance the trade-off between mapping accuracy and cost-effectiveness.
The results of this study provide technical support for the refined classification of silage maize and have broad application prospects. As an important source of feed in animal husbandry, accurate monitoring of the planting area of silage maize is of great significance for optimizing feed resource allocation and adjusting planting structure.
Building upon future advancements in automated phenological phase detection and dynamic threshold determination, this method can be scaled up to larger spatial extents, enabling the provincial- and even national-level mapping of silage maize. Such large-scale applications would provide critical foundational data to support food security, precision agriculture, and the sustainable development of the livestock industry.
With the advancement of deep learning technologies, future research could explore the integration of decision tree models with deep learning approaches. Specifically, time series models such as LSTM and Temporal CNN can be employed to automatically identify key change points in vegetation index time series (e.g., NDVI, LSWI), thereby enabling the construction of regionally adaptive models. These models can output optimal classification thresholds or critical phenological windows specific to different regions, addressing the limited generalization capability of traditional models across years and geographic areas. Such integration is expected to further enhance both the classification accuracy and the level of automation of the proposed approach.

6. Conclusions

This study developed a TempDiff-SMID on the GEE platform, utilizing multi-temporal Sentinel-2 imagery and leveraging the distinct phenological characteristics between silage maize and grain maize during critical growth stages. The model successfully achieved the high-precision classification of silage maize and grain maize in the study area, generating accurate 10 m resolution distribution maps of silage maize. The main conclusions are as follows:
This study systematically compared two machine learning methods leveraging phenological differences for silage maize classification, with both approaches demonstrating robust performance. The TempDiff-SMID achieved an overall accuracy of 0.9291 and Kappa coefficient of 0.8923, outperforming the SMRF (0.9043 accuracy, 0.8511 Kappa). Crucially, the TempDiff-SMID framework exhibited superior interpretability through its transparent classification rules that directly characterize spectral–phenological differences between silage and grain maize, particularly in capturing harvest timing variations through vegetation index trajectories. This inherent interpretability not only facilitates model diagnostics but also enables cross-year applications, as validated by consistent performance across multiple growing seasons (2021–2023). Furthermore, the TempDiff-SMID significantly reduces dependence on extensive labeled training data by effectively integrating multi-temporal spectral signatures, topographic features, and phenological characteristics. The model thus represents an optimal balance between classification accuracy and mechanistic understanding, addressing fundamental limitations of conventional “black-box” machine learning methods in agricultural remote sensing.
The TempDiff-SMID demonstrated robust performance in cross-year silage maize classification, achieving an overall accuracy of 0.8621 (Kappa coefficient: 0.7905) for 2022 and 0.8816 (Kappa: 0.8192) for 2021 applications. This temporal adaptability enables the reliable multi-year monitoring of silage maize cultivation through systematic threshold adjustments, facilitating the accurate detection of interannual planting area variations. The framework’s capacity to support long-term agricultural management holds significant implications for optimizing forage resource allocation and guiding regional cropping structure adjustments, particularly in dynamic farming systems.
The findings of this study provide robust technical support for fine-scale silage maize classification, demonstrating the critical influence of phenological differences in distinguishing silage maize from grain maize. This approach offers significant potential for practical applications, particularly in enabling agricultural authorities to optimize cropping systems and precisely manage forage resources through data-driven decision-making. The developed framework exhibits notable extensibility, with methodological adaptability to other crop classification scenarios. Furthermore, the threshold adjustment mechanism inherent in the decision tree model establishes a viable pathway for reliable cross-year applications, enhancing the model’s utility in long-term agricultural monitoring systems.

Author Contributions

Conceptualization, R.H. and J.H.; data curation, L.Y., L.S. and Z.H.; formal analysis, S.T.; funding acquisition, R.H.; investigation, J.H., L.S. and Z.H.; methodology, R. H., L.Y., and J.H.; project administration, R.H.; resources, J.H., L.S. and Z.H.; software, Z.L., S.T. and L.Y.; supervision, R.H.; validation, Z.L., S.T. and L.Y.; visualization, Z.L. and S.T.; writing—original draft, Z.L., R.H., S.T. and L.Y.; writing—review and editing, R.H., L.Y., J.H., L.S. and Z.H. All authors have read and agreed to the published version of the manuscript.

Funding

This research was funded by National Key R&D Program of China (2023YFB3906201).

Data Availability Statement

The data presented in this study are available upon request from the first author upon reasonable request.

Acknowledgments

We wish to express our gratitude to those who participated in the data processing and manuscript revisions.

Conflicts of Interest

The authors declare no conflicts of interest.

References

  1. Li, X.; Qu, Y.; Geng, H.; Xin, Q.; Huang, J.; Peng, S.; Zhang, L. Mapping Annual 10-m Maize Cropland Changes in China during 2017–2021. Sci. Data 2023, 10, 765. [Google Scholar] [CrossRef] [PubMed]
  2. You, N.; Dong, J.; Huang, J.; Du, G.; Zhang, G.; He, Y.; Yang, T.; Di, Y.; Xiao, X. The 10-m Crop Type Maps in Northeast China during 2017–2019. Sci. Data 2021, 8, 41. [Google Scholar] [CrossRef] [PubMed]
  3. Wang, B.; Chen, G.; Wen, J.; Li, L.; Jin, S.; Li, Y.; Zhou, L.; Zhang, W. SSATNet: Spectral-Spatial Attention Transformer for Hyperspectral Corn Image Classification. Front. Plant Sci. 2025, 15, 1458978. [Google Scholar] [CrossRef]
  4. Li, H.; Song, X.-P.; Hansen, M.C.; Becker-Reshef, I.; Adusei, B.; Pickering, J.; Wang, L.; Wang, L.; Lin, Z.; Zalles, V.; et al. Development of a 10-m Resolution Maize and Soybean Map over China: Matching Satellite-Based Crop Classification with Sample-Based Area Estimation. Remote Sens. Environ. 2023, 294, 113623. [Google Scholar] [CrossRef]
  5. Gilcher, M.; Ruf, T.; Emmerling, C.; Udelhoven, T. Remote Sensing Based Binary Classification of Maize. Dealing with Residual Autocorrelation in Sparse Sample Situations. Remote Sens. 2019, 11, 2172. [Google Scholar] [CrossRef]
  6. Ge, J.; Zhang, H.; Zuo, L.; Xu, L.; Jiang, J.; Song, M.; Ding, Y.; Xie, Y.; Wu, F.; Wang, C.; et al. Large-Scale Rice Mapping under Spatiotemporal Heterogeneity Using Multi-Temporal SAR Images and Explainable Deep Learning. ISPRS J. Photogramm. Remote Sens. 2025, 220, 395–412. [Google Scholar] [CrossRef]
  7. Xu, Y.; Ma, Y.; Zhang, Z. Self-Supervised Pre-Training for Large-Scale Crop Mapping Using Sentinel-2 Time Series. ISPRS J. Photogramm. Remote Sens. 2024, 207, 312–325. [Google Scholar] [CrossRef]
  8. Tao, J.; Zhang, X.; Wu, Q.; Wang, Y. Mapping Winter Rapeseed in South China Using Sentinel-2 Data Based on a Novel Separability Index. J. Integr. Agric. 2023, 22, 1645–1657. [Google Scholar] [CrossRef]
  9. Yang, G.; Li, X.; Xiong, Y.; He, M.; Zhang, L.; Jiang, C.; Yao, X.; Zhu, Y.; Cao, W.; Cheng, T. Annual Winter Wheat Mapping for Unveiling Spatiotemporal Patterns in China with a Knowledge-Guided Approach and Multi-Source Datasets. ISPRS J. Photogramm. Remote Sens. 2025, 225, 163–179. [Google Scholar] [CrossRef]
  10. Zhong, L.; Gong, P.; Biging, G.S. Efficient Corn and Soybean Mapping with Temporal Extendability: A Multi-Year Experiment Using Landsat Imagery. Remote Sens. Environ. 2014, 140, 1–13. [Google Scholar] [CrossRef]
  11. Zhong, L.; Hu, L.; Yu, L.; Gong, P.; Biging, G.S. Automated Mapping of Soybean and Corn Using Phenology. ISPRS J. Photogramm. Remote Sens. 2016, 119, 151–164. [Google Scholar] [CrossRef]
  12. Wang, H.; Yu, W.; You, J.; Ma, R.; Wang, W.; Li, B. A Unified Framework for Anomaly Detection of Satellite Images Based on Well-Designed Features and an Artificial Neural Network. Remote Sens. 2021, 13, 1506. [Google Scholar] [CrossRef]
  13. Li, N.; Zhan, P.; Pan, Y.; Zhu, X.; Li, M.; Zhang, D. Comparison of Remote Sensing Time-Series Smoothing Methods for Grassland Spring Phenology Extraction on the Qinghai–Tibetan Plateau. Remote Sens. 2020, 12, 3383. [Google Scholar] [CrossRef]
  14. Zhou, J.; Jia, L.; Menenti, M.; Gorte, B. On the Performance of Remote Sensing Time Series Reconstruction Methods—A Spatial Comparison. Remote Sens. Environ. 2016, 187, 367–384. [Google Scholar] [CrossRef]
  15. Cao, R.; Chen, Y.; Shen, M.; Chen, J.; Zhou, J.; Wang, C.; Yang, W. A Simple Method to Improve the Quality of NDVI Time-Series Data by Integrating Spatiotemporal Information with the Savitzky-Golay Filter. Remote Sens. Environ. 2018, 217, 244–257. [Google Scholar] [CrossRef]
  16. Qiu, B.; Feng, M.; Tang, Z. A Simple Smoother Based on Continuous Wavelet Transform: Comparative Evaluation Based on the Fidelity, Smoothness and Efficiency in Phenological Estimation. Int. J. Appl. Earth Obs. Geoinf. 2016, 47, 91–101. [Google Scholar] [CrossRef]
  17. Salehi Shahrabi, H.; Ashourloo, D.; Moeini Rad, A.; Aghighi, H.; Azadbakht, M.; Nematollahi, H. Automatic Silage Maize Detection Based on Phenological Rules Using Sentinel-2 Time-Series Dataset. Int. J. Remote Sens. 2020, 41, 8406–8427. [Google Scholar] [CrossRef]
  18. Karra, K.; Kontgis, C.; Statman-Weil, Z.; Mazzariello, J.C.; Mathis, M.; Brumby, S.P. Global Land Use/Land Cover with Sentinel 2 and Deep Learning. In Proceedings of the 2021 IEEE International Geoscience and Remote Sensing Symposium IGARSS, Brussels, Belgium, 11–16 July 2021; pp. 4704–4707. [Google Scholar]
  19. Bhandari, A.K.; Kumar, A.; Singh, G.K. Feature Extraction Using Normalized Difference Vegetation Index (NDVI): A Case Study of Jabalpur City. Procedia Technol. 2012, 6, 612–621. [Google Scholar] [CrossRef]
  20. Sun, L.; Gao, F.; Xie, D.; Anderson, M.; Chen, R.; Yang, Y.; Yang, Y.; Chen, Z. Reconstructing Daily 30 m NDVI over Complex Agricultural Landscapes Using a Crop Reference Curve Approach. Remote Sens. Environ. 2021, 253, 112156. [Google Scholar] [CrossRef]
  21. Xiang, K.; Yuan, W.; Wang, L.; Deng, Y. An LSWI-Based Method for Mapping Irrigated Areas in China Using Moderate-Resolution Satellite Data. Remote Sens. 2020, 12, 4181. [Google Scholar] [CrossRef]
  22. Guth, P.L.; Van Niekerk, A.; Grohmann, C.H.; Muller, J.-P.; Hawker, L.; Florinsky, I.V.; Gesch, D.; Reuter, H.I.; Herrera-Cruz, V.; Riazanoff, S.; et al. Digital Elevation Models: Terminology and Definitions. Remote Sens. 2021, 13, 3581. [Google Scholar] [CrossRef]
  23. Tariq, A.; Yan, J.; Gagnon, A.S.; Riaz Khan, M.; Mumtaz, F. Mapping of Cropland, Cropping Patterns and Crop Types by Combining Optical Remote Sensing Images with Decision Tree Classifier and Random Forest. Geo-Spat. Inf. Sci. 2023, 26, 302–320. [Google Scholar] [CrossRef]
  24. Lebourgeois, V.; Dupuy, S.; Vintrou, É.; Ameline, M.; Butler, S.; Bégué, A. A Combined Random Forest and OBIA Classification Scheme for Mapping Smallholder Agriculture at Different Nomenclature Levels Using Multisource Data (Simulated Sentinel-2 Time Series, VHRS and DEM). Remote Sens. 2017, 9, 259. [Google Scholar] [CrossRef]
  25. Li, R.; Xu, M.; Chen, Z.; Gao, B.; Cai, J.; Shen, F.; He, X.; Zhuang, Y.; Chen, D. Phenology-Based Classification of Crop Species and Rotation Types Using Fused MODIS and Landsat Data: The Comparison of a Random-Forest-Based Model and a Decision-Rule-Based Model. Soil Tillage Res. 2021, 206, 104838. [Google Scholar] [CrossRef]
  26. Du, B.J.; Zhang, J.; Wang, Z.M.; Mao, D.; Zhang, M.; Wu, B. Crop mapping based on Sentinel-2ANDVI time series using object-oriented classification and decision tree model. J. Geo-Inf. Sci. 2019, 21, 740–751. [Google Scholar]
  27. Liu, J.; Huffman, T.; Shang, J.; Qian, B.; Dong, T.; Zhang, Y. Identifying Major Crop Types in Eastern Canada Using a Fuzzy Decision Tree Classifier and Phenological Indicators Derived from Time Series MODIS Data. Can. J. Remote Sens. 2016, 42, 259–273. [Google Scholar] [CrossRef]
  28. Mayer, T.; Poortinga, A.; Bhandari, B.; Nicolau, A.P.; Markert, K.; Thwal, N.S.; Markert, A.; Haag, A.; Kilbride, J.; Chishtie, F.; et al. Deep Learning Approach for Sentinel-1 Surface Water Mapping Leveraging Google Earth Engine. ISPRS Open J. Photogramm. Remote Sens. 2021, 2, 100005. [Google Scholar] [CrossRef]
  29. Belgiu, M.; Drăguţ, L. Random Forest in Remote Sensing: A Review of Applications and Future Directions. ISPRS J. Photogramm. Remote Sens. 2016, 114, 24–31. [Google Scholar] [CrossRef]
  30. Nasiri, V.; Deljouei, A.; Moradi, F.; Sadeghi, S.M.M.; Borz, S.A. Land Use and Land Cover Mapping Using Sentinel-2, Landsat-8 Satellite Images, and Google Earth Engine: A Comparison of Two Composition Methods. Remote Sens. 2022, 14, 1977. [Google Scholar] [CrossRef]
  31. Praticò, S.; Solano, F.; Di Fazio, S.; Modica, G. Machine Learning Classification of Mediterranean Forest Habitats in Google Earth Engine Based on Seasonal Sentinel-2 Time-Series and Input Image Composition Optimisation. Remote Sens. 2021, 13, 586. [Google Scholar] [CrossRef]
  32. Huang, X.; Huang, J.; Li, X.; Shen, Q.; Chen, Z. Early Mapping of Winter Wheat in Henan Province of China Using Time Series of Sentinel-2 Data. GIScience Remote Sens. 2022, 59, 1534–1549. [Google Scholar] [CrossRef]
  33. Shao, Y.; Lunetta, R.S.; Wheeler, B.; Iiames, J.S.; Campbell, J.B. An Evaluation of Time-Series Smoothing Algorithms for Land-Cover Classifications Using MODIS-NDVI Multi-Temporal Data. Remote Sens. Environ. 2016, 174, 258–265. [Google Scholar] [CrossRef]
  34. Peng, Q.; Shen, R.; Li, X.; Ye, T.; Dong, J.; Fu, Y.; Yuan, W. A Twenty-Year Dataset of High-Resolution Maize Distribution in China. Sci. Data 2023, 10, 658. [Google Scholar] [CrossRef] [PubMed]
Figure 1. Distribution map of study area.
Agronomy 15 01438 g001
Figure 2. Technology roadmap.
Agronomy 15 01438 g002
Figure 3. Distribution of sample points in the study area.
Agronomy 15 01438 g003
Figure 4. Time series curves of NDVI and its filtered NDVI_fitted and LSWI and its filtered LSWI_fitted. (ac) are time series curves of NDVI and NDVI_fitted after Whittaker smoothing filtering, where (a) represents the NDVI of silage maize sample points, (b) represents the NDVI of ordinary corn sample points, and (c) represents the NDVI of other land sample points; (df) are time series curves of LSWI and LSWI_fitted after Whittaker smoothing filtering, where (d) represents the LSWI of silage maize sample points, (e) represents the LSWI of ordinary corn sample points, and (f) represents the LSWI of other land sample points. The solid line represents the original timing curve, and the dotted line represents the filtered timing curve.
Agronomy 15 01438 g004
Figure 5. Histogram of vegetation index feature importance analysis.
Agronomy 15 01438 g005
Figure 6. Comparison of mapping details of different classification methods: (a) is the classification result of the silage maize ordinary corn identification model based on harvest time differences in Hohhot in 2023, (b) is the classification result of the decision tree model in Tumote Zuoqi, (c) is the classification result of the SMRF in Tumote Zuoqi, (d) is the classification result of the decision tree model in Xinyingzi Town, and (e) is the classification result of the SMRF in Xinyingzi Town.
Agronomy 15 01438 g006
Figure 7. Classification results of TempDiff-SMID in multiple years: (ac) are the decision tree classifications of silage maize and grain maize near Tumote Zuoqi in 2023, 2022, and 2021, respectively, and (df) are the decision tree classifications of silage maize and grain maize near Xinyingzi Town in 2023, 2022, and 2021, respectively.
Agronomy 15 01438 g007
Figure 8. Comparison of classification details between TempDiff-SMID and existing maize classi-fication results. (a) classification result of the existing product in Hohhot City [34] ); (b) and (c) show the decision tree classification results of silage maize and grain maize near Tumed Left Banner and Xinyingzi Town, respectively; (d,e) present the corresponding classification results of existing maize products in the same areas [34].
Agronomy 15 01438 g008
Table 1. Overview of image interpretation characteristics of different land cover types in Hohhot.
ClassSample ImageSpectrumTextureDistributionShape
Silage maizeAgronomy 15 01438 i001
Aug.
Agronomy 15 01438 i002SmoothedMainly distributed in Tuoketuo County and Tumote Zuoqi.Regular stripe
Agronomy 15 01438 i003
Sept.
Grain maizeAgronomy 15 01438 i004
Sept.
Agronomy 15 01438 i005SmoothedThe main production areas are concentrated in Wuchuan County and Tumote Zuoqi.Regular stripe
Agronomy 15 01438 i006
Oct.
WaterAgronomy 15 01438 i007Agronomy 15 01438 i008SmoothedMainly composed of rivers such as the Heihe River in the Yellow River system and lakes such as the Hasuhai Lake.Natural curved ribbon/surface
Urban ArchitectureAgronomy 15 01438 i009Agronomy 15 01438 i010RoughPoint-axis distribution along traffic arteries.Geometric regular polygon
woodlandAgronomy 15 01438 i011Agronomy 15 01438 i012RoughWidely distributed in mountains.Irregular patchy
Table 2. The TempDiff-SMID model based on harvest time differences.
ConditionContentFunction
Condition one N D V I 5 0.2   N D V I 7 0.2 e l e v a t i o n M a s k < 1200 Condition 1 applies to NDVI5 ≤ 0.2 to identify areas with sparse vegetation immediately after corn planting, excluding areas with existing vegetation. Then, NDVI7 ≥ 0.2 confirms that the crop is growing during the peak growth period, while the altitude threshold <1200 m filters out high-altitude non-maize-growing areas in Hohhot. These continuous criteria work together to isolate potential corn-growing areas while eliminating non-arable land and non-target vegetation.
Condition two L S W I 7 0.16 The higher moisture content of corn during the heading period distinguishes corn fields from drought vegetation.
Condition three L S W I 9 0.15 After silage maize is harvested at the end of milky maturity to the beginning of waxy maturity, the cultivated land becomes bare land with lower moisture content, which is used to distinguish silage maize from grain maize.
Table 3. The TempDiff-SMID model based on harvest time difference.
ClassDecision Conditions
Silage maize c o n d i t i o n 1 c o n d i t i o n 2 c o n d i t i o n 3
Grain maize c o n d i t i o n 1 c o n d i t i o n 2 ¬ c o n d i t i o n 3
Non-maize classes ¬ c o n d i t i o n 1 ( c o n d i t i o n 1 ¬ c o n d i t i o n 2 )
Table 4. Accuracy verification of the SMRF model.
ClassOAUAPAKappa CoefficientF1-Score
Overall0.9043//0.8511/
Silage maize/0.92310.8571/0.8889
Grain maize/0.85710.9796/0.9143
Non-maize Classes/0.96970.8421/0.9115
Table 5. Accuracy verification of TempDiff-SMID based on harvest time difference.
ClassOAUAPAKappa CoefficientF1-Score
Overall0.9291//0.8923/
Silage maize/0.92160.94/0.9307
Grain maize/0.92190.9008/0.9112
Non-maize Classes/0.94040.9467/0.9435
Table 6. Accuracy verification of TempDiff-SMID in multiple years.
ClassYearOAUAPAKappa CoefficientF1-Score
Overall20220.8621//0.7905/
20210.8816//0.8192/
Silage maize2022/0.80640.8264/0.8163
2021/0.90.8852/0.8925
Grain maize2022/0.86250.8466/0.8545
2021/0.93380.779/0.8494
Non-maize classes2022/0.90.9/0.9
2021/0.83560.9786/0.9015
Disclaimer/Publisher’s Note: The statements, opinions and data contained in all publications are solely those of the individual author(s) and contributor(s) and not of MDPI and/or the editor(s). MDPI and/or the editor(s) disclaim responsibility for any injury to people or property resulting from any ideas, methods, instructions or products referred to in the content.

