Article

Synergistic Effects of Fulvic Acid and Phosphorus Fertilizers on Cotton Photosynthetic Capacity, Root Productivity, and Yield

1
College of Agriculture, Tarim University, Alar 843300, China
2
Key Laboratory of Genetic Improvement and Efficient Production for Specialty Crops in Arid Southern Xinjiang of Xinjiang Corps, Tarim University, Alar 843300, China
3
College of Agriculture, Nanjing Agricultural University, Nanjing 210095, China
*
Authors to whom correspondence should be addressed.
These authors contributed equally to this work.
Agronomy 2025, 15(6), 1327; https://doi.org/10.3390/agronomy15061327
Submission received: 30 April 2025 / Revised: 22 May 2025 / Accepted: 27 May 2025 / Published: 29 May 2025

Abstract

:
Cotton root systems sustain photosynthesis by nutrient uptake and coordinate with above-ground growth to influence yield. This study explored the effects of fulvic acid (FA) and phosphorus (P) fertilizers on the relationships between cotton photosynthetic capacity (CAP) and root carbohydrate metabolism. A field experiment was conducted including five treatments: no P fertilizer (CK), 105 kg P2O5 ha−1 (P1), 150 kg P2O5 ha−1 (P2), 105 kg P2O5 ha−1 + FA (FP1), and 150 kg P2O5 ha−1 + FA (FP2). Results found that FP2 showed the most significant advantage, ensuring a suitable leaf area index (LAI) and cotton fractional interception of photosynthetically active radiation (IPAR) and consequently maintaining a high CAP. Compared with FP2, FP1 resulted in an increase in the boll loading of the root system (BLR) by 8.1% and the boll capacity of the root system (BCR) by 9.3%. From the peak flowering stage to the peak boll setting stage, sucrose and starch contents in FP1 were 6.2–19.2% and 26.5–27.9% lower than those in FP2, respectively. Conversely, fructose and glucose contents in FP1 were 6.4–10.8% and 7.2–8.8% higher than in FP2. The cotton reproductive organ biomass was increased by 11.1% and 14.7% relative to FP2. Moreover, FP1 achieved the highest yield, with an increase of 8.5% and 11.0% compared with P2 and FP2, respectively. Taken together, our study suggests that application of FP1 (105 kg P2O5 ha−1 + FA) could be a proper P fertilization method in cotton production of saline-alkali and arid regions.

1. Introduction

Cotton (Gossypium hirsutum L.) is a predominant cash and fiber crop in Xinjiang, China, contributing 90% of the national cotton production [1]. The high soil salinization degree in Xinjiang causes most applied phosphorus (P) fertilizer to be fixed [2,3], rendering it poorly available for direct cotton uptake. This significantly impairs cotton production and highlights the critical issue of insufficient soil available P [4,5]. Over-application of P fertilizers not only causes resource waste but also results in water body eutrophication, which increases the risk of P loss [6,7]. Thus, there is an urgent need to explore alternative P fertilizer management practices to ensure high-yield and sustainable cotton production in Xinjiang. Numerous studies have demonstrated that reducing inorganic fertilizer input alongside organic manure application can effectively improve soil nutrient status, and boost crop yield sustainably [8,9]. However, it is worth noting that most studies have focused on soil biological and physical processes, while giving insufficient attention to the relationships between root and shoot growth.
Photosynthesis serves as the basis for crop yield formation [10]. Numerous studies have shown that humic substances can increase the permeability of crop cells, reduce stomatal aperture, decrease water transpiration, and enhance the water retention capacity of crops [11]. Additionally, these substances can promote plant growth and increase yield by improving photosynthetic capacity, increasing chlorophyll content, and enhancing the activity of ribulose-1,5-bisphosphate carboxylase/oxygenase [12]. The root, as a non-photosynthetic organ and a vital organ for nutrient absorption and transport from soil, establishes a relationship between root and shoot growth playing a pivotal role in crop yield [13,14]. This relationship refers to the dynamic synergistic mechanism between plant roots and above-ground shoots, established through photosynthetic products’ exchange, signal transduction, and resource allocation. This relationship directly influences plant growth and development and yield formation. Carbohydrate metabolism underpins root development, where non-structural carbohydrates, such as sucrose and glucose, not only act as primary storage forms of photosynthates but also provide energy for root growth and function [15]. Understanding the relationships between root and shoot growth can help clarify the mechanisms underlying cotton growth and yield formation.
Humic substances (HSs) are a mixture of organic weak acids formed through the degradation and synthesis of animal and plant residues by microorganisms, under the combined action of various geophysical and chemical factors [16]. HSs may retard the precipitation and crystallization of Fe(Al, Ca)-phosphates by binding cations and attaching HSs to precipitation and crystallization sites, and the formation of humic-Fe complexes hinders or retards the formation of FePO4 and increases soil P solubility [17]. HSs also can increase root growth, root exudates, and P transporters to enhance P availability. Fulvic acid (FA) is a type of low-molecular-weight HS [18], which has been proved to be beneficial in enhancing soil structure and nutrient availability and therefore improving plant growth and yield. Zhang et al. [19] showed that FA combined with P fertilizer significantly increased cotton yield through soil P availability and enhancing cotton P uptake. Yang et al. [20] reviewed that FA application can reduce P fixation and enhance soil P availability, thereby improving crop yield. However, limited studies have been conducted to assess the impacts of FA and P fertilizers on the relationships between root and shoot growth and photosynthetic capacity and root carbohydrate metabolism.
Therefore, this study aims to investigate the effects of FA combined with different P application rates on cotton photosynthetic capacity, biomass, root productivity, and root carbohydrate content across different cotton growth stages, with the goal of identifying the optimal combination of P fertilizers and FA to enhance cotton root productivity and yield. We hypothesize that FA combined with 105 kg P2O5 ha−1 can establish a balance between root–shoot biomass allocation (root–shoot ratio) and source–sink coordination (leaf area index vs. boll loading of the root system and boll capacity of the root system), ultimately improving root productivity and cotton yield.

2. Materials and Methods

2.1. Experimental Site

The field experiment was located at Alar (40°32′ N, 81°18′ E), Xinjiang, China, in 2023 and 2024. The region has a warm temperate continental arid climate, with an average annual temperature of 10.7 °C and annual precipitation of 40.1–82.5 mm. The soil was classified as sandy loam (USDA soil taxonomy), with a total nitrogen (N) content of 1.1 g kg−1, available phosphorus (P) of 16.9 mg kg−1, available potassium of 110.5 mg kg−1, available nitrogen of 93.5 mg kg−1, and organic matter content of 6.7 g kg−1.

2.2. Experimental Design

The experiment employed a randomized complete block design with five treatments: no chemical P fertilizer (CK), 105 kg P2O5 ha−1 (P1), 150 kg P2O5 ha−1 (P2), 105 kg P2O5 ha−1 + fulvic acid (FP1), and 150 kg P2O5 ha−1 + fulvic acid (FP2). Each treatment was replicated three times, with each plot covering 92 m2 (4.6 m × 20 m). Cotton (cultivar Tahe No.2) was sowed on 18 April 2023 and 20 April 2024, using under-film drip irrigation. The planting pattern followed a wide–narrow row configuration (66 cm + 10 cm), with a planting density of 220,000 plants ha−1 and a plant spacing of 7.5 cm.
The N fertilizer (urea, 46% N) was applied at 300 kg ha−1, and potassium fertilizer (K2O, 52%) was applied at 90 kg ha−1 in all treatments. The P fertilizer was diammonium phosphate (46% P2O5). The fulvic acid was mineral fulvic acid potassium (humic acid ≥50%, fulvic acid ≥50%, organic matter ≥60%, potassium oxide ≥10%, pH 8–11) and was applied at a rate of 45 kg ha−1. This mineral fulvic acid potassium fertilizer was a commercial fertilizer and was purchased from Fenxiang Xiannong Biotechnology Co., Ltd. (Ri Zhao, China). As this is a commercial fertilizer with a national standard registration number, no additional elemental testing was conducted. All fertilizers were applied as topdressing via drip irrigation. Field management practices (irrigation, weeding etc.) followed high-yield cultivation requirements.

2.3. Plant Sampling and Analysis

At the peak squaring stage (PSS), peak flowering stage (PFS), peak boll setting stage (PBS), and boll opening stage (BOS), five cotton plants were randomly collected from each treatment, respectively. A rectangular soil volume (40 cm × 10 cm × 60 cm) was delineated around the sample plant, and the entire cotton plant with its root system was removed as completely as possible. These plant samples were separated according to different organs (root, stem, leaf, flower, and boll). Root samples from various sampling sites were placed in a 0.25 mm sieve and rinsed gently with running water to remove the soil. All plant samples were dried at 105 °C for 30 min using an oven and then dried at 80 °C for 48 h until reaching constant weight. Finally, the samples were weighed.

2.4. Cotton Yield and Yield Components

When the cotton was harvested, 20 consecutive cotton plants with uniform growth were selected from each plot. The number of bolls per plant was recorded, and their weight was recorded after air-drying to calculate seed cotton yield. The lint yield was obtained after ginning.

2.5. Cotton Root Productivity

The cotton root productivity can be quantified using two key metrics: the boll loading of the root system (BLR) and the boll capacity of the root system (BCR).
BLR (no g−1) = Boll number (no ha−1)/Root biomass (kg ha−1) × 1000
BCR (g g−1) = Boll biomass (kg ha−1)/Root biomass (kg ha−1) × 1000
The root–shoot ratio (R/S) was calculated as:
R/S = Root biomass (kg ha−1)/Shoot biomass (kg ha−1)

2.6. The Non-Structural Carbohydrate Content of Cotton Roots

The non-structural carbohydrate content of cotton roots was determined following the method of Iqbal et al. [21]. Briefly, 4 mL of 80% ethanol was added to 0.5 g of the collected root sample, which was then heated in a water bath at 80 °C for 40 min. After centrifugation at 6000 rpm for 10 min, the supernatant was collected, and the residue was extracted three additional times by repeating the ethanol incubation and centrifugation steps. The combined supernatants were diluted to 10 mL with 80% ethanol for sucrose and hexose quantification. The insoluble residue was evaporated to dryness, dissolved in 2 mL of distilled water, and heated in a boiling water bath (100 °C) for 15 min. After cooling to room temperature, 2 mL of 4.6 M HClO4 (note: verify concentration safety) was carefully added under an ice-water bath, and the mixture was incubated for 15 min. Following the addition of 2 mL of distilled water, the mixture was centrifuged at 6000 rpm for 10 min. The supernatant was transferred to a 25 mL volumetric flask, and the residue was re-extracted with 2 mL of 4.6 M HClO4. The combined supernatants were diluted to 25 mL with distilled water for starch determination. Fructose content was measured using the resorcinol method, glucose content was determined by the glucose oxidase method, and starch content was quantified using the anthrone-sulfuric acid method [21,22].

2.7. Cotton Photosynthetic Capacity

Cotton photosynthetic capacity (CAP) was determined using the assimilation box method [23] at the cotton growth stage (PSS, PFS, PBS, and BOS). CAP was measured between 11:00 and 14:00 on a sunny and windless day. The size of the assimilation box was 90 cm × 90 cm × 130 cm, and it was covered with high-transmittance (≥95%) polyester film. The assimilation box had two internal fans installed to mix the box’s inside air and balance the temperature. Six cotton plants were covered in the box, and the airtightness of the chamber was ensured. Then, gas sampling was measured at the 20th second and the 60th second. After measuring cotton CAP, plant samples inside the assimilation chamber were cut, and the CO2 gas exchange rate continued to be measured at the original site.
The CAP was calculated as follows:
CAP = (D × Δc × V)/(S × Δt)
where D refers to the concentration of CO2 gas, Δc (ppm) refers to the difference in CO2 gas concentration within the assimilation chamber over a certain period of time (Δt, s), V refers to the volume of the assimilation chamber, and S (m2) refers to the area occupied by the plants inside the assimilation chamber.

2.8. Statistical Analysis

One-way analysis of variance (ANOVA) was performed with SPSS22.0 (IBM, Armonk, NY, USA) using the Duncan method. Significant differences were tested among treatments at the p < 0.05 probability level. All figures were drawn by using Origin (Pro 2024, Origin Lab, Northampton, MA, USA). Correlation analysis among yield, cotton photosynthetic capacity, root productivity, and carbohydrate contents in cotton roots was analyzed with Origin 2024 using a correlation plot app.

3. Results

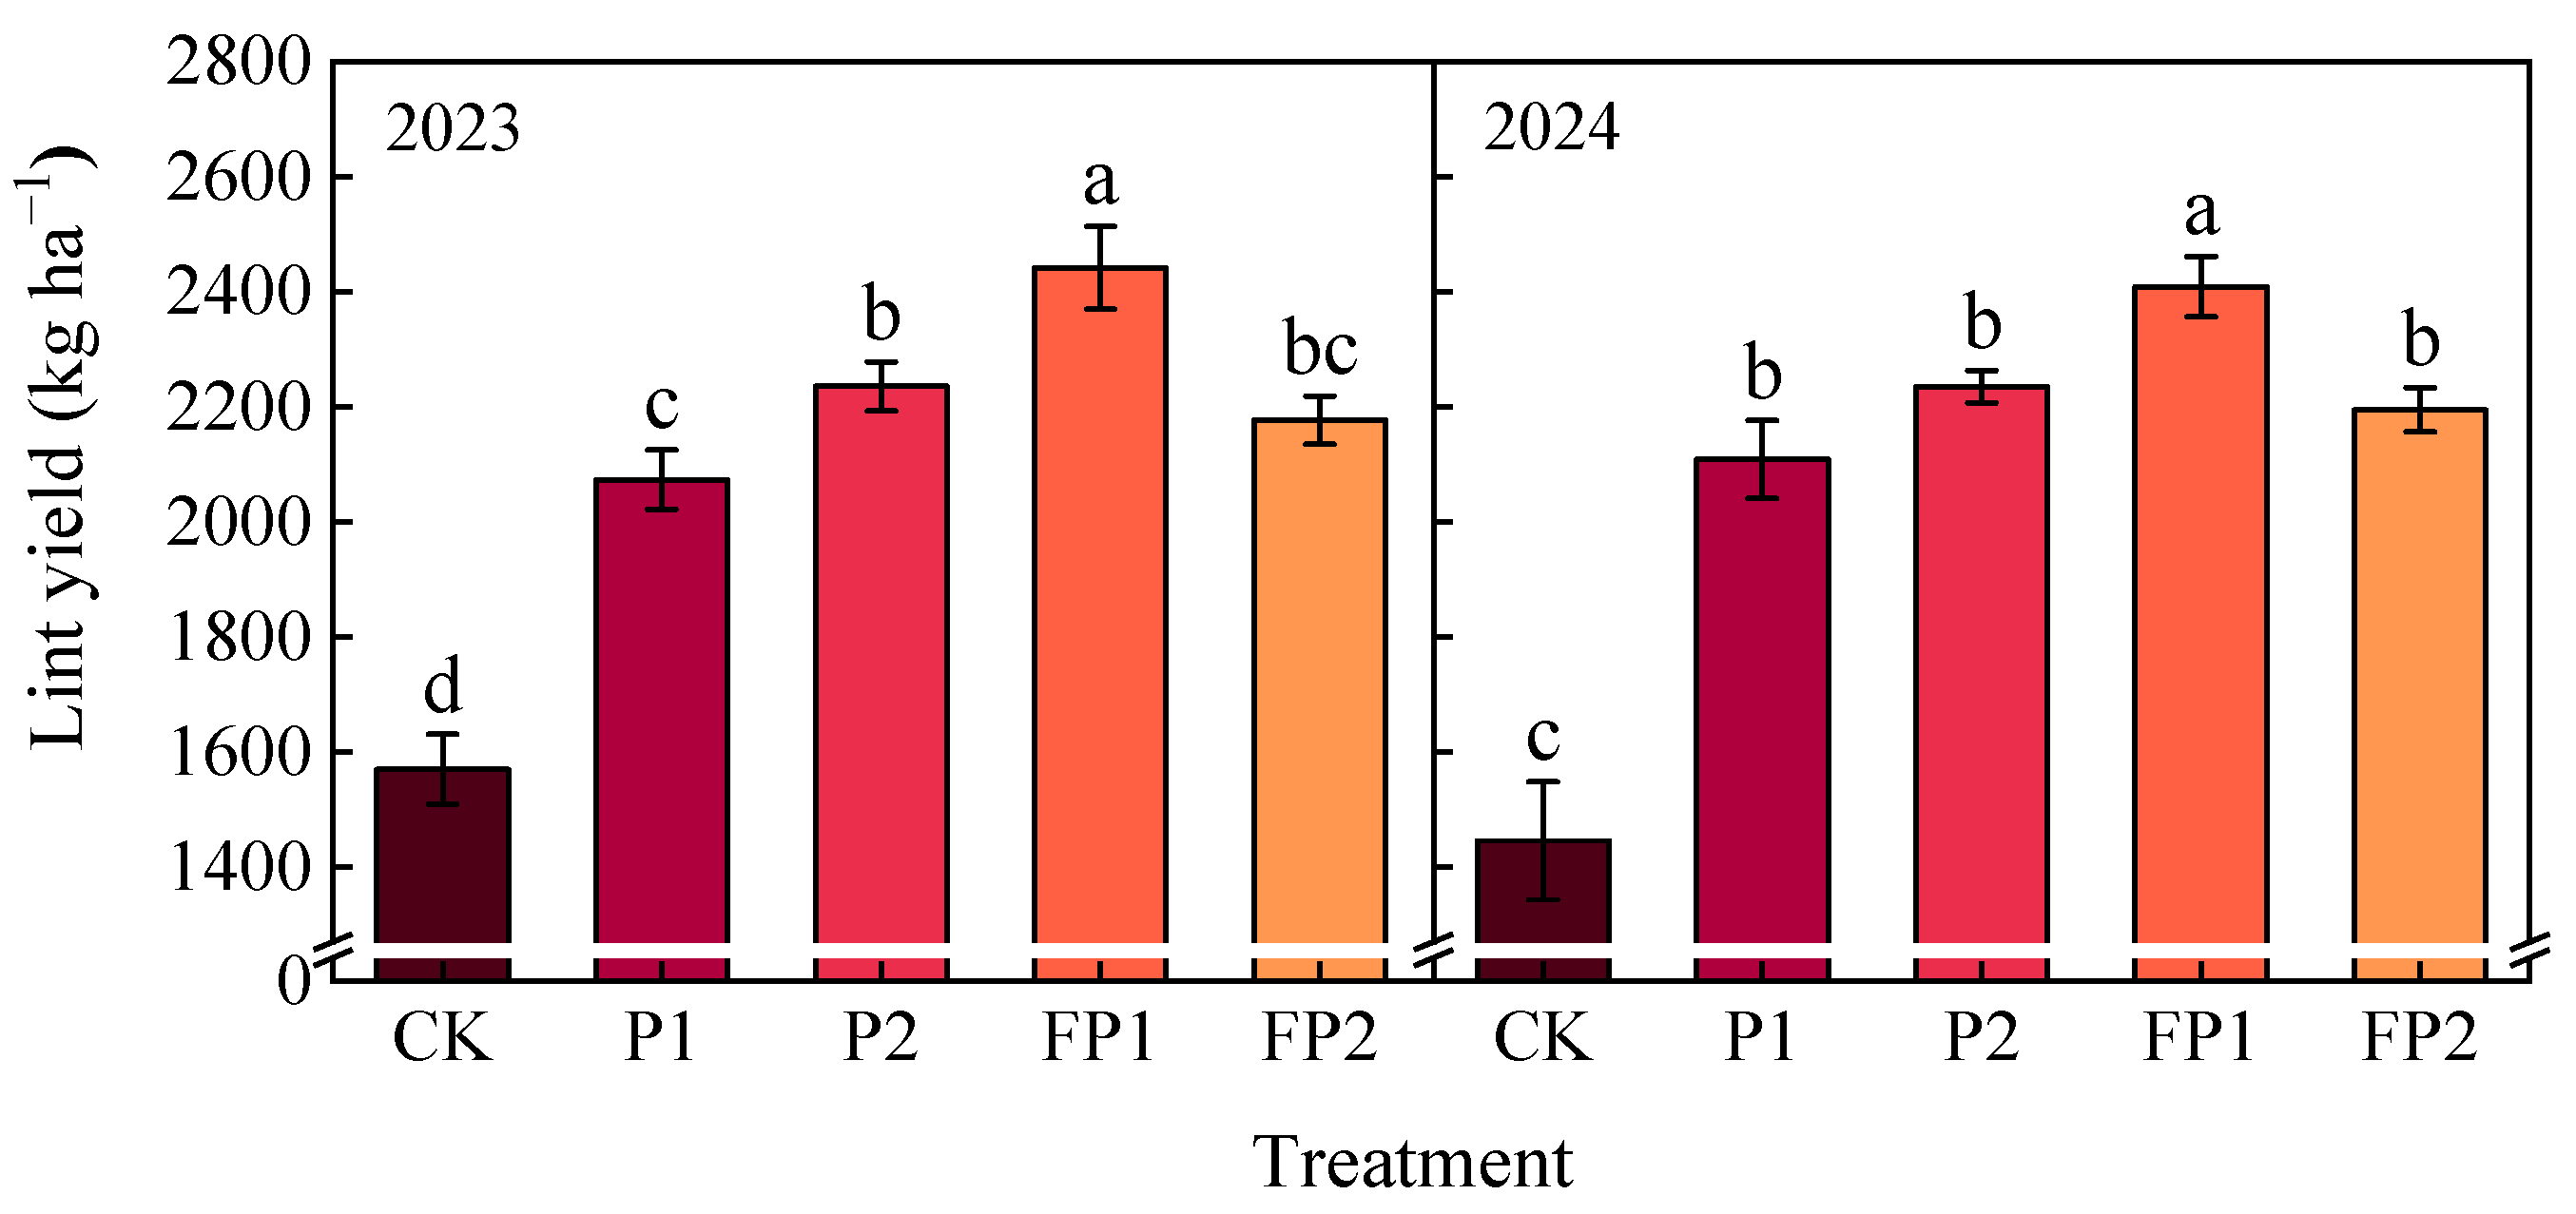
3.1. Cotton Lint Yield

Compared with CK, the cotton lint yield significantly increased by 32.1–45.8% and 42.4–54.6% under P1 and P2, 55.5–66.6% and 38.6–51.8% under FP1 and FP2 in both years, respectively (Figure 1). The cotton lint yield in the FP2 treatment was significantly decreased by 12.2% and 9.8% compared with FP1 in 2023 and 2024. Compared with P2, the cotton lint yield under FP1 was significantly increased by 7.8–9.2% in two years.

3.2. Cotton Biomass Allocation

The cotton vegetative organ biomass and reproductive organ biomass accumulated gradually as the growth stage proceeded, and the differences among treatments were more significant at the peak boll setting stage and boll opening stage. At the peak boll setting stage and boll opening stage, the cotton vegetative organ biomass under FP1 was 1.2–2.5% and 1.3–2.4% lower than FP2 in two years. However, the cotton reproductive organ biomass under FP1 was 10.5–11.8% and 13.9–15.6% higher than FP2 in two years. Compared with CK, the cotton reproductive organ biomass significantly increased by 56.9–62.1% and 62.7–72.1% under P1 and P2 and 79.7–94.6% and 60.8–71.6% under FP1 and FP2 at the peak boll setting stage in both years, respectively. Compared with CK, the cotton reproductive organ biomass significantly increased by 15.8–20.5% and 22.7–26.5% under P1 and P2 and 40.8–49.2% and 21.2–26.0% under FP1 and FP2 at the boll opening stage in both years, respectively (Table 1).

3.3. Cotton Photosynthetic Capacity

The leaf area index (LAI) increased first and then decreased as the development of cotton across various growth stages reached a peak value at the peak boll setting stage (Figure 2). ANOVA Analysis showed that P1, P2, FP1, and FP2 were significantly higher than CK at all cotton growth stages, but no statistical significance difference was observed among P2, FP1, and FP2 treatments at the peak squaring stage and the peak flowering stage in two years. Compared with P2, the LAI under FP1 and FP2 treatments was significantly increased by 6.2–7.1% and 6.4–8.8% at the peak boll setting stage in two years, respectively. However, no obvious difference was found between FP1 and FP2 at the peak boll setting stage.
The cotton fractional interception of photosynthetically active radiation (IPAR) increased first and then decreased as the development of cotton across various growth stages reached a peak value at the peak boll setting stage (Figure 3). The IPAR was higher in other treatments than the CK treatment at all growth stages. In the peak boll setting stage, compared with that in the CK treatment, IPAR in the P1 and P2 treatments significantly increased by 10.9–11.0% and 12.1–12.3%, respectively. The IPAR in FP1 and FP2 treatments was 12.3–15.3% and 15.4–15.5% higher than CK in two years. The FP1 treatment was significantly higher than P2, but no obvious difference was found between FP1 and FP2 at the peak boll setting stage.
The cotton photosynthetic capacity (CAP) increased first and then decreased as the development of cotton across various growth stages reached peak value at the peak boll setting stage (Figure 4). The CAP was higher in other treatments than the CK treatment at all growth stages. In the peak flowering stage, compared with that in the CK treatment, the CAP in the P1 and P2 treatments significantly increased by 40.4–49.1% and 47.0–56.6%, respectively. The CAP in the FP1 and FP2 treatments was 46.5–55.4% and 35.7–45.0% higher than CK in two years. In the peak boll setting stage, compared with that in the CK treatment, the CAP in the P1 and P2 treatments significantly increased by 32.1–34.8% and 35.5–41.5%, respectively. The CAP in FP1 and FP2 treatments was 56.1–59.2% and 36.7–42.8% higher than CK in two years. The FP1 treatment was significantly higher than FP2, but no obvious difference was found between FP1 and P2.

3.4. Cotton Root Productivity

During the development of cotton across various phenological stages, there was a gradual decrease in the root–shoot ratio (R/S) (Figure 5). Compared with CK, the R/S significantly decreased by 6.6–7.1% and 3.3–7.3% under P1 and P2 and 3.2–7.6% and 4.9–8.1% under FP1 and FP2 at the boll opening stage in both years. However, no statistical significance difference was observed among P2, FP1, and FP2 treatments in two years. There was no significance difference among P2, FP1, and FP2 treatments during all cotton growth stages in two years.
The boll capacity of the root system (BCR) increased gradually with the development of cotton across various growth stages (Figure 6). Compared with CK, the BCR significantly decreased by 19.8–22.4% and 44.3–47.2% under P1 and P2 and 56.0–56.7% and 42.1–43.9% under FP1 and FP2 at the boll opening stage in both years. Compared with FP2, the BCR significantly decreased by 8.3–10.3% under FP1 at the boll opening stage in both years. There was no significance difference between FP2 and P2 treatments at the peak flowering stage and the boll opening stage.
The boll loading of the root system (BLR) increased gradually with the development of cotton across various growth stages (Figure 7). Compared with CK, the BCR significantly decreased by 9.9–10.9% and 22.2–26.9% under P1 and P2 and 31.0–37.2% and 23.2–24.8% under FP1 and FP2 at the boll opening stage in both years. Compared with FP2, the BCR significantly decreased by 10.0% under FP1 at the boll opening stage in 2024. There was no significance difference between P2 and FP2 treatments at the boll opening stage.

3.5. Carbohydrate Contents in Cotton Roots

As the cotton phenological stages advanced, there was a gradual increase in the cotton roots’ fructose and glucose contents, as shown in Figure 8 and Figure 9. On the contrary, the sucrose and starch contents first rose and then declined, reaching their peak at the peak boll setting stage (Figure 10 and Figure 11). The differences among treatments were more significant at the peak flowering stage and the peak boll setting stage. Compared with CK, the fructose contents at the peak boll setting stage increased by 4.2–8.1% and 13.0–19.2% under P1 and P2 and 25.5–29.0% and 15.1–16.2% under FP1 and FP2; the glucose contents increased by 4.1–28.0% and 8.5–34.8% under P1 and P2 and 23.1–44.8% and 14.3–35.7% under FP1 and FP2, respectively. The FP1 treatment was significantly higher than FP2 in cotton roots’ fructose and glucose contents at the peak flowering stage and the peak boll setting stage, respectively.
As compared with CK in 2023 and 2024, the sucrose contents at the peak boll setting stage decreased by 13.8–16.7% and 18.4–20.5% under P1 and P2 and 28.5–36.0% and 19.1–19.9% under FP1 and FP2; the starch contents decreased by 9.3–13.6% and 14.3–23.5% under P1 and P2 and 37.4–40.0% and 18.4–25.1% under FP1 and FP2. The FP1 treatment was significantly lower than FP2 in cotton roots’ sucrose and starch contents at the peak flowering stage and the peak boll setting stage, respectively.

3.6. Correlation Analysis Among Yield, Cotton Photosynthetic Capacity, Root Productivity, and Carbohydrate Contents in Cotton Roots

The results of the correlation analysis between cotton yield and various indicators are presented in Figure 12. The cotton lint yield was positively related to LAI, IPAR, CAP, BLR, BCR, fructose, and glucose contents. A significant negative correlation was found between starch, R/S, and sucrose. The contents of starch showed significant negative correlation with LAI, IPAR, CAP, BLR, BCR, VB, and RB, while having significant positive correlations with R/S.

4. Discussion

Fulvic Acid (FA) is one of the important components of humic substances, derived from decomposed biological materials (e.g., animal carcasses or lignin) through microbial degradation or fermentation [16,24]. FA is characterized by a small molecular weight, abundant acidic functional groups, and good water solubility, enabling high bioavailability. Unlike other humic fractions, FA exhibits excellent solubility and stability under alkaline conditions and can be easily taken up and utilized by crops [25], thereby accelerating crop growth by enhancing nutrient absorption. Numerous studies have shown that humic substances combined with inorganic fertilizers can stimulate plant growth and increase yields [9,22]. The current results fully support our hypothesis that FA combined with 105 kg P2O5 ha−1 can establish a balance between root–shoot biomass allocation (root–shoot ratio) and source–sink coordination (leaf area index vs. boll loading of the root system and boll capacity of the root system), ultimately improving root productivity and cotton yield.
Crop yield formation is closely and positively associated with photosynthetic capacity [26]. Reasonable application of fertilizer maintains an appropriate leaf area index (LAI), optimizes canopy structure, enhances light interception by the crop population, sustains vigorous photosynthetic production, increases crop dry matter accumulation, and thus boosts crop yield [27,28]. In our study, FA combined with P fertilizer significantly increased cotton LAI compared to CK at all growth stages. Notably, the LAI of PF2 and P2 treatments was significantly higher than that of FP1 at the peak boll setting stage. However, an excessively large leaf area can cause inter-leaf shading, reducing light penetration through the canopy and leading to premature ripening, early leaf senescence, defoliation, decreased fractional interception of photosynthetically active radiation (IPAR), and ultimately a decline in the cotton photosynthetic capacity (CAP) [29]. Another possible explanation is that over-application (PF2 and P2) promotes excessive vegetative growth, thereby inducing significant abscission of lower fruit branches during late cotton growth [30]. Excessive liquid fertilizer application increases the sink-to-source ratio in cotton, accelerating leaf senescence and causing more shedding of lower leaves [31]. Our results showed that FP1 ensured a more suitable LAI and IPAR, thereby maintaining high CAP. Achieving an appropriate LAI during the flowering and boll-forming stages also enhances the allocation of photosynthetic products to the reproductive organ biomass [32,33]. This was confirmed in our study, where FP1 exhibited the highest reproductive organ biomass at both the peak boll setting and boll opening stages.
The root system is the most active underground vegetative organ for crops to uptake water and nutrients. Its relationship with the above-ground part is of utmost importance for crop nutrient uptake, transport, and yield formation [34]. Excessively high or low crop root biomass is unfavorable for increasing crop yields; lower biomass reduces water and nutrient absorption capacity, while overgrowth leads to competition for photosynthetic products between the roots and above-ground parts [35,36]. In our study, FA combined with P fertilizer resulted in a lower root–shoot ratio (R/S) but a higher boll loading of the root system (BLR) and boll capacity of the root system (BCR). BCR and BLR served as key indicators of the coordination between root system function and reproductive organ development. This result indicates that FA combined with P fertilizer promoted greater biomass allocation to the above-ground parts, thereby facilitating yield formation. Root productivity and above-ground productivity are interdependent yet mutually regulated, jointly influencing crop growth and yield formation [37]. They are closely linked through material exchange and signal transduction to maintain overall crop life activities [38].
Carbohydrate metabolism is essential for root growth, crop growth, and yield formation [39]. In the case of starch, as a storage form of carbohydrates, changes in its content may affect energy reserve and material transport in roots [40]. A lower starch content may indicate that more carbohydrates are utilized for root physiological activities rather than excessive accumulation, thus promoting an increase in root productivity [10]. Our results further revealed that compared with FP2 and P2, the FP1 treatment had higher fructose and glucose contents but lower sucrose and starch contents from the peak flowering stage to the peak boll setting stage. This result indicates that FA combined with suitable P fertilizer promotes the effective utilization of photosynthetic products (sucrose and starch). This finding is consistent with Wang et al. [9], who reported that straw retention combined with appropriate P fertilizer could promote root carbohydrate metabolism and increase yield. Additionally, correlation analysis further confirmed that cotton lint yield was highly positively correlated with CAP, root productivity, and fructose content, and significantly positively correlated with starch content. This suggests that maintaining strong photosynthetic capacity, promoting root productivity, and appropriately regulating carbohydrate metabolism—particularly the accumulation of sugars like fructose—is crucial for increasing cotton yield.
Overall, FP1 (105 kg P2O5 ha−1 + FA) is considered a suitable P fertilization method for cotton production in saline-alkali and arid regions. This treatment demonstrates comprehensive effects in optimizing photosynthetic parameters, promoting root development, and increasing yield. Additionally, over-application of fertilizer can lead to high nutrient concentrations in the soil solution, thereby accelerating root senescence, decreasing the photosynthetic capacity of the cotton population, and ultimately causing yield loss. It should be noted that many studies have found the promoting effect of FA on soil P dynamics and crop P uptake [17,41]. In the future, this research should further consider the role in improving cotton yield from the perspective of P cycling.

5. Conclusions

The study demonstrated that in saline-alkali and arid regions, applying fulvic acid (FA) combined with 105 kg P2O5 ha−1 (FP1) was the most suitable fertilization method for cotton production. FP1 treatment improved root productivity and strengthened cotton photosynthetic capacity, thereby indicating a more coordinated source–sink relationship, thereby ultimately boosting yield. Meanwhile, FP1 enhanced the utilization of sucrose and starch in cotton root. This efficient use of root carbohydrates plays a crucial role in coordinating the growth relationships among roots, above-ground parts, and reproductive organs. This, in turn, significantly increased the ability of photosynthetic products to further partition into reproductive organ biomass, resulting in a high boll loading of the root system (BLR) and boll capacity of the root system (BCR), and facilitated yield formation. Conversely, over-application of fertilizers (P2 and FP2) resulted in root senescence and reduced photosynthetic capacity, which caused yield loss. Therefore, FP1 (105 kg P2O5 ha−1 + FA) is a suitable P fertilization method for coordinating above- and below-ground growth, enhancing root productivity, the photosynthetic capacity of the cotton population, and yield in saline-alkali and arid regions.

Author Contributions

Conceptualization, H.L., J.L., Z.Z. and N.C.; methodology, H.L. and J.L.; validation, H.L., J.L. and Q.H.; formal analysis, H.L., J.L., Y.X., X.W. and Q.H.; investigation, H.L. and J.L.; data curation, H.L., J.L. and Q.H.; writing—original draft preparation, H.L., J.L., Y.X., X.W. and Q.H.; writing—review and editing, H.L., J.L., Y.X., X.W., Q.H., Z.Z., W.H. and N.C.; supervision, Z.Z., W.H., N.C. and S.W.; project administration, N.C. and S.W.; funding acquisition, N.C. and S.W. All authors have read and agreed to the published version of the manuscript.

Funding

This work was supported by the National Natural Science Foundation of China (32460544), Science and Technology Planning Project of Xinjiang Production and Construction Corps (2024ZD085), Tarim University-Nanjing Agricultural University Joint Foundation (NNLH202411), and Tarim University Graduate Research Innovation Project (TDGRI202321).

Data Availability Statement

Data are contained within the article.

Conflicts of Interest

The authors declare no conflicts of interest.

References

  1. National Bureau of Statistics Data. Available online: http://www.stats.gov.cn/ (accessed on 15 December 2024).
  2. Zhou, B.B.; Liu, Y.; Chen, X.P.; Ye, S.T.; Yao, P.; Liang, C.F. Effect of magnetic water irrigation on the improvement of salinized soil and cotton growth in Xinjiang. Agric. Water Manag. 2021, 248, 106784. [Google Scholar] [CrossRef]
  3. Feng, L.; Wan, S.M.; Zhang, Y.L.; Dong, H.Z. Xinjiang cotton: Achieving super-high yield through efficient utilization of light, heat, water, and fertilizer by three generations of cultivation technology systems. Field Crops Res. 2024, 312, 109401. [Google Scholar] [CrossRef]
  4. Navghare, N.R.; Age, A.B.; Pandao, M.R.; Kakade, S.U.; Rakhonde, O.S.; Bhosle, A.S. Effect of Various Levels of Phosphorus on Growth Attributing Characters, Yield and Nutrient Uptake by Cotton in Vertisol. Int. J. Plant Soil Sci. 2023, 35, 1086–1092. [Google Scholar] [CrossRef]
  5. Carreira, J.A.; Vinegla, B.; Lajtha, K. Secondary CaCO3 and precipitation of P-Ca compounds control the retention of soil P in arid ecosystems. J. Arid Environ. 2006, 64, 460–473. [Google Scholar] [CrossRef]
  6. Wang, B.; Liu, H.; Wang, X.H.; Li, J.M.; Ma, Y.B.; Ma, X.W. Soil phosphorus accumulation model for an arid area of north-western China with 3-year rotation of wheat, maize and cotton. J. Agric. Sci. 2014, 153, 1247–1256. [Google Scholar] [CrossRef]
  7. Wang, J.; Chen, Y.; Wang, P.; Li, Y.S.; Wang, G.; Liu, P.; Khan, A. Leaf gas exchange, phosphorus uptake, growth and yield responses of cotton cultivars to different phosphorus rates. Photosynthetica 2018, 56, 1414–1421. [Google Scholar] [CrossRef]
  8. Gao, F.; Li, Z.L.; Du, Y.P.; Duan, J.H.; Zhang, T.J.; Wei, Z.B.; Guo, L.; Gong, W.J.; Liu, Z.G.; Zhang, M. The combined application of urea and fulvic acid solution improved maize carbon and nitrogen metabolism. Agronomy 2022, 12, 1400. [Google Scholar] [CrossRef]
  9. Zhang, Z.X.; Ma, Y.T.; Tian, Y.; Liu, P.G.; Zhang, M.; Liu, Z.G.; Zhu, X.F.; Wang, C.H.; Zhuang, Y.Z.; Zhang, W.R.; et al. Co-Application of Coated Phosphate Fertilizer and Humic Acid for Wheat Production and Soil Nutrient Transport. Agronomy 2024, 14, 1621. [Google Scholar] [CrossRef]
  10. Raines, C.A. Increasing photosynthetic carbon assimilation in C3 plants to improve crop yield: Current and future strategies. Plant Physiol. 2011, 155, 36–42. [Google Scholar] [CrossRef]
  11. Wang, Y.; Liu, Z.Q.; Xiemuxiding, A.; Zhang, X.F.; Duan, L.S.; Li, R.Z. Fulvic Acid, Brassinolide, and Uniconazole Mediated Regulation of Morphological and Physiological Traits in Maize Seedlings Under Water Stress. J. Plant Growth Regul. 2022, 42, 1762–1774. [Google Scholar] [CrossRef]
  12. Roomi, S.; Masi, A.; Conselvan, G.B.; Trevisan, S.; Quaggiotti, S.; Pivato, M.; Arrigoni, G.; Yasmin, T.; Carletti, P. Protein Profiling of Arabidopsis Roots Treated with Humic Substances: Insights into the Metabolic and Interactome Networks. Front. Plant Sci. 2019, 9, 1812. [Google Scholar] [CrossRef] [PubMed]
  13. Ron, M.; Dorrity, M.W.; Lucas, M.; Toal, T.; Hernandez, R.L.; Stefan, A.; Maloof, J.N.; Kliebenstein, D.J.; Brady, S.M. Identification of novel loci regulating interspecific variation in root morphology and cellular development in Tomato. Plant Physiol. 2013, 162, 755–768. [Google Scholar] [CrossRef]
  14. Ruan, Y.L. Sucrose metabolism: Gateway to diverse carbon use and sugarsignaling. Annu. Rev. Plant Biol. 2014, 65, 33–67. [Google Scholar] [CrossRef]
  15. Wang, J.F.; Yang, X.Y.; Huang, S.M.; Wu, L.; Cai, Z.J.; Xu, M.G. Long-term combined application of organic and inorganic fertilizers increases crop yield sustainability by improving soil fertility in maize-wheat cropping systems. J. Integr. Agric. 2024, 24, 290–305. [Google Scholar] [CrossRef]
  16. Stevenson, F.J. Humus Chemistry: Genesis, Composition, Reactions; John Wiley and Sons: New York, NY, USA, 1994. [Google Scholar]
  17. Gerke, J. Review Article: The effect of humic substances on phosphate and iron acquisition by higher plants: Qualitative and quantitative aspects. J. Plant Nutr. Soil Sci. 2021, 184, 329–338. [Google Scholar] [CrossRef]
  18. Liang, Y.Y.; Wang, J.B.; Wang, Z.P.; Hu, D.S.; Jiang, Y.; Han, Y.L.; Wang, Y. Fulvic acid alleviates the stress of low nitrogen on maize by promoting root development and nitrogen metabolism. Physiol. Plant 2024, 176, e14249. [Google Scholar] [CrossRef]
  19. Zhang, K.; Gao, X.P.; Ma, C.; Chen, B.; Yuan, F.; Sheng, J.D. The Impact of Fulvic Acids on Cotton Growth, Yield and Phosphorus Fertilizer Use Efficiency Under Different Phosphorus Fertilization Rates in Xinjiang, China. Agronomy 2025, 15, 992. [Google Scholar] [CrossRef]
  20. Yang, F.; Sui, L.; Tang, C.Y.; Li, J.S.; Cheng, K.; Xue, Q. Sustainable advances on phosphorus utilization in soil via addition of biochar and humic substances. Sci. Total Environ. 2021, 768, 145106. [Google Scholar] [CrossRef]
  21. Iqbal, A.; Dong, Q.; Wang, X.R.; Gui, H.P.; Zhang, H.H.; Zhang, X.L.; Song, M.Z. Phosphorus and carbohydrate metabolism contributes to low phosphorus tolerance in cotton. BMC Plant Biol. 2023, 23, 97. [Google Scholar] [CrossRef]
  22. Chen, Q.; Qu, Z.M.; Ma, G.H.; Wang, W.J.; Dai, J.Y.; Zhang, M.; Wei, Z.B.; Liu, Z.G. Humic acid modulates growth, photosyn- thesis, hormone and osmolytes system of maize under drought conditions. Agric. Water Manag. 2022, 263, 107447. [Google Scholar] [CrossRef]
  23. Liu, Z.T.; Jin, W.; Wang, Q.; Hu, W.; Chen, B.L.; Meng, Y.L.; Yang, H.S.; Zhou, Z.G. Optimized boll-loading capacity of cotton root system increases seedcotton yield under wheat-cotton straw return with appropriate nitrogen fertilization. Crop J. 2025, 13, 576–586. [Google Scholar] [CrossRef]
  24. Tan, K.H. Humic Matter in Soil and the Environment: Principles and Controversies; CRC Press: Boca Raton, FL, USA, 2014. [Google Scholar]
  25. Zhang, Z.Q.; Gao, Q.; Xie, Z.L.; Yang, J.M.; Liu, J.H. Adsorption of nitrification inhibitor nitrapyrin by humic acid and fulvic acid in black soil: Characteristics and mechanism. RSC Adv. 2021, 11, 114–123. [Google Scholar] [CrossRef] [PubMed]
  26. Wang, Q.; Wang, J.W.; Huang, X.; Liu, Z.T.; Jin, W.; Hu, W.; Meng, Y.L.; Zhou, Z.G. Phosphorus application under continuous wheat-cotton straw retention enhanced cotton root productivity and seedcotton yield by improving the carbohydrate metabolism of root. Field Crops Res. 2024, 317, 109541. [Google Scholar] [CrossRef]
  27. Noor, H.; Yan, Z.; Sun, P.; Zhang, L.; Ding, P.; Li, L.; Ren, A.; Sun, M.; Gao, Z. Effects of nitrogen on photosynthetic productivity and yield quality of wheat (Triticum aestivum L.). Agronomy 2023, 13, 1448. [Google Scholar] [CrossRef]
  28. Fang, X.; Li, Y.; Nie, J.; Wang, C.; Huang, K.; Zhang, Y.; Zhang, Y.; She, H.; Liu, X.; Ruan, R.; et al. Effects of nitrogen fertilizer and planting density on the leaf photosynthetic characteristics, agronomic traits and grain yield in common buckwheat (Fagopyrum esculentum M.). Field Crops Res. 2018, 219, 160–168. [Google Scholar] [CrossRef]
  29. Echer, F.R.; Rosolem, C.A. Cotton yield and fiber quality affected by row spacing and shading at different growth stages. Eur. J. Agron. 2015, 65, 18–26. [Google Scholar] [CrossRef]
  30. Alarcon, V.J.; Sassenrath, G.F. Optimizing canopy photosynthetic rate through PAR modeling in cotton (Gossypium spp.) crops. Comput. Electron. Agric. 2015, 119, 142–152. [Google Scholar] [CrossRef]
  31. Chen, Y.Z.; Kong, X.Q.; Dong, H.Z. Removal of early fruiting branches impacts leaf senescence and yield by altering the sink/source ratio of field-grown Cotton. Field Crops Res. 2018, 216, 10–21. [Google Scholar] [CrossRef]
  32. Tung, S.A.; Huang, Y.; Ali, S.; Hafeez, A.; Shah, A.N.; Song, X.H.; Ma, X.L.; Luo, D.; Yang, G.Z. Mepiquat chloride application does not favor leaf photosynthesis and carbohydrate metabolism as well as lint yield in late-planted cotton at high plant density. Field Crops Res. 2018, 221, 108–118. [Google Scholar] [CrossRef]
  33. Brodrick, R.; Bange, M.P.; Milroy, S.P.; Hammer, G.L. Physiological determinants of high yielding ultra-narrow row cotton: Biomass accumulation and partitioning. Field Crops Res. 2012, 134, 122–129. [Google Scholar] [CrossRef]
  34. Kayoumu, M.; Li, X.T.; Iqbal, A.; Wang, X.R.; Gui, H.P.; Qi, Q.; Ruan, S.J.; Guo, R.S.; Dong, Q.; Zhang, X.L.; et al. Genetic variation in morphological traits in cotton and their roles in increasing phosphorus use efficiency in response to low phosphorus availability. Front. Plant Sci. 2022, 13, 1051080. [Google Scholar] [CrossRef] [PubMed]
  35. Fageria, N.K. Influence of dry matter and length of root on growth of five field crops at varying soil zinc and copper levels. J. Plant Nutr. 2005, 27, 1517–1523. [Google Scholar] [CrossRef]
  36. Dong, H.Z.; Mao, S.C.; Zhang, W.F.; Chen, D.H. On boll-setting optimization theory for cotton cultivation and its new development. Sci. Agric. 2014, 47, 441–451. [Google Scholar]
  37. Wells, R. Stem and root carbohydrate dynamics of two cotton cultivars bred fifty years apart. Agron. J. 2002, 94, 876–882. [Google Scholar] [CrossRef]
  38. Meng, T.Y.; Wei, H.H.; Li, X.Y.; Dai, Q.G.; Huo, Z.Y. A better root morphophysiology after heading contributing to yield superiority of japonica/indica hybrid rice. Field Crops Res. 2018, 228, 135–146. [Google Scholar] [CrossRef]
  39. Hu, Y.X.; Liu, J.J.; Lin, Y.; Xu, X.M.; Xia, Y.Q.; Bai, J.; Yu, Y.C.; Xiao, F.; Ding, Y.F.; Ding, C.Q.; et al. Sucrose nonfermenting-1-related protein kinase 1 regulates sheath-to-panicle transport of nonstructural carbohydrates during rice grain filling. Plant Physiol. 2022, 189, 1694–1714. [Google Scholar] [CrossRef]
  40. Teixeira, E.I.; Moot, D.J.; Mickelbart, M.V. Seasonal patterns of root C and N reserves of lucerne crops (Medicago sativa L.) grown in a temperate climate were affected by defoliation regime. Eur. J. Agron. 2007, 26, 10–20. [Google Scholar] [CrossRef]
  41. Nardi, S.; Schiavon, M.; Francioso, O. Chemical structure and biological activity of humic substances define their role as plant growth promoters. Molecules 2021, 26, 2256. [Google Scholar] [CrossRef]
Figure 1. Effects of fulvic acid combined with P fertilizer on cotton lint yield in 2023 and 2024. Different letters indicate significant differences among treatments at p < 0.05 by a Duncan test. CK, no P fertilizer; P1, 105 kg P2O5 ha−1; P2, 150 kg P2O5 ha−1; FP1, 105 kg P2O5 ha−1 + fulvic acid; FP2, 150 kg P2O5 ha−1 + fulvic acid.
Agronomy 15 01327 g001
Figure 2. Effects of fulvic acid combined with P fertilizer on leaf area index of cotton in 2023 (AD) and 2024 (EH). (A,E) represent the peak squaring stage, (B,F) represent the peak flowering stage, (C,G) represent the peak boll setting stage, (D,H) represent the boll opening stage, respectively. Different letters indicate significant difference among treatments at p < 0.05 by a Duncan test. CK, no P fertilizer; P1, 105 kg P2O5 ha−1; P2, 150 kg P2O5 ha−1; FP1, 105 kg P2O5 ha−1 + fulvic acid; FP2, 150 kg P2O5 ha−1 + fulvic acid.
Agronomy 15 01327 g002
Figure 3. Effects of fulvic acid combined with P fertilizer on cotton fractional interception of photosynthetically active radiation (IPAR, %) in 2023 (AD) and 2024 (EH). (A,E) represent the peak squaring stage, (B,F) represent the peak flowering stage, (C,G) represent the peak boll setting stage, (D,H) represent the boll opening stage, respectively. Different letters indicate significant difference among treatments at p < 0.05 by a Duncan test. CK, no P fertilizer; P1, 105 kg P2O5 ha−1; P2, 150 kg P2O5 ha−1; FP1, 105 kg P2O5 ha−1 + fulvic acid; FP2, 150 kg P2O5 ha−1 + fulvic acid.
Agronomy 15 01327 g003
Figure 4. Effects of fulvic acid combined with P fertilizer on the cotton photosynthetic capacity (CAP, μ mol CO2 m−2 s−1) in 2023 (AD) and 2024 (EH). (A,E) represent the peak squaring stage, (B,F) represent the peak flowering stage, (C,G) represent the peak boll setting stage, (D,H) represent the boll opening stage, respectively. Different letters indicate significant difference among treatments at p < 0.05 by a Duncan test. CK, no P fertilizer; P1, 105 kg P2O5 ha−1; P2, 150 kg P2O5 ha−1; FP1, 105 kg P2O5 ha−1 + fulvic acid; FP2, 150 kg P2O5 ha−1 + fulvic acid.
Agronomy 15 01327 g004
Figure 5. Effects of fulvic acid combined with P fertilizer on the ratio of roots and shoots in 2023 (AD) and 2024 (EH). (A,E) represent the peak squaring stage, (B,F) represent the peak flowering stage, (C,G) represent the peak boll setting stage, (D,H) represent the boll opening stage, respectively. Different letters indicate significant difference among treatments at p < 0.05 by a Duncan test. CK, no P fertilizer; P1, 105 kg P2O5 ha−1; P2, 150 kg P2O5 ha−1; FP1, 105 kg P2O5 ha−1 + fulvic acid; FP2, 150 kg P2O5 ha−1 + fulvic acid.
Agronomy 15 01327 g005
Figure 6. Effects of fulvic acid combined with P fertilizer on boll capacity of the root system in 2023 (AC) and 2024 (DF). (A,D) represent the peak flowering stage, (B,E) represent the peak boll setting stage, (C,G) represent the boll opening stage, respectively. Different letters indicate significant difference among treatments at p < 0.05 by a Duncan test. CK, no P fertilizer; P1, 105 kg P2O5 ha−1; P2, 150 kg P2O5 ha−1; FP1, 105 kg P2O5 ha−1 + fulvic acid; FP2, 150 kg P2O5 ha−1 + fulvic acid.
Agronomy 15 01327 g006
Figure 7. Effects of fulvic acid combined with P fertilizer on boll loading of the root system in 2023 (AC) and 2024 (DF). (A,D) represent the peak flowering stage, (B,E) represent the peak boll setting stage, (C,G) represent the boll opening stage, respectively. Different letters indicate significant difference among treatments at p < 0.05 by a Duncan test. CK, no P fertilizer; P1, 105 kg P2O5 ha−1; P2, 150 kg P2O5 ha−1; FP1, 105 kg P2O5 ha−1 + fulvic acid; FP2, 150 kg P2O5 ha−1 + fulvic acid.
Agronomy 15 01327 g007
Figure 8. Effects of fulvic acid combined with P fertilizer on cotton root fructose content in 2023 (AD) and 2024 (EH). (A,E) represent the peak squaring stage, (B,F) represent the peak flowering stage, (C,G) represent the peak boll setting stage, (D,H) represent the boll opening stage, respectively. Different letters indicate significant difference among treatments at p < 0.05 by a Duncan test. CK, no P fertilizer; P1, 105 kg P2O5 ha−1; P2, 150 kg P2O5 ha−1; FP1, 105 kg P2O5 ha−1 + fulvic acid; FP2, 150 kg P2O5 ha−1 + fulvic acid.
Agronomy 15 01327 g008
Figure 9. Effects of fulvic acid combined with P fertilizer on cotton root glucose content in 2023 (AD) and 2024 (EH). (A,E) represent the peak squaring stage, (B,F) represent the peak flowering stage, (C,G) represent the peak boll setting stage, (D,H) represent the boll opening stage, respectively. Different letters indicate significant difference among treatments at p < 0.05 by a Duncan test. CK, no P fertilizer; P1, 105 kg P2O5 ha−1; P2, 150 kg P2O5 ha−1; FP1, 105 kg P2O5 ha−1 + fulvic acid; FP2, 150 kg P2O5 ha−1 + fulvic acid.
Agronomy 15 01327 g009
Figure 10. Effects of fulvic acid combined with P fertilizer on cotton root sucrose content in 2023 (AD) and 2024 (EH). (A,E) represent the peak squaring stage, (B,F) represent the peak flowering stage, (C,G) represent the peak boll setting stage, (D,H) represent the boll opening stage, respectively. Different letters indicate significant difference among treatments at p < 0.05 by a Duncan test. CK, no P fertilizer; P1, 105 kg P2O5 ha−1; P2, 150 kg P2O5 ha−1; FP1, 105 kg P2O5 ha−1 + fulvic acid; FP2, 150 kg P2O5 ha−1 + fulvic acid.
Agronomy 15 01327 g010
Figure 11. Effects of fulvic acid combined with P fertilizer on cotton root starch content in 2023 (AD) and 2024 (EH). (A,E) represent the peak squaring stage, (B,F) represent the peak flowering stage, (C,G) represent the peak boll setting stage, (D,H) represent the boll opening stage, respectively. Different letters indicate significant difference among treatments at p < 0.05 by a Duncan test. CK, no P fertilizer; P1, 105 kg P2O5 ha−1; P2, 150 kg P2O5 ha−1; FP1, 105 kg P2O5 ha−1 + fulvic acid; FP2, 150 kg P2O5 ha−1 + fulvic acid.
Agronomy 15 01327 g011
Figure 12. Correlation analysis of cotton lint yield, the photosynthetic capacity of the cotton population, root productivity, and carbohydrate contents in cotton roots. Correlation coefficients vary from 1.0 (red) to −1.0 (blue). * and ** represent significant differences at p < 0.05 and p < 0.01 probability level. LAI, leaf area index; IPAR, cotton fractional interception of photosynthetically active radiation; CAP, cotton photosynthetic capacity; R/S, root–shoot ratio; BCR, boll capacity of the root system; BLR, boll loading of the root system; VB, Vegetative organ; RB, Reproductive organ; LY, cotton lint yield.
Agronomy 15 01327 g012
Table 1. Effects of fulvic acid combined with P fertilizer on cotton vegetative and reproductive organs biomass (t ha−1) in 2023 and 2024.
2023TreatmentVegetative organReproductive organ
PSSPFSPBSBOSPSSPFSPBSBOS
CK2.1 c4.6 c7.6 e9.7 e0.3 b1.8 d6.0 d9.2 d
P12.3 b6.4 b9.2 d11.0 d0.3 a2.1 c9.4 c11.1 c
P22.6 a6.7 a9.5 c11.6 c0.3 a2.3 b9.7 b11.7 b
FP12.6 a6.8 a9.8 b11.7 b0.4 a2.3 a10.8 a13.8 a
FP22.6 a6.8 a10.0 a12.0 a0.4 a2.3 a9.7 b11.6 b
2024TreatmentVegetative organReproductive organ
PSSPFSPBSBOSPSSPFSPBSBOS
CK2.2 d3.4 d6.1 d7.6 e0.2 c1.8 c5.6 d9.4 d
P12.8 c5.6 c9.1 c11.5 d0.3 b2.3 b9.1 c10.9 c
P23.0 b6.1 b9.5 b12.0 c0.4 a2.5 ab9.6 b12.4 b
FP13.1 a6.2 a9.6 b12.1 b0.4 a2.7 a10.9 a13.2 a
FP23.1 ab6.2 a9.9 a12.3 a0.4 a2.7 a9.6 b11.4 c
PSS, peak squaring stage, PFS, peak flowering stage, PBS, peak boll setting stage, BOS, boll opening stage. Data are shown in mean value (n = 3). Different letters within the same column indicate significant difference at p < 0.05. CK, no P fertilizer; P1, 105 kg P2O5 ha−1; P2, 150 kg P2O5 ha−1; FP1, 105 kg P2O5 ha−1 + fulvic acid; FP2, 150 kg P2O5 ha−1 + fulvic acid.
Disclaimer/Publisher’s Note: The statements, opinions and data contained in all publications are solely those of the individual author(s) and contributor(s) and not of MDPI and/or the editor(s). MDPI and/or the editor(s) disclaim responsibility for any injury to people or property resulting from any ideas, methods, instructions or products referred to in the content.

