Article

Genome-Wide Identification and Expression Analysis of MYB Transcription Factors Involved in Lignin Biosynthesis in Elephant Grass (Cenchrus purpureus)

Guangxi Key Laboratory of Animal Breeding, Disease Control and Prevention, Guangxi Grass Station, College of Animal Science and Technology, Guangxi University, Nanning 530004, China
*
Author to whom correspondence should be addressed.
Agronomy 2025, 15(6), 1326; https://doi.org/10.3390/agronomy15061326
Submission received: 6 May 2025 / Revised: 26 May 2025 / Accepted: 28 May 2025 / Published: 29 May 2025
(This article belongs to the Section Grassland and Pasture Science)

Abstract

:
Elephant grass (Cenchrus purpureus) is an important forage crop hindered by high lignin content. Although MYB transcription factors (TFs) regulate lignin biosynthesis, their roles in elephant grass remain unclear. In this study, we identified 247 CpMYB TFs through whole-genome bioinformatic analysis of elephant grass and classified them into 23 phylogenetic subgroups. Among them, 233 were mapped to 14 chromosomes, and 14 to unanchored contigs. Gene structure, conserved motifs, and domain analyses revealed subgroup-specific conservation and CpMYB proteins dominated by random coils and α-helices. Gene duplication and selection pressure analyses indicated that segmental duplication predominantly contributed to family expansion. Transcriptome analysis identified 48 CpMYB genes differentially expressed in internodes at least one of three developmental stages, with promoters containing various growth-, phytohormone-, and stress-related cis-elements. Additionally, nine CpMYB genes were consistently differentially expressed across all three stages, and predicted protein–DNA interaction suggested that four of them (CpMYB094, CpMYB131, CpMYB145, and CpMYB148) potentially regulate key lignin biosynthetic genes, including 4-coumarate:CoA ligase 1 (4CL1), hydroxycinnamoyl transferase (HCT), caffeoyl-CoA O-methyltransferase 1/7 (CCoAOMT1/7), and reduced epidermal fluorescence 3 (REF3). However, their regulatory functions require further experimental validation. Overall, this study characterizes the CpMYB family in elephant grass and highlights their potential roles in lignin biosynthesis.

1. Introduction

Lignin is a complex phenolic polymer composed of p-coumaryl (H), coniferyl (G), and sinapyl (S) alcohols [1], and serves as a key structural component of plant cell walls, providing mechanical strength, hydrophobicity, and resistance to environmental stresses [2,3]. However, in forage crops, both lignin content and the monomer composition ratio (H:G:S) play a critical role in determining nutritional quality by influencing cell wall digestibility [4,5]. Such adverse effects have been documented in species such as alfalfa (Medicago sativa) and switchgrass (Panicum virgatum), while low-lignin sorghum (Sorghum bicolor) mutants exhibit improved fiber digestibility and enhanced animal performance [6,7,8]. Specifically, a higher proportion of S-units in alfalfa can increase neutral detergent fiber digestibility (NDFD) by 15–20%, whereas a predominance of G-units in switchgrass has been associated with reduced digestibility [6,7]. These findings underscore the pivotal role of lignin composition—particularly the H:G:S ratio—in determining forage quality. Therefore, elucidating the molecular mechanisms of lignin biosynthesis is essential for the development of high-digestibility forage crops.
Lignin biosynthesis is a multidimensionally regulated metabolic pathway that initiates with phenylpropanoid metabolism in the cytoplasm and culminates in monolignol polymerization in the cell wall [9,10]. The process starts with phenylalanine undergoing deamination by phenylalanine ammonia-lyase (PAL) to form cinnamic acid. This compound is subsequently hydroxylated and methylated to produce the three primary monolignol precursors: H, G, and S. The key enzymes involved in this pathway include cinnamate 4-hydroxylase, 4-coumarate-CoA ligase (4CL), cinnamoyl-CoA reductase, and cinnamyl alcohol dehydrogenase (CAD). These monolignols are then transported to the cell wall, where they undergo oxidative polymerization, catalyzed by peroxidases and laccases, to form the complex lignin polymer [11,12,13]. However, lignin biosynthesis is not solely governed by enzymatic activity; rather, it is tightly controlled at the transcriptional level to coordinate lignin deposition in response to both developmental cues and environmental stimuli.
Transcription factors (TFs), especially those from the MYB, NAC, WRKY, and bHLH families, are key regulators of lignin biosynthesis, as they control the expression of biosynthetic genes and thereby influence lignin content and composition [10]. These TFs recognize specific promoter sequences to modulate gene expression, affecting various aspects of plant growth and stress responses [14]. For instance, in Arabidopsis (Arabidopsis thaliana), the MYB TF MYB103 regulates the expression of F5H, a key enzyme gene in the monolignol biosynthetic pathway, and influences the biosynthesis of S-lignin monomers [15]. Similarly, the NAC TF VND6 in Arabidopsis and the WRKY TF PtrWRKY19 in Populus trichocarpa coordinately modulate lignin deposition by regulating the transcription of downstream biosynthetic enzyme genes [16,17]. Furthermore, in Chrysanthemum (Chrysanthemum morifolium), the CmbHLH TF CmHLB interacts with CmKNAT7 to negatively regulate secondary cell wall formation in fibers and lignin biosynthesis, thereby affecting stem mechanical strength [18]. Therefore, understanding the characteristics and regulatory roles of TFs is essential for elucidating the molecular mechanisms underlying lignin biosynthesis in plants.
The MYB TF family, one of the largest and most functionally diverse in plants, functions as a major regulator of lignin biosynthesis and governs a wide range of biological processes, including abiotic stress responses, growth, development, and hormonal signaling [19,20,21]. MYB TFs are characterized by a highly conserved MYB DNA-binding domain located at the N-terminus, consisting of up to four adjacent repeats. Each repeat is approximately 52 amino acids long and forms three α-helices [22]. Based on the number of MYB repeats, MYB TFs in model species such as Arabidopsis and rice (Oryza sativa) are classified into four main types: 1R-MYB, 2R-MYB, 3R-MYB, and 4R-MYB [23]. Among these, R2R3-MYB proteins are the most abundant and functionally diverse, with 126 members identified in Arabidopsis and 109 in rice. Functionally, these R2R3-MYB proteins regulate primary and secondary metabolism, development, and responses to environmental stimuli, whereas the roles of the less common 3R-MYB and 4R-MYB proteins remain largely unclear [24,25]. In the context of lignin biosynthesis, MYB TFs primarily regulate the expression of genes encoding lignin biosynthetic enzymes [26,27]. For example, in Arabidopsis, AtMYB58 and AtMYB63 directly activate key genes in the monolignol biosynthetic pathway, such as LAC4, CCoAOMT1, and HCT by binding to AC elements, leading to increased accumulation of G- and S-type lignin monomers [28]. Similarly, in poplar (Populus trichocarpa), PtrMYB152 interacts with NAC TFs to upregulate lignin biosynthesis during secondary cell wall formation [29]. Despite substantial progress in understanding MYB-mediated lignin regulation in model plants and woody species, little is known about the functions of MYB TFs in lignin biosynthesis in tropical forage grasses.
Elephant grass (Cenchrus purpureus), also known as napier grass, is a highly productive tropical forage grass valued for its high biomass yield, perennial growth habit, and adaptability to soils [30,31,32]. However, the high lignin content in elephant grass stems (approximately 12% of dry weight) significantly reduces forage digestibility, consequently limiting its nutritional value as livestock feed [33,34]. With the recent publication of the elephant grass genome, some progress has been made in understanding stress responses in this species, such as the involvement of the MATE gene family in response to aluminum stress, the WRKY gene family in cold stress tolerance, and the RWP-RK gene family in enhancing heat stress adaptation [35,36,37]. However, the transcriptional regulation of lignin biosynthesis in elephant grass remains poorly understood, especially for the MYB TF family, well known in other species as key regulators of lignin biosynthesis [28,29]. To bridge this gap in understanding the molecular mechanisms regulating lignin biosynthesis in elephant grass, we conducted a comprehensive analysis of the CpMYB TF family, including gene identification, chromosomal localization, phylogenetic classification, gene structure and conserved motifs analysis. Protein structure modeling and synteny analysis were performed to explore evolutionary relationships. Insights into their functional roles were gained by analyzing expression patterns across tissues and developmental stages, investigating cis-regulatory elements, validating via RT-qPCR, and examining gene expression correlations. Finally, we constructed protein–protein interaction (PPI) and protein–DNA interaction (PDI) networks to uncover regulatory pathways involving CpMYB TFs. This study presents the first comprehensive analysis of MYB TFs in elephant grass and identifies candidates potentially involved in lignin biosynthesis. It enhances the understanding of lignin-related transcriptional regulation in elephant grass and offers gene resources for future functional studies.

2. Materials and Methods

2.1. Identification and Analysis of CpMYB TFs

The genomic sequences of elephant grass were obtained from the China National Center for Bioinformation (https://www.cncb.ac.cn/, accessed on 8 October 2024) under the accession number GWHAORA00000000 [38]. Reference sequences of MYB TFs from Arabidopsis, rice, and maize (Zea mays) were retrieved from the Plant Transcription Factor Database (https://planttfdb.gao-lab.org/, accessed on 8 October 2024) [39], and their Locus IDs are listed in Table S1. Additionally, the Hidden Markov Model (HMM) seed file corresponding to the MYB DNA-binding domain (PF00249) was acquired from the Pfam database (http://pfam-legacy.xfam.org/, accessed on 10 October 2024) [40]. The identification of MYB family proteins in elephant grass was performed through a comprehensive bioinformatics pipeline. Initially, the genomic dataset was queried using local BLASTP (v2.12.0+) with reference MYB sequences to identify putative candidates [41]. The HMMER (v3.0) suite was employed for domain detection, applying stringent thresholds (HMM score > 90, E-value < 10−5) to ensure high-confidence predictions [42]. Further validation was conducted using InterProScan (http://www.ebi.ac.uk/interpro/, accessed on 15 October 2024) and the Conserved Domain Database (https://www.ncbi.nlm.nih.gov/Structure/cdd/wrpsb.cgi, accessed on 16 October 2024) [43,44], with proteins lacking the MYB DNA-binding domain excluded from subsequent analyses.
For functional annotation, the physicochemical characteristics of the identified CpMYB proteins—including amino acid composition, molecular weight, and isoelectric point (pI)—were predicted using the ProtParam tool integrated into the Expasy server (https://web.expasy.org/protparam/, accessed on 30 October 2024) [45]. Subcellular localization of the CpMYB proteins was predicted using WoLF PSORT (https://wolfpsort.hgc.jp/, accessed on 30 October 2024) to infer the likely cellular compartments of the CpMYB proteins [46].

2.2. Chromosomal Location of CpMYBs

Chromosomal locations of CpMYB genes within the elephant grass genome were determined using MapGene2Chrom (http://mg2c.iask.in/mg2c_v2.0/, accessed on 5 November 2024) [47], providing comprehensive distribution and mapping based on the elephant grass genome annotation file.

2.3. Classification and Phylogenetic Analysis

Protein sequences of CpMYB TFs were aligned using ClustalW in MEGA 7 (v7.0.26) [48]. Phylogenetic analysis was subsequently conducted in MEGA 7 (v7.0.26) using the Neighbor-Joining (NJ) method with 1000 bootstrap replications, the p-distance substitution model, and pairwise deletion for gap treatment. Phylogenetic subgroups were classified based on conserved domain architecture and sequence homology, following established MYB classification schemes [49,50], and the final tree was visualized and annotated using iTOL (https://itol.embl.de/, accessed on 20 November 2024) [51].

2.4. Gene Structure, Domain Location, and Motif Distribution of CpMYBs

Gene structure information, including exon-intron arrangements of CpMYB genes, were obtained from genome annotation files using TBtools-II (v2.147) [52]. Conserved domains were identified using the Conserved Domain database and visualized accordingly. Moreover, MEME (https://meme-suite.org/meme/tools/meme, accessed on 1 December 2024) was employed to predict conserved motifs in CpMYB proteins, with the parameters set to detect 10 motifs of 6–200 amino acids in length [53]. The biological functions of the conserved motifs were annotated using the InterPro database (http://www.ebi.ac.uk/interpro/, accessed on 24 May 2025) [44].

2.5. Structural Modeling and Analysis of CpMYB TFs

The three-dimensional structures of CpMYB proteins were modeled on the SWISS-MODEL platform (https://swissmodel.expasy.org/, accessed on 8 March 2025), and their quality was assessed based on the Global Model Quality Estimation (GMQE) score [54]. Secondary structure analysis was performed using the SOPMA tool (https://npsa.lyon.inserm.fr/cgi-bin/npsa_automat.pl?page=/NPSA/npsa_server.html, accessed on 8 March 2025) [55].

2.6. Synteny, and Selective Pressure Analysis of CpMYB Genes

Gene duplication events and collinearity relationships were analyzed using TBtools-II, including intra-species analysis of elephant grass and inter-species comparisons with Arabidopsis, maize, sorghum, and rice. Furthermore, TBtools-II (v2.147) was used to calculate the nonsynonymous substitution rate (Ka), synonymous substitution rate (Ks), and Ka/Ks ratio for each pair of duplicated genes. These values were further analyzed and visualized using Origin 2021 to elucidate the evolutionary dynamics of CpMYB genes.

2.7. Expression Analysis of CpMYB Genes Across Tissues and Developmental Stages

For tissue-specific analysis, gene expression datasets covering root, leaf, flower, stem, and stem tip tissues were obtained from the MilletDB database (http://milletdb.novogene.com/home, accessed on 5 January 2025) to assess CpMYB gene expression across tissues [56], measured in Transcripts Per Million (TPM). For developmental stage analysis, gene expression data from elephant grass internodes at three developmental stages were retrieved from a publicly available study to examine the expression patterns of CpMYB genes [34], measured in Fragments Per Kilobase of transcript per Million mapped reads (FPKM). The three developmental stages corresponded to 40 days (T1), 80 days (T2), and 120 days (T3) after planting. Internodes were sequentially labeled from the stem base (S1) to the apex (S5) according to the following sampling scheme: three internodes at T1 (T1-S1, T1-S2, and T1-S3), four at T2 (T2-S1, T2-S2, T2-S3, and T2-S4), and five at T3 (T3-S1, T3-S2, T3-S3, T3-S4, and T3-S5). Differentially expressed genes (DEGs) were identified using the DESeq2 (v1.42.0) software, with the adjusted criteria set to |log2FoldChange| ≥ 1 and false discovery rate (FDR) < 0.05 [57]. Furthermore, the expression profiles of CpMYB genes were extracted and visualized as heatmaps using TBtools-II. All expression values were log2 (X) transformed for normalization, followed by Z-scores transformation to normalize the expression of each gene across different tissues or internodes. Correlation analysis was conducted using Origin 2021.

2.8. Promoter Cis-Regulatory Elements Analysis of CpMYB Family

Upstream promoter regions (2000 bp) of CpMYB genes were extracted using the GFF3 Sequences Extract tool in TBtools-II. These sequences were analyzed in the PlantCARE database (https://bioinformatics.psb.ugent.be/webtools/plantcare/html/, accessed on 20 January 2025) to identify and predict cis-acting regulatory elements [58]. Functionally characterized cis-regulatory elements were screened and quantified, and the types and distribution of these elements within the first 2000 bp of 48 CpMYB DEGs promoters were analyzed.

2.9. Protein-Protein and Protein-DNA Interaction Network Analysis

The PPI network of the nine CpMYB TFs was predicted using the STRING database (http://string-db.org, accessed on 10 February 2025) [59]. Since information specific to elephant grass is not available in these databases, the predictions were based on the homologous proteins of CpMYB TFs in Arabidopsis. Furthermore, potential target genes were identified using the AGRIS database (https://agris-knowledgebase.org/regcollection, accessed on 15 February 2025) [60], and a PDI network was constructed and visualized using Cytoscape software (v3.10.2).

2.10. Plant Material

The elephant grass cultivar ‘cv. Purple’ was cultivated and provided by the Grass Technological Innovation Research Center and the Regional Center for Grassland Genetic Resources at Guangxi Vocational University of Agriculture. Consistent with the RNA-seq sampling scheme, internode materials were collected at three developmental stages: 40 days (T1), 80 days (T2), and 120 days (T3) after planting. Internodes were sequentially labeled from the stem base (S1) to the apex, with three, four, and five internodes sampled at T1, T2, and T3, respectively. All collected materials were immediately flash-frozen in liquid nitrogen and stored at −80 °C until further analysis.

2.11. RNA Extraction and RT-qPCR Analysis

Six CpMYB genes (CpMYB004, CpMYB059, CpMYB094, CpMYB145, CpMYB148, and CpMYB150) were randomly chosen from the nine CpMYB DEGs that were differentially expressed across all three developmental stages of elephant grass for further RT-qPCR analysis. Total RNA was extracted from internode samples mentioned above using Trizol reagent (Sangon Biotech, Shanghai, China). First-strand cDNA was synthesized using the MightyScript Plus First Strand cDNA Synthesis Master Mix (gDNA digester) (Sangon Biotech, Shanghai, China). Quantitative PCR was performed on a LightCycler 480 II Real-Time PCR System (Roche Diagnostics, Basel, Switzerland) using the 2x SG Fast qPCR Master Mix (Sangon Biotech, Shanghai, China), following the manufacturer’s instructions. Primers were designed according to standard criteria: length of 16–22 bp, GC content of 40–60%, amplicon length of 80–200 bp, and Tm of 58–62 °C with a difference of less than 1 °C between primer pairs. Primer design also avoided primer dimers and hairpin structures and spanned exon–exon junctions to prevent amplification of genomic DNA. CpActin (GWHTAORA046352) served as the reference gene, and gene-specific primers were used for amplification (Table S2). Relative gene expression levels were calculated using the 2−ΔΔCt method [61].

3. Results

3.1. Identification and Characterization of MYB Genes in Elephant Grass

A total of 247 non-redundant MYB TFs were identified in the elephant grass genome and systematically renamed from CpMYB001 to CpMYB247 based on their chromosomal location (Table S3). Physicochemical properties of CpMYB proteins were analyzed using the Expasy-ProtParam tool (Table S4), revealing a wide range of characteristics: including protein lengths ranging from 126 amino acids (CpMYB220) to 1448 amino acids (CpMYB160) (Figure 1A), molecular weights ranging from 14.02 kDa (CpMYB220) to 156.26 kDa (CpMYB160) (Figure 1B), and isoelectric points (pIs) spanned from 4.61 (CpMYB093) to 11.86 (CpMYB205). Protein stability analysis classified two CpMYB proteins as stable (instability index < 40.0), while the remaining 245 were predicted to be unstable. Subcellular localization predictions indicated nuclear localization for all CpMYB proteins (Table S4).

3.2. Chromosomal Distribution of CpMYB Genes

The chromosomal distribution of CpMYB genes in elephant grass was analyzed using the species-specific genome annotation file. Of the 247 identified CpMYB genes, 233 were mapped to 14 chromosomes, showing an uneven distribution (Figure 1C), while the remaining 14 genes were located on unassembled contigs (Figure S1). ChrB01 contained the highest number of CpMYB genes (34). In contrast, Chromosome B7 (ChrB07) harbored the fewest CpMYB genes (4). The remaining chromosomes showed varying gene counts: ChrA1 contained 28, ChrB2 26, ChrA7 21, ChrA5 18, ChrA3 and ChrA4 each contained 15, ChrA2 14, ChrB6 11, ChrB5 10, ChrB3 and ChrB4 each contained 9, and ChrA6 contained 6 genes.

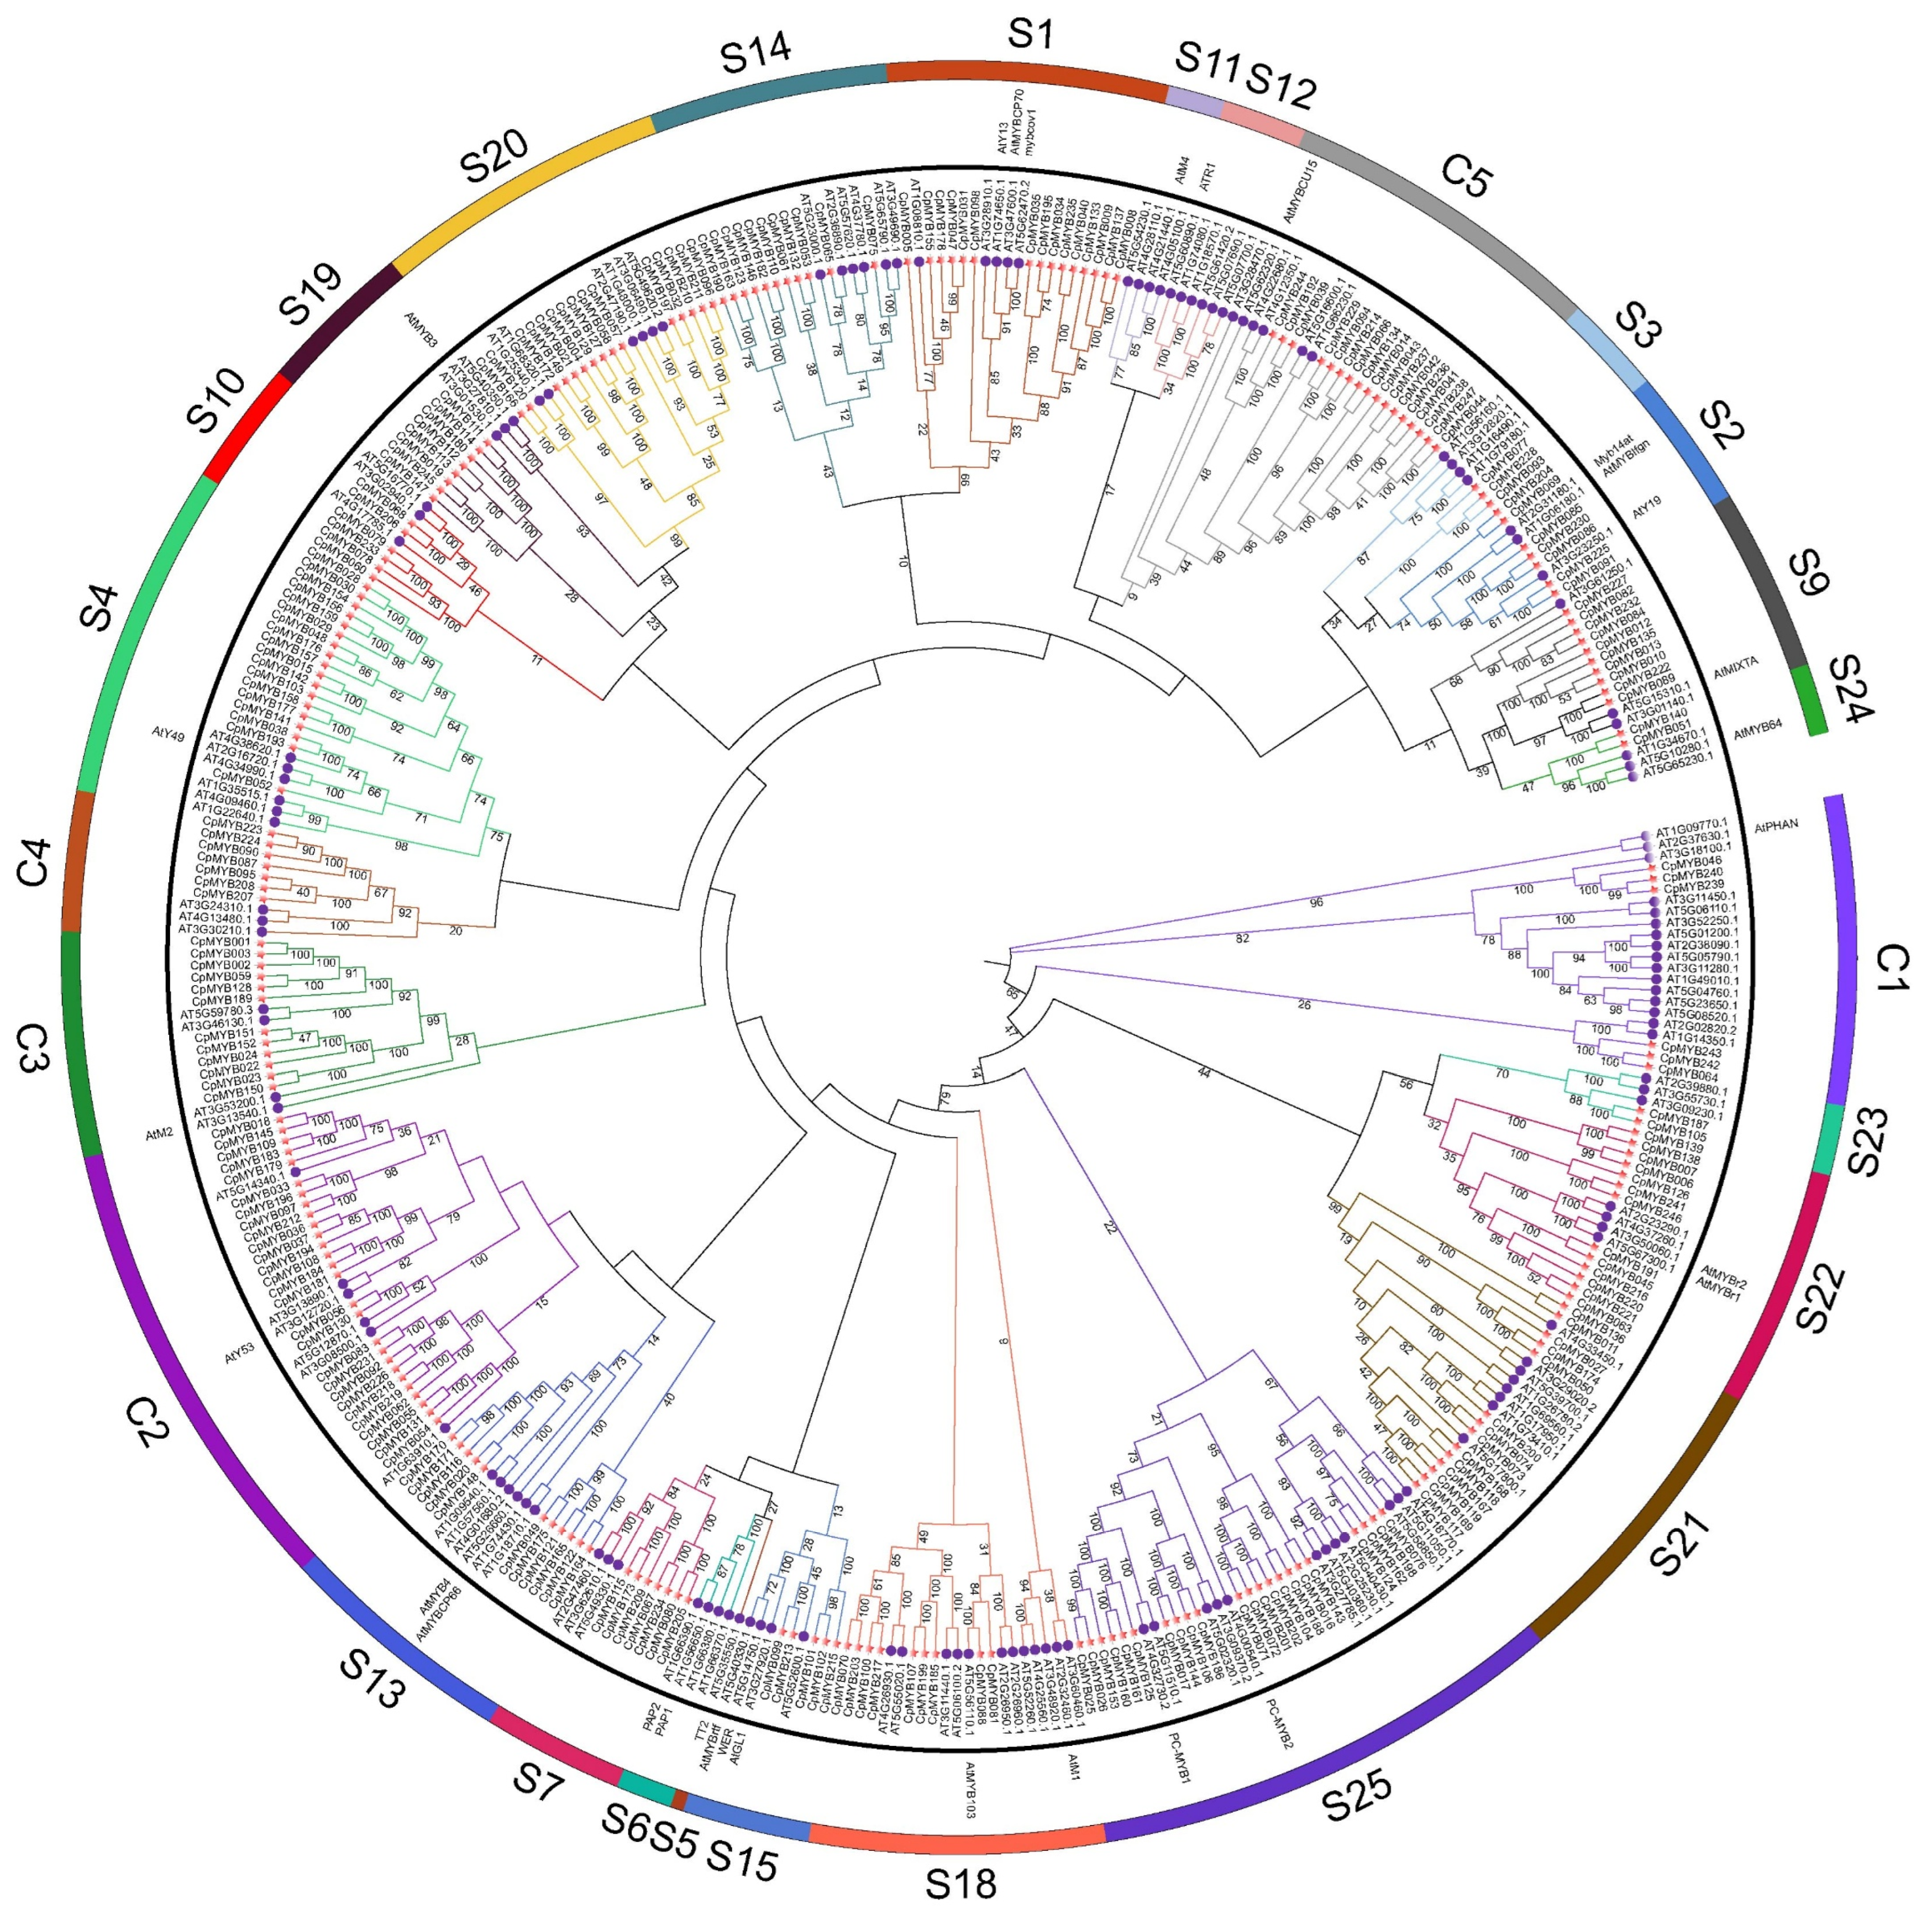
3.3. Classification and Phylogenetic Analysis of CpMYBs

With the objective of revealing the evolutionary history of CpMYB TFs, a phylogenetic tree was constructed using the NJ method with 1000 bootstrap replicates, based on 391 MYB protein sequences—247 from elephant grass and 144 from Arabidopsis. These sequences were classified into 27 distinct subgroups (Figure 2). Among them, subgroups S23 and S24 contained the fewest CpMYB members, with only two members each, whereas subgroup C2 contained the most, comprising 27 CpMYB members. Four subgroups (S5, S6, S11, and S12) consisted exclusively of Arabidopsis MYB proteins, with no corresponding members from elephant grass. However, no subgroup was found to contain only CpMYB members.

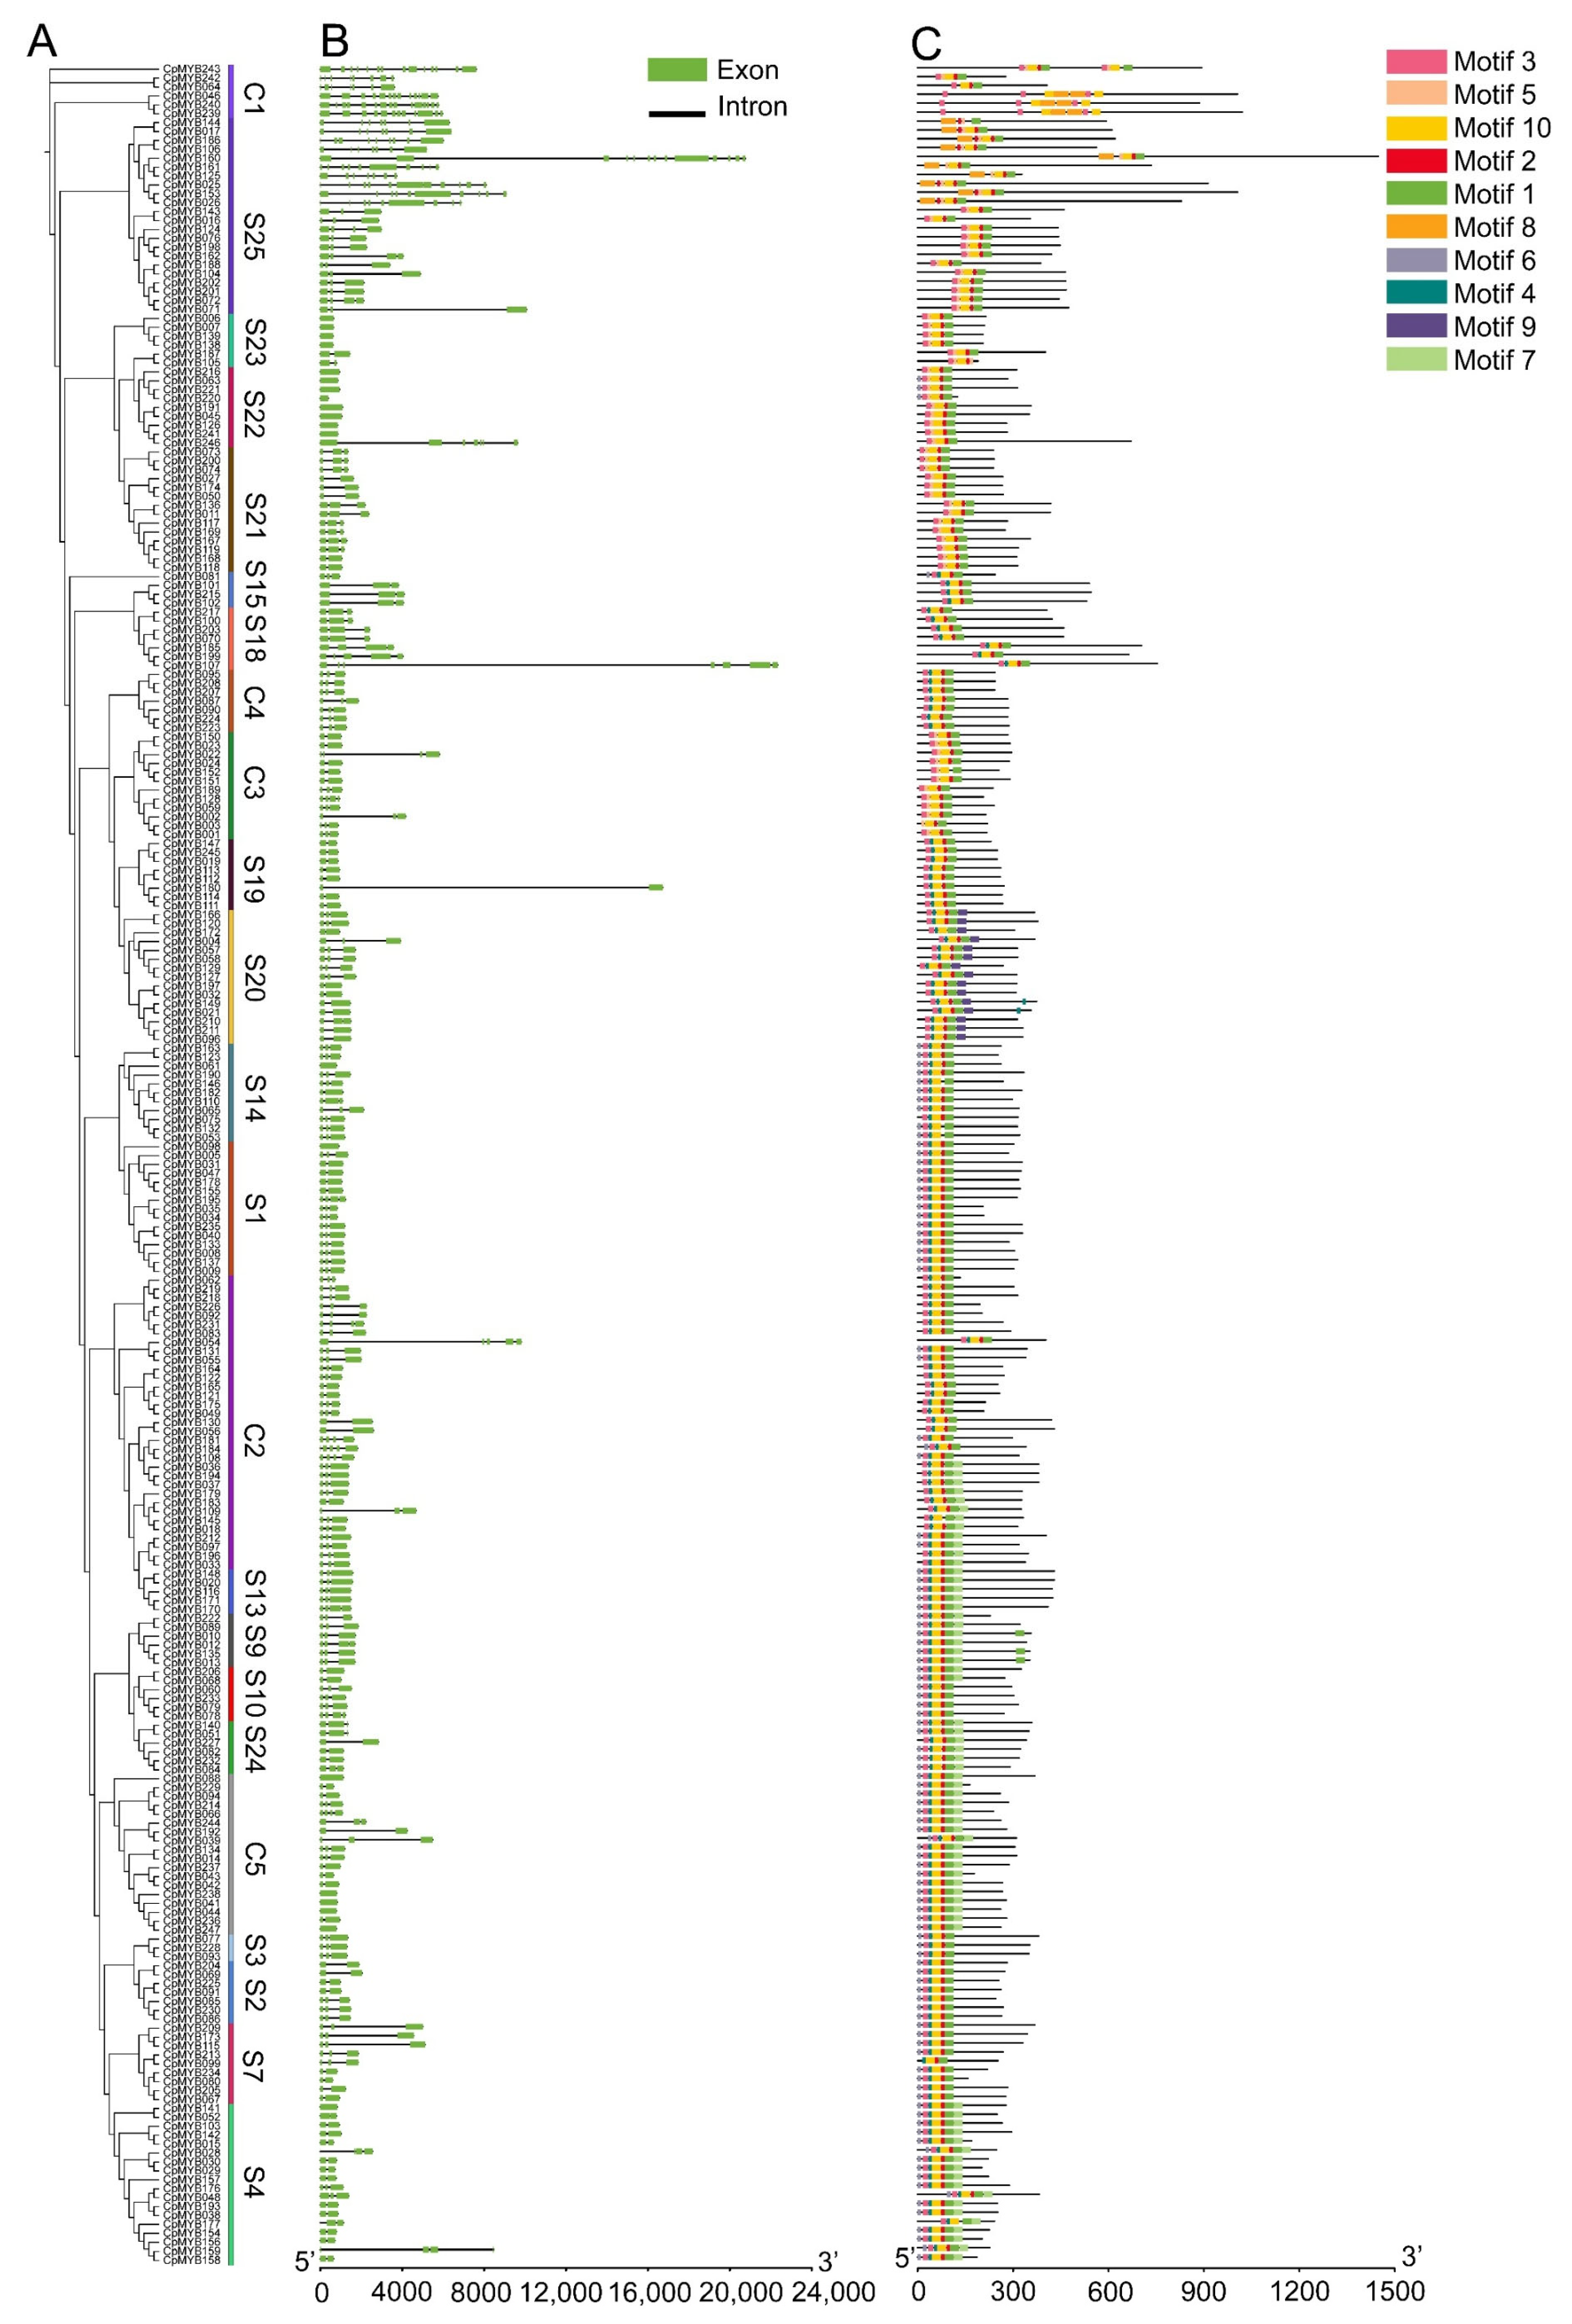
3.4. Gene Structure and Conserved Motif Analysis of CpMYB Genes

Phylogenetic analysis classified 247 CpMYB TFs in elephant grass into 23 evolutionarily distinct subfamilies (Figure 3A). Gene structure analysis revealed that 19 CpMYB genes (7.7%) were intronless, while 8 of the 9 members in subgroup S22 had a single exon and lacked introns (Figure 3B). CpMYB240 possessed the highest number of exons, totaling 15. CpMYB genes in subgroup C1 typically contained more exons (ranging from 7 to 15), while 8 out of the 9 members in subgroup S22 had only a single exon and lacked introns entirely. MEME identified 10 conserved motifs (Motifs 1–10) among the CpMYB proteins, with distinct distribution patterns across different subgroups (Figure 3C). Each CpMYB protein contained between four and ten motifs, motif 2 was shared by all members, whereas motif 9 was unique to subgroup S20. The functional annotation of the identified motifs revealed that Motifs 1, 2, 3, and 8 showed high similarity to the MYB DNA-binding domain (Table S5). Domain architecture validation confirmed that all predicted CpMYB proteins contained the conserved MYB DNA-binding domain (Figure S2), which was predominantly located at the N-terminus of the proteins.

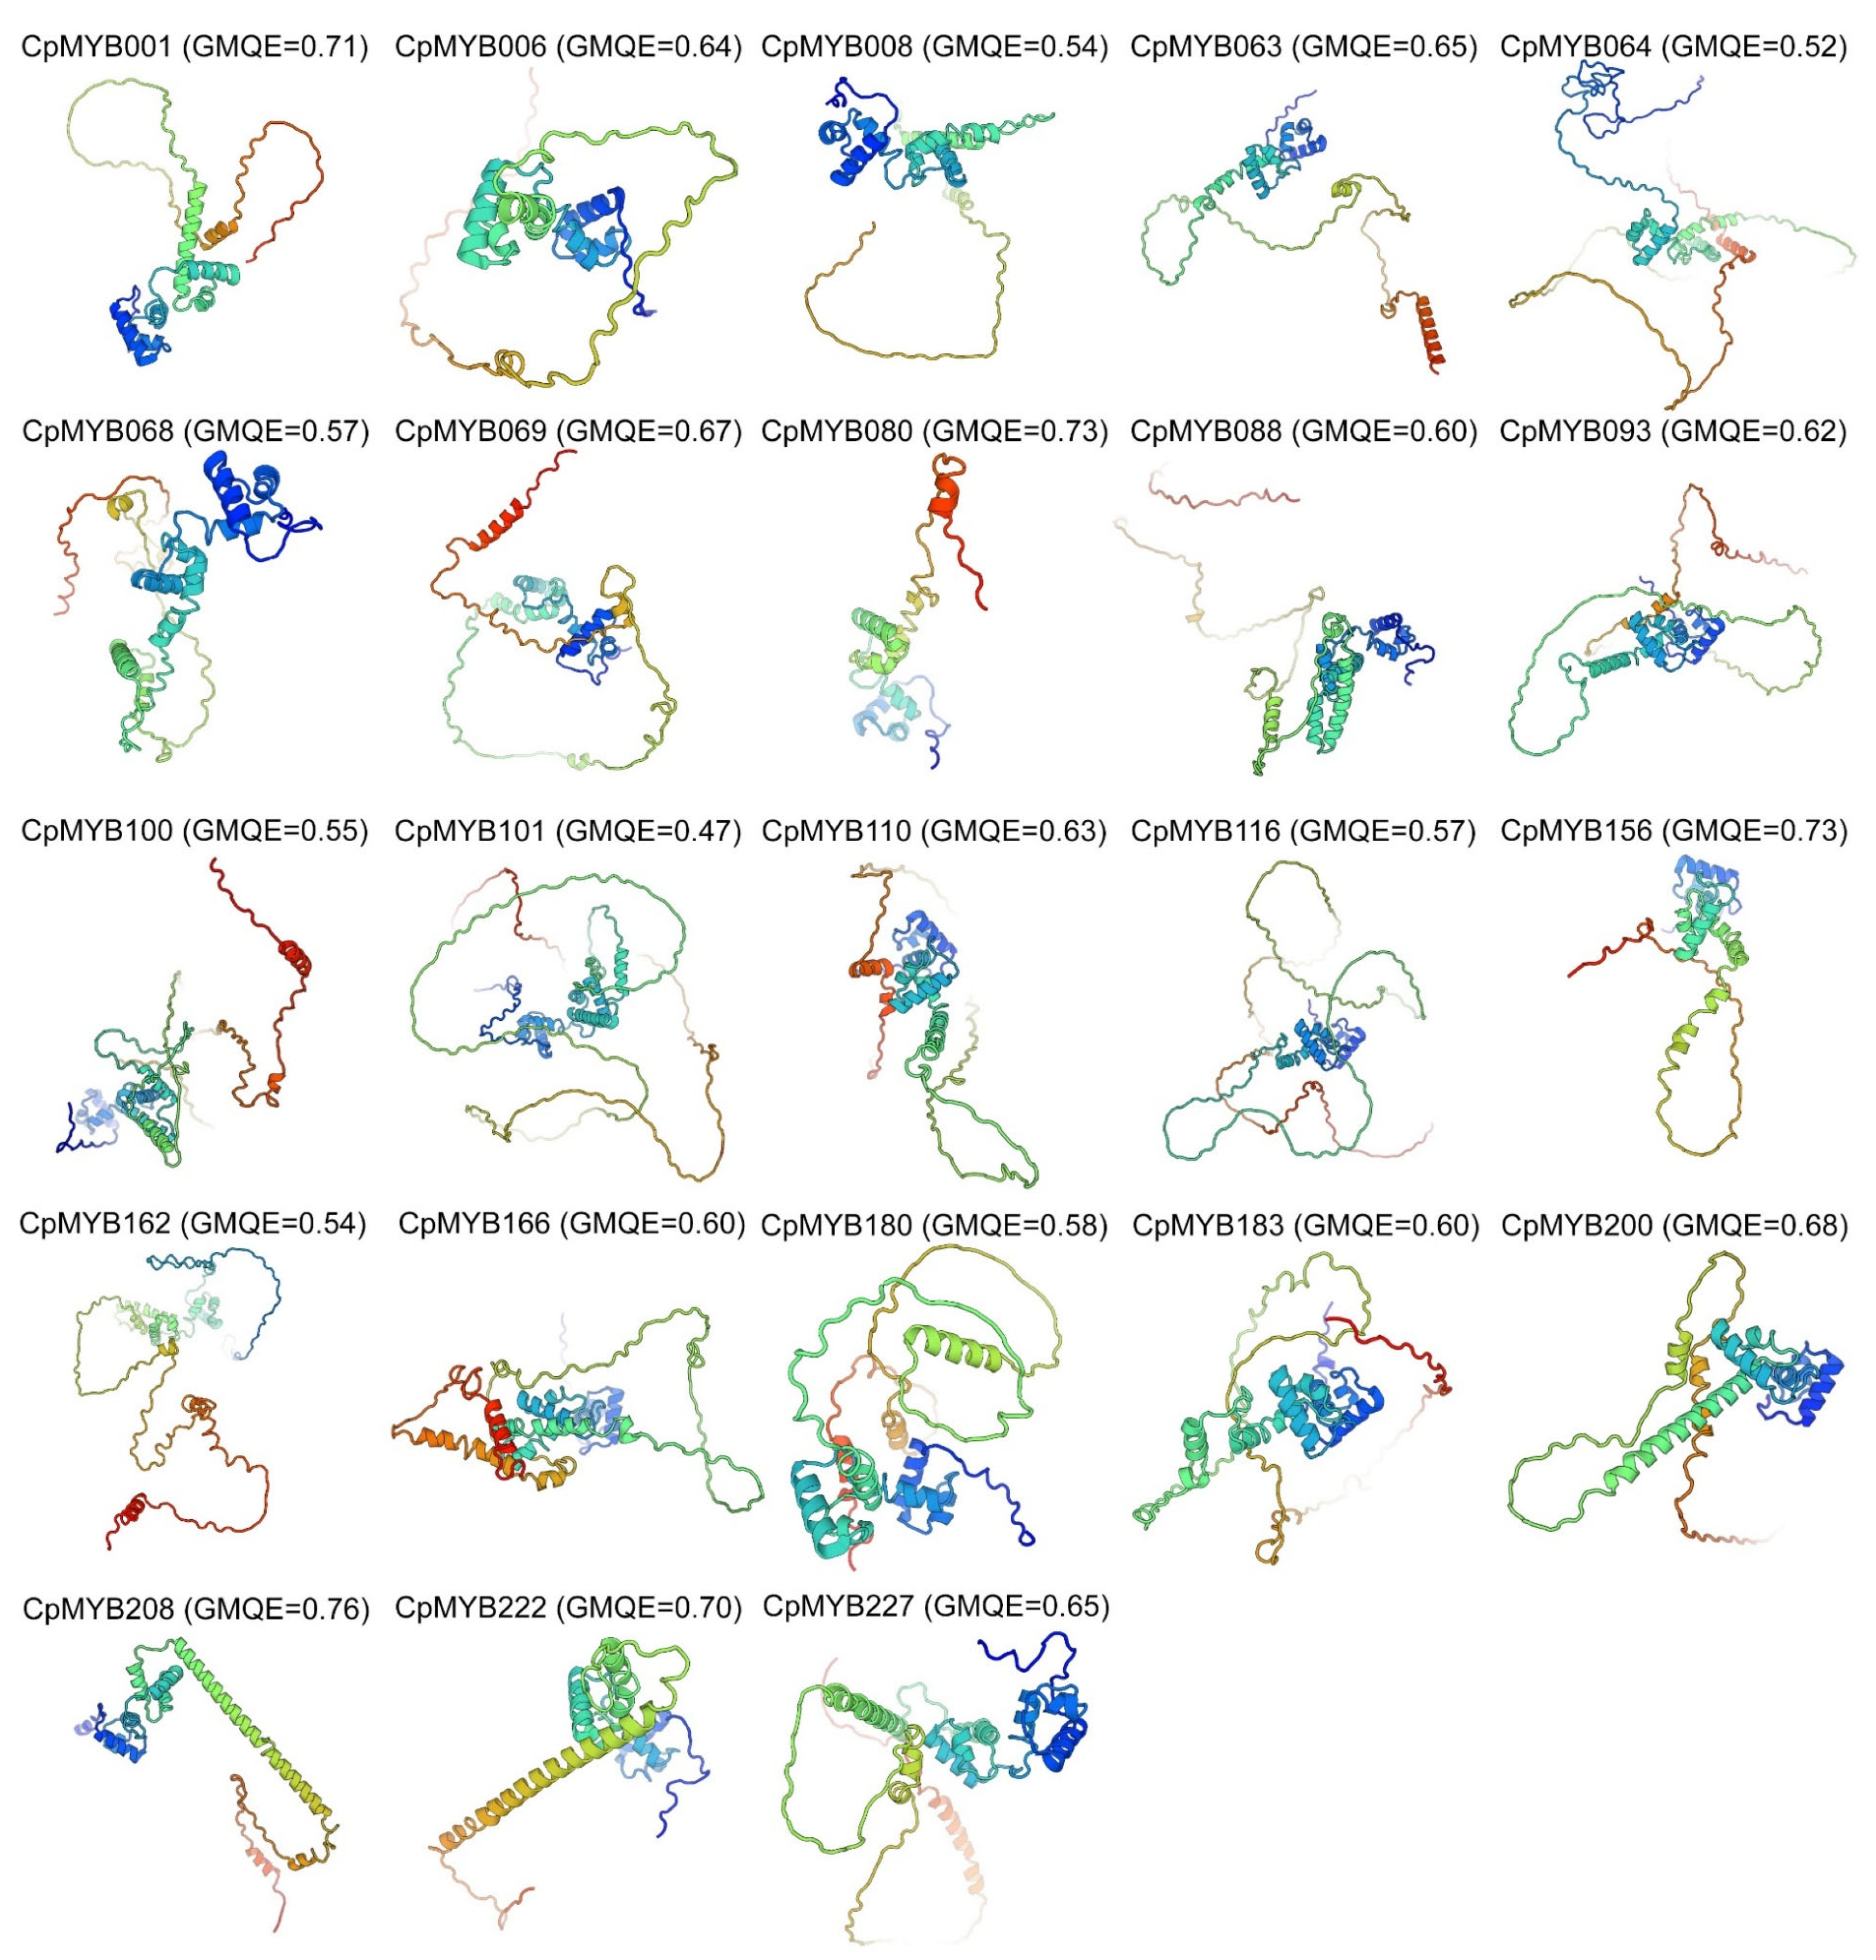
3.5. Three-Dimensional and Secondary Structure Analysis of CpMYB Proteins

To elucidate the structure–function relationships of CpMYB proteins, one representative member from each of the 23 phylogenetic clades was selected for secondary structure analysis and 3D structural modeling. Secondary structure analysis revealed that random coils predominated (57.38–80.85%) in these 23 CpMYB proteins, followed by α-helices (16.48–37.7%), β-turns (2.04–6.33%), and extended strands (0–3.32%) (Table S6). The 3D structures of CpMYB proteins were predicted using Swiss-Model, with model quality assessed by GMQE scores. Structural analysis revealed these 3D models predominantly contained random coils and α-helices (Figure 4), consistent with secondary structure predictions. Among the 23 modeled CpMYB proteins, 22 exhibited GMQE scores > 0.5 (indicating reliable models), while 1 scored 0.47 (CpMYB101).

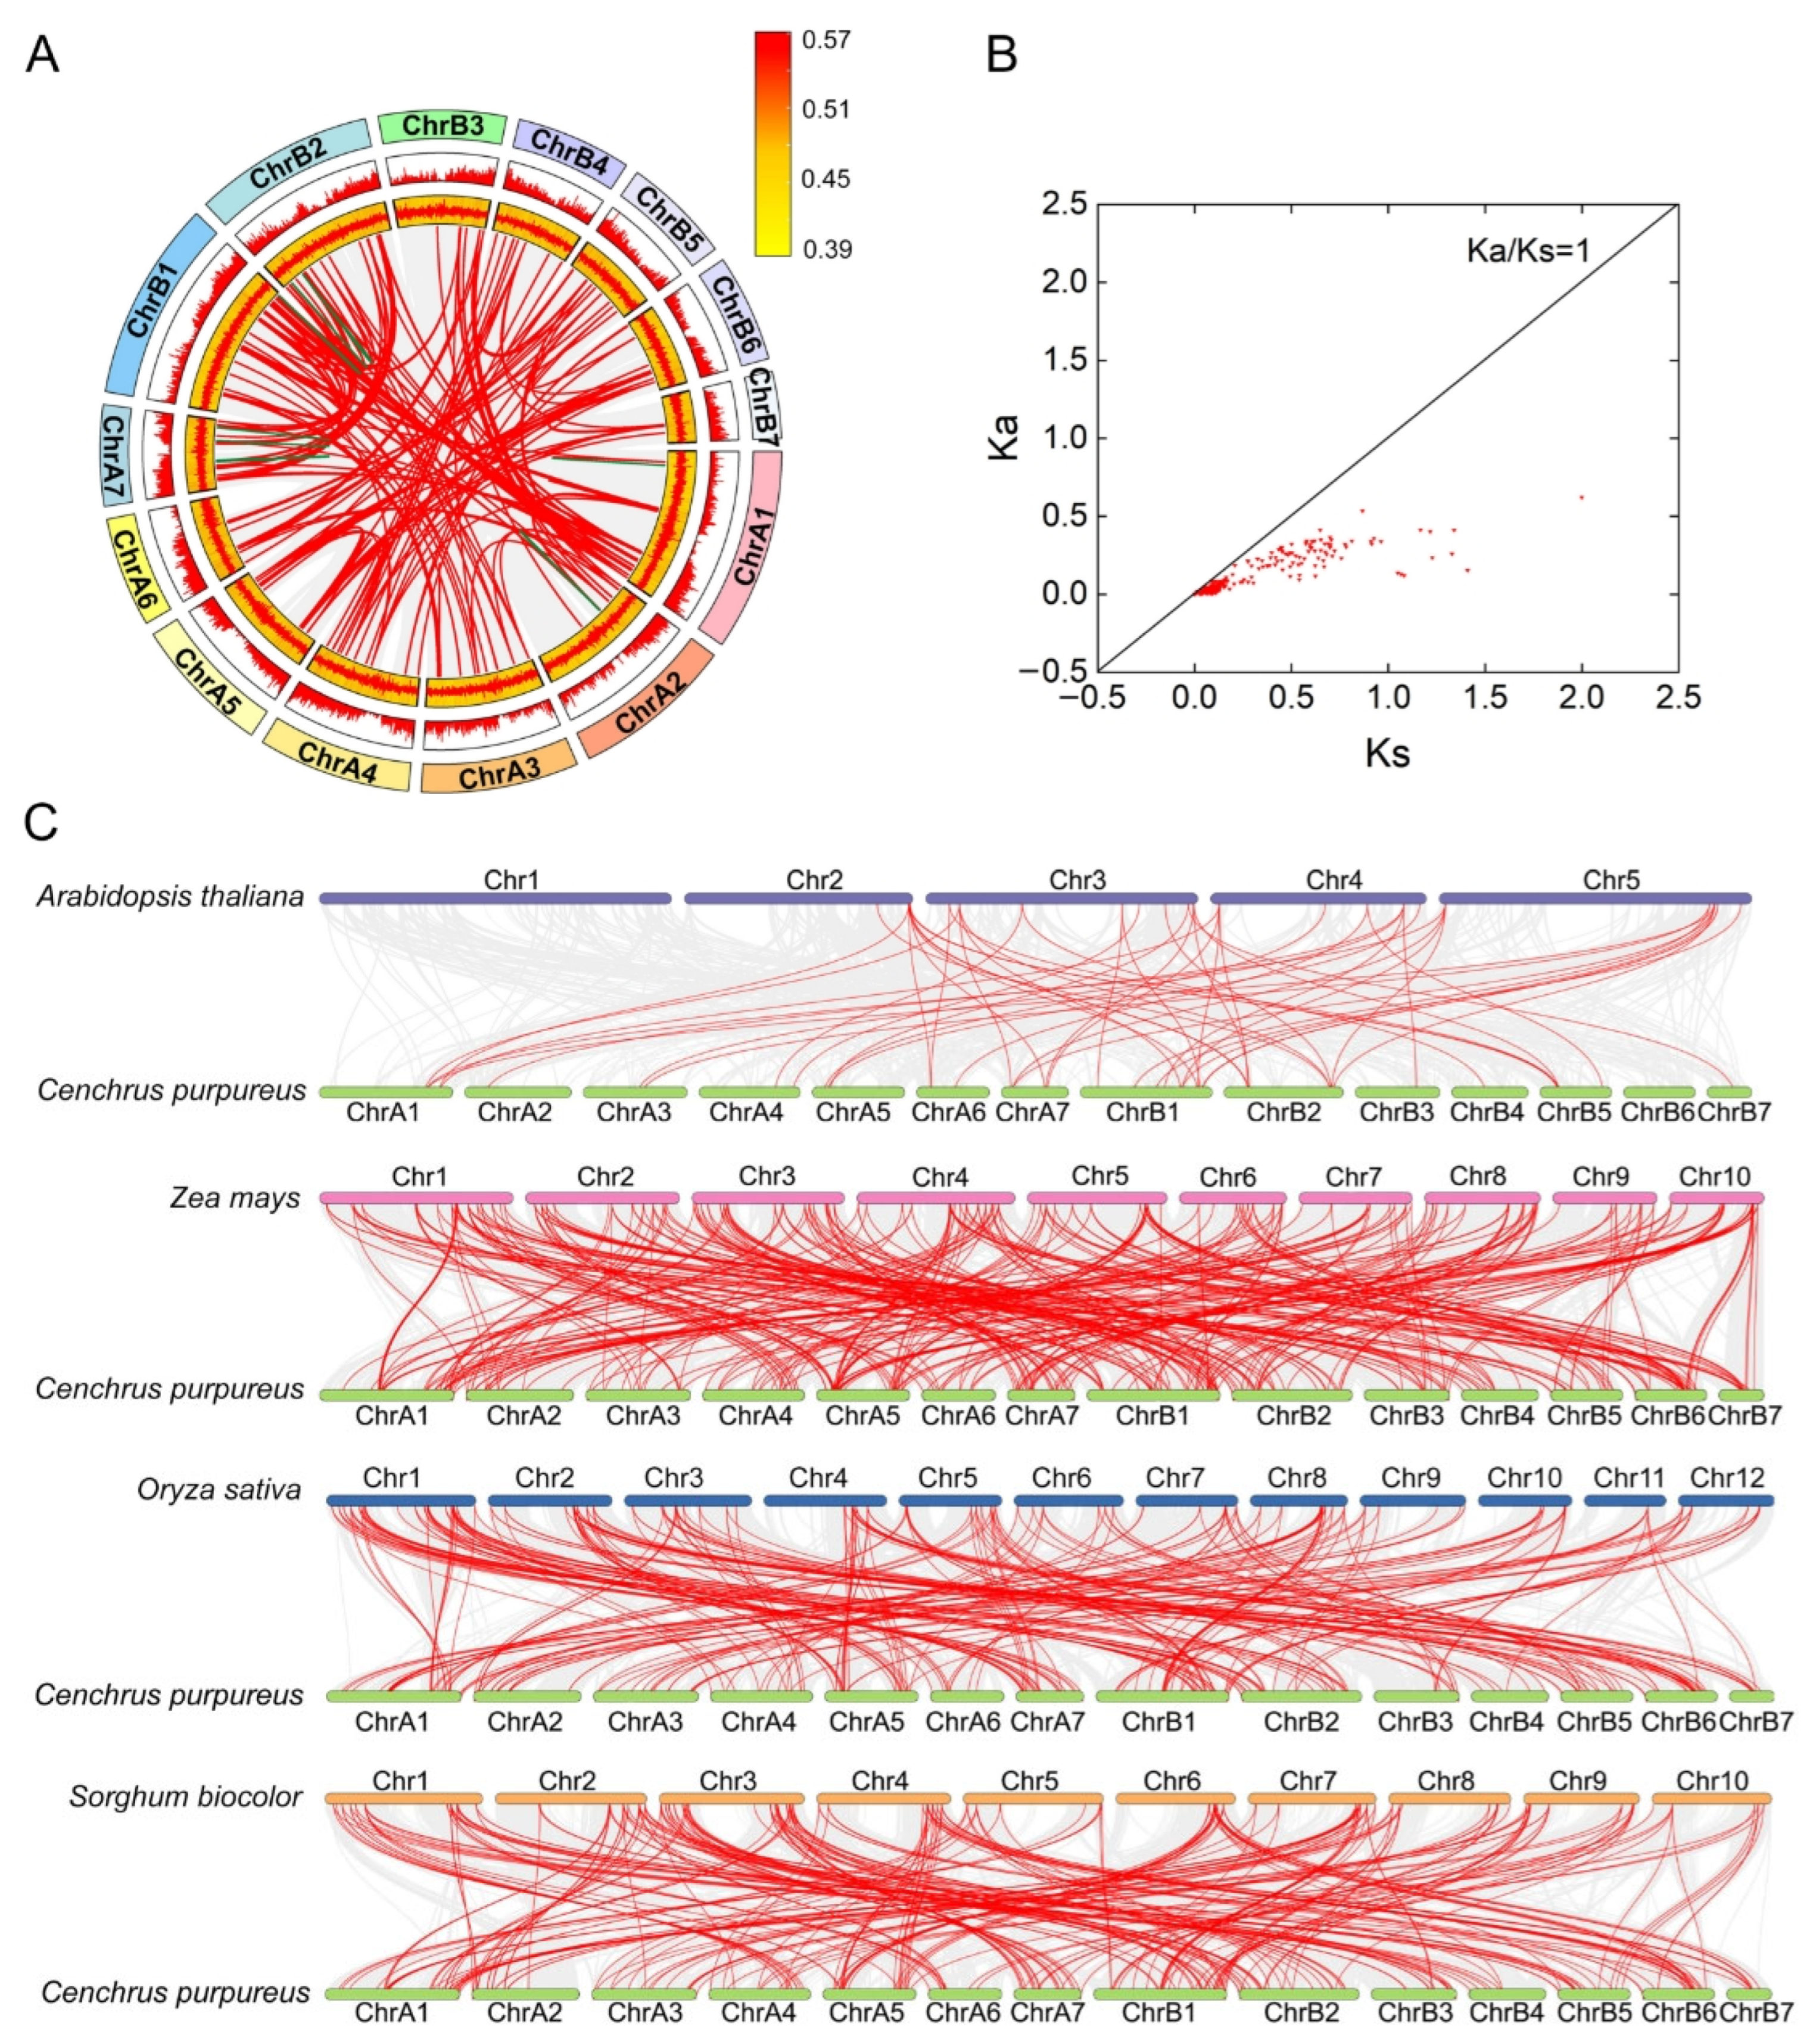
3.6. Gene Duplication and Evolutionary Analysis of CpMYB Genes

Synteny analysis identified 14 tandemly duplicated CpMYB gene pairs (e.g., CpMYB002/CpMYB003, CpMYB041/CpMYB042, CpMYB043/CpMYB044) mapped to chromosomes A01, A02, A07, B01, and B02 (Figure 5A and Table S7). Furthermore, 205 segmental duplicated gene pairs were detected across all chromosomes (Figure 5A and Table S8).
To assess evolutionary constraints, the Ka and Ks substitution rates for segmentally duplicated CpMYB gene pairs were calculated (Figure 5B and Table S8). Most pairs exhibited Ka/Ks ratios < 1, indicative of strong purifying selection. The CpMYB156/CpMYB159 pair showed a Ka/Ks ratio > 1 (1.75), indicating positive selection, while the CpMYB073/CpMYB074 pair could not be evaluated due to high sequence divergence (pS ≥ 0.75).
Comparative synteny analysis revealed extensive collinearity between elephant grass and four reference species: Arabidopsis thaliana (51 gene pairs), rice (274 pairs), maize (363 pairs), and sorghum (285 pairs) (Figure 5C). Among them, 35 CpMYB genes exhibited syntenic relationships with all four species.

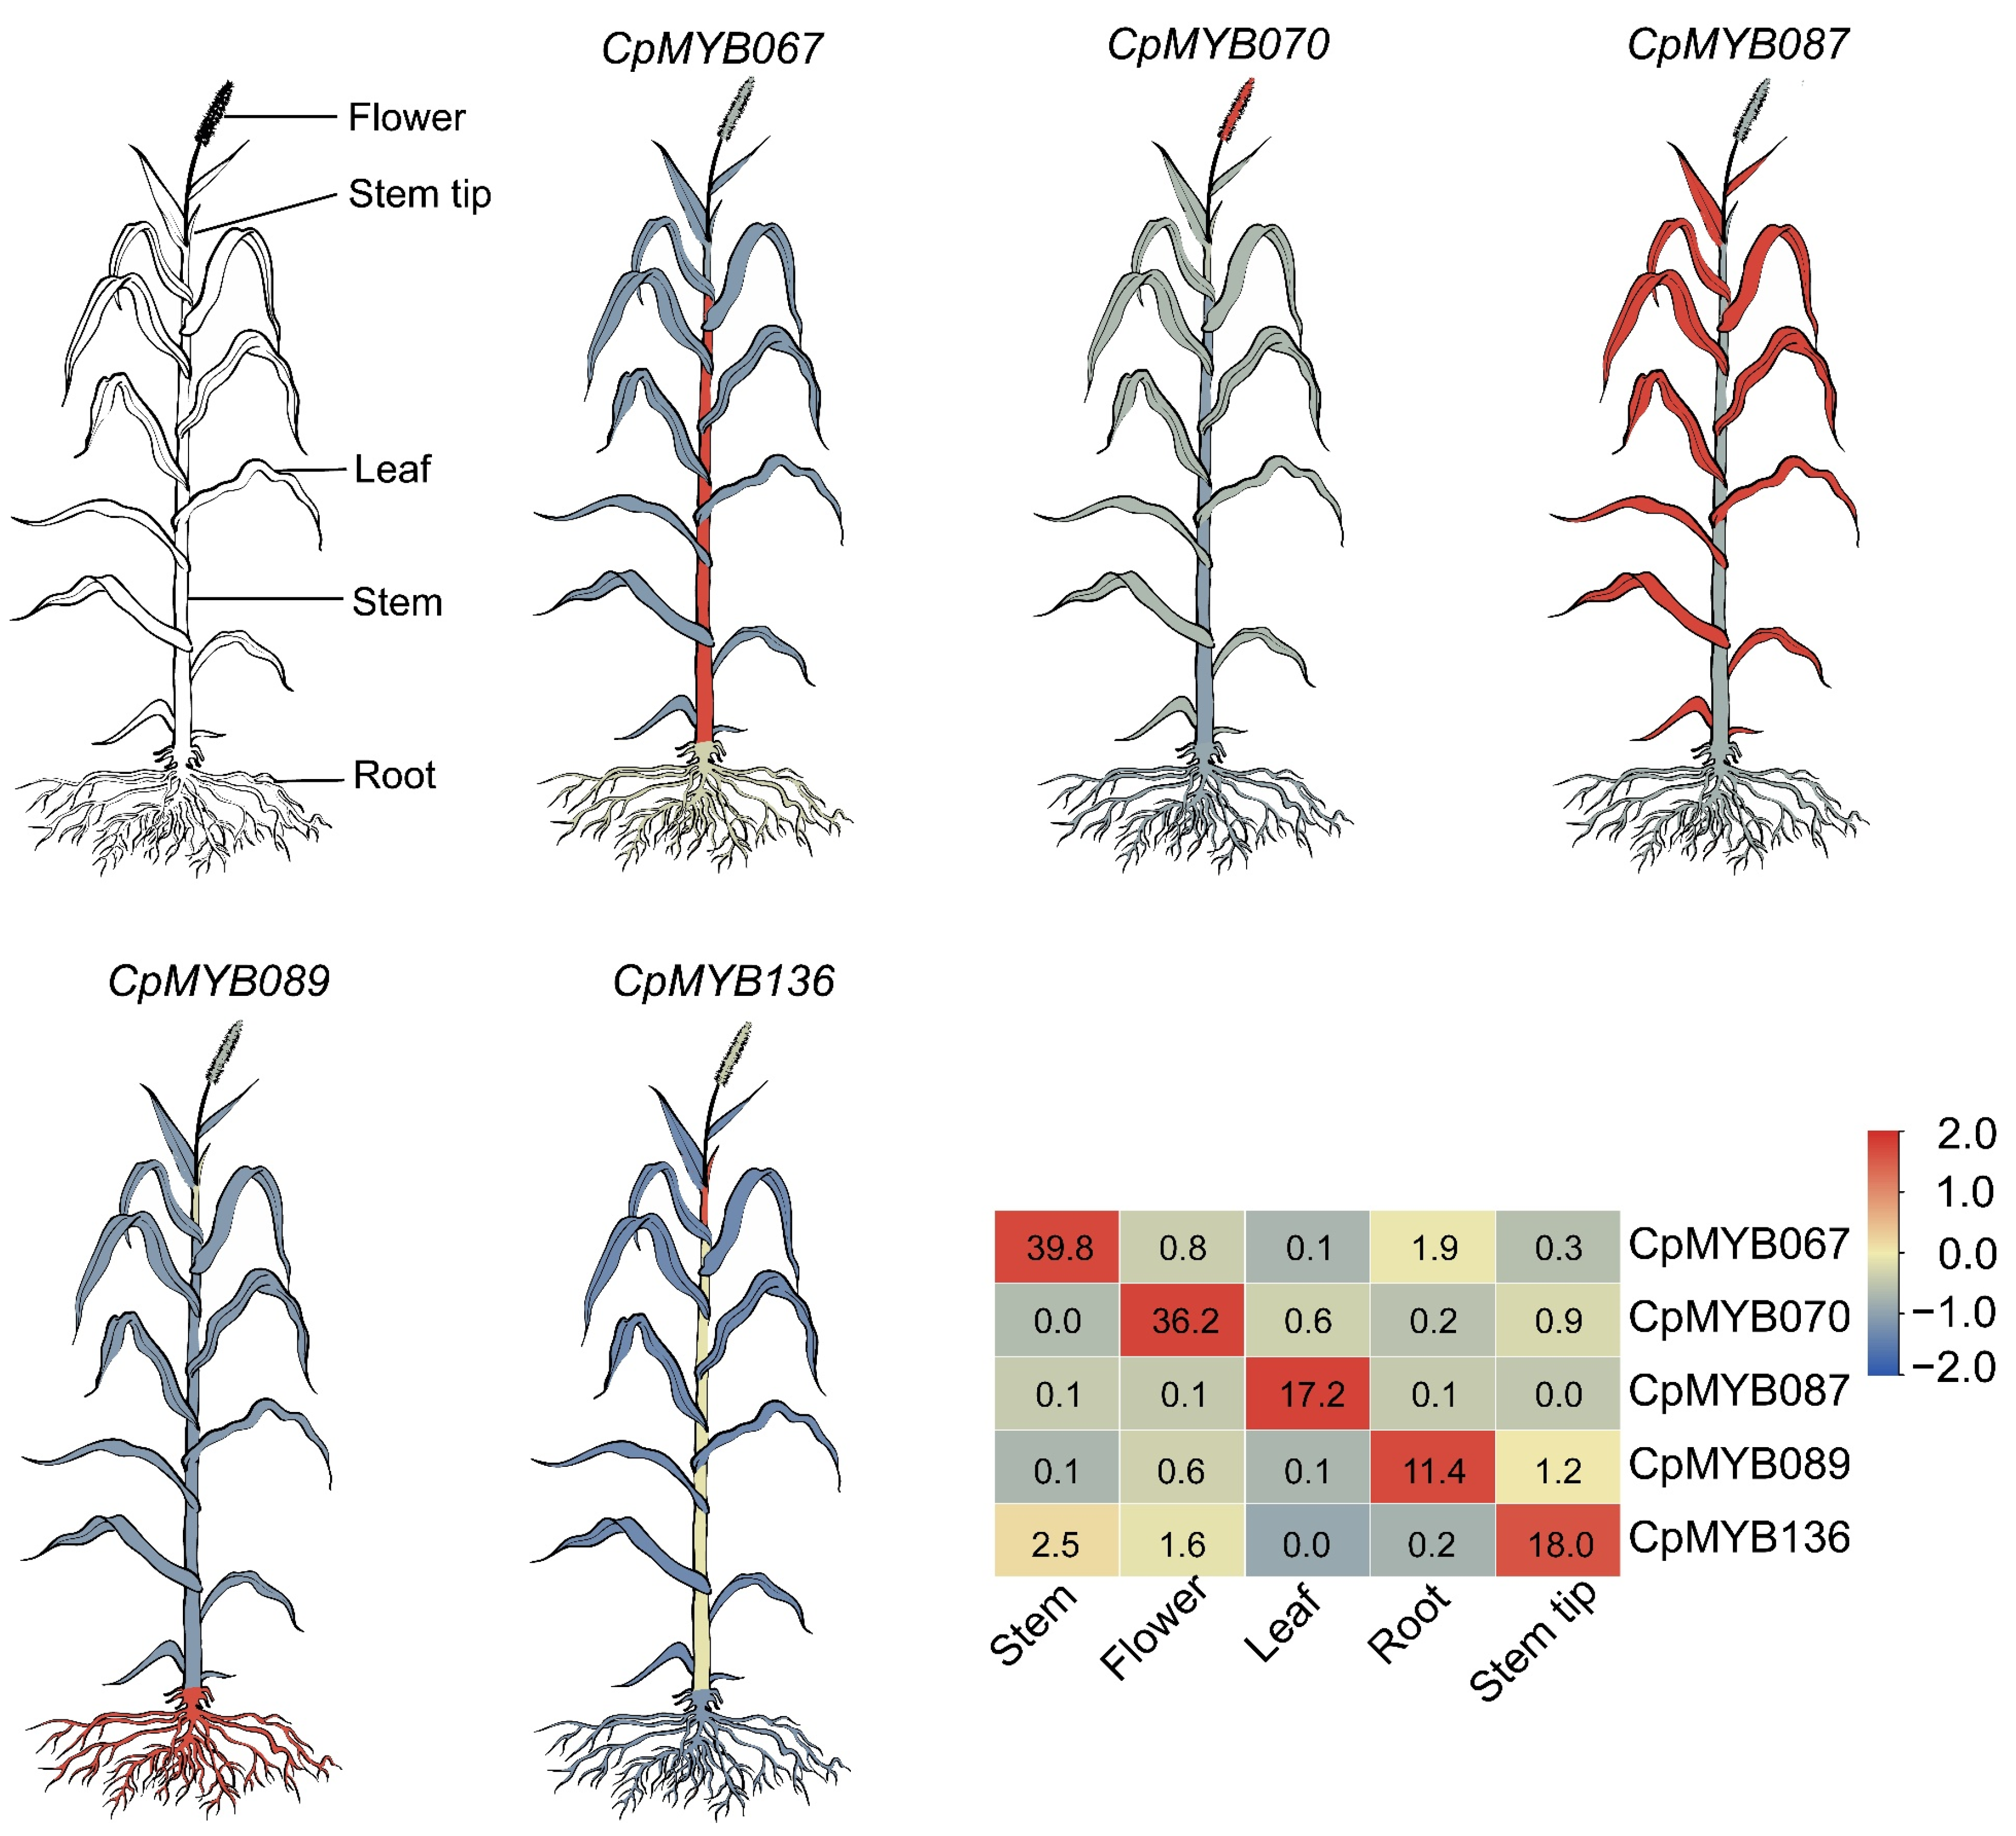
3.7. Expression Profiles of CpMYB Genes in Five Tissues

Gene expression data from five tissues (root, leaf, flower, stem, and stem tip) were utilized to investigate tissue-specific expression profiles of CpMYB genes. Of the 247 CpMYB genes identified, 236 were expressed in at least one tissue, while 11 CpMYB genes (CpMYB019, CpMYB049, CpMYB061, CpMYB081, CpMYB126, CpMYB147, CpMYB152, CpMYB201, CpMYB202, CpMYB210, and CpMYB245) showed no detectable expression (Figure S3). Tissue-specific highly expressed genes were identified using dual thresholds: a minimum TPM value > 10 in the target tissue and a ≥2-fold change relative to the average of other tissues. Based on these criteria, 27 CpMYB genes were identified as highly expressed in flowers (TPM ranging from 11.21 for CpMYB154 to 121.12 for CpMYB119; fold change from 2.05 for CpMYB039 to 89.38 for CpMYB070), 34 CpMYB genes in leaves (TPM 10.99 for CpMYB151 to 229.38 for CpMYB231; fold change 2.03 for CpMYB039 to 323.94 for CpMYB087), 8 CpMYB genes in stems (TPM 12.30 for CpMYB154 to 39.79 for CpMYB067; fold change 2.18 for CpMYB001 to 50.98 for CpMYB067), and one CpMYB gene in the stem tip (CpMYB136, TPM = 17.98; fold change = 16.94). In roots, 22 CpMYB genes were highly expressed (TPM ranging from 10.83 for CpMYB135 to 281.02 for CpMYB179; fold change 2.07 for CpMYB170 to 23.36 for CpMYB089) (Table S9). Representative genes with the highest tissue specificity were selected for further visualization: CpMYB070 (flower), CpMYB067 (stem), CpMYB087 (leaf), CpMYB089 (root), and CpMYB136 (stem tip) (Figure 6).

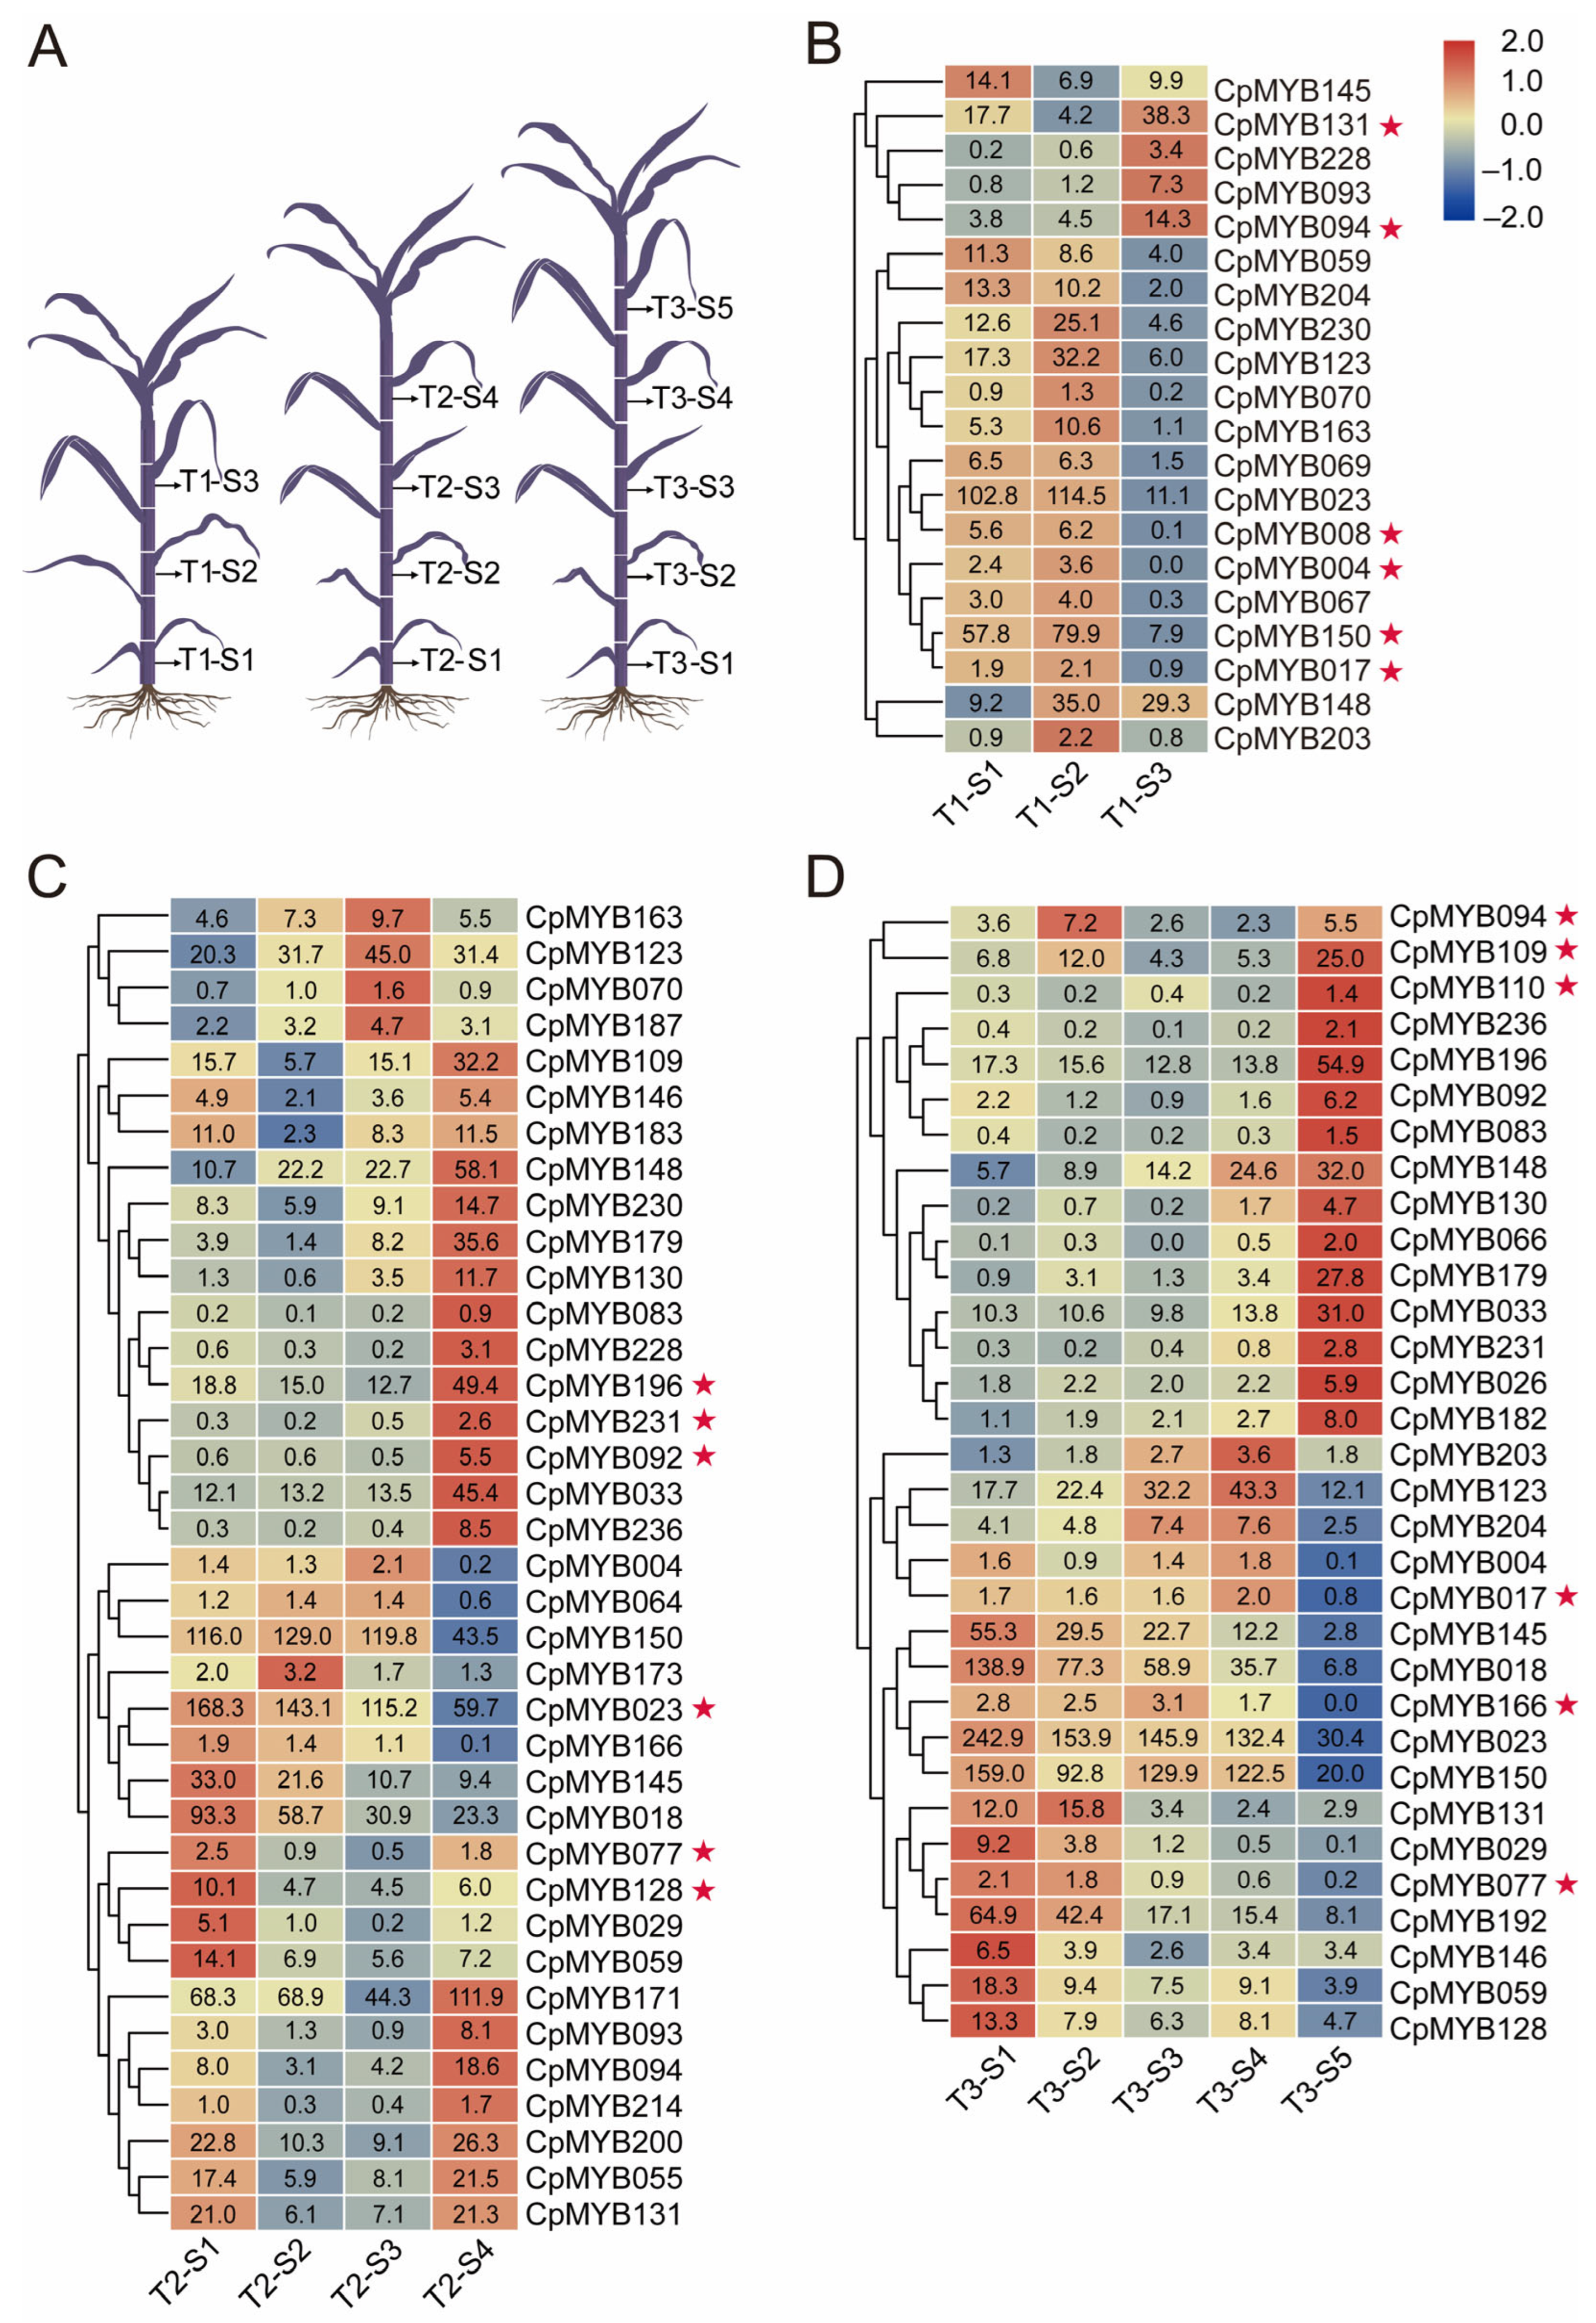
3.8. Expression Patterns of CpMYB Genes in Elephant Grass Internodes at Three Development Stages

To identify CpMYB genes potentially involved in lignin biosynthesis, RNA-seq data from three developmental stages (T1: 40 days, T2: 80 days, T3: 120 days) were analyzed. As illustrated in Figure 7A, five internodes (S1 to S5, corresponding to the 1st, 3rd, 5th, 7th, and 9th from the base to the apex) were selected for comparison. Genes with |log2FoldChange| ≥ 1 and FDR < 0.05 were considered significantly differentially expressed in at least two internode comparisons. At the T1 stage, 20 genes were differentially expressed in at least two stem segments in S1–S3. CpMYB017, CpMYB131, and CpMYB150 were markedly upregulated in the higher internodes (S3), whereas genes such as CpMYB004, CpMYB008, and CpMYB094 were markedly upregulated in the lower internodes (S1) (Figure 7B). At the T2 stage, 37 genes displayed differential expression among S1 to S4. Genes including CpMYB023, CpMYB077, and CpMYB128 were significantly upregulated in the higher internodes (S3 and S4), while CpMYB092, CpMYB196, and CpMYB231 were clearly downregulated from lower to upper internodes (Figure 7C). At the T3 stage, 32 genes were differentially expressed across S1 to S5. CpMYB017, CpMYB077, and CpMYB166 maintained high expression in the higher segments (S5); in contrast, CpMYB094, CpMYB109, and CpMYB110 were strongly upregulated in the lower internodes (S1) (Figure 7D). In total, 48 CpMYB genes were identified as differentially expressed in at least one of the three developmental stages, exhibiting distinct spatial and temporal expression patterns across the sampled internodes.

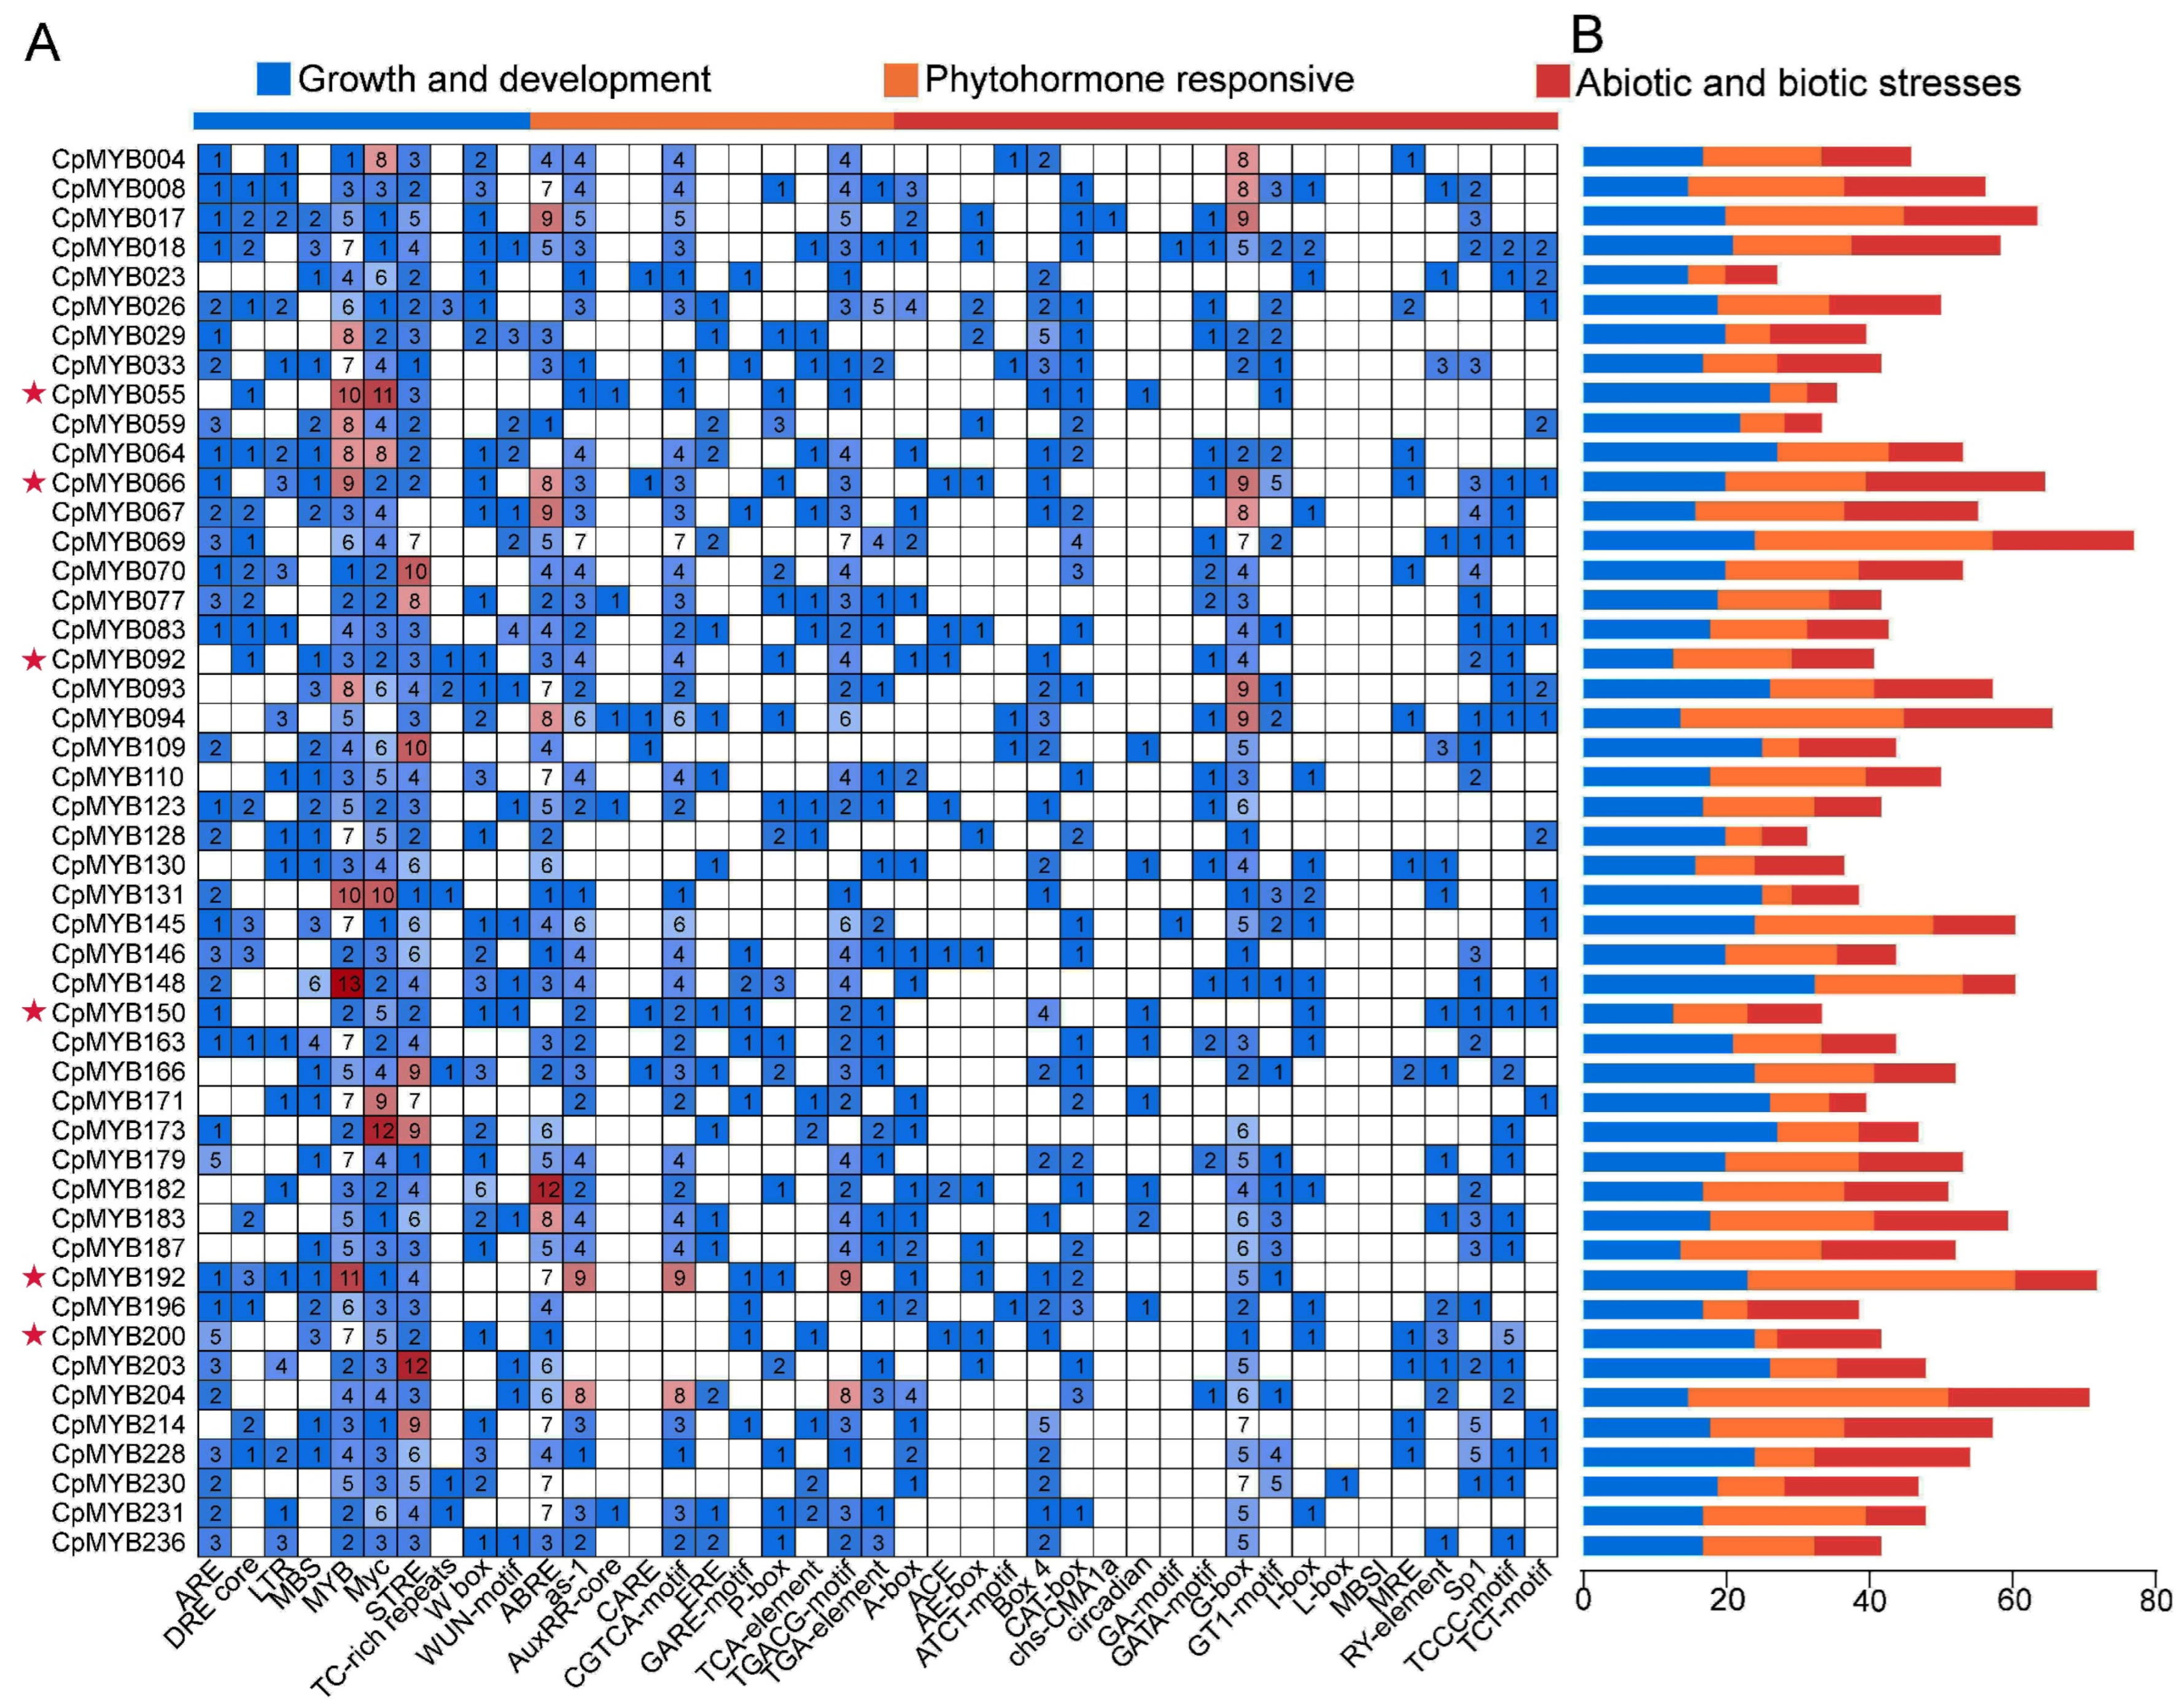
3.9. Cis-Acting Element Analysis of CpMYB Promoters

Identification and analysis of cis-acting elements in gene promoter regions can provide important insights into their regulatory roles in plant growth and development, as well as in responses to biotic and abiotic stresses. In this study, we analyzed the 2000 bp upstream sequences of 48 CpMYB DEGs across three developmental stages. The identified cis-acting elements were classified into three major functional categories: growth and development, hormone-responsive elements, and elements involved in stress-responsive elements (Figure 8A). Among these 48 CpMYB DEGs, CpMYB066 contained the highest number of growth- and development-related elements (24), whereas CpMYB055 contained the fewest (4) (Figure 8B). For stress-responsive elements, CpMYB148 harbored the most (31), while CpMYB092 and CpMYB150 had the least (12 each). Regarding hormone-responsive elements, CpMYB192 possessed the highest number (36), whereas CpMYB200 had the fewest (3). In addition, all 48 CpMYB DEGs contained three conserved cis-elements: MYB-binding sites, MYC elements, and STREs.

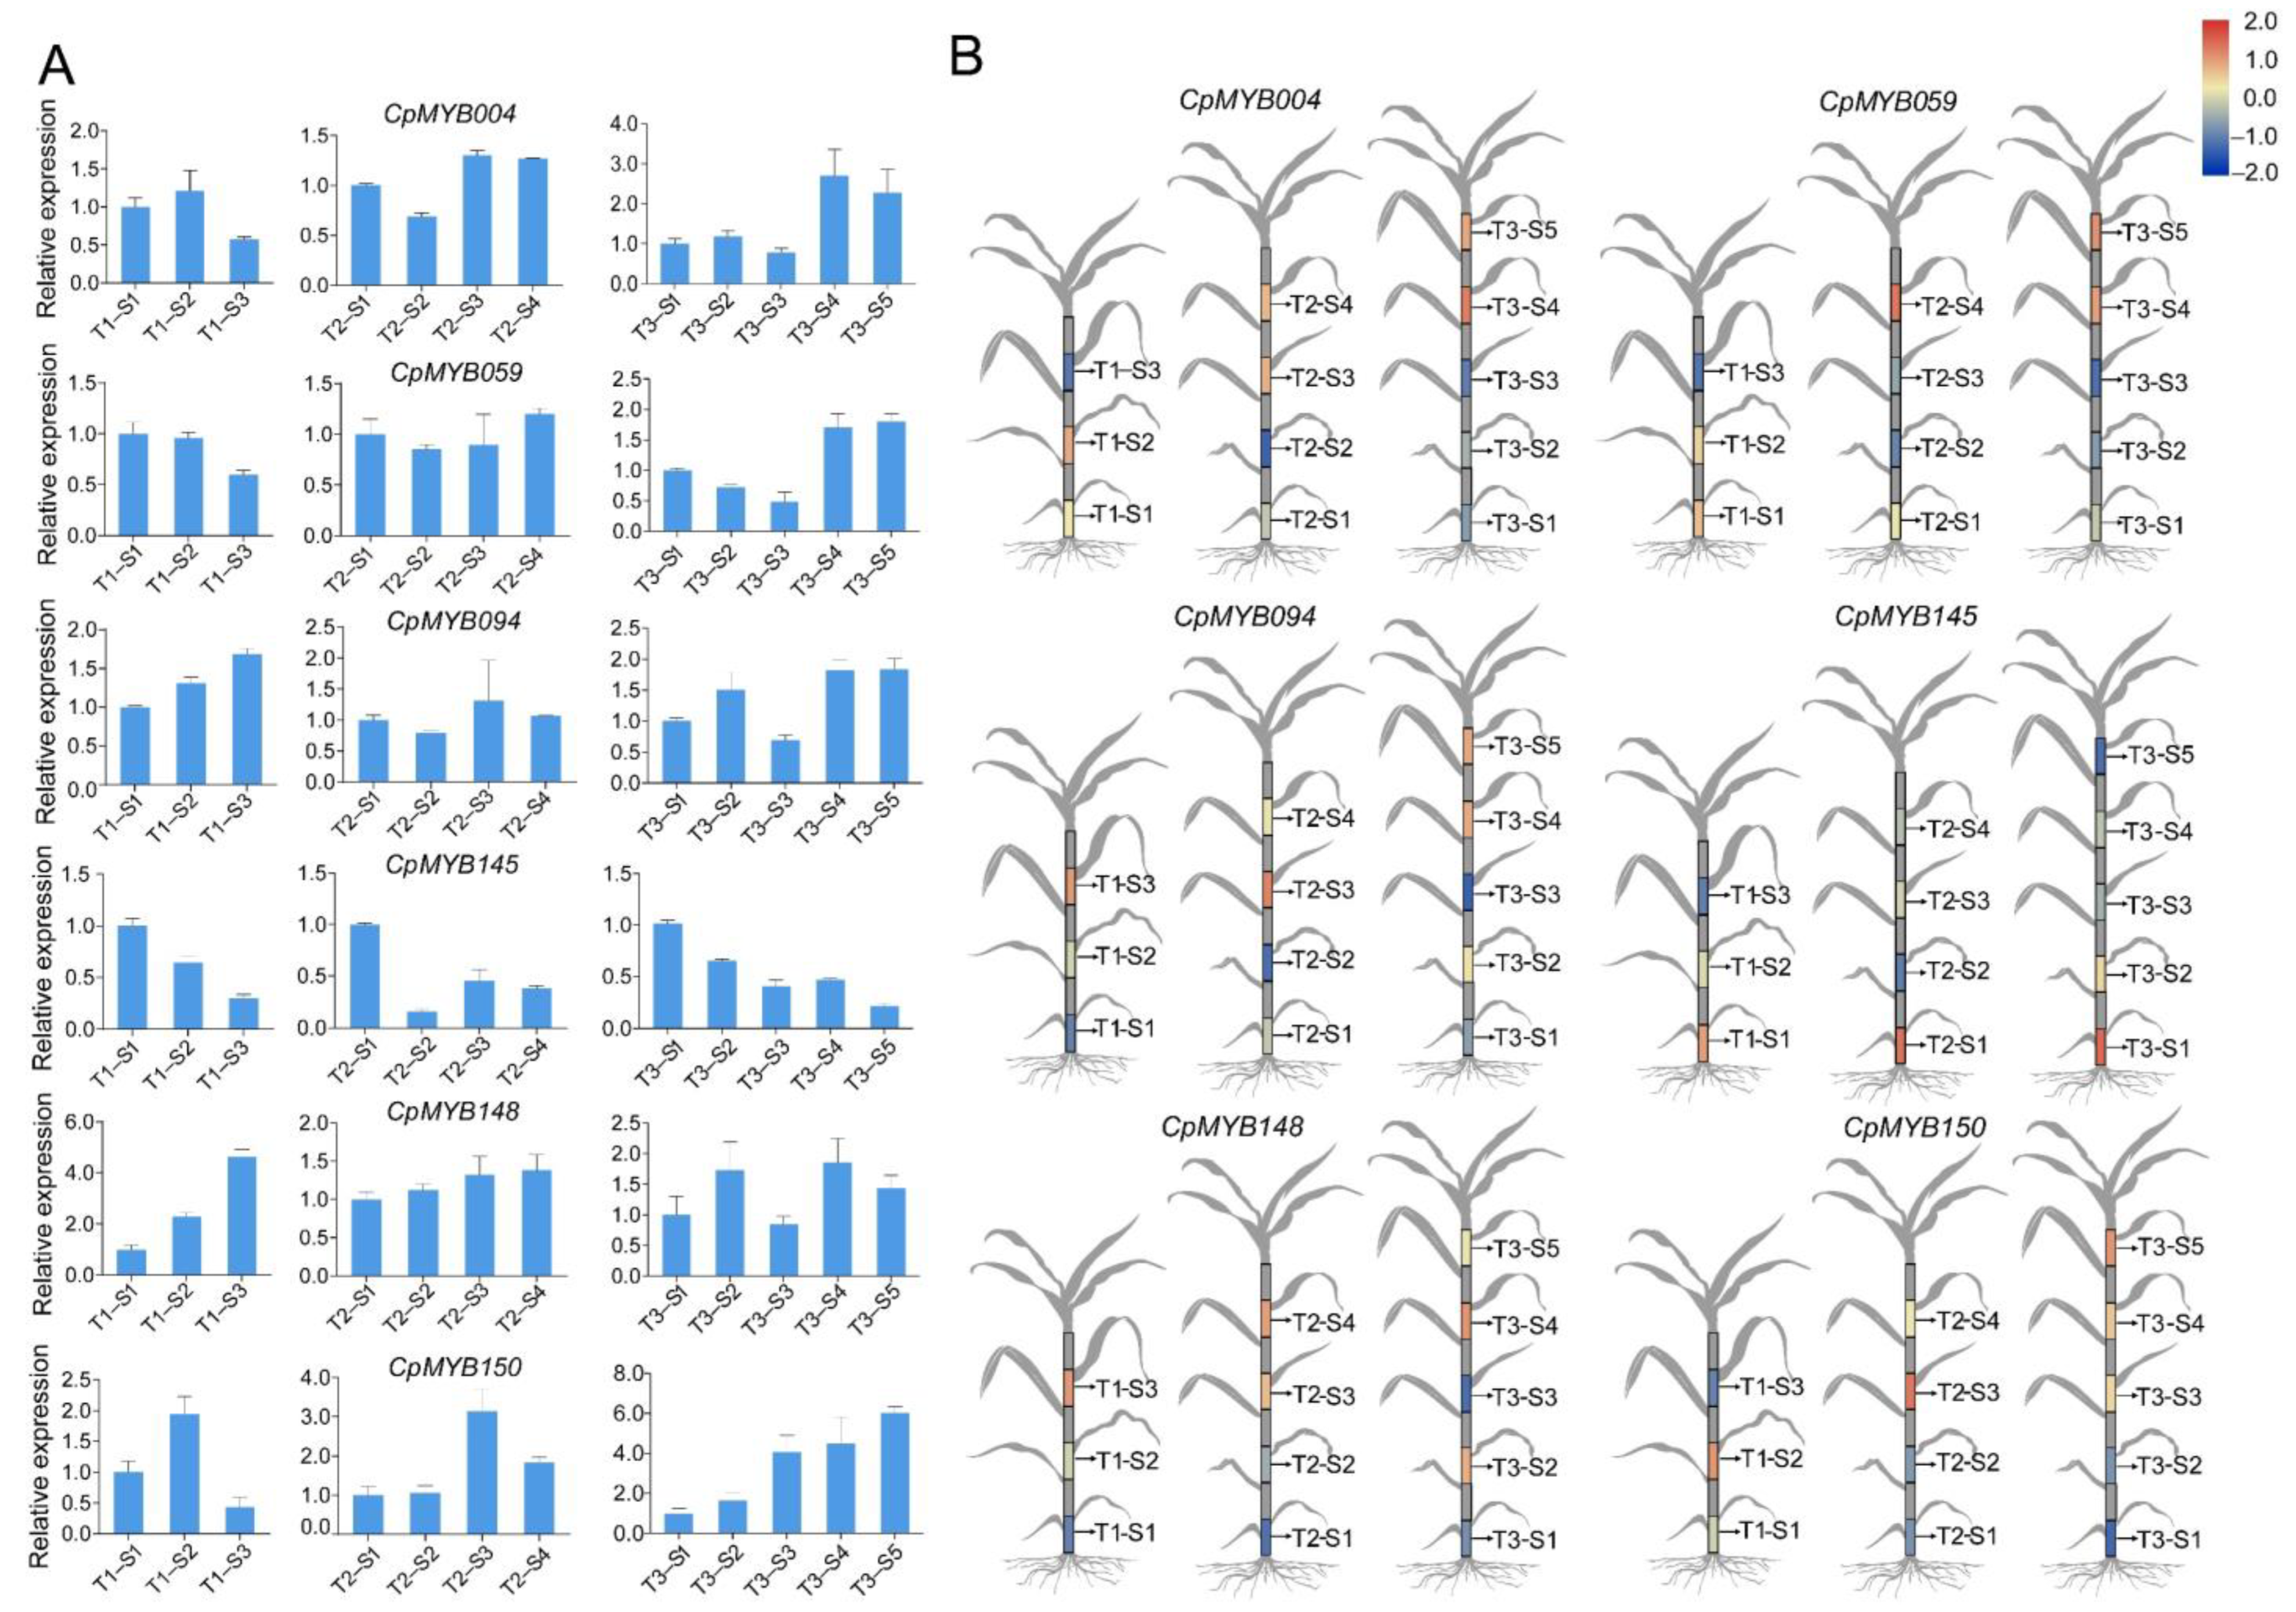
3.10. RT-qPCR Analysis

Six CpMYB genes (CpMYB004, CpMYB059, CpMYB094, CpMYB145, CpMYB148, and CpMYB150) were randomly chosen as representatives selected from 9 CpMYB DEGs that were differentially expressed at three stages of elephant grass for further RT-qPCR analysis to examine their expression patterns across different developmental stages and internodes. The results showed that CpMYB145 had the highest expression in the lower internodes (S1) during T1 and T2, with a gradual decrease toward the upper internodes (Figure 9A). CpMYB059 and CpMYB004 both exhibited elevated expression levels during T3, especially in the upper internodes. CpMYB150 displayed peak expression in the middle internodes (S3) at T2 and T3, while CpMYB0094 and CpMYB148 showed relatively stable expression patterns across all developmental stages and internodes. To better illustrate the expression patterns of these six CpMYB genes at three different developmental stages in elephant grass, their RT-qPCR results were visualized using a cartoon representation of the plant (Figure 9B).

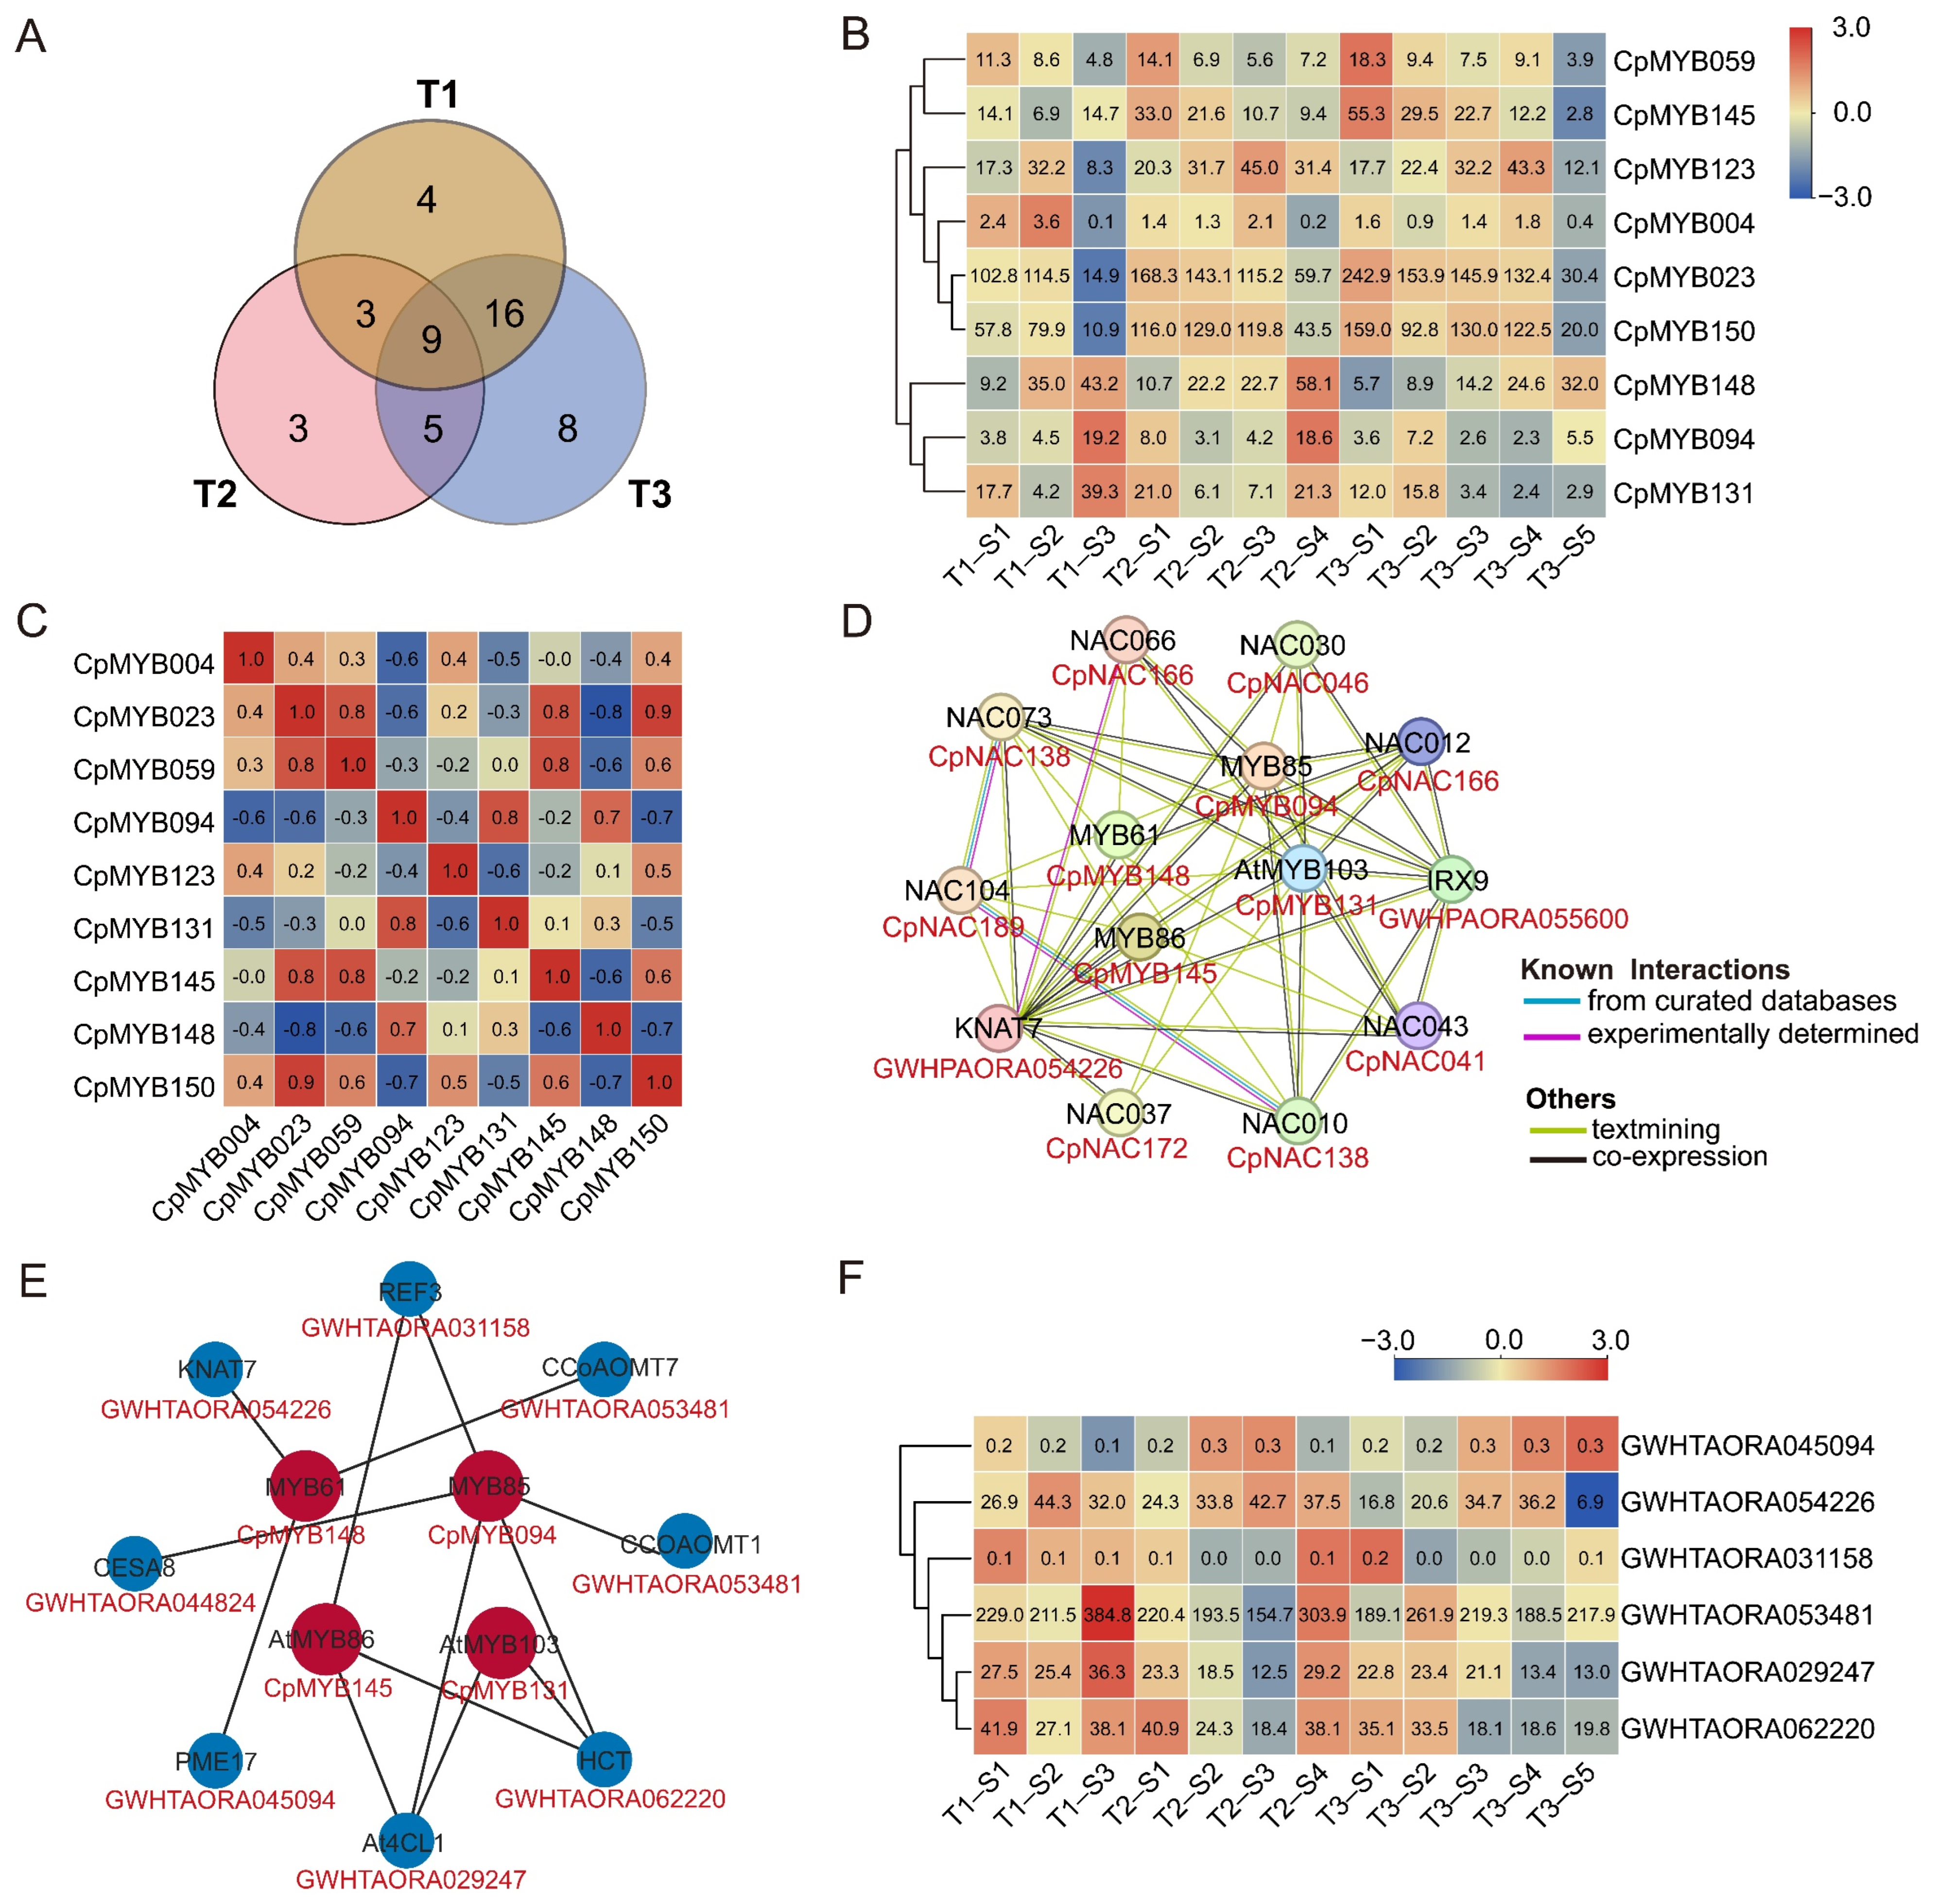
3.11. Expression Analysis and Regulatory Network Prediction of Nine CpMYB TFs

Among the 48 CpMYB DEGs mentioned above, 9 CpMYB genes—CpMYB004, CpMYB023, CpMYB059, CpMYB094, CpMYB123, CpMYB131, CpMYB145, CpMYB148, and CpMYB150—were identified as differentially expressed across all three developmental stages (Figure 10A). Information on their homologous genes in Arabidopsis and rice is provided in Table S10. The expression levels of CpMYB145 and CpMYB059 gradually increased from the basal to the apex internodes, while CpMYB004, CpMYB131, CpMYB094, and CpMYB148 exhibited a decreasing trend (Figure 10B). In contrast, CpMYB023 and CpMYB123 displayed no consistent pattern, indicating potential stage- or tissue-specific regulation rather than spatially ordered expression. Correlation analysis revealed that the majority of expression relationships among these genes (53.1%) were positively correlated (correlation coefficient > 0), indicating a potential co-regulatory network involved in stem development (Figure 10C).
PPI network analysis identified multiple interaction partners for the candidate CpMYB proteins. Among the nine candidate CpMYB TFs, four proteins—CpMYB131 (ortholog of AtMYB103), CpMYB148 (AtMYB61), CpMYB145 (AtMYB86), and CpMYB094 (AtMYB20)—were predicted to interact with eight target proteins (Figure 10D and Table S11). Although no direct interactions were observed among the four CpMYBs themselves, they formed a core regulatory network with several NAC TFs, including NAC TF CpNAC046 (AtNAC030), CpNAC138 (AtNAC010 and AtNAC073), CpNAC166 (AtNAC012 and AtNAC066), CpNAC189 (AtNAC104), CpNAC172 (AtNAC037), and CpNAC041 (AtNAC043), as well as Irregular Xylem GWHPAORA055600 (AtIRX9) and the KNOX TF GWHPAORA054226 (AtKNAT7). The CpNAC protein names are based on unpublished data from our research group. Further expression analysis of the eight putative interaction partners revealed that five genes were differentially expressed across the three developmental stages (T1–T3) (Figure S4).
Additionally, given the regulatory nature of TFs, a PDI network was constructed using Arabidopsis homologs to explore the regulatory roles of CpMYB TFs. For the nine CpMYBs differentially expressed across all three stages, homologs of four—CpMYB094, CpMYB131, CpMYB145, and CpMYB148—were predicted to target eight genes, including GWHTAORA053481 (AtCCoAOMT1), GWHTAORA053481 (AtCCoAOMT7), GWHTAORA062220 (AtHCT), GWHTAORA029247 (At4CL1), GWHTAORA045094 (AtPME17), GWHTAORA044824 (AtCESA8), GWHTAORA054226 (AtKNAT7), and GWHTAORA031158 (AtREF3) (Figure 10E and Table S12). These eight target genes correspond to seven elephant grass genes, as AtCCoAOMT1 and AtCCoAOMT7 share the same homolog (GWHTAORA053481). Further expression analysis revealed that GWHTAORA044824 (AtCESA8) was not expressed in stem internodes, whereas the other six genes were all differentially expressed across the three developmental stages (T1–T3) (Figure 10F), implying their potential involvement in stage-specific stem development or lignification.

4. Discussion

High lignin content in forage reduces digestibility and lowers nutritional value by forming a structural barrier in plant cell walls, thereby limiting enzymatic degradation and nutrient accessibility for ruminants [62]. Lignin biosynthesis is a complex and tightly regulated process governed by transcriptional regulation, signaling pathways, and enzymatic activities [2]. Among these regulatory components, MYB TFs modulate the expression of key lignin biosynthetic genes—such as PAL, 4CL, and CAD—by binding to specific promoter regions [63,64]. In elephant grass, a species commonly used for forage, excessively high lignin content substantially hinders its digestibility and restricts its practical application in animal husbandry [65]. Therefore, exploring MYB-mediated regulatory mechanisms is essential for optimizing lignin content and composition. In this study, we systematically characterized the MYB TF family in elephant grass, with a particular focus on their potential regulatory functions in the lignin metabolic pathway, including spatiotemporal expression patterns and regulatory network interactions.
In this study, 247 CpMYB genes were identified in the elephant grass genome, a number significantly higher than that reported in Arabidopsis (n = 197), rice (n = 155), and sorghum (n = 210), but lower than that in alfalfa (n = 265) and wheat (n = 719) [66,67,68,69]. The CpMYB proteins exhibited considerable variation in length, MW, and pI, while maintaining similar instability indices and GRAVY values. Subcellular localization predictions revealed that all CpMYB proteins are localized in the nucleus, aligning with findings in Chinese cherry (Prunus pseudocerasus) [70]. These results highlight the expansion and diversification of the MYB TF family in elephant grass, providing a foundation for further functional characterization of CpMYB TFs in biological processes. Additionally, chromosomal mapping assigned 233 CpMYB genes to assembled chromosomes (Figure 1C), while 14 were localized on contigs—a pattern reported in kiwifruit (Actinidia chinensis) [71]. In contrast, all JAZ family genes in alfalfa were exclusively mapped to chromosomes rather than to contigs [72]. This discrepancy may be attributed to differences in genome assembly quality and completeness between species, or to lineage-specific structural variations.
Phylogenetic analysis classified MYB TFs from elephant grass and Arabidopsis into 27 distinct subgroups (Figure 2), consistent with classifications reported in other species such as Chinese pear and potato [49,50]. Notably, some subgroups, such as S5, S6, S11, and S12, lacked CpMYB members. This pattern is not unique to elephant grass; for instance, the S12 subgroup in blueberry includes only Arabidopsis sequences, suggesting species-specific expansion or loss. In contrast, subgroups C15 and C23 in the blueberry–Arabidopsis phylogeny contain only CvMYB members, indicating possible lineage-specific expansion in blueberry or gene loss in elephant grass [73]. Furthermore, several Arabidopsis MYB TFs involved in lignin biosynthesis in fibers and vessels, such as AtMYB58 (AT1G16490) and AtMYB63 (AT1G79180), are phylogenetically clustered with their putative elephant grass orthologs (CpMYB077, CpMYB093, and CpMYB228), suggesting potential conservation of function across species [28]. Similarly, AtMYB68 (AT5G65790), a known repressor of root-specific lignin deposition, is closely related to CpMYB075 [74]. AtMYB46 (AT5G12870), a multifunctional regulator of lignin, and cellulose deposition, clusters with CpMYB150 and CpMYB056, implying potential functional parallels [75]. These phylogenetic relationships suggest possible functional conservation, underscoring the need for experimental validation to confirm the roles of CpMYB genes in regulating lignin-related pathways. Additionally, the number of introns in CpMYB genes ranged from 1 to 19, a pattern consistent with observations in other species and indicative of structural diversity within the MYB TF family. Subgroup C1 contained more introns than other groups, suggesting they might be evolutionarily conserved lineages, possibly retaining ancestral MYB gene structures (Figure 3B). Conserved motif analysis further supports this structural classification: motif 9 appeared exclusively in subgroup S20, implying subgroup-specific functional divergence potentially related to specialized regulatory mechanisms (Figure 3C). Motifs 1, 2, 3, and 8 overlapped with the MYB DNA-binding domain, supporting their involvement in DNA binding and transcriptional regulation. Interestingly, a similar pattern of motif distribution and domain overlap has been reported in the NLP gene family of alfalfa [76], suggesting that such conserved motifs may serve as core functional elements, while variation in other motifs could contribute to functional diversification among TFs. The overall consistency in motif composition and gene structure within the same subgroups, combined with phylogenetic clustering, reinforces the reliability of the subgroup classifications.
Previous studies have suggested that selection pressure is a major driving force behind intron loss and insertion, while gene duplication may further influence this process by increasing genomic redundancy and facilitating structural variation [77]. In this study, we identified 205 segmentally duplicated and 14 tandemly duplicated CpMYB gene pairs in elephant grass, highlighting segmental duplication as the predominant driver of MYB family expansion (Figure 5). This pattern closely mirrors observations in pink melastome (Melastoma candidum) and Longan (Dimocarpus longan) [78,79], further supporting the widespread role of segmental duplication in the evolution of plant TF families. Furthermore, purifying selection appears to contribute to the functional conservation of duplicated CpMYB genes, as indicated by Ka/Ks ratios < 1 for most gene pairs, a phenomenon similarly reported in the JAZ gene family of alfalfa [72]. Comparative genomic analysis demonstrated that elephant grass exhibits stronger syntenic conservation with fellow monocots, including rice, maize, and sorghum, than with the dicot Arabidopsis, which is consistent with their phylogenetic relationships. Notably, 35 CpMYB genes exhibited conserved synteny across all four reference species, suggesting strong evolutionary conservation of these genes. Similar patterns of conservation have been observed in other TF families, such as the GRAS family in autotetraploid cultivated alfalfa, where certain genes also displayed strong synteny within the same plant family [80].
Several CpMYB genes exhibited strong tissue-specific high expression, such as CpMYB067 in stem, CpMYB070 in flower, and CpMYB087 in leaf (Figure 6). These expression patterns indicate their potential involvement in the specialized development or physiological functions of the corresponding tissues—for example, in leaf-specific metabolic pathways, flower development, and stem lignification [81,82]. In addition to spatial regulation, a temporal analysis of CpMYB gene expression across three developmental stages (T1–T3) revealed distinct stage-specific transcriptional dynamics. A total of 20 CpMYB genes were differentially expressed at T1, increasing to 37 at T2, and then decreasing to 32 at T3 (Figure 7). This fluctuation likely reflects the changing physiological demands of the plant: during the rapid elongation phase (T1–T2), more CpMYB genes may be activated to promote cell wall thickening and lignin biosynthesis, strengthening the stem structure [83]. By T3, when most structural development is complete, the expression of many regulatory gene declines, leaving a core set responsible for maintaining tissue function [84]. Cis-acting element analysis revealed that CpMYB066, CpMYB148, and CpMYB192 are enriched in growth-related, stress-responsive, and hormone-responsive elements, respectively (Figure 8), suggesting their involvement in corresponding regulatory pathways [85]. Furthermore, RT-qPCR validation of six representative genes confirmed diverse expression patterns across developmental stages and internodes. For instance, CpMYB145 showed predominant expression in the lower internodes during early stages, while CpMYB059 and CpMYB004 were upregulated at later stages (Figure 9), implying possibly contributing to basal stem development and tissue maturation, respectively [86].
In addition, we also analyzed the CpMYB gene that was differentially expressed in the internodes of elephant grass across all three developmental stages. We identified nine CpMYB genes (CpMYB004, CpMYB023, CpMYB059, CpMYB094, CpMYB123, CpMYB131, CpMYB145, CpMYB148, and CpMYB150) (Figure 10B). Given the dynamic expression changes in lignin content and composition among different internodes during growth, these genes are proposed as strong candidates for regulating lignin biosynthesis [83]. Supporting this hypothesis, CpMYB094 has a homolog in Arabidopsis (AT4G22680) that directly regulates lignin and phenylalanine biosynthesis genes during secondary wall formation [19], CpMYB145 homolog in rice (LOC_Os05g46610) is also linked to secondary cell wall development (Table S10) [87]. Furthermore, CpMYB123 (Arabidopsis homolog: AT2G36890), CpMYB004 (rice homolog: LOC_Os11g45740.1), and CpMYB131 (rice homolog: LOC_Os08g05520) have homologs that are associated with plant growth, leaf morphology, and various regulatory processes [88,89,90]. These findings suggest that the selected CpMYB TFs may be involved in diverse biological functions, including but not limited to lignin biosynthesis. To gain deeper insight into their potential functions, we used Arabidopsis homologs to predict PPI and PDI networks for the candidate CpMYB TFs. The PPI analysis revealed that four CpMYB proteins (CpMYB094, CpMYB131, CpMYB145, and CpMYB148) potentially interact with six CpNACs, most of which were also differentially expressed across internodes at the three developmental stages (Figure 10D). This supports the involvement of CpMYBs in the conserved NAC-MYB transcriptional cascade that regulates secondary cell wall formation and lignin biosynthesis [91]. In parallel, the PDI network analysis showed that the homologs of four CpMYB proteins (CpMYB094, CpMYB131, CpMYB145, and CpMYB148) targeted eight genes, five of which—GWHTAORA053481 (AtCCoAOMT1), GWHTAORA053481 (AtCCoAOMT7), GWHTAORA062220 (AtHCT), GWHTAORA029247 (At4CL1), and GWHTAORA031158 (AtREF3) (Figure 10E). These genes are central to monolignol biosynthesis and have been functionally validated in previous studies [92,93,94,95,96], suggesting that the corresponding CpMYB proteins may exert direct regulatory control over lignin biosynthesis. Interestingly, CpMYB148 protein was to be homologous to Arabidopsis MYB61 protein, which has been to both interact with and regulate the expression of KNAT7, a TF associated with secondary cell wall development [97]. Based on this homology, it is plausible that CpMYB148 may participate in similar regulatory pathways in elephant grass. This potential dual mode of action—through both PPI and transcriptional regulation—suggests that CpMYB148 may function as an integrative component in lignin-related regulatory networks. However, the PPI/PDI of the nine CpMYB TFs were derived from Arabidopsis homologs and based on bioinformatic predictions, which may not fully reflect their roles in elephant grass. Further experimental validation will be important to confirm their specific regulatory functions. Despite these limitations, our findings provide a valuable resource of CpMYB TF candidates involved in the transcriptional regulation of lignin biosynthesis, laying a foundation for future functional studies and potential genetic improvement of forage quality.

5. Conclusions

In this study, a total of 247 members of the MYB TF family were identified in elephant grass, and these CpMYB TFs were classified into 23 distinct subgroups. Gene structure, conserved motif, and phylogenetic analyses revealed strong conservation among members within the same subgroup. Synteny and Ka/Ks analyses indicated that segmental duplication was the major driver of CpMYB family expansion. Expression profiling across internodes at three developmental stages revealed that 48 CpMYB genes were differentially expressed at least at one stage, with nine genes showing consistent differential expression across all three stages. PDI network predictions indicated that the target genes of four CpMYB TFs are likely involved in the phenylpropanoid biosynthesis pathway. Overall, this study provides the first comprehensive characterization of the MYB TF family in elephant grass and lays a foundation for future functional studies of lignin biosynthesis in this important forage species.

Supplementary Materials

The following supporting information can be downloaded at https://www.mdpi.com/article/10.3390/agronomy15061326/s1. Figure S1: Genomic distribution of 14 CpMYB genes on unassembled contigs in elephant grass; Figure S2: Location of MYB DNA-binding domain in CpMYB proteins; Figure S3: Tissue-specific expression patterns of 247 CpMYB genes in elephant grass; Figure S4: Expression patterns of eight elephant grass genes predicted to interact with four CpMYB proteins; Table S1: Locus ID information of MYB TFs used as query sequences in BLASTP analysis; Table S2: Sequences of specific primers; Table S3: The protein sequence of 247 CpMYB TFs; Table S4: Physicochemical properties of 247 CpMYB TFs; Table S5: The structural features of motif 1–10; Table S6: The secondary structure of 23 CpMYB proteins; Table S7: List of the CpMYB tandem duplication gene pairs; Table S8: List of the Ka, Ks, and Ka/Ks in CpMYB segmental duplication gene pairs; Table S9: Tissue-specifically highly expressed CpMYB genes; Table S10: Homologous genes and functional annotation of 9 CpMYB genes in Arabidopsis and rice; Table S11: Functional annotation of proteins interacting with four CpMYB proteins in Arabidopsis; Table S12: Functional annotation of eight target genes regulated by four CpMYB proteins.

Author Contributions

Conceptualization, D.L.; methodology, D.L. and Q.W.; software, Q.W. and M.R.; validation, Q.W., F.L. and Z.M.; formal analysis, Q.W.; investigation, Q.W.; resources, D.L.; data curation, M.R.; writing—original draft preparation, Q.W.; writing—review and editing, D.L.; visualization, F.L.; supervision, D.L.; project administration, D.L.; funding acquisition, D.L. All authors have read and agreed to the published version of the manuscript.

Funding

This research was supported by the National Natural Science Foundation of China (32301508), the Guangxi University High-level Talent Program—Associate Professor—Dong Luo (ZX01080033424002), and the Innovation Project of Guangxi Graduate Education (YCSW2024022).

Data Availability Statement

The original contributions presented in this study are included in the article and Supplementary Materials. Further inquiries can be directed to the corresponding author luodong@gxu.edu.cn.

Conflicts of Interest

The authors declare no conflicts of interest.

References

  1. Higuchi, T. Biosynthesis of lignin. In Plant Carbohydrates II: Extracellular Carbohydrates; Springer: Berlin/Heidelberg, Germany, 1981; pp. 194–224. [Google Scholar]
  2. Liu, Q.; Luo, L.; Zheng, L. Lignins: Biosynthesis and biological functions in plants. Int. J. Mol. Sci. 2018, 19, 335. [Google Scholar] [CrossRef] [PubMed]
  3. Yadav, S.; Chattopadhyay, D. Lignin: The building block of defense responses to stress in plants. J. Plant Growth Regul. 2023, 42, 6652–6666. [Google Scholar] [CrossRef]
  4. Zhong, H.; Zhou, J.; Abdelrahman, M.; Xu, H.; Wu, Z.; Cui, L.; Ma, Z.; Yang, L.; Li, X. The effect of lignin composition on ruminal fiber fractions degradation from different roughage sources in water buffalo (Bubalus bubalis). Agriculture 2021, 11, 1015. [Google Scholar] [CrossRef]
  5. Courtial, A.; Soler, M.; Chateigner-Boutin, A.-L.; Reymond, M.; Méchin, V.; Wang, H.; Grima-Pettenati, J.; Barrière, Y. Breeding grasses for capacity to biofuel production or silage feeding value: An updated list of genes involved in maize secondary cell wall biosynthesis and assembly. Maydica 2013, 58, 67–102. [Google Scholar]
  6. Baucher, M.; Bernard-Vailhé, M.A.; Chabbert, B.; Besle, J.M.; Opsomer, C.; Van Montagu, M.; Botterman, J. Down-regulation of cinnamyl alcohol dehydrogenase in transgenic alfalfa (Medicago sativa L.) and the effect on lignin composition and digestibility. Plant Mol. Biol. 1999, 39, 437–447. [Google Scholar] [CrossRef]
  7. Rao, X.; Chen, X.; Shen, H.; Ma, Q.; Li, G.; Tang, Y.; Pena, M.; York, W.; Frazier, T.P.; Lenaghan, S.; et al. Gene regulatory networks for lignin biosynthesis in switchgrass (Panicum virgatum). Plant Biotechnol. J. 2017, 15, 850–863. [Google Scholar] [CrossRef]
  8. Godin, B.; Nagle, N.; Sattler, S.; Agneessens, R.; Delcarte, J.; Wolfrum, E. Improved sugar yields from biomass sorghum feedstocks: Comparing low-lignin mutants and pretreatment chemistries. Biotechnol. Biofuels. 2016, 9, 251. [Google Scholar] [CrossRef]
  9. Vanholme, R.; De Meester, B.; Ralph, J.; Boerjan, W. Lignin biosynthesis and its integration into metabolism. Curr. Opin. Biotechnol. 2019, 56, 230–239. [Google Scholar] [CrossRef]
  10. Zhong, R.; Ye, Z.-H. Transcriptional regulation of lignin biosynthesis. Plant Signal Behav. 2009, 4, 1028–1034. [Google Scholar] [CrossRef]
  11. Ralph, J.; Lapierre, C.; Boerjan, W. Lignin structure and its engineering. Curr. Opin. Biotechnol. 2019, 56, 240–249. [Google Scholar] [CrossRef]
  12. Anderson, N.A.; Chapple, C. Perturbing lignin biosynthesis: Metabolic changes in response to manipulation of the phenylpropanoid pathway. Recent Adv. Polyphenol Res. 2014, 4, 39–59. [Google Scholar]
  13. Rao, X.; Barros, J. Modeling lignin biosynthesis: A pathway to renewable chemicals. Trends Plant Sci. 2024, 29, 546–559. [Google Scholar] [CrossRef]
  14. Schwechheimer, C.; Zourelidou, M.; Bevan, M.W. Plant transcription factor studies. Annu. Rev. Plant Biol. 1998, 49, 127–150. [Google Scholar] [CrossRef]
  15. Öhman, D.; Demedts, B.; Kumar, M.; Gerber, L.; Gorzsás, A.; Goeminne, G.; Hedenström, M.; Ellis, B.; Boerjan, W.; Sundberg, B. MYB103 is required for FERULATE-5-HYDROXYLASE expression and syringyl lignin biosynthesis in Arabidopsis stems. Plant J. 2013, 73, 63–76. [Google Scholar] [CrossRef]
  16. Yamaguchi, M.; Goué, N.; Igarashi, H.; Ohtani, M.; Nakano, Y.; Mortimer, J.C.; Nishikubo, N.; Kubo, M.; Katayama, Y.; Kakegawa, K.; et al. Vascular-related nac-domain6 and vascular-related nac-domain7 effectively induce trans-differentiation into xylem vessel elements under control of an induction system. Plant Physiol. 2010, 153, 906–914. [Google Scholar] [CrossRef] [PubMed]
  17. Yang, L.; Zhao, X.; Yang, F.; Fan, D.; Jiang, Y.; Luo, K. PtrWRKY19, a novel WRKY transcription factor, contributes to the regulation of pith secondary wall formation in Populus trichocarpa. Sci. Rep. 2016, 6, 18643. [Google Scholar] [CrossRef] [PubMed]
  18. Zhao, W.; Ding, L.; Liu, J.; Zhang, X.; Li, S.; Zhao, K.; Guan, Y.; Song, A.; Wang, H.; Chen, S.; et al. Regulation of lignin biosynthesis by an atypical bHLH protein CmHLB in chrysanthemum. J. Exp. Bot. 2022, 73, 2403–2419. [Google Scholar] [CrossRef]
  19. Xiao, R.; Zhang, C.; Guo, X.; Li, H.; Lu, H. MYB transcription factors and its regulation in secondary cell wall formation and lignin biosynthesis during xylem development. Int. J. Mol. Sci. 2021, 22, 3560. [Google Scholar] [CrossRef]
  20. Du, H.; Zhang, L.; Liu, L.; Tang, X.; Yang, W.; Wu, Y.; Huang, Y.; Tang, Y. Biochemical and molecular characterization of plant MYB transcription factor family. Biochemistry 2009, 74, 1–11. [Google Scholar] [CrossRef]
  21. Jiang, C.; Rao, G. Insights into the diversification and evolution of R2R3-MYB transcription factors in plants. Plant Physiol. 2020, 183, 637–655. [Google Scholar] [CrossRef]
  22. Cao, Y.; Li, K.; Li, Y.; Zhao, X.; Wang, L. MYB transcription factors as regulators of secondary metabolism in plants. Biology 2020, 9, 61. [Google Scholar] [CrossRef] [PubMed]
  23. Chen, Y.; Yang, X.; He, K.; Liu, M.; Li, J.; Gao, Z.; Lin, Z.; Zhang, Y.; Wang, X.; Qiu, X.; et al. The MYB transcription factor superfamily of Arabidopsis: Expression analysis and phylogenetic comparison with the rice MYB family. Plant Mol. Biol. 2006, 60, 107–124. [Google Scholar]
  24. Chen, C.; Zhang, K.; Khurshid, M.; Li, J.; He, M.; Georgiev, M.I.; Zhang, X.; Zhou, M. MYB transcription repressors regulate plant secondary metabolism. Crit. Rev. Plant Sci. 2019, 38, 159–170. [Google Scholar] [CrossRef]
  25. Feller, A.; Machemer, K.; Braun, E.L.; Grotewold, E. Evolutionary and comparative analysis of MYB and bHLH plant transcription factors. Plant J. 2011, 66, 94–116. [Google Scholar] [CrossRef]
  26. Zhang, S.; Yang, J.; Li, H.; Chiang, V.L.; Fu, Y. Cooperative regulation of flavonoid and lignin biosynthesis in plants. Crit. Rev. Plant Sci. 2021, 40, 109–126. [Google Scholar] [CrossRef]
  27. Zhang, J.; Tuskan, G.A.; Tschaplinski, T.J.; Muchero, W.; Chen, J.G. Transcriptional and post-transcriptional regulation of lignin biosynthesis pathway genes in Populus. Front. Plant Sci. 2020, 11, 592670. [Google Scholar] [CrossRef]
  28. Zhou, J.; Lee, C.; Zhong, R.; Ye, Z.-H. MYB58 and MYB63 are transcriptional activators of the lignin biosynthetic pathway during secondary cell wall formation in Arabidopsis. Plant Cell 2009, 21, 248–266. [Google Scholar] [CrossRef]
  29. Wang, S.; Li, E.; Porth, I.; Chen, J.-G.; Mansfield, S.D.; Douglas, C.J. Regulation of secondary cell wall biosynthesis by poplar R2R3 MYB transcription factor PtrMYB152 in Arabidopsis. Sci. Rep. 2014, 4, 5054. [Google Scholar] [CrossRef]
  30. Minmunin, J.; Limpitipanich, P.; Promwungkwa, A. Delignification of elephant grass for production of cellulosic intermediate. Energy Procedia 2015, 79, 220–225. [Google Scholar] [CrossRef]
  31. Morais, R.F.; Quesada, D.M.; Reis, V.M.; Urquiaga, S.; Alves, B.J.R.; Boddey, R.M. Contribution of biological nitrogen fixation to elephant grass (Pennisetum purpureum Schum.). Plant Soil 2012, 356, 23–34. [Google Scholar] [CrossRef]
  32. Johannes, L.P.; Minh, T.T.N.; Xuan, T.D. Elephant grass (Pennisetum purpureum): A bioenergy resource overview. Biomass 2024, 4, 625–646. [Google Scholar] [CrossRef]
  33. Habte, E.; Muktar, M.S.; Abdena, A.; Hanson, J.; Sartie, A.M.; Negawo, A.T.; Machado, J.C.; Ledo, F.J.S.; Jones, C.S. Forage performance and detection of marker trait associations with potential for Napier grass (Cenchrus purpureus) improvement. Agronomy 2020, 10, 542. [Google Scholar] [CrossRef]
  34. Zhang, W.; Zhang, S.; Lu, X.; Li, C.; Liu, X.; Dong, G.; Xia, T. Tissue-specific transcriptome analysis reveals lignocellulose synthesis regulation in elephant grass (Pennisetum purpureum Schum). BMC Plant Biol. 2020, 20, 528. [Google Scholar] [CrossRef]
  35. Mao, C.; Zhang, J.; Zhang, Y.; Wang, B.; Li, W.; Wang, X.; Huang, L. Genome-wide analysis of the WRKY gene family and their response to low-temperature stress in elephant grass. BMC Genom. 2024, 25, 947. [Google Scholar] [CrossRef]
  36. Jin, Y.; Luo, J.; Yang, Y.; Jia, J.; Sun, M.; Wang, X.; Khan, I.; Huang, D.; Huang, L. The evolution and expansion of RWP-RK gene family improve the heat adaptability of elephant grass (Pennisetum purpureum Schum.). BMC Genom. 2023, 24, 510. [Google Scholar] [CrossRef]
  37. Yan, Q.; Lu, L.; Yi, X.; Pereira, J.F.; Zhang, J. Comparative transcriptome analyses reveal regulatory network and hub genes of aluminum response in roots of elephant grass (Cenchrus purpureus). J. Hazard. Mater. 2024, 476, 135011. [Google Scholar] [CrossRef] [PubMed]
  38. Yan, Q.; Wu, F.; Xu, P.; Sun, Z.; Li, J.; Gao, L.; Lu, L.; Chen, D.; Muktar, M.; Jones, C.; et al. The elephant grass (Cenchrus purpureus) genome provides insights into anthocyanidin accumulation and fast growth. Mol. Ecol. Resour. 2021, 21, 526–542. [Google Scholar] [CrossRef]
  39. Jin, J.; Tian, F.; Yang, D.-C.; Meng, Y.-Q.; Kong, L.; Luo, J.; Gao, G. PlantTFDB 4.0: Toward a central hub for transcription factors and regulatory interactions in plants. Nucleic Acids Res. 2017, 45, D1040–D1045. [Google Scholar] [CrossRef] [PubMed]
  40. Mistry, J.; Chuguransky, S.; Williams, L.; Qureshi, M.; Salazar, G.A.; Sonnhammer, E.L.L.; Tosatto, S.C.E.; Paladin, L.; Raj, S.; Richardson, L.J.; et al. Pfam: The protein families database in 2021. Nucleic Acids Res. 2021, 49, D412–D419. [Google Scholar] [CrossRef]
  41. Altschul, S.F.; Madden, T.L.; Schäffer, A.A.; Zhang, J.; Zhang, Z.; Miller, W.; Lipman, D.J. Gapped BLAST and PSI-BLAST: A new generation of protein database search programs. Nucleic Acids Res. 1997, 25, 3389–3402. [Google Scholar] [CrossRef]
  42. Eddy, S.R. Accelerated profile HMM searches. PLoS Comput. Biol. 2011, 7, e1002195. [Google Scholar] [CrossRef]
  43. Paysan-Lafosse, T.; Blum, M.; Chuguransky, S.; Grego, T.; Pinto, B.L.; Salazar, G.A.; Bileschi, M.L.; Bork, P.; Bridge, A.; Colwell, L.; et al. InterPro in 2022. Nucleic Acids Res. 2023, 51, D418–D427. [Google Scholar] [CrossRef] [PubMed]
  44. Lu, S.; Wang, J.; Chitsaz, F.; Derbyshire, M.K.; Geer, R.C.; Gonzales, N.R.; Gwadz, M.; Hurwitz, D.I.; Marchler, G.H.; Song, J.S.; et al. CDD/SPARCLE: The conserved domain database in 2020. Nucleic Acids Res. 2020, 48, D265–D268. [Google Scholar] [CrossRef] [PubMed]
  45. Gasteiger, E.; Hoogland, C.; Gattiker, A.; Duvaud, S.; Wilkins, M.R.; Appel, R.D.; Bairoch, A. Protein Identification and Analysis Tools on the Expasy Server. In The Proteomics Protocols Handbook; Walker, J.M., Ed.; Humana Press: Totowa, NJ, USA, 2005; pp. 571–607. [Google Scholar]
  46. Horton, P.; Park, K.-J.; Obayashi, T.; Fujita, N.; Harada, H.; Adams-Collier, C.J.; Nakai, K. WoLF PSORT: Protein localization predictor. Nucleic Acids Res. 2007, 35, W585–W587. [Google Scholar] [CrossRef]
  47. Chao, J.; Li, Z.; Sun, Y.; Aluko, O.O.; Wu, X.; Wang, Q.; Liu, G. MG2C: A user-friendly online tool for drawing genetic maps. Mol. Hortic. 2021, 1, 16. [Google Scholar] [CrossRef] [PubMed]
  48. Kumar, S.; Stecher, G.; Tamura, K. MEGA7: Molecular evolutionary genetics analysis version 7.0 for bigger datasets. Mol. Biol. Evol. 2016, 33, 1870–1874. [Google Scholar] [CrossRef]
  49. Cao, Y.; Han, Y.; Li, D.; Lin, Y.; Cai, Y. MYB transcription factors in Chinese pear (Pyrus bretschneideri Rehd.): Genome-wide identification, classification, and expression profiling during fruit development. Front. Plant Sci. 2016, 7, 577. [Google Scholar] [CrossRef]
  50. Sun, W.; Ma, Z.; Chen, H.; Liu, M. MYB gene family in potato (Solanum tuberosum L.): Genome-wide identification of hormone-responsive reveals their potential functions in growth and development. Int. J. Mol. Sci. 2019, 20, 4847. [Google Scholar] [CrossRef]
  51. Letunic, I.; Bork, P. Interactive Tree of Life (iTOL) v6: Recent updates to the phylogenetic tree display and annotation tool. Nucleic Acids Res. 2024, 52, W78–W82. [Google Scholar] [CrossRef]
  52. Chen, C.; Wu, Y.; Li, J.; Wang, X.; Zeng, Z.; Xu, J.; Liu, L.; Feng, J.; Chen, H.; He, Y.; et al. TBtools-II: A ‘one for all, all for one’ bioinformatics platform for biological big-data mining. Mol. Plant. 2023, 16, 1733–1742. [Google Scholar] [CrossRef]
  53. Bailey, T.L.; Johnson, J.; Grant, C.E.; Noble, W.S. The MEME Suite. Nucleic Acids Res. 2015, 43, W39–W49. [Google Scholar] [CrossRef] [PubMed]
  54. Waterhouse, A.; Bertoni, M.; Bienert, S.; Studer, G.; Tauriello, G.; Gumienny, R.; Heer, F.T.; de Beer, T.A.P.; Rempfer, C.; Bordoli, L.; et al. SWISS-MODEL: Homology modelling of protein structures and complexes. Nucleic Acids Res. 2018, 46, W296–W303. [Google Scholar] [CrossRef] [PubMed]
  55. Geourjon, C.; Deléage, G. SOPMA: Significant improvements in protein secondary structure prediction by consensus prediction from multiple alignments. Bioinformatics 1995, 11, 681–684. [Google Scholar] [CrossRef]
  56. Sun, M.; Yan, H.; Zhang, A.; Jin, Y.; Lin, C.; Luo, L.; Wu, B.; Fan, Y.; Tian, S.; Cao, X.; et al. Milletdb: A multi-omics database to accelerate the research of functional genomics and molecular breeding of millets. Plant Biotechnol. J. 2023, 21, 2348–2357. [Google Scholar] [CrossRef] [PubMed]
  57. Love, M.I.; Huber, W.; Anders, S. Moderated estimation of fold change and dispersion for RNA-seq data with DESeq2. Genome Biol. 2014, 15, 550. [Google Scholar] [CrossRef]
  58. Lescot, M.; Déhais, P.; Thijs, G.; Marchal, K.; Moreau, Y.; Van de Peer, Y.; Rouzé, P.; Rombauts, S. PlantCARE: A database of plant cis-acting regulatory elements and a portal to tools for in silico analysis of promoter sequences. Nucleic Acids Res. 2002, 30, 325–327. [Google Scholar] [CrossRef]
  59. Szklarczyk, D.; Nastou, K.; Koutrouli, M.; Kirsch, R.; Mehryary, F.; Hachilif, R.; Hu, D.; Peluso, M.E.; Huang, Q.; Fang, T.; et al. The STRING database in 2025: Protein networks with directionality of regulation. Nucleic Acids Res. 2025, 53, D730–D737. [Google Scholar] [CrossRef]
  60. Palaniswamy, S.K.; James, S.; Sun, H.; Lamb, R.S.; Davuluri, R.V.; Grotewold, E. AGRIS and AtRegNet: A platform to link cis-regulatory elements and transcription factors into regulatory networks. Plant Physiol. 2006, 140, 818–829. [Google Scholar] [CrossRef]
  61. Livak, K.J.; Schmittgen, T.D. Analysis of relative gene expression data using real-time quantitative PCR and the 2−ΔΔCT method. Methods 2001, 25, 402–408. [Google Scholar] [CrossRef]
  62. Wilson, J.R. Cell wall characteristics in relation to forage digestion by ruminants. J. Agric. Sci. 1994, 122, 173–182. [Google Scholar] [CrossRef]
  63. Plasencia, A. Transcriptional Regulation of Wood Formation in Eucalyptus: Role of MYB Transcription Factors and Protein–Protein Interactions. Ph.D. Thesis, Université Paul Sabatier, Toulouse, France, 2015. [Google Scholar]
  64. Hussey, S.G. Transcriptional regulation of secondary cell wall formation and lignification. In Advances in Botanical Research; Academic Press: London, UK, 2022; Volume 104, pp. 317–361. [Google Scholar]
  65. Muktar, M.S.; Habte, E.; Teshome, A.; Assefa, Y.; Negawo, A.T.; Lee, K.-W.; Zhang, J.; Jones, C.S. Insights into the genetic architecture of complex traits in Napier grass (Cenchrus purpureus) and QTL regions governing forage biomass yield, water use efficiency and feed quality traits. Front. Plant Sci. 2022, 12, 788102. [Google Scholar] [CrossRef] [PubMed]
  66. Katiyar, A.; Smita, S.; Lenka, S.K.; Rajwanshi, R.; Chinnusamy, V.; Bansal, K.C. Genome-wide classification and expression analysis of MYB transcription factor families in rice and Arabidopsis. BMC Genom. 2012, 13, 544. [Google Scholar] [CrossRef] [PubMed]
  67. Lu, M.; Chen, Z.; Dang, Y.; Li, J.; Wang, J.; Zheng, H.; Li, S.; Wang, X.; Du, X.; Sui, N. Identification of the MYB gene family in Sorghum bicolor and functional analysis of SbMYBAS1 in response to salt stress. Plant Mol. Biol. 2023, 113, 249–264. [Google Scholar] [CrossRef] [PubMed]
  68. Zhou, Q.; Jia, C.; Ma, W.; Cui, Y.; Jin, X.; Luo, D.; Min, X.; Liu, Z. MYB transcription factors in alfalfa (Medicago sativa): Genome-wide identification and expression analysis under abiotic stresses. PeerJ 2019, 7, e7714. [Google Scholar] [CrossRef]
  69. Sukumaran, S.; Lethin, J.; Liu, X.; Pelc, J.; Zeng, P.; Hassan, S.; Aronsson, H. Genome-wide analysis of MYB transcription factors in the wheat genome and their roles in salt stress response. Cells 2023, 12, 1431. [Google Scholar] [CrossRef]
  70. Wang, Y.; Tu, H.; Zhang, J.; Wang, H.; Liu, Z.; Zhou, J.; He, W.; Lin, Y.; Zhang, Y.; Li, M.; et al. Identifying potential anthocyanin biosynthesis regulator in Chinese cherry by comprehensive genome-wide characterization of the R2R3-MYB transcription factor gene family. BMC Genom. 2024, 25, 784. [Google Scholar] [CrossRef]
  71. Jia, D.; Jiang, Z.; Fu, H.; Chen, L.; Liao, G.; He, Y.; Huang, C.; Xu, X. Genome-wide identification and comprehensive analysis of NAC family genes involved in fruit development in kiwifruit (Actinidia). BMC Plant Biol. 2021, 21, 44. [Google Scholar] [CrossRef]
  72. Yan, W.; Dong, X.; Li, R.; Zhao, X.; Zhou, Q.; Luo, D.; Liu, Z. Genome-wide identification of JAZ gene family members in autotetraploid cultivated alfalfa (Medicago sativa subsp. sativa) and expression analysis under salt stress. BMC Genom. 2024, 25, 636. [Google Scholar] [CrossRef]
  73. Wang, A.; Liang, K.; Yang, S.; Cao, Y.; Wang, L.; Zhang, M.; Zhang, L. Genome-wide analysis of MYB transcription factors of Vaccinium corymbosum and their positive responses to drought stress. BMC Genom. 2021, 22, 565. [Google Scholar] [CrossRef]
  74. Spies, F.P.; Perotti, M.F.; Cho, Y.; Jo, C.I.; Hong, J.C.; Chan, R.L. A complex tissue-specific interplay between the Arabidopsis transcription factors AtMYB68, AtHB23, and AtPHL1 modulates primary and lateral root development and adaptation to salinity. Plant J. 2023, 115, 952–966. [Google Scholar] [CrossRef]
  75. Ko, J.H.; Kim, W.C.; Kim, J.Y.; Ahn, S.J.; Han, K.H. MYB46-mediated transcriptional regulation of secondary wall biosynthesis. Mol. Plant 2012, 5, 961–963. [Google Scholar] [CrossRef] [PubMed]
  76. Yu, J.; Yuan, Y.; Dong, L.; Cui, G. Genome-wide investigation of NLP gene family members in alfalfa (Medicago sativa L.): Evolution and expression profiles during development and stress. BMC Genom. 2023, 24, 320. [Google Scholar] [CrossRef] [PubMed]
  77. Levasseur, A.; Pontarotti, P. The role of duplications in the evolution of genomes highlights the need for evolutionary-based approaches in comparative genomics. Biol. Direct 2011, 6, 11. [Google Scholar] [CrossRef] [PubMed]
  78. Li, H.; Wen, X.; Wei, M.; Huang, X.; Dai, S.; Ruan, L.; Yu, Y. Genome-wide identification, characterization, and expression pattern of MYB gene family in Melastoma candidum. Horticulturae 2023, 9, 708. [Google Scholar] [CrossRef]
  79. Chen, Q.; Zhang, X.; Fang, Y.; Wang, B.; Xu, S.; Zhao, K.; Zhang, J.; Fang, J. Genome-wide identification and expression analysis of the R2R3-MYB transcription factor family revealed their potential roles in the flowering process in longan (Dimocarpus longan). Front. Plant Sci. 2022, 13, 1016794. [Google Scholar] [CrossRef]
  80. Dong, X.; Han, B.; Yin, X.; Mao, P.; Luo, D.; Zhou, Q.; Liu, Z. Genome-wide identification of the GRAS transcription factor family in autotetraploid cultivated alfalfa (Medicago sativa L.) and expression analysis under drought stress. Ind. Crops Prod. 2023, 194, 116379. [Google Scholar] [CrossRef]
  81. Mmadi, M.A.; Dossa, K.; Wang, L.; Sy, M.O.; Zhang, X. Functional characterization of the versatile MYB gene family uncovered their important roles in plant development and responses to drought and waterlogging in sesame. Genes 2017, 8, 362. [Google Scholar] [CrossRef]
  82. Fang, Y.; You, J.; Xie, K.; Xie, W.; Xiong, L. Systematic sequence analysis and identification of tissue-specific or stress-responsive genes of NAC transcription factor family in rice. Mol. Genet. Genom. 2008, 280, 547–563. [Google Scholar] [CrossRef]
  83. Chen, L.; Auh, C.; Chen, F.; Cheng, X.; Aljoe, H.; Dixon, R.A.; Wang, Z. Lignin deposition and associated changes in anatomy, enzyme activity, gene expression, and ruminal degradability in stems of tall fescue at different developmental stages. J. Agric. Food Chem. 2002, 50, 5558–5565. [Google Scholar] [CrossRef]
  84. Abiven, S.; Heim, A.; Schmidt, M.W. Lignin content and chemical characteristics in maize and wheat vary between plant organs and growth stages: Consequences for assessing lignin dynamics in Soil. Plant Soil 2011, 343, 369–378. [Google Scholar] [CrossRef]
  85. Biłas, R.; Szafran, K.; Hnatuszko-Konka, K.; Kononowicz, A.K. Cis-regulatory elements used to control gene expression in plants. Plant Cell Tissue Organ Cult. 2016, 127, 269–287. [Google Scholar] [CrossRef]
  86. Kebrom, T.H.; McKinley, B.; Mullet, J.E. Dynamics of gene expression during development and expansion of vegetative stem internodes of bioenergy sorghum. Biotechnol. Biofuels 2017, 10, 159. [Google Scholar] [CrossRef] [PubMed]
  87. Noda, S.; Koshiba, T.; Hattori, T.; Yamaguchi, M.; Suzuki, S.; Umezawa, T. The expression of a rice secondary wall-specific cellulose synthase gene, OsCesA7, is directly regulated by a rice transcription factor, OsMYB58/63. Planta 2015, 242, 589–600. [Google Scholar] [CrossRef] [PubMed]
  88. Ma, R.; Liu, B.; Geng, X.; Ding, X.; Yan, N.; Sun, X.; Wang, W.; Sun, X.; Zheng, C. Biological function and stress response mechanism of MYB transcription factor family genes. J. Plant Growth Regul. 2023, 42, 83–95. [Google Scholar] [CrossRef]
  89. Zou, T.; Ye, Q.; Lu, L.; Xin, S.; Wang, R.; Xiong, P.; Li, Q.; Zhang, X.; Huang, C.; Tan, L.; et al. OsMYB103 targets and interacts with AMD1 to form a feed-forward loop for pollen development in rice. Plant J. 2025, 122, e70164. [Google Scholar] [CrossRef]
  90. Nishawy, E. Functional characterization of MYB gene in rice. Egypt J. Desert Res. 2023, 73, 1–21. [Google Scholar] [CrossRef]
  91. Ohtani, M.; Demura, T. The quest for transcriptional hubs of lignin biosynthesis: Beyond the NAC-MYB-gene regulatory network model. Curr. Opin. Biotechnol. 2019, 56, 82–87. [Google Scholar] [CrossRef]
  92. Fellenberg, C.; van Ohlen, M.; Handrick, V.; Vogt, T. The role of CCoAOMT1 and COMT1 in Arabidopsis anthers. Planta 2012, 236, 51–61. [Google Scholar] [CrossRef]
  93. Yang, S.X.; Wu, T.T.; Ding, C.H.; Zhou, P.C.; Chen, Z.Z.; Gou, J.Y. SAHH and SAMS form a methyl donor complex with CCoAOMT7 for methylation of phenolic compounds. Biochem. Biophys. Res. Commun. 2019, 520, 122–127. [Google Scholar] [CrossRef]
  94. Wang, Y.; Zhang, W.Z.; Song, L.F.; Zou, J.J.; Su, Z.; Wu, W.H. Transcriptome analyses show changes in gene expression to accompany pollen germination and tube growth in Arabidopsis. Plant Physiol. 2008, 148, 1201–1211. [Google Scholar] [CrossRef]
  95. Soltani, B.M.; Ehlting, J.; Douglas, C.J. Genetic Analysis and epigenetic silencing of At4CL1 and At4CL2 expression in transgenic Arabidopsis. Biotechnol. J. 2006, 1, 1124–1136. [Google Scholar] [CrossRef] [PubMed]
  96. Sykes, R.W.; Gjersing, E.L.; Foutz, K.; Rottmann, W.H.; Kuhn, S.A.; Foster, C.E.; Ziebell, A.; Turner, G.B.; Decker, S.R.; Hinchee, M.A.W.; et al. Down-Regulation of p-Coumaroyl Quinate/Shikimate 3′-Hydroxylase (C3′H) and Cinnamate 4-Hydroxylase (C4H) genes in the lignin biosynthetic pathway of Eucalyptus urophylla × E. grandis leads to improved sugar release. Biotechnol. Biofuels 2015, 8, 128. [Google Scholar] [CrossRef] [PubMed]
  97. Wang, S.; Yamaguchi, M.; Grienenberger, E.; Martone, P.T.; Samuels, A.L.; Mansfield, S.D. The Class II KNOX genes KNAT3 and KNAT7 work cooperatively to influence deposition of secondary cell walls that provide mechanical support to Arabidopsis stems. Plant J. 2020, 101, 293–309. [Google Scholar] [CrossRef] [PubMed]
Figure 1. The characteristics and genome positions of CpMYB members in elephant grass. (A) Distribution of protein sequence lengths (in amino acids, AA). (B) Molecular weight (kDa) distribution of CpMYB proteins. (C) The position of CpMYB genes in the elephant grass genome.
Agronomy 15 01326 g001
Figure 2. Phylogenetic analysis of CpMYB and AtMYB protein. The phylogenetic tree illustrates evolutionary relationships among MYB proteins from elephant grass and Arabidopsis. Full-length protein sequences were aligned using ClustalW, and the tree was constructed using the NJ method in MEGA7 with 1000 bootstrap replicates. Subgroups are color-coded for clarity, with red stars indicating elephant grass MYB proteins and purple circle representing Arabidopsis MYB proteins.
Agronomy 15 01326 g002
Figure 3. This figure integrates phylogenetic and structural analyses of CpMYB genes. (A) CpMYB protein phylogenetic relationships; (B) Exon-intron structures of CpMYB genes, with exons depicted as light green boxes and introns as black lines. (C) Distribution of 10 conserved motifs (numbered 1–10) in CpMYB proteins, represented by distinct colored boxes.
Agronomy 15 01326 g003
Figure 4. Three-dimensional structural models of 23 CpMYB proteins. This figure displays the predicted 3D structural models of 23 CpMYB proteins and the model quality was evaluated using GMQE.
Agronomy 15 01326 g004
Figure 5. Synteny analysis of CpMYB genes in elephant grass. (A) Intra−species synteny within elephant grass: Gray lines indicate all synteny blocks, while red lines highlight segmentally duplicated CpMYB gene pairs and green line highlight tandem duplication gene pairs. Gene density is represented by yellow boxes, and CpMYB gene GC ratio are shown in red boxes. (B) Evolutionary constraints on segment duplication CpMYB gene pairs: Ka/Ks ratios are plotted, with the black line marking Ka/Ks = 1. (C) Inter-species synteny: Collinear blocks between elephant grass and four reference species are depicted by gray lines, with red lines emphasizing syntenic CpMYB gene pairs.
Agronomy 15 01326 g005
Figure 6. The schematic diagram of different tissues of elephant grass and the expression of five CpMYB genes in different tissues. Gene expression levels are represented by Z-scores of log2(TPM) values, with blue and red indicating low and high expression levels of CpMYB genes, respectively. The numerical values shown on the heatmap correspond to the original TPM values, which represent the mean of three biological replicates.
Agronomy 15 01326 g006
Figure 7. Differential expression of CpMYB genes across developmental stages in elephant grass. (A) Schematic diagram illustrating elephant grass morphology at three developmental periods (T1, T2, T3). (B) Heat map showing the differential expression of CpMYB genes at the T1 period. (C) Heat map showing the differential expression of CpMYB genes at the T2 period. (D) Heat map showing the differential expression of CpMYB genes at the T3 period. For (BD), gene expression levels are represented by Z-scores of log2(FPKM) values, which represent the mean of three biological replicates. Blue and red indicate low and high expression levels, respectively. Numerical values on the heatmaps correspond to the original FPKM values. Genes marked with red pentagrams are discussed in the Section 3.8.
Agronomy 15 01326 g007
Figure 8. Cis-regulatory element analysis of CpMYB genes in elephant grass. (A) The number of cis-regulatory elements in the 2000 bp upstream promoter region; (B) The number of plant hormone, plant growth, and stress response elements for each CpMYB genes. Genes marked with red pentagrams indicate those specifically described in the Section 3.9.
Agronomy 15 01326 g008
Figure 9. Expression pattern analysis of six CpMYB genes. (A) RT-qPCR analysis of six selected CpMYB genes at three developmental stages. (B) Cartoon-based visualization of RT-qPCR results for six selected CpMYB genes in elephant grass. The gray areas indicate tissues not analyzed in this study. The gene expression levels are represented by Z-scores of relative expression values (2−ΔΔCt), calculated as the mean of three biological replicates. Blue and red indicate low and high expression levels of CpMYB genes, respectively.
Agronomy 15 01326 g009
Figure 10. This figure integrates multiple analyses of nine CpMYB gene expressions and interactions. (A) Venn diagram illustrating the overlap of differentially expressed CpMYB genes across the three growth periods (T1, T2, and T3). (B) Heatmaps showing the expression profiles of nine CpMYB genes in three periods. (C) Correlation matrix of the nine CpMYB genes, with red and blue indicating positive and negative correlations, respectively. (D) Predicted protein interaction network based on orthologs of CpMYB genes from Arabidopsis. (E) Predicted PDI network based on orthologs of CpMYB genes from Arabidopsis. (F) Expression levels of the target genes regulated by four CpMYB TFs in elephant grass. For (B,F), the gene expression levels are represented by Z-scores of log2(FPKM) values, calculated as the mean of three biological replicates. Blue and red indicate low and high expression levels, respectively. The numerical values on the heatmaps correspond to the original FPKM values.
Agronomy 15 01326 g010
Disclaimer/Publisher’s Note: The statements, opinions and data contained in all publications are solely those of the individual author(s) and contributor(s) and not of MDPI and/or the editor(s). MDPI and/or the editor(s) disclaim responsibility for any injury to people or property resulting from any ideas, methods, instructions or products referred to in the content.

