Abstract
Plant height is a key agronomic trait in soybeans, directly influencing yield potential and agronomic performance. In this study, the tall-stem cultivar Heinong 63 and the dwarf-stem cultivar Longken 3077, along with their F2 populations, were used as experimental materials. A preliminary mapping using the bulk segregant analysis sequencing (BSA-Seq) approach enabled us to locate the target locus within a 1.8 Mb interval, which was subsequently narrowed to a 48.3 kb region using simple sequence repeat (SSR) and insertion and deletion (InDel) markers. The interval was designated as PH19-31 and contained nine annotated genes. One InDel marker, PL7, was developed within this fine-mapped region. Based on an expression analysis of the nine candidate genes, Glyma.19G230000 and Glyma.19G230200 were identified as potential regulators of plant height in soybeans. This study provides valuable materials and technical support for the cloning of plant height-related genes and the molecular breeding of soybeans.
1. Introduction
Soybean (Glycine max L.) is a major global crop and an important source of plant-based protein and vegetable oil. As demand for plant-derived protein continues to grow, improving soybean yield and performance has become a key breeding objective. Among the traits affecting yield, plant height plays a particularly critical role, as it determines the plant architecture, lodging resistance, and suitability for mechanized harvesting. An optimal height enhances light capture and environmental adaptability [1,2]. Studies suggest that soybean yield increases with plant height up to an optimal range of 70–90 cm, while excessive elongation during late growth stages may reduce productivity [3]. Recent research has shown that optimizing plant height through the PH13 gene enhances yield under dense planting conditions, emphasizing the role of height regulation in improving soybean adaptability and productivity [4]. Therefore, plant height plays a crucial role in soybean cultivation and genetic improvement and is considered a fundamental target in modern breeding programs.
Significant progress has been made in dissecting the genetic basis of plant height in soybeans. Through the use of recombinant inbred line (RIL) populations and molecular markers, multiple quantitative trait loci (QTL) associated with plant height have been identified [5,6,7,8], reflecting the complex and polygenic nature of this trait. Recent advances have incorporated bulked segregant analysis sequencing (BSA-Seq) to improve mapping resolution and efficiency. BSA-Seq combined with SNP-index and Euclidean distance (ED) algorithms has been successfully applied to identify candidate genes in various species, including complex genomes such as hexaploid chrysanthemum, and has accelerated the identification of causal genes such as OsRR22, a salt-tolerant gene in rice, which enabled the rapid development of a new cultivar [9,10]. Studies using F2 populations and BSA-Seq have successfully mapped key plant-height-related QTLs and explored their relationship with other traits such as lodging resistance [11,12]. These findings demonstrate the effectiveness of BSA-Seq as a powerful tool for identifying trait-associated genomic regions and facilitating molecular breeding.
In this study, we aimed to identify novel loci associated with soybean plant height using a BSA-Seq strategy. A significant QTL was detected on chromosome 19 in an F2 population derived from a cross between a tall-stem and a dwarf-stem cultivar. This locus was fine-mapped to a 48.3 kb interval and was designated as PH19-31. Given its strong association with plant height variation and its potential applicability in marker-assisted breeding, PH19-31 was selected as the focal target for candidate gene discovery and functional analysis.
To further characterize this region, we used an integrated strategy combining BSA-Seq with the single nucleotide polymorphism (SNP)/insertion and deletion (InDel)-index, Euclidean distance (ED) algorithms, and SSR-based fine mapping to identify candidate loci in an F2 population. Simple sequence repeat (SSR) markers, known for their high polymorphism and co-dominant inheritance, were further used for fine mapping and candidate gene analysis. They remain widely used in soybean QTL analysis and marker-assisted selection due to their reliability and cost-effectiveness [13,14]. The results provide theoretical and practical support for plant architecture improvement, offer valuable materials for breeding high-yield and lodging-resistant soybean varieties, and highlight the potential of BSA-assisted fine mapping in trait dissection and molecular breeding.
2. Materials and Methods
2.1. Plant Material
The tall-stem cultivar Heinong 63 and the dwarf-stem cultivar Longken 3077 were crossed to generate the F1 generation. The F1 plants were grown in Harbin, Heilongjiang Province, China (approximately 45.75° N, 126.63° E) in 2022 and harvested in October of the same year. Subsequently, the F1 plants were self-pollinated to generate the F2 population. In 2023, the F2 population was cultivated again in Harbin for phenotypic evaluation. The experimental population was cultivated in the field under uniform agronomic conditions using a single-row plot layout. Each row was 2 m in length, with a plant spacing of 10 cm. Standard field practices, including thinning, weeding, and irrigation, were applied consistently. Plant height was measured at the maturity stage and defined as the distance from the cotyledonary node to the top of the main stem. Both parental lines were kindly provided by the Beidahuang Kenfeng Seed Industry Co., Ltd. (Harbin, China).
2.2. Phenotypic Identification
Kurtosis and skewness were used to describe the distribution characteristics of the plant height phenotypes in the parental lines and the F2 population. Kurtosis reflects the sharpness of the distribution peak or the heaviness of the tails. The specific calculation formula is as follows:
where xᵢ is the individual data point, is the mean of the dataset, and n is the number of data points.
Skewness reflects the asymmetry of the data distribution or the direction of deviation from the mean. The specific calculation formula is as follows:
where xᵢ is the individual data point, is the mean of the dataset, and n is the number of data points.
2.3. DNA Extraction
Genomic DNA was extracted using a modified CTAB method. The detailed protocol is provided in Supplementary Table S1. The DNA quality was assessed using two methods: (1) 1% agarose gel electrophoresis to check integrity; and (2) a NanoDrop spectrophotometer to evaluate purity. The DNA met the Illumina sequencing library preparation standards, with A260/A280 = 1.82 ± 0.03 and A260/A230 > 2.0.
2.4. Bulked Segregant Sequencing (BSA-Seq)
Based on the plant height phenotypes of the two parental lines (Heinong 63 and Longken 3077) and the F2 population, two parental pools and two extreme phenotype pools were constructed. Each parental pool consisted of leaf samples from 10 individuals of Heinong 63 and 10 individuals of Longken 3077. In the F2 population, 20 extremely tall and 20 extremely short individuals were selected to form two extreme phenotype pools.
To minimize environmental variation and eliminate border effects, phenotypic measurements and DNA sampling were conducted exclusively on plants located in the central rows of the field. All border rows were excluded from phenotypic evaluation. Individuals exhibiting extreme phenotypes were defined as those within the upper and lower 5% quantiles of plant height values in the F2 population.
The sampling procedure was as follows: during the full flowering stage, young leaves from the apex of each plant were collected, and genomic DNA was extracted using the CTAB method. The DNA concentration was measured, and equal amounts of DNA from each individual were mixed to construct the four DNA pools. All pooled samples were submitted to Biomarker Technologies (Beijing, China) for high-throughput sequencing.
Base calling was performed using the Illumina CASAVA 1.8 platform, and sequencing was conducted using a 150 bp paired-end strategy to ensure high data quality. The parental pools were sequenced at a depth of 10×, while the F2 phenotype pools were sequenced at a depth of 30× to ensure sufficient genome coverage and data reliability.
2.5. Sequencing Data Processing
During data processing, the raw sequencing reads were subjected to strict quality control and filtering to obtain high-quality, clean reads. Clean reads were aligned to the soybean reference genome (Wm82.a2.v1) using a BWA(v0.7.17) software package [15]. The alignment results were further analyzed using Picard(v2.27.1) [16] to evaluate the insert size distribution and assess the accuracy and completeness of the sequencing data.
Variant calling was performed using GATK(v4.2.0.0) [17] to detect SNPs, and SnpEff(v5.0) [18] was used for the annotation of small InDels. Low-confidence and low-quality SNP and InDel sites were filtered out prior to the downstream analysis.
An association analysis was carried out using the Euclidean distance (ED) algorithm [19] and the SNP-index (or InDel-index) algorithm [20]. To reduce background noise, the raw ED values were squared [19], and a DISTANCE-based fitting method was applied. A significance threshold was determined based on the median plus three times the standard deviation (median + 3×SD) of the fitted ED values [17].
2.6. SSR Marker Screening and Genotyping
Based on the newly published molecular markers by Song et al. [21] and the candidate interval identified through BSA analysis, 24 SSR loci within the preliminarily mapped region on chromosome 19 were selected. The primer sequences were obtained from SoyBase (https://soybase.org/) (accessed on 11 September 2024) and synthesized by the TsingKe Biological Technology Co., Ltd. (Beijing, China). Polymorphism between the two parental lines—Heinong 63 (paternal, tall-stem) and Longken 3077 (maternal, dwarf-stem)—was assessed using an 8% non-denaturing polyacrylamide gel electrophoresis (PAGE) system. In total, 10 SSR markers with stable and clear polymorphic bands were identified (Table 1).

Table 1.
Polymorphic molecular markers for fine mapping.
PCR amplification was conducted using gene-specific primers, with a reaction volume of 20 μL for the parental lines and 10 μL for the F2 population, following standard thermal cycling conditions. The selected 10 SSR primer pairs were used for genotyping 543 individual F2 plants from the Heinong 63 × Longken 3077 population.
2.7. QTL Mapping and Validation for Plant Height
To refine the BSA-identified candidate region, QTL mapping was performed using genotypic data from 10 polymorphic SSR markers and phenotypic data from 543 F2 individuals. These markers were selected from the set of 24 SSRs described above and were located within the 1.8 Mb interval on chromosome 19. Genotypic and phenotypic data were formatted according to the template requirements of QTL IciMapping software version 4.2. The inclusive composite interval mapping (ICIM) method [22] was applied to detect QTLs associated with plant height.
A threshold LOD value at the 95th percentile was determined by 1000 permutation tests, and this value was used as the significance cutoff. A QTL was considered significant when the observed LOD score exceeded the threshold in the actual analysis, indicating the presence of a putative QTL within the corresponding interval.
2.8. Development and Validation of InDel Markers
Based on the resequencing results of the parental lines within the mapped interval, an InDel variant was identified at position 48,052,853. The sequence containing the InDel site was downloaded from the Phytozome database (https://phytozome.jgi.doe.gov/pz/portal.html) (accessed on 15 September 2024), and primers flanking the InDel were designed using the NCBI Primer-BLAST tool (https://www.ncbi.nlm.nih.gov/tools/primer-blast/) (accessed on 15 September 2024) (Table 2).

Table 2.
Positions of the InDel markers, the primers, and the length of the amplified fragment.
A PCR was conducted in a 20 μL reaction system optimized for genotyping analysis. The amplification products were resolved using 6% denaturing polyacrylamide gel electrophoresis (PAGE).
2.9. Quantitative Real-Time PCR (qRT-PCR)
Total RNA was extracted from the shoot apical meristems of the two parental lines, Heinong 63 and Longken 3077, using the TRIzol reagent (Invitrogen, Carlsbad, CA, USA; Cat. No. 15596-026). For each genotype, three biological replicates were prepared, and each replicate consisted of pooled shoot apical meristems from three individual plants. To remove genomic DNA contamination, the extracted RNA was treated with DNase I (Vazyme, EN401, Nanjing, China) according to the manufacturer’s instructions. First-strand cDNA was synthesized from the extracted RNA using a reverse transcription kit (Vazyme, R312, Nanjing, China). The qRT-PCR was performed using SYBR qPCR Mix (Vazyme, Q711, Nanjing, China) on a LightCycler 480 II system (Roche Diagnostics, Basel, Switzerland).
The soybean Actin11 gene was used as the internal reference to normalize gene expression levels. Relative expression levels of the target genes were calculated using the 2^ΔCt method [23].
2.10. Functional Annotation and Candidate Gene Screening Within the Candidate Region
Based on the candidate region identified through the integration of the SNP and InDel association analyses, the functional annotation of genes within this region was performed. Gene sequences were aligned using BLAST against the NR [24], Swiss-Prot, GO [25], KEGG [26], and COG [27] databases to obtain comprehensive functional information. Candidate genes were subsequently screened by integrating the functional annotation results with gene expression level analysis.
2.11. Statistical Analysis
All statistical analyses were performed using Microsoft Excel 2016 and GraphPad Prism 8.0. Data are presented as the mean ± standard deviation (mean ± SD). The number of samples or biological replicates (n) is indicated in the corresponding figure legends. Statistical significance between two groups was determined using a two-tailed Student’s t-test.
3. Results
3.1. Phenotypic Analysis of Plant Height in Heinong 63, Longken 3077, and the F2 Segregating Population
The male parent Heinong 63 (HN63) exhibited a tall-stem phenotype, with an average plant height of 117.2 cm, while the female parent Longken 3077 (LK3077) displayed a dwarf-stem phenotype, with an average plant height of 81.0 cm. The difference between the two parents was highly significant (Figure 1A). HN63 had an average of 20.5 nodes on the main stem, whereas LK3077 had an average of 18.5 nodes, also showing a highly significant difference (Figure 1B). The average internode length of HN63 was 6.3 cm, compared to 5.5 cm in LK3077, indicating another highly significant difference (Figure 1C). These results suggest that the plant height difference between HN63 and LK3077 is caused by the combined effects of the node number and internode length.
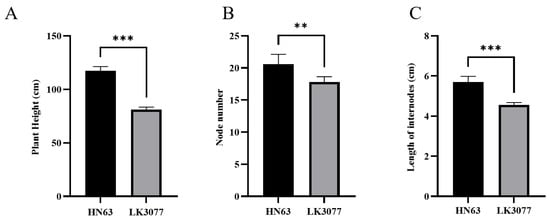
Figure 1.
Comparison of plant height, node number, and internode length between HN63 and LK3077. Comparison of plant height (A), number of nodes (B), and the length of internodes (C) between HN63 and LK3077; n = 5, *** represents p < 0.001, ** represents p < 0.01.
A total of 543 F2 individuals derived from the HN63 × LK3077 cross were phenotyped for plant height. Plant height ranged from 46.0 cm to 147.0 cm, with an average of 96.7 cm and a coefficient of variation (CV) of 16.7% (Table 3). The F2 population exhibited a continuous and wide distribution of plant height, with clear evidence of transgressive segregation. The kurtosis and skewness values were 3.1 and 0.8, respectively, indicating that this population is suitable for QTL mapping.

Table 3.
Statistical analysis of plant height phenotypes in parental and F2 populations.
3.2. Sequencing Data Analysis
3.2.1. Sequencing Data Quality Control
A total of 20 tall and 20 dwarf individuals from the F2 population were selected to construct two extreme phenotype pools, which were sequenced along with the two parental samples using the Illumina HiSeq platform for high-throughput whole-genome resequencing. After filtering the raw data, a total of 75.7 Gbp of clean bases was obtained, with Q30 scores exceeding 92.9%. The GC content ranged from 33.9% to 34.6%. The insert size distribution exhibited a unimodal normal distribution, indicating uniform library construction.
The mapping rate of the samples to the soybean reference genome reached 99.1%, with an average sequencing depth of 17× and a genome coverage of 97.4%, meaning that at least one base was covered in the vast majority of the genome. These quality control metrics demonstrate that the sequencing data were of high quality and suitable for subsequent variant detection and trait association analysis.
3.2.2. Association Analysis
After filtering the BSA sequencing data of the F2 population, a total of 636,540 high-quality SNPs and 123,698 InDel variants were obtained. To further investigate the association between these variants and the plant height trait, both the Euclidean distance (ED) algorithm and the index algorithm were applied. For each variant site, the ED values were calculated based on the allelic frequency differences and sequencing depth between the extreme phenotype pools, resulting in thresholds of 0.30 for SNPs and 0.25 for InDels. SNPs and InDels were analyzed for trait associations using the ED and index methods (Figure 2).
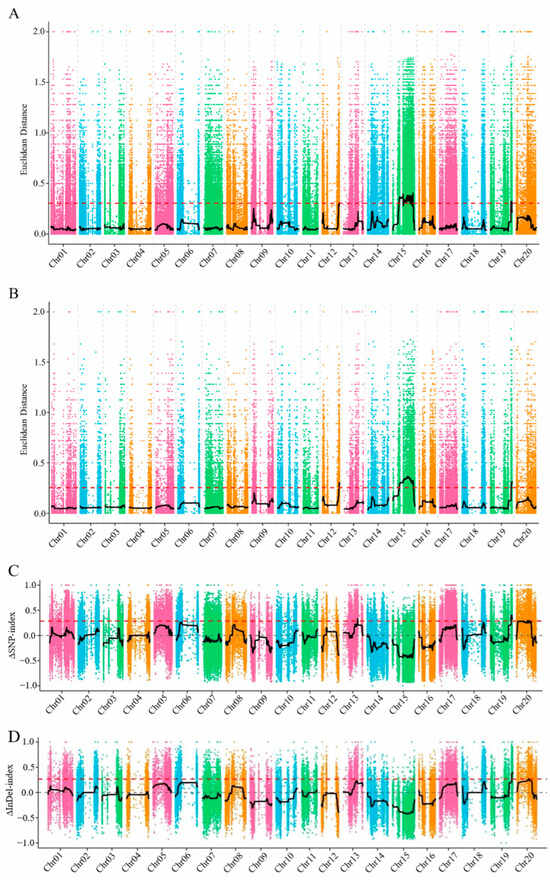
Figure 2.
ED and index correlation analysis of SNP/InDel. (A,B) in the figure show the ED correlation analysis results of SNP and InDel; (C,D) are the index correlation analysis results of SNP and InDel; the abscissa is the chromosome position, the vertical coordinate represents the ED or index value, the black line is the fitted ED or index association value, and the red dashed line represents the significance association threshold.
The SNP-based association analysis identified two candidate regions on chromosome 19, with a total length of 2.0 Mb. The InDel-based analysis identified a region of 2.6 Mb on the same chromosome. The intersection of the two methods revealed a single overlapping candidate region with a length of 1.8 Mb, containing 243 annotated genes (Table 4). The sequencing and association analysis results were visualized using Circos software (v0.69-9; http://circos.ca/) (accessed on 2 September 2024) to display variant distributions and BSA-based associations across the genome (Figure 3).

Table 4.
F2-population-associated region on chromosome 19 based on SNP/InDel analysis conducted using two methods.
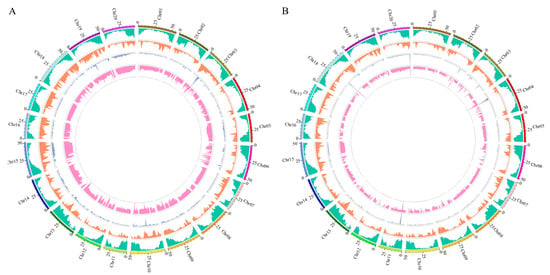
Figure 3.
Visual distribution of SNP (A) and InDel (B) results on chromosomes. From outside to inside, the first circle: chromosome coordinates; the second circle: gene distribution; the third circle: density distribution; the fourth circle: ED value distribution; the fifth circle: Δ index value distribution.
3.3. Fine Mapping of the PH19-31 Locus
Based on the BSA-Seq data and the new SSR markers published by Song et al. [21], 24 primer pairs were selected from the vicinity of the initially mapped 1.8 Mb interval. Polymorphism screening using the two parental lines identified 10 SSR primer pairs that produced clear and stable polymorphic bands (Table 1). These 10 SSR markers were then used for genotyping 543 individual plants from the F2 population for the linkage analysis (Figure 4).
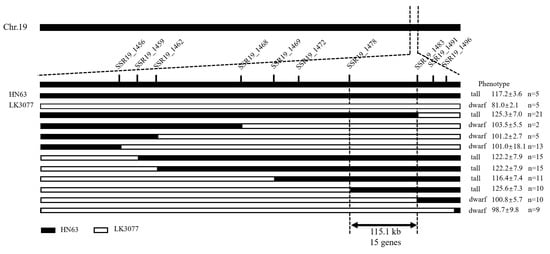
Figure 4.
Fine mapping of PH19-31 of the plant height gene in soybeans.
The results show that the original 1.8 Mb region was gradually narrowed down to the interval between markers BARCSOYSSR_19_1478 and BARCSOYSSR_19_1483, located at positions 47,986,062 bp and 48,101,240 bp, respectively. The final candidate interval spanned 115.1 kb, which was designated as PH19-31, and it contained a total of 15 annotated genes.
3.4. Validation of the Candidate Region and Linkage Marker Analysis
Based on the fine-mapping results, QTL analysis for plant height was performed using the genotypic data of 10 SSR markers and phenotypic data from the F2 population in QTL IciMapping 4.2. A single QTL associated with plant height was identified between markers SSR19_1478 and SSR19_1483, which overlapped with the previously defined fine-mapped interval. This QTL exhibited a LOD score of 3.83 and explained 4.01% of the phenotypic variation.
Further analysis of the genotypes and corresponding plant height phenotypes at the two flanking markers (Figure 5B,C) revealed the following: at the SSR19_1478 locus, 149 individuals carrying the Heinong 63 allele (A) had plant heights ranging from 104.0 to 143.0 cm, with an average of 121.7 cm. In contrast, 70 individuals with the Longken 3077 allele (B) showed plant heights ranging from 46.0 to 117.0 cm, with an average of 103.9 cm.
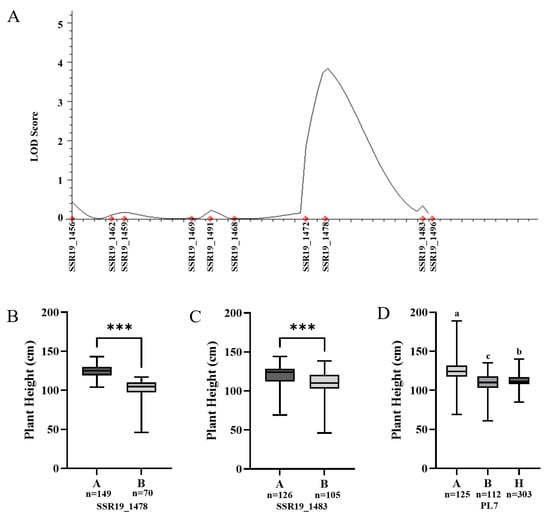
Figure 5.
Validation of the candidate region and analysis of linkage markers. (A) Mapping plant height QTL on chromosome 19 of the F2 population of HN63 × LK3077 soybean using 10 SSR markers. (B) Analysis of the association between the genotype and phenotype of SSR19_1478. (C) Analysis of the association between the genotype and phenotype of SSR19_1483. (D) Analysis of the genotype–phenotype correlation of marker PL7 in the F2 population. *** represents p < 0.001. “A”, ”B” and “H” represent the genotypes of HN63 (tall), LK3077 (dwarf) and heterozygous, respectively. The different lowercase letters in the figure indicate significant differences at the 5% level.
At the SSR19_1483 locus, 126 individuals with the Heinong 63 allele (A) exhibited plant heights between 69.0 and 144.0 cm, averaging 117.1 cm, whereas 105 individuals with the Longken 3077 allele (B) ranged from 46.0 to 138.0 cm, with an average of 115.4 cm. The differences in plant height between the different genotypes at both markers were highly significant, indicating that these markers are closely linked to the plant height trait.
3.5. Functional Validation and Genetic Association of the InDel Marker PL7
To improve the accuracy and practical utility of the mapping results, an InDel marker named PL7 was developed within the candidate region. PL7 is located within the gene Glyma.19G229400 and is positioned 66.7 kb and 48.3 kb away from the SSR markers BARCSOYSSR_19_1478 and BARCSOYSSR_19_1483, respectively.
Genotyping of the F2 population using PL7 revealed that 125 individuals carrying the HN63 (A) allele had an average plant height of 117.6 cm, whereas 112 individuals carrying the LK3077 (B) allele had an average plant height of 114.6 cm (Figure 5D). These results indicate that PL7 is tightly linked to the plant height trait and has potential for use in marker-assisted selection (MAS) in soybean breeding.
3.6. Verification of the Mapping Interval in the F2 Population
To further validate and refine the mapped interval, recombinant individuals in the F2 population were screened using the flanking SSR markers of the PH19-31 locus along with the InDel marker PL7. Based on phenotypic data, the PH19-31 interval was ultimately narrowed from the original 115.1 kb region between BARCSOYSSR_19_1478 and BARCSOYSSR_19_1483 to a smaller region of approximately 48.3 kb between PL7 and BARCSOYSSR_19_1483, which contains nine annotated genes (Figure 6).
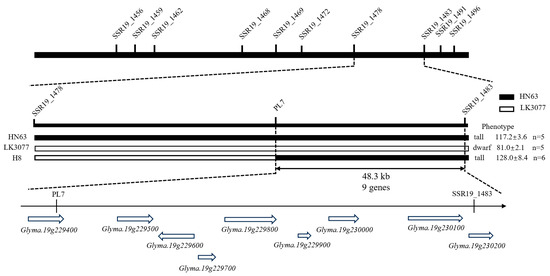
Figure 6.
Refinement and validation of the PL19-31 locus.
3.7. Functional Analysis of Genes Within the Mapped Interval
By conducting fine mapping, we identified a total of nine genes within the mapped interval, and their functional annotations are listed in Table 5. To further determine candidate genes, shoot apical meristem tissues from HN63 and LK3077 during the VC stage (when the first unifoliate leaves are fully expanded) under natural conditions were collected for an expression analysis of the genes within this region.

Table 5.
Gene and function predictions in location range.
The results show that two genes, Glyma.19G230000 and Glyma.19G230200, were identified as candidate genes based on their differential expression patterns between the two parental lines (Figure 7).
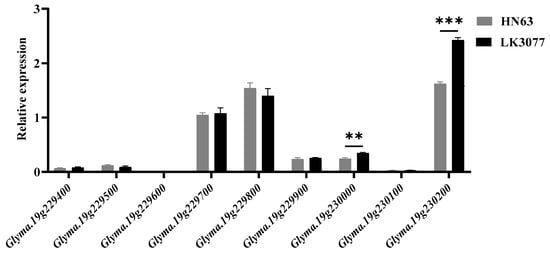
Figure 7.
Expression analysis of genes within the mapped interval in the stem apical meristems of HN63 and LK3077; n = 3; ** represents p < 0.01, *** represents p < 0.001. The expression trends were consistent across all biological replicates.
3.8. Protein Function Analysis of Candidate Genes
A protein function analysis was performed for two genes within the candidate interval associated with plant height.
The gene Glyma.19G230000 encodes a 3′-repair exonuclease that plays a key role in DNA damage repair and the maintenance of genome integrity. This gene is believed to play an important role in cell membrane formation, DNA repair, and stress response in plants. Its function is closely related to cell-cycle regulation during plant growth and development, thereby potentially affecting plant height [28].
Glyma.19G230200 encodes the protein phosphatase 2C (PP2C), a widely recognized regulatory protein involved in hormone signal transduction, responses to abiotic stress, and developmental processes. PP2C proteins may interact with auxin signaling components to modulate cell division and elongation, thus influencing plant height [29] (Table 6).

Table 6.
Candidate gene protein function annotation.
4. Discussion
4.1. Regulatory Genes and QTLs Associated with Plant Height in Soybeans
Plant height is one of the most important agronomic traits in soybeans, as it directly affects plant architecture, yield potential, lodging resistance, and harvesting efficiency. The genetic regulation of plant height is complex and involves multiple genes. Although numerous QTLs related to plant height have been identified, the underlying genetic mechanisms remain incompletely understood.
In previous studies, many QTLs associated with plant height have been reported, particularly on chromosome 19. For example, 11 QTLs were identified using a recombinant inbred line (RIL) population, 6 of which were located on chromosome 19, with the highest phenotypic variance explained (PVE) reaching 36% [30]. Further research revealed that the SNP marker Gm19_45000827 in this region was significantly associated with plant height, highlighting its core regulatory role [31]. In addition, whole-genome resequencing was used to narrow the major QTL qPH16 from 960 kb to 477.55 kb, and high-precision molecular markers were developed based on long-fragment InDels to support marker-assisted pyramiding breeding [32].
Two previously reported plant height QTLs (plant height 4–4 and plant height 5–10) were found to overlap with the interval identified in the present study. The lengths of these regions were 12.2 Mb and 2.0 Mb, respectively. Plant height 4–4 corresponds to the well-known Dt1 locus. Using RFLP markers, a major-effect QTL controlling plant height (Dt1) was identified in an F2 population derived from PI 97100 × Coker 237, accounting for 67.7% of the variation in plant height. Plant height 5–10 was identified in the Young × PI 416937 population and is located near marker K385 on linkage group L, explaining 6.6% of the phenotypic variation [5].
In this study, we identified a QTL locus PH19-31 located within a known QTL hotspot for plant height. This region was mapped using BSA-Seq based on tall and dwarf phenotype bulks constructed from the F2 population, in combination with the SNP/InDel-index and Euclidean distance (ED) methods. The final mapped interval, PH19-31, was located on chromosome 19 and spans only 48.3 kb, which is significantly narrower than previously reported QTL intervals. These results underscore the value of this region for dissecting the genetic basis of plant height and its potential application in molecular breeding.
4.2. Functions and Potential Biological Roles of Candidate Genes
In this study, two candidate genes for plant height, Glyma.19G230000 and Glyma.19G230200, were identified. Glyma.19G230000 is annotated as a polynucleotide adenylyltransferase, an enzyme involved in plant adaptation to biotic stimuli and environmental stress. It plays a critical role in RNA metabolism, particularly in RNA editing and degradation processes [28]. By regulating gene expression under adverse conditions, it may indirectly influence important agronomic traits such as plant height.
Glyma.19G230200 encodes a serine/threonine protein phosphatase (PPP), which regulates signaling pathways mediated by plant hormones such as jasmonic acid (JA) and salicylic acid (SA). This gene is known to play a key role in plant responses to pathogens, wounding, drought, and low-temperature stress. PPPs have been shown to negatively regulate JA signaling, thereby potentially influencing plant growth, development, and defense mechanisms [33]. Given its role in hormonal signal transduction, it is speculated that Glyma.19G230200 may affect plant height by modulating hormone pathways related to growth, such as those involving jasmonic acid or gibberellins (GA).
The expression analysis revealed that both candidate genes were significantly differentially expressed in the shoot apical meristems of the two parental lines, with markedly higher expression observed in the dwarf parent LK3077 compared with the tall parent HN63. The shoot apical meristem serves as a key site of active cell division and hormonal regulation. Genes preferentially expressed in this region are frequently involved in developmental processes such as meristem maintenance, internode elongation, and hormone-mediated growth responses [34].
The elevated expression of Glyma.19G230000 and Glyma.19G230200 in LK3077 may suggest their participation in regulatory pathways that modulate cell proliferation or hormonal balance, potentially involving GA, auxin (IAA), or JA signaling. This suggests a potential role in negatively regulating stem elongation. Previous studies have shown that genes that are highly expressed in the shoot apex are often closely associated with the cell division rate, cell wall remodeling, or hormone signaling [35].
Among the genes located within the fine-mapped interval, Glyma.19G230200 exhibited the most pronounced expression difference and had the highest overall expression level, making it the most likely key regulator of plant height. In plants, many genes related to the cell cycle, microtubule assembly, or cell elongation are specifically expressed at high levels in the shoot apical region [36,37]. Therefore, it is plausible that Glyma.19G230200 influences the internode length and overall plant height by regulating cell division activity in the meristem. Furthermore, it may also be involved in hormone-responsive pathways, particularly those related to gibberellin (GA) or auxin (IAA) signaling, thereby affecting stem growth [38,39].
4.3. Utility of InDel Markers in Molecular Breeding
Due to their high polymorphism and low development cost, InDel markers have been widely applied in QTL mapping, gene cloning, and marker-assisted selection (MAS) in crop breeding. A recent study conducted the de novo genome assembly of seven wild soybean accessions to construct a soybean pan-genome, and identified between 500,000 and 770,000 InDel variations between G. soja and G. max. Some of these InDels were located within functional genes, resulting in frameshift mutations and contributing to variations in traits such as disease resistance, plant architecture, maturity, and seed composition [40]. Over 93% of 70 selected InDel loci were validated by Sanger sequencing, confirming their potential application in soybean genetic diversity analysis and agronomic trait improvement.
InDel markers have also been used in the fine mapping of plant-height-related QTLs. Using whole-genome resequencing data in combination with a BSA strategy, one study successfully narrowed the major-effect QTL qPH16 to a 400 kb interval, thereby improving the mapping resolution [32]. Another study developed the InDel marker Gm16P763998, based on an 18 bp insertion in the candidate gene Glyma.16g076600, which is associated with pod shattering. This marker showed high concordance with the pod-shattering phenotype in two RIL populations and achieved a predictive accuracy of 95.8% to 100% in 120 soybean accessions, indicating strong stability and applicability [41].
Given the demonstrated importance and broad application of InDel markers in soybeans, we developed an InDel marker, PL7, within the plant height candidate interval. Based on a genotype–phenotype association analysis in the F2 population, the interval was further narrowed to 48.3 kb, and PL7 was found to be closely linked to the plant height trait. These results highlight its potential for use in marker-assisted selection to improve plant height in soybean breeding programs.
5. Conclusions
In this study, the plant height gene in soybeans was mapped to a 48.3 kb interval on chromosome 19 using BSA-Seq combined with map-based cloning. In total, nine genes were identified within this region. Based on an expression analysis that compared the two parental lines, Glyma.19G230000 and Glyma.19G230200 were identified as candidate genes associated with plant height. In addition, an InDel marker, PL7, was developed within this interval. These findings provide a foundation for further exploring the molecular regulatory mechanisms underlying plant height in soybean.
These findings demonstrate the effectiveness of integrating high-throughput sequencing with classical genetic mapping for narrowing QTL regions and identifying functional loci. The candidate genes and molecular markers identified in this study provide valuable resources for further investigation of the molecular mechanisms underlying plant height and for the development of high-yield, lodging-resistant soybean varieties. Future studies will focus on functional validation of the candidate genes and the exploration of their roles against different environmental and genetic backgrounds.
Supplementary Materials
The following supporting information can be downloaded at: https://www.mdpi.com/article/10.3390/agronomy15061316/s1, Table S1: Detailed Protocol of Genomic DNA Extraction.
Author Contributions
M.L.: investigation, methodology, software, visualization, data analysis, writing—original draft preparation, and writing—review and editing; X.S.: investigation, resources, methodology, and writing—review and editing; X.H.: investigation, resources, writing—original draft preparation, and writing—review and editing; X.Z.: formal analysis, visualization and writing—review and editing; Y.G.: funding acquisition, resources, writing—original draft preparation, and writing—review and editing; Z.L.: funding acquisition, supervision, validation, and writing—review and editing; J.X.: supervision, validation, and writing—review and editing; L.Q.: funding acquisition, methodology, project administration, writing—original draft preparation, and writing—review and editing. All authors have read and agreed to the published version of the manuscript.
Funding
This study was supported by the National Natural Science Foundation of China (32172005), the National Key Research and Development Program of China (2022YFD1201501), and the National Key R&D Program of China (2022YFE0203300).
Data Availability Statement
The original contributions presented in this study are included in the article. Further inquiries can be directed to the corresponding authors.
Conflicts of Interest
X.H. was employed by Beidahuang Kenfeng Seed Industry Co., Ltd. The remaining authors declare that the research was conducted in the absence of any commercial or financial relationships that could be construed as a potential conflict of interest.
References
- Dai, D.; Huang, L.; Zhang, X.; Zhang, S.; Yuan, Y.; Wu, G.; Hou, Y.; Yuan, X.; Chen, X.; Xue, C. Identification of a branch number locus in Soybean using BSA-Seq and GWAS approaches. Int. J. Mol. Sci. 2024, 25, 873. [Google Scholar] [CrossRef] [PubMed]
- Ye, S.; Yan, L.; Ma, X.; Chen, Y.; Wu, L.; Ma, T.; Zhao, L.; Yi, B.; Ma, C.; Tu, J.; et al. Combined BSA-Seq based mapping and RNA-Seq profiling reveal candidate genes associated with plant architecture in Brassica napus. Int. J. Mol. Sci. 2022, 23, 2472. [Google Scholar] [CrossRef] [PubMed]
- Huang, Z.; Wang, W.; Xu, X.; Li, J.; Lu, W. Relationship of dynamic plant height and its relative growth rate with yield using recombinant inbred lines of soybean. Acta Agron. Sin. 2011, 37, 559–562. [Google Scholar] [CrossRef]
- Qin, C.; Li, Y.H.; Li, D.; Zhang, X.; Kong, L.; Zhou, Y.; Lyu, X.; Ji, R.; Wei, X.; Cheng, Q.; et al. PH13 improves soybean shade traits and enhances yield for high-density planting at high latitudes. Nat. Commun. 2023, 14, 6813. [Google Scholar] [CrossRef]
- Lee, S.H.; Bailey, M.A.; Mian, M.a.R.; Carter, T.E., Jr.; Ashley, D.A.; Hussey, R.S.; Parrott, W.A.; Boerma, H.R. Molecular markers associated with soybean plant height, lodging, and maturity across locations. Crop Sci. 1996, 36, 728–735. [Google Scholar] [CrossRef]
- Kabelka, E.; Diers, B.; Fehr, W.; Leroy, A.; Baianu, I.; You, T.; Neece, D.; Nelson, R. Putative alleles for increased yield from soybean plant introductions. Crop Sci. 2004, 44, 784–791. [Google Scholar] [CrossRef]
- Wang, D.; Graef, G.; Procopiuk, A.; Diers, B. Identification of putative QTL that underlie yield in interspecific soybean backcross populations. Theor. Appl. Genet. 2004, 108, 458–467. [Google Scholar] [CrossRef]
- Chen, Q.S.; Zhang, Z.C.; Liu, C.Y.; Xin, D.W.; Shan, D.P.; Qiu, H.M. QTL Analysis of main agronomic traits in soybean. Sci. Agric. Sin. 2007, 40, 41–47. [Google Scholar]
- Su, J.; Zhang, H.; Yang, Y.; Wang, S.; Zhang, X.; Zeng, J.; Zhang, F.; Ding, L.; Jiang, J.; Fang, W.; et al. BSA-seq identified candidate genes and diagnostic KASP markers for anemone type flower in chrysanthemum. Sci. Hortic. 2024, 327, 112790. [Google Scholar] [CrossRef]
- Takagi, H.; Tamiru, M.; Abe, A.; Yoshida, K.; Uemura, A.; Yaegashi, H.; Obara, T.; Oikawa, K.; Utsushi, H.; Kanzaki, E.; et al. MutMap accelerates breeding of a salt-tolerant rice cultivar. Nat. Biotechnol. 2015, 33, 445–449. [Google Scholar] [CrossRef]
- Li, C.; Huang, L.; Huang, Y.; Kuang, M.; Wu, Y.; Ma, Z.; Fu, X. Fine mapping of a major QTL controlling plant height by BSA-seq and transcriptome sequencing in cotton. Theor. Appl. Genet. 2024, 137, 217. [Google Scholar] [CrossRef] [PubMed]
- Yu, T.; Lei, Y.; Lu, H.F.; Zhang, B.; Li, Y.F.; Chen, L.; Ge, T.L.; Liu, Y.L.; Han, J.N.; Li, Y.H. QTL analysis for plant height and fine mapping of two environmentally stable QTLs with major effects in soybean. J. Integr. Agric. 2022, 21, 933–946. [Google Scholar]
- Sun, H.; Zhang, J.; Zhao, T.; Gai, J. Association analysis between submergence tolerance and SSR markers in domestic and foreign soybean cultivars in Asia. Acta Agron. Sin. 2010, 36, 1615–1623. [Google Scholar]
- Zhang, J.; Zhao, T.; Gai, J. Association analysis of agronomic trait QTLs with SSR markers in released soybean cultivars. Acta Agron. Sin. 2008, 34, 2059–2069. [Google Scholar] [CrossRef]
- Li, H.; Durbin, R. Fast and accurate short read alignment with Burrows-Wheeler transform. Bioinformatics 2009, 25, 1754–1760. [Google Scholar] [CrossRef]
- SourceForge. Picard; SourceForge: San Diego, CA, USA, 2015; Available online: http://sourceforge.net/projects/picard/ (accessed on 1 September 2024).
- Mckenna, A.; Hanna, M.; Banks, E.; Sivachenko, A.; Cibulskis, K.; Kernytsky, A.; Garimella, K.; Altshuler, D.; Gabriel, S.; Daly, M.; et al. The genome analysis toolkit: A MapReduce framework for analyzing next generation DNA sequencing data. Genome Res. 2010, 20, 1297–1303. [Google Scholar] [CrossRef]
- Cingolani, P.; Platts, A.; Wang Le, L.; Coon, M.; Nguyen, T.; Wang, L.; Land, S.J.; Lu, X.; Ruden, D.M. A program for annotating and predicting the effects of single nucleotide polymorphisms, SnpEff: SNPs in the genome of Drosophila melanogaster strain w1118; iso-2; iso-3. Fly 2012, 6, 80–92. [Google Scholar] [CrossRef]
- Hill, J.T.; Demarest, B.L.; Bisgrove, B.W.; Gorsi, B.; Su, Y.C.; Yost, H.J. MMAPPR: Mutation mapping analysis pipeline for pooled RNA-seq. Genome Res. 2013, 23, 687–697. [Google Scholar] [CrossRef]
- Fekih, R.; Takagi, H.; Tamiru, M.; Abe, A.; Natsume, S.; Yaegashi, H.; Sharma, S.; Sharma, S.; Kanzaki, H.; Matsumura, H.; et al. MutMap+: Genetic mapping and mutant identification without crossing in rice. PLoS ONE 2013, 8, e68529. [Google Scholar] [CrossRef]
- Song, Q.; Jia, G.; Zhu, Y.; Grant, D.; Nelson, R.T.; Hwang, E.Y.; Hyten, D.L.; Cregan, P.B. Abundance of SSR motifs and development of candidate polymorphic SSR markers (BARCSOYSSR_1. 0) in soybean. Crop Sci. 2010, 50, 1950–1960. [Google Scholar] [CrossRef]
- Meng, L.; Li, H.; Zhang, L.; Wang, J. QTL IciMapping: Integrated software for genetic linkage map construction and quantitative trait locus mapping in biparental populations. Crop J. 2015, 3, 269–283. [Google Scholar] [CrossRef]
- Li, R.; Jiang, H.; Zhang, Z.; Zhao, Y.; Xie, J.; Wang, Q.; Zheng, H.; Hou, L.; Xiong, X.; Xin, D.; et al. Combined linkage mapping and BSA to identify QTL and candidate genes for plant height and the number of nodes on the main stem in soybean. Int. J. Mol. Sci. 2019, 21, 42. [Google Scholar] [CrossRef] [PubMed]
- Deng, Y. Integrated nr database in protein annotation system and its localization. Comput. Eng. 2006, 32, 71. [Google Scholar]
- Ashburner, M.; Ball, C.A.; Blake, J.A.; Botstein, D.; Butler, H.; Cherry, J.M.; Davis, A.P.; Dolinski, K.; Dwight, S.S.; Eppig, J.T. Gene ontology: Tool for the unification of biology. Nat. Genet. 2000, 25, 25–29. [Google Scholar] [CrossRef]
- Kanehisa, M.; Goto, S.; Kawashima, S.; Okuno, Y.; Hattori, M. The KEGG resource for deciphering the genome. Nucleic Acids Res. 2004, 32, D277–D280. [Google Scholar] [CrossRef]
- Tatusov, R.L.; Galperin, M.Y.; Natale, D.A.; Koonin, E.V. The COG database: A tool for genome-scale analysis of protein functions and evolution. Nucleic Acids Res. 2000, 28, 33–36. [Google Scholar] [CrossRef]
- Khatir, Z.; Thabet, S.G.; Alqahtani, M.D.; Schierenbeck, M.; Sehmisch, S.; Lantos, E.; Krebes, C.; Börner, A.; Alqudah, A.M. Discovery of new genomic regions and candidate genes implicated in the natural variation of barley peduncle length and plant height. Genet. Resour. Crop Evol. 2024, 72, 1741–1752. [Google Scholar] [CrossRef]
- Máthé, C.; Garda, T.; Freytag, C.; M-Hamvas, M. The role of serine-threonine protein phosphatase PP2A in plant oxidative stress signaling—Facts and hypotheses. Int. J. Mol. Sci. 2019, 20, 3028. [Google Scholar] [CrossRef]
- Orf, J.; Chase, K.; Jarvik, T.; Mansur, L.; Cregan, P.; Adler, F.; Lark, K. Genetics of soybean agronomic traits: I. Comparison of three related recombinant inbred populations. Crop Sci. 1999, 39, 1642–1651. [Google Scholar] [CrossRef]
- Zhang, J.; Song, Q.; Cregan, P.B.; Nelson, R.L.; Wang, X.; Wu, J.; Jiang, G.L. Genome-wide association study for flowering time, maturity dates and plant height in early maturing soybean (Glycine max) germplasm. BMC Genomics 2015, 16, 1–11. [Google Scholar] [CrossRef]
- Chen, L.; Yu, T.; Liu, Z.X.; Gu, Y.Z.; Zhang, B.; Li, Y.H.; Jie, N.; Qiu, L.J. Identification and characterization of long-InDels through whole genome resequencing to facilitate fine-mapping of a QTL for plant height in soybean (Glycine max L. Merr.). J. Integr. Agric. 2022, 21, 1903–1912. [Google Scholar]
- Bajsa, J.; Pan, Z.; Duke, S.O. Serine/threonine protein phosphatases: Multi-purpose enzymes in control of defense mechanisms. Plant Signal. Behav. 2011, 6, 1921–1925. [Google Scholar] [CrossRef] [PubMed][Green Version]
- Zhang, T.; Chen, Y.; Wang, J. A single-cell analysis of the Arabidopsis vegetative shoot apex. Dev. Cell 2021, 56, 1056–1074. [Google Scholar] [CrossRef] [PubMed]
- Murray, J.A.; Jones, A.; Godin, C.; Traas, J. Systems analysis of shoot apical meristem growth and development: Integrating hormonal and mechanical signaling. Plant Cell 2012, 24, 3907–3919. [Google Scholar] [CrossRef]
- Xu, H.; Cao, D.; Chen, Y.; Wei, D.; Wang, Y.; Stevenson, R.A.; Zhu, Y.; Lin, J. Gene expression and proteomic analysis of shoot apical meristem transition from dormancy to activation in Cunninghamia lanceolata (Lamb.) Hook. Sci. Rep. 2016, 6, 19938. [Google Scholar] [CrossRef]
- Armezzani, A.; Abad, U.; Ali, O.; Andres Robin, A.; Vachez, L.; Larrieu, A.; Mellerowicz, E.J.; Taconnat, L.; Battu, V.; Stanislas, T.; et al. Transcriptional induction of cell wall remodelling genes is coupled to microtubule-driven growth isotropy at the shoot apex in Arabidopsis. Development 2018, 145, dev162255. [Google Scholar] [CrossRef]
- Babaei, S.; Singh, M.B.; Bhalla, P.L. Circular RNAs modulate the floral fate acquisition in soybean shoot apical meristem. BMC Plant Biol. 2023, 23, 322. [Google Scholar] [CrossRef]
- Haerizadeh, F.; Wong, C.E.; Singh, M.B.; Bhalla, P.L. Genome-wide analysis of gene expression in soybean shoot apical meristem. Plant Mol. Biol. 2009, 69, 711–727. [Google Scholar] [CrossRef]
- Li, Y.H.; Zhou, G.; Ma, J.; Jiang, W.; Jin, L.G.; Zhang, Z.; Guo, Y.; Zhang, J.; Sui, Y.; Zheng, L. De novo assembly of soybean wild relatives for pan-genome analysis of diversity and agronomic traits. Nat. Biotechnol. 2014, 32, 1045–1052. [Google Scholar] [CrossRef]
- Seo, J.H.; Dhungana, S.K.; Kang, B.K.; Baek, I.Y.; Sung, J.S.; Ko, J.Y.; Jung, C.S.; Kim, K.S.; Jun, T.H. Development and validation of SNP and InDel markers for pod-shattering tolerance in soybean. Int. J. Mol. Sci. 2022, 23, 2382. [Google Scholar] [CrossRef]
Disclaimer/Publisher’s Note: The statements, opinions and data contained in all publications are solely those of the individual author(s) and contributor(s) and not of MDPI and/or the editor(s). MDPI and/or the editor(s) disclaim responsibility for any injury to people or property resulting from any ideas, methods, instructions or products referred to in the content. |
© 2025 by the authors. Licensee MDPI, Basel, Switzerland. This article is an open access article distributed under the terms and conditions of the Creative Commons Attribution (CC BY) license (https://creativecommons.org/licenses/by/4.0/).